

Translate this page into:
Paper test strip for silver ions detection in drinking water samples based on combined fluorometric and colorimetric methods
⁎Corresponding authors. sxzhou@hbuas.edu.cn (Shuxing Zhou), guangzhi.hu@umu.se (Guangzhi Hu), yueqiaoli@lcu.edu.cn (Qiaoli Yue)
-
Received: ,
Accepted: ,
This article was originally published by Elsevier and was migrated to Scientific Scholar after the change of Publisher.
Peer review under responsibility of King Saud University.
Abstract
In this study, a portable silver ion (Ag+) sensor was fabricated based on a dual signal output system using black phosphorus quantum dots (BPQDs) as probes. It is the first work for Ag+ detection using paper test strip based on BPQDs. The color change of BPQDs paper sensor for the determination of Ag+ was easily identified by naked eye. BPQDs were synthesized from bulk black phosphorus (BP) by mechanical exfoliation combined with a solvothermal method. BPQDs exhibited blue fluorescence with a quantum yield of 8.82 %. The fluorescence of BPQDs can be quenched by Ag+, and the absorbance of BPQDs is increased with increasing Ag+ concentration. The mechanism of the interaction between BPQDs and Ag+ involving fluorescence quenching and bonding was investigated by experimental and computational methods. The detection limit of Ag+ was 1.56 μg/mL and 0.19 μg/mL using fluorometry and colorimetry methods, respectively. A portable visual sensor based on paper test strip was constructed for Ag+ detection using the colorimetric approach. The strategy was employed to determine Ag+ successfully in drinking water samples. Therefore, the proposed portable Ag+ sensor can be potentially utilized for the lab-free analysis of drinking water and even dietary samples.
Keywords
Silver ion
Black phosphorus quantum dots
Dual-signal-output system
Drinking water samples

1 Introduction
Silver (Ag) is a natural heavy metal, which is widely used in various fields such as chemistry, chemical engineering, photography, jewelry, medicine, and electronics (Chun et al., 2010, Rasheed et al., 2018). Owing to the extensive use of Ag metal and Ag-based compounds in industry and daily life, the discharge of silver ion (Ag+)-containing waste into the environment acutely pollutes water, soil, and food (Liu et al., 2022). Ag+-based ion-exchange reaction and Ag nanoparticles also cause a long-term continuous leaching of Ag+ (Shoults-Wilson et al., 2011, Lin et al., 2016, Huang et al., 2020, Zhu et al., 2021). Ag+ can accumulate in the human body because Ag+ easily reacts with thiol, amino, and carboxyl groups of functional enzymes and forms Ag+-polynucleotide complexes with DNA (Choi et al., 2016), which severely disrupts biological systems (Gao et al., 2017). Therefore, it is necessary to develop a sensitive and portable analytical method for the accurate detection of Ag+.
Owing to the portability, simplicity, disposability and low cost, paper-based test strip is of great interest (Cunningham et al., 2016, Lin et al., 2017, Liu et al., 2020). Various methods can be carried out on paper pieces for applications in the determination of analytes such as electrochemistry (Ge et al., 2012, Wang et al., 2017, Yeon et al., 2022), electrochemiluminescence (Ge et al., 2012), chemiluminescence (Delaney et al., 2011), fluorescence (Zhang et al., 2016, Qiu et al., 2017, Lv et al., 2018) and colorimetry (Lei et al., 2015). Colorimetry is a facile, rapid and cost-effective method. Colorimetric paper test strips usually use copper (Cu), silver (Ag), gold (Au), nanopaticles as sensing probes. Different analytes can cause color change from red to yellow (Cu nanoparticles), yellow to red (Ag nanoparticles), and pink to blue (Au nanoparticles) (Zhang and Noguez 2008, Motl et al., 2014). The color change can be detected by spectrophotometer, camera and smart phone quantitatively and naked eye quanlitatively or semi-quantitatively (Chen et al., 2015, Shrivas et al., 2020, Patel et al., 2022). In fact, for the naked eye detection, the change from colorless to color is easier to identify than color change. It is better to find a kind of paper-based sensing system for Ag+ detection.
Black phosphorus (BP) has been stripped to two or three atomic layers in 2014 (Chen et al., 2020). As a result, BP has attracted significant attention from researchers due to its potential applications in photothermal agents (Sun et al., 2015), photodetectors (Youngblood et al., 2015), photocatalysts (Fan et al., 2022), organic photovoltaics (Liu et al., 2017), electrocatalysts (Jiang et al., 2016), storage media (Hu et al., 2018), and sensors (Gu et al., 2017, Li et al., 2017). BP quantum dots (BPQDs) derived from two-dimensional BP nanosheets exhibit larger bandgap and surface-to-volume ratio (Kumari et al., 2020). Importantly, BPQDs can coordinate with some metal ions via the lone electron pairs of P atoms and empty orbitals of metal ions (Jiang et al., 2020). It represents a promising strategy to avoid the reaction of BPQDs with water and oxygen. BPQDs have been widely applied in bioimaging, cancer therapy, intelligent electronic elements, optoelectronics, and fluorescence sensing (Gui et al., 2018). For sensing, BPQDs-TPPS system was used for the detection of Hg2+ in the assistant of Mn2+, with the limit of detection (LOD) at 0.39 nM (Gu et al., 2017). Similarly, Cu2+ and Hg2+ were detected using BPQDs with the LOD at 1.6 μM and 5.3 nM, respectively (Kresse and Furthmüller 1996). In our previous work, BPQDs were employed for the measurement of pH (Yue et al., 2019). BPQDs were also used for colorimetric detection of biothiols (Ren et al., 2020). However, all of the above systems were used in aqueous media rather than strictly portable sensors.
In this work, a paper test strip system for Ag+ sensing based on BPQDs was constructed. BPQDs were prepared by combining mechanical exfoliation and solvothermal methods and exhibited bright blue fluorescence with a quantum yield (QY) of 8.82 %. The fluorescence of BPQDs can be effectively quenched by Ag+ in a static quenching mode to form non-fluorescence complexes. Simultaneously, the colorless BPQDs solution turned yellowish-brown gradually with the concentration increase of Ag+. A dual-channel of fluorometry and colorimetry was employed to detect Ag+ using BPQDs as probes. Moreover, a portable paper-based Ag+ sensor was constructed by depositing BPQDs onto filter paper using colorimetric channel. In the presence of Ag+, the paper test strip based on BPQDs can be detected easily by naked eye from colorless to yellowish-brown. The preparation of BPQDs and assay procedure of Ag+ are illustrated in Scheme 1.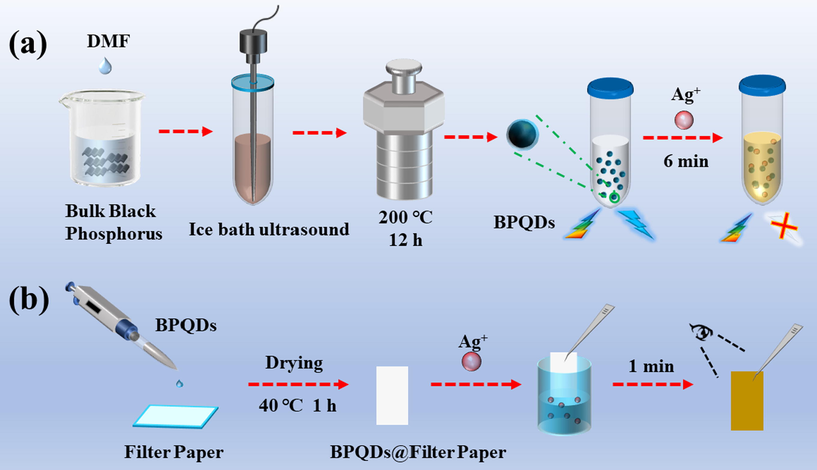
Schematic illustration of the synthesis of BPQDs (a) and BPQDs@filter paper (b) and their application in Ag+ detection.
2 Experimental section
2.1 Characterization methods
BP crystals were first disrupted by ultrasound using an ultrasonic cell disruptor (BILON92-IIL, Shanghai Bilang Instrument Co., ltd., China) with ice bath and then heated in an electric blast drying oven (GZX-9140MBE, Shanghai Boxun Industrial Co., ltd., Medical equipment factory). The resulting BPQDs were suspended on a copper grid, and the transmission electron microscopy (TEM) images were obtained by a JEM 2100 transmission electron microscope (JEOL Co., ltd., Japan) at an accelerating voltage of 200 kV. Scanning electron microscopy (SEM) and energy dispersive X-ray spectroscopy (EDS) measurements were performed on a Thermo Fisher Scientific FIB-SEM GX4 instrument (Thermo Scientific ltd., USA). Ultraviolet–visible (UV–vis) absorption and fluorescence spectra of BPQDs were recorded by LUH4150 UV–Vis and F-7100 spectrophotometers (Hitachi, Japan), respectively. Photographs were taken with a Coolpix 4500 digital camera (Nikon, Japan). Fourier transform infrared (FT-IR) spectra were recorded on a Nicolet 6700 spectrometer (Thermo Scientific ltd., USA). Chemical bonding states of BPQDs elements were determined by K-Alpha X-ray photoelectron spectroscopy (XPS) (Thermo Scientific ltd., USA). X-ray diffraction (XRD) patterns of BPQDs products were obtained by an AD/Max-2500 diffractometer (Rigaku, Japan). The viscosity of BPQDs solution was measured using a microscopic visual rheometer (Antonpa Group, Austria).
2.2 Chemicals and materials
BP crystal powder was purchased from Nanjing XFNANO, Inc. (Nanjing, China). AgNO3, Ca(NO3)2, Fe(NO3)3, Co(NO3)2, ZnSO4, Mg(NO3)2, BaCl2, Ni(NO3)2, HgCl2, Pb(NO3)2, CrCl3, Al2(SO4)3, ZrCl4, Ba(NO3)2, HNO3, and NaOH were ordered from Aladdin Reagent Co., ltd. (Shanghai, China). Quinine sulfate (QS) was obtained from Fluka (Buchs, Switzerland). All chemicals procured from commercial sources were analytical reagents, which were used directly without specific illustration. A Milli-Q water purification system was utilized to prepare ultrapure water for all solutions.
2.3 Preparation of BPQDs
A method for BPQDs synthesis reported in the literature was used for reference (Fan et al., 2022) with some modifications. Briefly, bulk BP (9 mg) was added in dimethylformamide (DMF) (25 mL) and ultrasonically broken in an ice bath at a power of 65 % for 2 h. The obtained suspension was transferred to an autoclave and heated at 200 °C for 12 h. After cooling to room temperature, the solution was centrifuged at 6000 rpm for 10 min. The supernatant was separated with a 0.22-μm filter. BPQDs products were dispersed in DMF. To obtain the concentration of BPQDs, the reduced pressure distillation was carried out at 80 °C. Then BPQDs solid products were obtained, which were stored at 4 °C.
2.4 Preparation of paper test strips
Paper test strips were prepared with filter paper on glass plates. Firstly, the filter paper was cut into 1 × 1 cm2 small pieces. Secondly, 20 μL BPQDs was added dropwise to each piece. Then the filter paper pieces were allowed to dry in a vacuum drying oven at 40 °C for 1 h. After drying, the obtained BPQDs@filter paper was cut into strips with appropriate size for later use, which was stored at 4 °C after sealing.
2.5 Fluorometric and colorimetric detection of Ag+
Before the determination of Ag+ the experimental conditions were optimized. Herein, the colorimetric system was chosen as the representative for the condition optimization. First, the acidity of system was investigated using 0.1 M NaOH and 0.1 M HNO3 solutions to adjust pH. Briefly, after adjusting pH, 200 μL BPQDs (0.34 mg/mL) solution was mixed with 2 μL Ag+ (6.37 mg/mL) solution and diluted to 500 μL. After the solutions with pH 5–13 were incubated for 6 min, the absorbance was measured, respectively. Second, the incubation time for Ag+ detection was also tested. After titration of Ag+ (13.59 μg/mL) in BPQDs solution, the absorbance of BPQDs is recorded every 2 min until it reaches a plateau.
BPQDs can be used to detect Ag+ at pH 9. First, a series of Ag+ standard solutions were prepared. 200 μL BPQDs solution (0.34 mg/mL) was mixed with 2 μL Ag+ solution and diluted to 500 μL. The solutions were tested after 6 min incubation. The fluorescence intensity or absorbance of BPQDs was recorded in the presence and absence of Ag+.
During the detection of Ag+ with the portable test strip, BPQDs@filter paper was picked up by tweezers and immersed briefly into a solution containing Ag+. The paper test strip was taken out from solution and kept in air for 1 min.
2.6 QY measurements
To obtain the QY of BPQDs, QS was used as a reference reagent during measurements. Absorbance (A) (365 nm) and fluorescence intensity (λex/λem = 365/434 nm) of QS and BPQDs were measured with A values less than 0.05. The following equation was utilized for QY calculation: QBPQDs = QQS(mBPQDs/mQS)(ηBPQDs/ηQS)2 (1), where Q, m, and η represented QY, the slope, and the refractive index, respectively. According to the equation, the QY of BPQDs (QBPQDs) can be calculated with the QY of QS at 0.54.
2.7 Calculation method
First-principle calculations in this study were performed by a pseudo-potential plane-wave method using the Vienna Ab initio Simulation Package (VASP) (Kresse and Furthmüller 1996). To investigate Ag adsorption, BPQDs were modeled using a 3 × 3 supercell with a single layer containing a total of 36 P atoms. A 3 × 2 × 1 k-point sampling based on Gamma-centered Monkhorst–Pack scheme was conducted, and a vacuum layer with a thickness of 20 Å was added along the z-direction to avoid interactions between periodically repeated structures. The generalized gradient approximation (GGA) with the Perdew − Burke − Ernzerhof (PBE) functional (John et al., 1996) was employed to describe electron exchange–correlation interactions. A conjugate gradient algorithm was utilized for geometry optimizations with a force convergence criterion of 0.02 eV/Å.
2.8 Preparation of real samples
Real samples were tested by measuring Ag+ contents in mineral water and fruit water. The drinking water samples used in this experiment were purchased from local supermarket. They included Chun Yue ⋅ Fruit Water (Coca-Cola China) and Changbai Snow ⋅ Mineral Water (Nongfu Spring). All measurements were performed directly without pretreatment.
3 Results and discussion
3.1 Characterization of BPQDs
The particle size distribution of BPQDs was confirmed by TEM. As shown in Fig. 1a, BPQDs are uniformly dispersed without aggregation, and their average particle size is 1.7 ± 0.4 nm, which is larger than those of BPQDs synthesized by other methods (Ren et al., 2020, Fan et al., 2022). Fig. 1b displays the TEM image of BPQDs + Ag+ with apparent aggregates, suggesting that BPQDs and Ag+ form new complexes.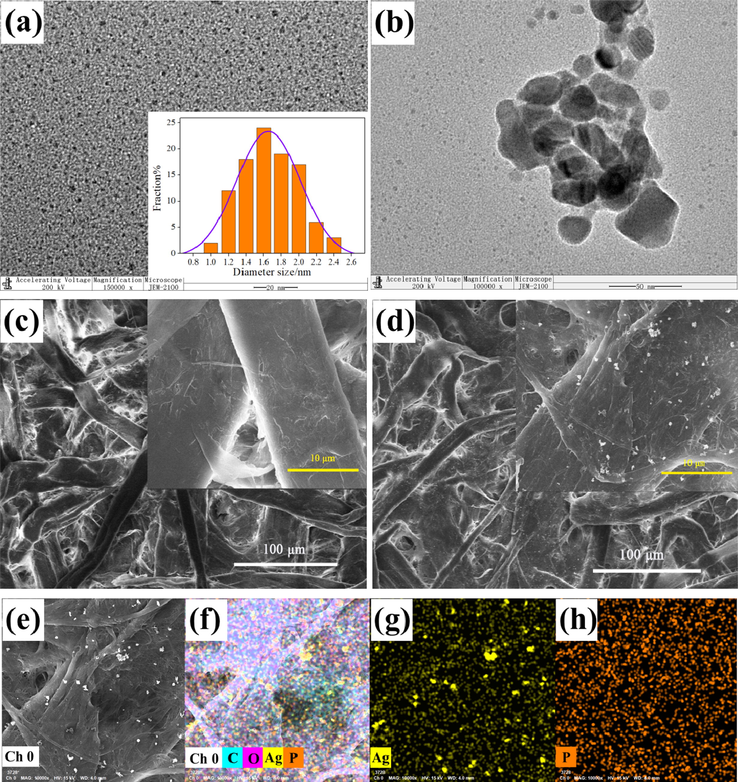
TEM image of BPQDs (inset: particle size distribution) (a) and BPQDs + Ag+ (b), SEM images of BPQDs@filter paper (c) and BPQDs@filter paper + Ag+ (d), EDS images of BPQDs@filter paper + Ag+ (e–h).
The SEM observations of BPQDs@filter paper were performed with and without Ag+. The microscopic surface images of BPQDs@filter paper and BPQDs@filter paper + Ag+ are presented in Fig. 1c and d, respectively. The EDS analysis of BPQDs was also conducted. It can be observed that BPQDs are evenly distributed on the filter paper (Fig. 1e–h). The EDS images of BPQDs@filter paper + Ag+ show grape-like particles due to the reaction between BPQDs and Ag+.
The obtained FT–IR spectra (Fig. 2a) clearly identify the chemical bonds of BPQDs with and without Ag+. In general, most characteristic peaks of BPQDs and BPQDs + Ag+ are identical. The absorption peaks at 3425 and 1470 cm−1 are attributed to N—H bonds and those at 2926 and 2851 cm−1 are caused by –CH3 species. The peaks at 1717 and 1660 cm−1 originate from C⚌O bonds and those at 1470 and 1391 cm−1 represent –CH3 and –CH2– functional groups, respectively. Therefore, in the synthesis process of BPQDs, DMF acts as not only a solvent, but also a carbon source. The absorption peak at 1170 cm−1 is likely caused by P⚌O species, and the peak at 1061 cm−1 is from (δ) P—H bonds (Xu et al., 2020). After Ag+ addition, three new absorption peaks appear including (m) P—H phosphine at 2362 cm−1, (υ) P–OH from O⚌P–OH at 2332 cm−1 (Xu et al., 2020), and the P–Ag bond at 676 cm−1(Jiang et al., 2020, Xu et al., 2020).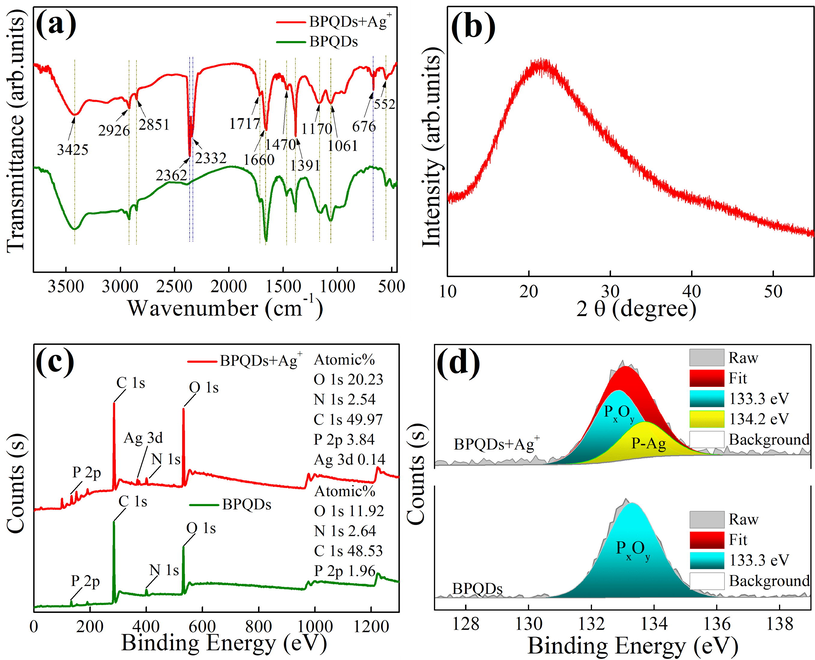
FT–IR (a) profiles of BPQDs + Ag+ and BPQDs, XRD (b) spectrum of BPQDs, and XPS (c, d) profiles of BPQDs + Ag+ and BPQDs.
According to the XRD spectra (Fig. 2b), there is no characteristic peaks inducing that BPQDs possess amorphous structure. To confirm the elemental composition and surface states, XPS studies were conducted (Fig. 2c and d). Fig. 2c shows the general survey scans for BPQDs and BPQDs + Ag+. The atomic contents of BPQDs are O 1 s: 11.92 %, N 1 s: 2.64 %, C 1 s: 48.53 %, and P 2p: 1.96 %, respectively. The atomic contents of BPQDs + Ag+ are O 1 s: 20.23 %, N 1 s: 2.54 %, C 1 s: 49.97 %, P 2p: 3.84 %, and Ag 3d: 0.14 %, respectively. The atomic ratio of O 1 s and P 2p increases by a factor of two for BPQDs + Ag+ due to the formation of PxOy species catalyzed by Ag+ (see the characteristic peak at 133.3 eV in Fig. 2d) (Wang et al., 2020). A new peak for BPQDs + Ag+ at 134.2 eV is ascribed from P–Ag bond (Fig. 2d).
The UV–Vis absorption and fluorescence spectra of BPQDs are shown in Fig. 3a. There are two peaks at 260 and 350 nm in the absorption spectrum. The maximum excitation and emission wavelength are 365 nm and 434 nm, respectively. The inset of Fig. 3a shows the photograph of BPQDs under indoor and UV light. BPQDs display colorless in the day light, while they exhibit blue fluorescence under the UV lamp (365 nm). In addition, the emission spectra of BPQDs can be obtained with different excitation wavelengths. With an increase in the excitation wavelength, the position of the emission peak undergoes a slight red shift, while its intensity first gradually increases and then gradually decreases (Fig. 3b). As a result, the maximum excitation wavelength is 365 nm. The results of QY measurement are presented in Fig. 3c, and the relative QY was calculated according to equation (1) at 8.82 %. At room temperature (25 °C), the steady-state viscosity of BPQDs solution was measured. It can be seen from Fig. S1 (in Supplementary Information) that when the shear rate is infinitely close to 0, the viscosity of BPQDs solution is about 2.5 mPa·s and is similar to that of water (2.98 mPa·s). In addition, the obtained BPQDs solid products were brown and showed bright blue fluorescence under ultraviolet light.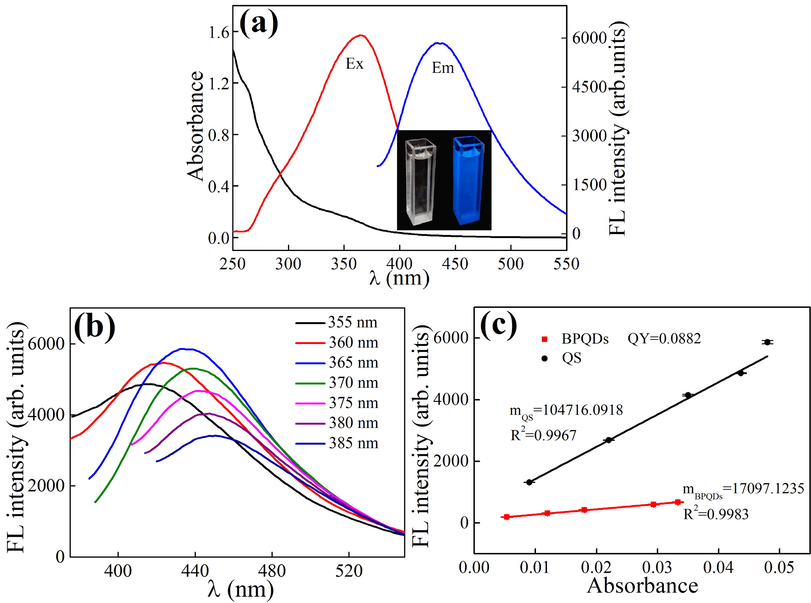
Absorption, excitation, and emission spectra of BPQDs (inset: photograph of BPQDs obtained under sunlight and UV light) (a), effect of excitation wavelength on the fluorescence spectra of BPQDs in solution (b), QY values of BPQDs obtained using a QS standard (c).
In general, the fluorescence spectrum and intensity of one fluorophore can vary in different solvents. The effect of solvent on the fluorescence of BPQDs was investigated. As shown in Fig. S2a (in Supplementary Information), the maximum λex of BPQDs in different solvents is between 361 nm and 371 nm, and the maximum λem is between 440 nm and 455 nm. When the λex is fixed at 365 nm, the fluorescence intensity of BPQDs is highest in DMF and lowest in DMSO (Fig. S2b, in Supplementary Information). In the mixture of DMF with one other solvent (volume ratio, 1:1), BPQDs show similar fluorescence (Fig. S2c, in Supplementary Information).
3.2 Optimization of sensing conditions
Acidity of the solution and reaction time are two important parameters for the detection of Ag+. Following the steps of Section 2.5, the absorbance can be obtained under different pH values (Fig. S3a, in Supplementary Information). The absorbance gets to the maximum with pH 8–9 and it decreases in an acidic or strong base environment. The possible mechanism may be that when pH is greater than 9, Ag+ first reacts with excess OH– leading to the amount of free Ag+ decrease and inducing the decrease of absorbance for BPQDs + Ag+. To eliminate the solvent effect, the pH of DMF solution was adjusted after the same treatment with the results presented in Fig. S3a (in Supplementary Information). Regardless of the pH adjustment, the treated DMF was incapable of detecting Ag+. Thus, it is not possible to directly detect Ag+ in DMF solution. The results of response time for Ag+ are illustrated in Fig. S3b (in Supplementary Information). There is almost no change in the absorbance value observed after 6 min of reaction, indicating that the incubation time of BPQDs and Ag+ is 6 min.
3.3 Selectivity
Before the selectivity study, different systems were tested for Ag+ detection. The fluorescence and absorption response to different species are shown in Fig. S4 (in Supplementary Information). There are five different systems including Ag+, DMF, DMF + Ag+, BPQDs and BPQDs + Ag+ tested, respectively. As expected, there are no fluorescence and absorption peaks for Ag+ and there is no obvious change of fluorescence and absorption spectra for DMF and DMF + Ag+. The fluorescence intensity of BPQDs decreases significantly in the presence of Ag+ (Fig. S4a, in Supplementary Information). Furthermore, a new and distinct absorption peak appears for BPQDs + Ag+ (Fig. S4b, in Supplementary Information). It can be deduced that BPQDs can be used for assay of Ag+ based on a dual-signal output of fluorescence and absorption methods.
In addition, to broaden the application scope of the present system, water content was tested. Both the solution and paper test strip systems were used to detect water in DMF (Fig. S5, in Supplementary Information). It can be observed that there is negligible change for fluorescence intensity, absorbance and color of paper for BPQDs in the presence and absence of water. Therefore, the proposed system can not be used for water detection.
To confirm the specificity of BPQDs for Ag+ determination, 15 metal ions with the same concentration (13.59 μg/mL) were tested. The fluorescence and absorption spectra and corresponding intensity and absorbance are shown in Fig. 4. As shown in Fig. 4a, the fluorescence intensity of BPQDs is significantly reduced by Ag+, which is not observed for other metal ions. Fig. 4c shows that after the addition of Ag+ to the BPQDs solution, a new peak appears at 410 nm, and only Ag+ has this phenomenon. The solution of BPQDs + Ag+ is yellowish-brown, whereas others remain colorless (see the inset of Fig. 4d). It can be concluded that a chemical reaction occurs possibly in the BPQDs + Ag+ system to form new species. Therefore, BPQDs can be used simultaneously to detect Ag+ by monitoring changes in the fluorescence intensity and UV–Vis absorbance.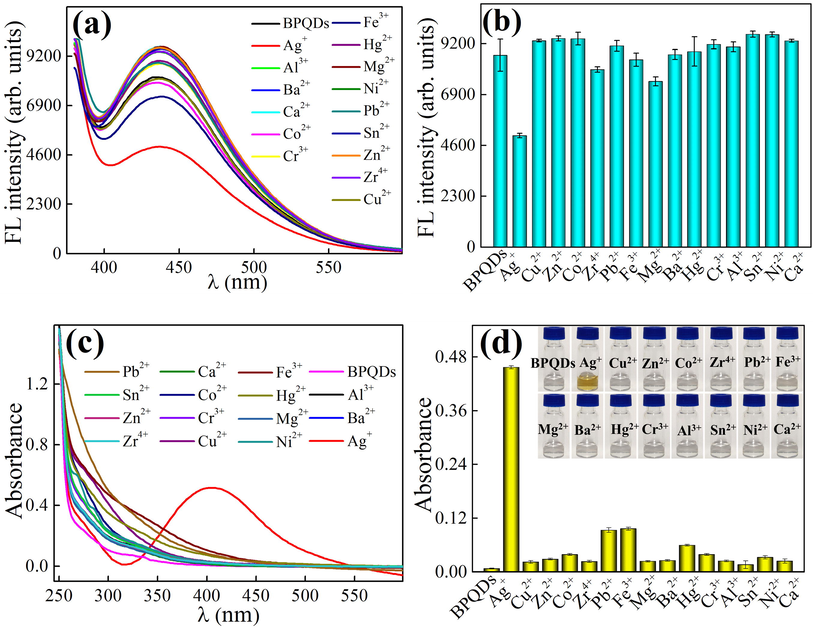
Effect of various metal ions on the fluorescence intensity (a, c) and absorbance (b, d) of BPQDs (the inset of Fig. 4d: the photographs of BPQD solutions with different metal ions), (condition: 0.34 mg/mL BPQDs, pH 9, time 6 min), respectively.
To examine the interferences of other metal ions mixing with Ag+, the fluorescence intensity and UV–Vis absorbance were obtained for 14 metal ions mixing with Ag+ with the same concentration, respectively. Fig. S6a and S6b (in Supplementary Information) clearly show that most other metal ions produce negligible effect on the detection process.
To facilitate the detection of Ag+, BPQDs were transferred to filter paper to fabricate the BPQDs@filter paper test strips. In this process, 20 μL BPQDs (0, 0.068, 0.136, 0.204, 0.272, and 0.340 mg/mL) was added to filter paper substrate (Fig. 5a). The filter paper strips were subsequently dried and used for the detection of 25.48 μg/mL Ag+. It can be observed that the color of strips deepens with increasing concentration of BPQDs. As Fig. 5b illustrates, the test strip with Ag+ turns yellowish-brown, whereas others don't change color. It can also confirm the selectivity of BPQDs@filter paper for detecting Ag+.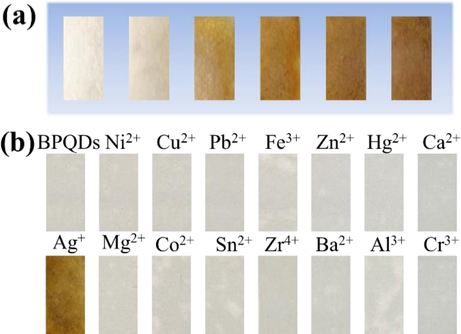
Photographs of BPQDs@filter paper test strips with different BPQDs concentrations (from left to right: 0, 0.068, 0.136, 0.204, 0.272, and 0.340 mg/mL) for the detection of Ag+ with the same concentration (a), photographs of BPQDs@filter paper test strips with various metal ions (b).
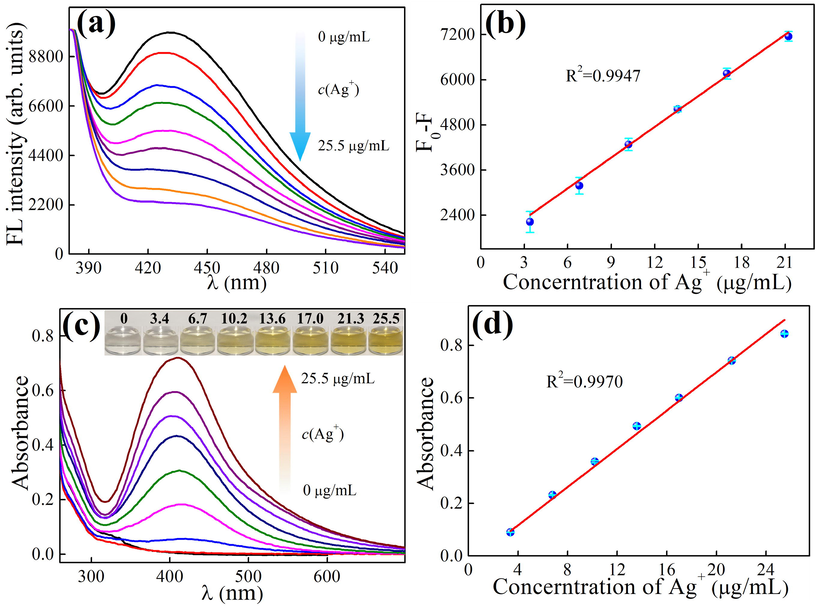
Fluorescence spectra of BPQDs obtained at different Ag+ concentrations (a) and the corresponding linear relationship between the fluorescence decrease and Ag+ concentration (b), UV–Vis absorption spectra of BPQDs obtained at different Ag+ concentrations (inset: the photographs of BPQD solutions with Ag+) (c) and the corresponding linear relationship between absorbance and Ag+ concentration (d), (condition: Ag+ in Fig. 6a and 6c 0, 1.70, 3.40, 6.79, 10.9, 13.59, 16.99, 21.23, 25.48 μg/mL, 0.34 mg/mL BPQDs, pH 9, time 6 min).
3.4 Sensitivity
Fluorescence and absorption spectra of BPQDs were measured with and without Ag+ in different concentrations (Fig. 6a and c). The relationship between the fluorescence intensity at 434 nm (Fig. 6b) or absorbance at 410 nm (Fig. 6d) and the concentration of Ag+ were plotted. It can be observed that there is a linear relationship between the fluorescence decrease (F0-F) and Ag+ concentration (Fig. 6b) with the LOD at 1.56 μg/mL. There is also a linear relationship between absorbance and Ag+ concentration (Fig. 6d) with the LOD at 0.19 μg/mL. In the inset of Fig. 6c, the color of the BPQDs solution changes from colorless to yellowish-brown with increasing Ag+ concentration.
Table S1 (in Supplementary Information) summarizes the results for Ag+ detection using various fluorescence and colorimetric methods. By comparison with these methods using different materials, it can be found that BPQDs are firstly used to detect Ag+. The proposed method has a relatively wide detection range, and the LOD is at a medium level. BPQDs can realize the dual-channel detection of Ag+ by fluorometry and colorimetry. Furthermore, other methods listed here are performed in solution, and only our BPQDs system uses paper test strip for Ag+ detection, enabling the portable detection.
3.5 Stability
Stability is an important parameter to assess the performance of a sensor. The stability of the BPQDs sensor was investigated by two ways.
First, the performance of BPQDs in detecting Ag+ was evaluated by the absorption method after the storage of BPQDs in a refrigerator (about 4 °C) and at room temperature (about 26 °C) (Kuswandi et al., 2008), respectively. The absorbance change of BPQDs + Ag+ over time is obtained, and A0 and A are the absorbance before and after storage of BPQDs, respectively (Fig. S7a, in Supplementary Information). It can be clearly seen that when BPQDs solution is stored at room temperature, A/A0 value reaches below 80 % within one day. When it is stored at 4 °C, however, the value of A/A0 is still over 90 % after six days.
Second, the fluorescence properties of BPQDs and QS, as well as carbon dots (CDs) and gold nanoclusters (Au-NCs) were compared under 300 W Xe lamp illumination (Long et al., 2018). After the irradiation of Xe lamp for a period, the fluorescence intensity changes for the four fluorescers were recorded with F0 and F representing intensity before and after illumination, respectively (Fig. S7b, in Supplementary Information). The corresponding photographs of the above species under the UV lamp are collected (Fig. S7c-g, in Supplementary Information). The results show that after 30 min of Xe lamp irradiation the fluorescence intensity of QS and Au-NCs decreases to below 50 %, while that of CDs decreases to 87.2 %. However, for BPQDs the fluorescence intensity changes less than 10 % after irradiation of 90 min. The corresponding photographs also display the similar phenomenon. It can be deduced that the fluorescence stability of BPQDs is higher than that of QS, CDs and Au-NCs.
3.6 Applications
To explore the practical applications, BPQDs were employed for the detection of Ag+ in Chun Yue ⋅ Fruit Water (Coca-Cola China) and Changbai Snow ⋅ Mineral Water (Nongfu Spring) samples. The drinking water samples were spiked with certain amount of Ag+ to determine the percent recovery of Ag+ (Li et al., 2019). The results obtained by UV–Vis spectroscopy are listed in Table S2 (in Supplementary Information). It shows that Ag+ is not detectable in the original Fruit Water and Mineral Water samples. The spiked concentration of Ag+ was 3.40, 6.79, and 10.19 μg/mL, respectively. The results are listed in Table S2 (in Supplementary Information). The calculated recovery varies between 97.35 % and 101.47 %. The relative standard deviation (RSD) values for three measurements are no more than 2.42 %. Atomic absorption spectrometry (AAS) was conducted as reference method for the measurement of the corresponding spiked drinking water samples (Table S2, in Supplementary Information). The results of the two methods were compared by t-test. When the confidence is 95 %, there is no significant difference between the two systems. According to Table S3 (in Supplementary Information), t0.05, 2 is 4.30, and the values of t in Table S2 (in Supplementary Information) are all less than 4.30. Therefore, there is no significant difference between the two methods, and BPQDs can be effectively used for the detection of Ag+ in drinking samples.
BPQDs@filter paper was also used to test the real samples. A paper test strip was completely immersed into Ag+ solution with the concentration in the range of 0–3.40 mg/mL. Fig. S8a (in Supplementary Information) shows that the color of BPQDs@filter paper changes gradually. Chun Yue ⋅ Fruit Water samples were spiked with Ag+ with the concentration of 0, 0.68, 1.36, 2.04, and 2.72 mg/mL, respectively, as shown Fig. S8b in Supplementary Information. By comparison with the results from the standard and spiked samples of Ag+, they are consistent with each other.
3.7 Mechanisms of the fluorescence and colorimetric detection methods
Stern–Volmer curves are employed to discuss the mechanism of fluorescence quenching mode for BPQDs in the presence of Ag+ at different temperatures (Fig. S9a, in Supplementary Information). The relationship between fluorescence intensity and Ag+ concentration is linear at 4, 24 and 44 °C, respectively. The slope of the curve obtained at 4 °C is greater than those of 24 °C and 44 °C. It indicates that the quenching effect of Ag+ on the fluorescence of BPQDs is mainly ascribed to the static quenching mode resulting from the formation of non-fluorescent compounds. The fluorescence decay curves of BPQDs and BPQDs + Ag+ show almost completely overlap (with life time at 3.30 and 3.45 μs) (Fig. S9b, in Supplementary Information). Hence, the observed fluorescence quenching is consistent with static quenching mode.
According to the TEM (Fig. 1b) and SEM (Fig. 1c and d) images of BPQDs@filter paper and BPQDs@filter paper + Ag+, BPQDs chemically react with Ag+ to produce new compounds on the test paper surface. The FT–IR spectrum depicted in Fig. 2a confirms the P–Ag bond.
To further explore the mechanism of the reaction of BPQDs with Ag+, an adsorption model of BPQDs + Ag+ is established by calculating the adsorption energy and charge densities at various atoms (Kresse and Furthmüller 1996), as illustrated in Fig. 7. It shows a schematic diagram (Fig. 7a) and the top view (Fig. 7c) of the Ag+ adsorption on the BPQDs surface as well as the charge density difference (Fig. 7b and d) at the Agad atom. The electron differential density map illustrates the interaction between Ag and P atoms. The cyan and yellow isosurfaces represent the depletion and accumulation of electrons, respectively, and the isosurface value is 3 × 10⁻³ e/Å3. These results indicate that Ag is adsorbed on the outer surface of BPQDs and that electrons on the Ag surface are concentrated near P atoms. Then it leads to the formation of covalent bonds between P and Ag atoms. These results consist with each other.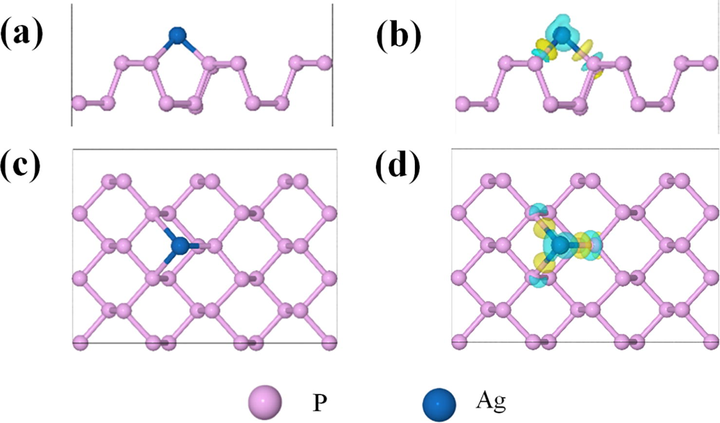
Schematic illustration of the adsorption of Ag+ on the BPQDs surface: side view (a) and top view (c), and the corresponding charge density difference at the Agad atom (b, d).
4 Conclusions
In summary, a portable sensor of Ag+ was built based on paper test strip. BPQDs were used as fluorescence and absorption probes. Due to the formation of chemical bond of P-Ag between BPQDs and Ag+ the fluorescence of BPQDs can be quenched by Ag+ coupling with color changes. There is dual-channel output of fluorescence and colorimetry. BPQDs loaded on filter paper were employed for the portable senor of Ag+. Compared with Cu, Ag, and Au colorimetric paper sensors, our strategy displayed more obvious color change. BPQDs were synthesized by combining the mechanical exfoliation and solvothermal methods. BPQDs exhibit blue fluorescence and display colorless under UV and daylight lamps, respectively. In the presence of Ag+, the fluorescence of BPQDs is quenched and the solution becomes yellowish-brown. Therefore, a dual signal output system was developed for the detection of Ag+ by observing fluorescence intensity and absorbance changes. According to the experimental and computational data, the interaction between BPQDs and Ag+ mainly involves the specific covalent bonding of Ag+ to the BPQDs surface. For convenience, the proposed colorimetric system can be transferred from solution to filter paper, and then Ag+ can be determined using a paper test strip. The test strip system is selective, sensitive, and portable for Ag+ detection, and is successfully applied in real samples.
Acknowledgment
This work was supported financially by National Natural Science Foundation of China (91543206 and U2002213), Natural Science Foundation and Graduate Education Quality Improvement Plan of Shandong Province (ZR2022MB052 and SDYJG21198), and Research Foundation of Liaocheng University (318050022 and 318012116). Double Tops Joint Fund of the Yunnan Science and Technology Bureau and Yunnan University (2019FY003025), Double First Class University Plan (C176220100042).
Declaration of Competing Interest
The authors declare that they have no known competing financial interests or personal relationships that could have appeared to influence the work reported in this paper.
References
- An overview of the optical properties and applications of black phosphorus. Nanoscale.. 2020;12:3513-3534.
- [CrossRef] [Google Scholar]
- Paper based platform for colorimetric sensing of dissolved NH3 and CO2. Biosens. Bioelectron.. 2015;67:477-484.
- [CrossRef] [Google Scholar]
- Detection of silver ions using dielectrophoretic tweezers-based force spectroscopy. Anal. Chem.. 2016;88:10867-10875.
- [CrossRef] [Google Scholar]
- Highly conductive, printable and stretchable composite films of carbon nanotubes and silver. Nat. Nanotechnol.. 2010;5:853-857.
- [CrossRef] [Google Scholar]
- New functionalities for paper-based sensors lead to simplified user operation, lower limits of detection, and new applications. Annu. Rev. Anal. Chem.. 2016;9:183-202.
- [CrossRef] [Google Scholar]
- Electrogenerated chemiluminescence detection in paper-based microfluidic sensors. Anal. Chem.. 2011;83:1300-1306.
- [CrossRef] [Google Scholar]
- Fan, X., S. Zhang, R. Guan, et al., 2022. Black phosphorus quantum dots as photocatalyst for dye degradation with a high efficiency and rate constant. J. Mol. Struct. 1252, 132163. https://doi.org/10.1016/j.molstruc.2021.132163.
- Facile colorimetric detection of silver ions with picomolar sensitivity. Anal. Chem.. 2017;89:3622-3629.
- [CrossRef] [Google Scholar]
- Three-dimensional paper-based electrochemiluminescence immunodevice for multiplexed measurement of biomarkers and point-of-care testing. Biomaterials.. 2012;33:1024-1031.
- [CrossRef] [Google Scholar]
- Black phosphorus quantum dots as the ratiometric fluorescence probe for trace mercury ion detection based on inner filter effect. ACS Sens.. 2017;2:576-582.
- [CrossRef] [Google Scholar]
- Black phosphorus quantum dots: synthesis, properties, functionalized modification and applications. Chem. Soc. Rev.. 2018;47:6795-6823.
- [CrossRef] [Google Scholar]
- Phosphorene/ZnO nano-heterojunctions for broadband photonic nonvolatile memory applications. Adv. Mater.. 2018;30:1801232.
- [CrossRef] [Google Scholar]
- Distance-dependent visual fluorescence immunoassay on CdTe quantum dot-impregnated paper through silver ion-exchange reaction. Microchim. Acta.. 2020;187:563.
- [CrossRef] [Google Scholar]
- Emerging metal ion-coordinated black phosphorus nanosheets and black phosphorus quantum dots with excellent stabilities. Dalton. Trans.. 2020;49:11911-11920.
- [CrossRef] [Google Scholar]
- Visual bio-detection and versatile bio-imaging of zinc-ion-coordinated black phosphorus quantum dots with improved stability and bright fluorescence. Biosens. Bioelectron.. 2020;165:112390
- [CrossRef] [Google Scholar]
- Facile synthesis of black phosphorus: an efficient electrocatalyst for the oxygen evolving reaction. Angew. Chem. Int. Ed.. 2016;55:13849-13853.
- [CrossRef] [Google Scholar]
- Kresse, G. and J. Furthmüller, 1996. Efficient iterative schemes for ab initio total-energy calculations using a plane-wave basis set. Phys. Rev. B. 54, 11169-11186.https://doi.org/10.1103/physrevb.54.11169.
- Non-volatile organic transistor memory based on black phosphorus quantum dots as charge trapping layer. IEEE Electr. Device. Lett.. 2020;41:852-855.
- [CrossRef] [Google Scholar]
- An optical fiber biosensor for chlorpyrifos using a single sol-gel film containing acetylcholinesterase and bromothymol blue. Talanta.. 2008;74:613-618.
- [CrossRef] [Google Scholar]
- Paper-based enzyme-free immunoassay for rapid detection and subtyping of influenza A H1N1 and H3N2 viruses. Anal. Chim. Acta.. 2015;883:37-44.
- [CrossRef] [Google Scholar]
- Amplified colorimetric detection of Ag+ based on Ag+-triggered peroxidase-like catalytic activity of ZIF-8/GO nanosheets. Sensors. Actuat. B.. 2019;284:213-219.
- [CrossRef] [Google Scholar]
- Ultra-sensitive suspended atomically thin-layered black phosphorus mercury sensors. Biosens. Bioelectron.. 2017;98:68-75.
- [CrossRef] [Google Scholar]
- Optical transformation of a CdTe quantum dot-based paper sensor for a visual fluorescence immunoassay induced by dissolved silver ions. J. Mater. Chem. B.. 2017;5:826-833.
- [CrossRef] [Google Scholar]
- Silver nanolabels-assisted ion-exchange reaction with CdTe quantum dots mediated exciton trapping for signal-on photoelectrochemical immunoassay of mycotoxins. Anal. Chem.. 2016;88:7858-7866.
- [CrossRef] [Google Scholar]
- Design of smartphone platform by ratiometric fluorescent for visual detection of silver ions. Microchem. J 2022
- [CrossRef] [Google Scholar]
- Black phosphorus quantum dots used for boosting light harvesting in organic photovoltaics. Angew. Chem. Int. Ed.. 2017;56:13717-13721.
- [CrossRef] [Google Scholar]
- Advances in functional nucleic acid based paper sensors. J. Mater. Chem. B.. 2020;8:3213-3230.
- [CrossRef] [Google Scholar]
- Highly fluorescent and stable black phosphorus quantum dots in water. Small.. 2018;14:1803132.
- [CrossRef] [Google Scholar]
- Wet NH3-triggered NH2-MIL-125(Ti) structural switch for visible fluorescence immunoassay impregnated on paper. Anal. Chem.. 2018;90:14121-14125.
- [CrossRef] [Google Scholar]
- Engineering plasmonic metal colloids through composition and structural design. Chem. Soc. Rev.. 2014;43:3823-3834.
- [CrossRef] [Google Scholar]
- Smartphone-integrated printed-paper sensor designed for on-site determination of dimethoate pesticide in food samples. Food. Chem.. 2022;383:132449
- [CrossRef] [Google Scholar]
- Bioresponsive release system for visual fluorescence detection of carcinoembryonic antigen from mesoporous silica nanocontainers mediated optical color on quantum dot-enzyme-impregnated paper. Anal. Chem.. 2017;89:5152-5160.
- [CrossRef] [Google Scholar]
- Fluorescent sensor based models for the detection of environmentally-related toxic heavy metals. Sci. Total. Environ.. 2018;615:476-485.
- [CrossRef] [Google Scholar]
- Black phosphorus quantum dots are useful oxidase mimics for colorimetric determination of biothiols. Microchim. Acta.. 2020;187:229.
- [CrossRef] [Google Scholar]
- Effect of silver nanoparticle surface coating on bioaccumulation and reproductive toxicity in earthworms (Eisenia fetida) Nanotoxicology.. 2011;5:432-444.
- [CrossRef] [Google Scholar]
- Food safety monitoring of the pesticide phenthoate using a smartphone-assisted paper-based sensor with bimetallic Cu@Ag core-shell nanoparticles. Lab. Chip.. 2020;20:3996-4006.
- [CrossRef] [Google Scholar]
- Ultrasmall black phosphorus quantum dots: synthesis and use as photothermal agents. Angew. Chem. Int. Ed.. 2015;54:11526-11530.
- [CrossRef] [Google Scholar]
- 1D porous tubular g-C3N4 capture black phosphorus quantum dots as 1D/0D metal-free photocatalysts for oxytetracycline hydrochloride degradation and hexavalent chromium reduction. Appl. Catal. B-Environ.. 2020;273:119051.
- [CrossRef] [Google Scholar]
- White blood cell counting on smartphone paper electrochemical sensor. Biosens. Bioelectron.. 2017;90:549-557.
- [CrossRef] [Google Scholar]
- A fluorescence probe for metal ions based on black phosphorus quantum dots. Adv. Mater. Interfaces.. 2020;7:1902075.
- [CrossRef] [Google Scholar]
- Paper-based electrochromic glucose sensor with polyaniline on indium tin oxide nanoparticle layer as the optical readout. Biosens. Bioelectron.. 2022;203:114002
- [CrossRef] [Google Scholar]
- Waveguide-integrated black phosphorus photodetector with high responsivity and low dark current. Nat. Photonics.. 2015;9:247-252.
- [CrossRef] [Google Scholar]
- Fluorometric sensing of pH values using green-emitting black phosphorus quantum dots. Microchim. Acta.. 2019;186:640.
- [CrossRef] [Google Scholar]
- Plasmonic optical properties and applications of metal nanostructures. Plasmonics.. 2008;3:127-150.
- [CrossRef] [Google Scholar]
- Sensitive detection of polynucleotide kinase activity by paper-based fluorescence assay with lambda exonuclease assistance. Anal. Chem.. 2016;88:11358-11363.
- [CrossRef] [Google Scholar]
- Ultrasensitive photoelectrochemical immunoassay for prostate-specific antigen based on silver nanoparticle-triggered ion-exchange reaction with ZnO/CdS nanorods. Analyst.. 2021;146:4487-4494.
- [CrossRef] [Google Scholar]
- John, P. Perdew, K. B., Matthias Ernzerhof, 1996. Generalized gradient approximation made simple. Phys. Rev. Lett. 77, 3865-3868. doi:10.1103/physrevlett.77.3865.
Appendix A
Supplementary material
Supplementary data to this article can be found online at https://doi.org/10.1016/j.arabjc.2022.104492.
Appendix A
Supplementary material
The following are the Supplementary data to this article:Supplementary data 1
Supplementary data 1
Paper test strip for silver ions detection in drinking water samples based on combined fluorometric and colorimetric methods


