

Translate this page into:
Pesticide residues and associated health effects in marketed fruits in Saudi Arabia
⁎Corresponding author. ndaghri@ksu.edu.sa (Nasser M. Al-Daghri)
-
Received: ,
Accepted: ,
This article was originally published by Elsevier and was migrated to Scientific Scholar after the change of Publisher.
Abstract
Aim
This study evaluated the pesticide residues in some fruits collected from different markets in Saudi Arabia (SA) and determined potential health risks associated with them.
Methods
Concentrations of pesticide residues in 12 types of fruits from local markets in SA from 2020 to 2022 were collected and evaluated. Multiple residue extraction method QuEChERS followed by LC-MS/MS and GC–MS/MS, were used to analyze 161 samples.
Results
Only 10 out of 161 samples (6.2 %) were free of pesticides. A total of 132 (87.4 %) pesticide residues were below MRLs, with 19 (12 %) of samples exceeding MRLs. Detected pesticide residues belonged to different chemical classes of pesticides including organophosphates, pyrethroids, organochlorines, neonicotinoids and fungicides. Risk assessment of human exposure to pesticides via the intake of the fruit types was performed. Hazard index (HI) for most fruit types were found to be less than 1. Oranges, grapes and pomegranates were the most consumed fruit types (31.6 g/day,15.8 g/day,10.8 g/day) and were contaminated with pesticide residues. Fluopyram, imazalil, chlorpyrifos, finamiphos and indoxacarb had HIs (1.32, 2.76,3.6,3.6,1.5) showed high risk index suggesting risk for systemic toxicity in consumers dependent on the amount of consumption.
Conclusion
In summary, high detection rate of pesticide residues was found in different fruits sold in local markets in SA. Regular biomonitoring programs for food crops in SA markets should be enforced, particularly in identified crops with His >1 to increase food safety within the SA community.
Keywords
Pesticide residue
MRL
Fruit
UHPLC-MS/MS
Monitoring
Hazard Index

1 Introduction
Fruits are one of the supplementary sources of carbohydrates, lipids, vitamins, minerals, antioxidants and other important nutrients. The consumption of these commodities with vegetables is almost 160 kg/per capita/year (OECD/EU 2010). High intake of fruits has been encouraged to prevent micronutrient deficiencies and reduce the incidence of major diseases such as cancer cardiovascular diseases and obesity (Qin, Chen et al. 2021). However, fresh fruit consumption can also be potential sources of harmful and toxic substances accumulated from its cultivation. Thus, food safety has become a major public concern worldwide (Radwan and Salama 2006).
Pesticides are defined as substances or mixtures of substances that are widely recognized to play an important role in agriculture, plant crops against pests, weeds, and disease (US-EPA 2018). Certainly, its use has increased the quantity and quality of crop yields as well as reduced harvest losses. More than a thousand pesticides are in active use globally, mostly manufactured to selectively destroy specific pests. They are generally classified as insecticides, herbicides, fungicides and rodenticides, to name a few (Turinek, Grobelnik-Mlakar et al. 2009, Selim, El-Saeid et al. 2011, Sarkar, Gil et al. 2021). Currently, the use of pesticides has increased as they are less labor intensive than other pest control strategies, aside from the increased demand for food supply (Farha, Abd El-Aty et al. 2018). All pesticides are inherently toxic, and hence, are potentially hazardous to humans and animals through exposure or dietary intake. These issues led to widespread concern over the potential adverse effects of these pesticides on human health when exposed through different routes, including skin contact, ingestion, or inhalation (Tudi, Li et al. 2022). Pesticide exposure through ingestion was found more harmful than skin contact (Juraske, Mutel et al. 2009), putting raw intake of fruits and vegetables from unknown sources potentially damaging (Kumari, Kumar et al. 2001). Pesticide contact even at low doses can cause acute detrimental side effects with symptoms such as headaches, rashes, dizziness, nausea, and long-term consequences, including malignancy, multi-system toxicity, birth and fertility issues, and disruption of the metabolic system (Alavanja, Ross et al. 2013). Globally, 385 million cases recorded in 2020 were attributed to inadvertent acute pesticide poisoning, 11,000 of which were fatal (Boedeker, Watts et al. 2020). Agricultural workers and pesticide applicators are more prone to pesticide exposure (Willenbockel, Prinz et al. 2022). Many countries have passed laws to limit pesticide residues exposure via the establishment of the maximum residue limits (MRLs) (Ramadan, Abdel-Hamid et al. 2020).
Pesticide exposure has increased rapidly in Saudi Arabia (SA) as the development of agriculture increased (Saggu, Rehman et al. 2016). Recently, many researches were carried out in several Saudi agriculture regions for pesticide analysis and reported the persistence of residual pesticides in different commodities (Osman, Al-Humaid et al. 2010, Selim, El-Saeid et al. 2011). Al-Wabel and others used simple micro-wave-assisted extraction (MAE) technique in monitored a residue of different chemical groups of pesticides in soil samples collected from 15 regions in SA (Al-Wabel, El-Saeid et al. 2011). In a study conducted in the Al-Qassim region, pesticide residues were examined in 160 vegetable samples. The results indicated that the most often discovered pesticide residues (carbaryl, biphenyl, and carbofuran) had MRL values that were surpassed mostly in cabbage, squash, green pepper, and carrots. (Osman, Al-Humaid et al. 2011). In this work, we used a developed, validated, sensitive and expeditious multiresidue “QuEChERS” method to evaluate residues of 412 pesticides residues including different chemical groups of pesticides which used in controlling the agricultural pests in various eleven vegetable and fruit types of the Saudi markets. It is worthy to note that several other techniques for agriculture products are available for assessing quality and safety including quantifying pesticide residues such as the matrix solid phase dispersion (MSPD) technique (Mujahid, Latif et al. 2022), near infrared (NIR) spectroscopy for quality inspection (Wang, Wang et al. 2023, Zhang, Wang et al. 2024), in situ optical sensing system for monitoring (Wang, Zhang et al. 2023) to name a few, most of which have arguably not been documented in SA.
There is limited data available on the levels of pesticide residues in fruits sold in local markets of SA. Therefore, this study's goal was to evaluate contamination by pesticides residues in fruits collected from different local markets during 2020 to 2022 to provide useful contamination data for relevant decision makers in SA to be used as a reference for the future monitoring.
2 Materials and methods
2.1 Fruits food sample preparation
A total of 12 fruits consisting of apples, apricots, bananas, figs, grapes, kiwis, lemons, mandarins, oranges, peaches, pears and pomegranates were purchased in random local markets in Riyadh, SA. Samples were prepared according to the modified QuEChERS technique (Quick, Easy, Cheap, Effective, Rugged, and Safe) (Abd-Alrahman 2013, González-Curbelo, Varela-Martínez et al. 2022). In brief, a 1 kg worth of samples were diced and homogenized for 5 min at high speed using a laboratory homogenizer. Homogenized samples (15 g) were placed in 50 mL polyethylene tube, with 15 mL of acetonitrile 1 % acetic acid added per tube. The samples were vortexed at maximum speed. Around 4 g of anhydrous magnesium sulfate with 1 g of sodium chloride was mixed, vortexed again for 5 min and centrifuged for 10 min at 5,000 rpm. An aliquot of 4 mL from the supernatant was transferred to a new 15 mL centrifuge tube containing 100 mg PSA and 500 mg anhydrous magnesium sulfate. The samples were again vortexed for 1 full minute and centrifuged for 6,000 rpm for 5 mins. An aliquot of 2 mL was concentrated to dryness. All samples were prepared at the Chair for Biomarkers of Chronic Diseases (CBCD) in King Saud University (KSU), Riyadh, SA.
2.2 LC-MS/MS analysis
Liquid chromatograph Agilent Infinity 1290 was used for separation coupled to an API 6500 Qtrap tandem mass spectrometer from AB Sciex with electrospray ionisation (ESI) interface. Separation was performed on a C18 column ZORBAX Eclipse XDB-C18 4.6 × 150 mm, 5 μm particle size (Agilent, USA). The mobile phase was as follows: Solvent A: 10 mM ammonium format solution at pH 4 ± 0.1 in methanol–water (1:9); Solvent B: methanol. The linear gradient programme was: start at 100 % A; 0–13 min from 100 % to 5 % A; 13–21 min, 5 % A; 21–28 min, from 5 % to 100 % A; 28–32 min 100 % A at a flow rate of 0.3 ml/min, the injection volume was 5 μl, column temperature was 40℃. The nitrogen nebulizer, curtain, and other gas characteristics were optimized in accordance with manufacturer instructions, and the source was set to the positive mode. Every analyte had the same source temperature of 400 °C and ion spray potential of 5500 V. By directly introducing individual pesticide solution injections into the MS detector, the cluster potential and collision energy were calibrated. Quantitation and confirmation were performed using the multiple reaction monitoring mode.
2.3 GC–MS/MS analysis
Pesticide analysis was performed using Agilent 7890A gas chromatograph coupled with 7000B triple quadrupole mass spectrometer (Agilent Technologies, USA) using Mass Hunter software. The mass ionization was carried out using electron ionization mode at + 70 eV, with a sample injection volume of 1 µL. The temperatures of the transfer line and ion source are 280 °C and 300 °C, respectively. The analysis was carried out with a solvent delay of 2 min with applying multiple reaction monitoring (MRM) for the studied pesticides. Most MRM parameters for the studied pesticides were obtained from previous studies (Shendy, Al-Ghobashy et al. 2016), exchanging between the selected quantifiers and qualifiers for many pesticides. In addition, few pesticides such as biphenyl, penconazole, and ethion have been optimized to get more sensitive and selective MRMs. Chromatographic separations carried out using HP-5 ms Ultra Inert column (30 m × 0.25 mm, 0.25 μm) were obtained from Agilent Technologies (USA). A pure Helium gas (>99.999 %) was used as carrier gas with a constant flow rate of 1.83 mL/m. The optimized oven temperature program and back flushing were used to shorten the analysis time with reducing the times of system maintenance. Backflush parameters were installed as follow; holding for 3 m; inlet pressure of 1 psi; three-way splitter pressure of 40 psi; at temperature of 280 °C.
2.4 Method validation
The analytical procedure was carried out in compliance with the SANTE/12682/2019 guidelines (SANTE 2021) (Abd-Alrahman 2016). The correlation coefficient (R2) for the peak regions against the concentrations were in the range of 0.1 to 500 μg/L and was used to assess the linearity of the calibration curve; R2 should be greater than 0.99. The response factor's (RF, %) maximum percentage difference need to be less than 20 %. The standard solutions were injected at random in triplicates. The sensitivity was assessed by determining the limit of detection (LOD). The method's lowest fortification level that yields a recovery percentage of 80–120 and a relative standard deviation (RSD) of less than 20 % was determined to be the method's limit of quantitation (LOQ). (Li, Liu et al. 2017). The accuracy was assessed at three fortification levels (10, 50, and 100 μg/kg) based on the % recovery. The LOQ level was used to measure precision in terms of intra-day repeatability (n = 6 on the same day) and inter-day repeatability (n = 18, on three different days at 7-day intervals).
2.5 Estimated daily intake
The type of food product and its pesticide content determine how much pesticides are consumed on a daily basis. In addition, a person's body weight may have an impact on their pesticide tolerance. The following formula was used to determine the estimated daily intake (EDI) of pesticide residues in food samples for each combination:
2.6 Evaluation of health risk assessment
Hazard quotient (HQ) and hazard index (HI) ratios were calculated to estimate the long-term risk assessment in vegetable samples. The customer was deemed to be sufficiently protected if the ratio was found to be less than unity (1). Eq. (2) was used to calculate the HQ by dividing the EDI by the appropriate acceptable daily intake.:
If HI was greater than 1, pesticide exposure may provide a health risk. It has been demonstrated that this assessment technique provides information about the commodities that raise health risks (EFSA 2007).
2.7 Data analysis
SPSS version 21.0 was used to analyze the data (Chicago, IL, USA). The parameters used to express residue concentrations were mean and standard error (SE). The presentation of detection rates included frequencies and percentages (%). The concentration variations according to food type and region were assessed using the Mann-Whitney U test and the Kruskal-Wallis test, respectively. The significant differences in the detection rates by food type and region were found using chi-square tests of independence. A significance level of p < 0.05 was applied.
3 Results
Based on analytical studies of pesticides residues for 161 samples of different types of fruits (Table 1 & Fig. 1), pesticides residues were not detected in only 10 (6.2 %) analyzed samples. The rest of the 151 (93.8 %) samples were overwhelmingly contaminated. In most of the analyzed samples, 132 (87.4 %) pesticide residues were below the MRLs. whereas, 19 samples (11.8 %) contain pesticide residues above safety limits. Pesticide residue levels were compared to EU-MRLs (Osman, Al-Humaid et al. 2011). Note: Data presented as N(%).
Commodity
N
Free
Contaminated
Pesticides found
N samples > MRL
No.
%
No.
%
No.
%
No.
%
Apple
25
1
0.62
24
14.91
10
23.81
1
0.62
Apricot
22
0
0
22
13.66
18
42.86
5
3.11
Banana
8
3
1.86
5
3.11
5
11.90
0
0
Fig
10
0
0
10
6.21
10
23.81
5
3.11
Grape
5
1
0.62
4
2.48
2
4.76
0
0
Kiwi
5
0
0
5
3.11
4
9.52
2
1.24
Lemon
21
2
1.24
19
11.80
9
21.43
0
0
Mandarin
9
1
0.62
8
4.97
6
14.29
0
0
Orange
20
0
0
20
12.42
6
14.29
0
0
Peach
9
0
0
9
5.59
9
21.43
0
0
Pear
14
0
0
14
8.70
10
23.81
1
0.62
Pomegranate
13
2
1.24
11
6.83
11
26.19
5
3.11
Total
161
10
6.21
151
93.79
100
100.00
19
11.80
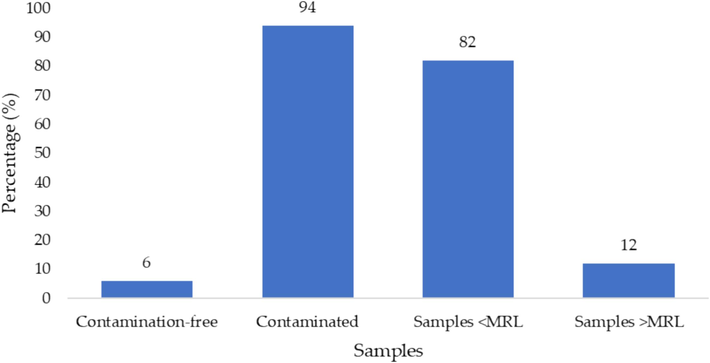
Percentage of fruits according to contamination and MRL status.
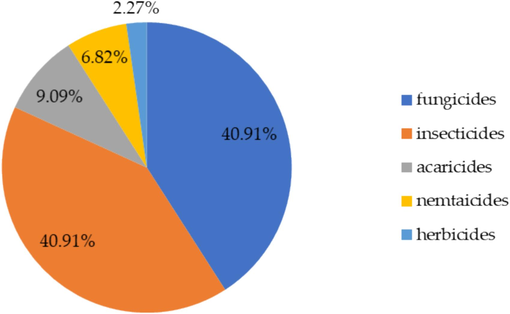
Results in Table 2 revealed that the 44 compounds detected in 151 contaminated samples belonged to different pesticides groups (organophosphates, pyrethroids, organochlorines, neonicotinoid, fungicides etc.). Using the WHO (2019) classification, 23 pesticides were moderately hazardous (class-II), 10 pesticides belonged to class III (slightly hazardous), 8 compounds were in class U (unlikely to pose an acute hazard with normal use), while 3 highly toxic compounds (class Ib and Ia) were detected. 40.91 % of the detected pesticides were fungicides. Likewise, 40.91 % were insecticides. Acaricide and nematicides represent 9.09 % and 6.82 % respectively, while 2.72 % belonged to herbicides (Fig. 2). LOQ limit of quantification; *WHO (2019) classification: Ib highly hazardous, II moderately hazardous, III slightly hazardous, U unlikely to pose as an acute hazard with normal use.
Pesticide
N
%
Uses
WHO classification*
Chemical Group
2-phenylphenol
5
3.11
F
III
hydroxybiphenyls
Abamectin
1
0.62
A
II
avermectin
Acetamiprid
6
3.73
I
II
neonicotinoid
Azoxystrobin
4
2.48
F
U
aryloxypyrimidine
Bifenazate
2
1.24
A
U
carboxylic ester
Bifenthrin
1
0.62
I
II
pyrethroid
Boscalid
5
3.11
F
U
pyridinecarboxamide
Bupirimate
4
2.48
F
III
aminopyrimidines
Chlorantraniliprole
1
0.62
I
U
anthranilic diamides
Chlorpyrifos
7
4.35
I
II
organophosphate
Cypermethrin
7
4.35
I
II
pyrethroid
Deltamethrin
4
2.48
I
II
pyrethroid
Diazinon
1
0.62
I
II
organophosphate
Difenoconazole
4
2.48
F
II
triazole
Emamectin benzoate
1
0.62
I
II
avermectin
Ethoprophos
1
0.62
N
Ia
organophosphate
Fenamiphos
1
0.62
N
Ib
organophosphate
Fenbuconazole
2
1.24
F
II
triazole
fenpropimorph
1
0.62
I
III
a morpholine-derived
Fenpyroximate
1
0.62
A
II
benzoate
Fludioxonil
14
8.70
F
U
benzodioxoles
Fluopyram
2
1.24
N
III
benzamides
Imazalil
17
10.56
F
II
imidazole
Imidacloprid
3
1.86
I
II
neonicotinoid
Indoxacarb
1
0.62
I
II
oxadiazine
Lambda-Cyhalothrin
4
2.48
I
II
pyrethroid
Malathion
1
0.62
I
III
organophosphate
Methomyl
1
0.62
I
Ib
carbamate
Myclobutanil
2
1.24
F
II
triazole
Pendimethalin
1
0.62
H
III
dinitroaniline
Phosmet
1
0.62
I
II
phthalimide-derived
Pirimicarb
3
1.86
F
II
aminopyrimidine
Pyraclostrobin
1
0.62
F
III
a carbamate ester
Pyridaben
1
0.62
I
II
pyridazinone
Pyrimethanil
16
9.94
I
III
aminopyrimidines
Pyriproxyfen
1
0.62
A
U
pyridine
Spirodiclofen
1
0.62
F
III
organochlorine
Tebuconazole
1
0.62
F
II
triazole
Tetraconazole
3
1.86
F
II
triazole
Thiabendazole
12
7.45
F
II
triazole
Thiamethoxam
4
2.48
I
III
neonicotinoid
Thiophanate-methyl
1
0.62
F
U
thioureas
Triadimenol
1
0.62
F
II
triazole
Trifloxystrobin
1
0.62
F
U
triazole
Classification of the detected pesticide residues and their percentage.
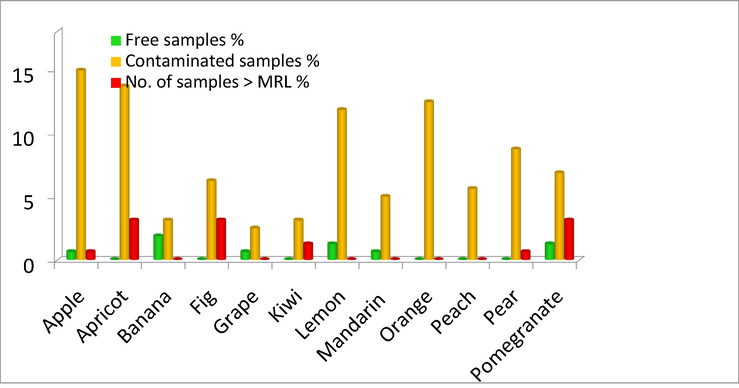
Table 3 and Fig. 3 showed the frequency and concentration of pesticide residues in the analyzed samples. The fruits contaminated with 44 types of pesticides are shown below with different percentages: Note: Data presented as N(%).
Fruit (N)
Free
Contaminated
a.i
Freq.
Min.-Max.(mg/kg)
Mean (mg/kg)
EU(MRL)
N samples > EU MRL
Apple
(25)1
24
Acetamiprid
3
(0.018–0.057)
0.037
0.4
1
Boscalid
1
(0.081)
0.081
2
0
Bupirimate
4
(0.003–0.05)
0.019
0.3
0
Fludioxonil
5
(0.005–0.458)
0.204
5
0
Phosmet
1
(0.014)
0.014
0.5
0
Pirimicarb
3
(0.018–0.268)
0.102
0.5
0
Pyrimethanil
3
(0.019–4)
1.623
15
0
Tetraconazole
2
(0.01–0.013)
0.011
0.3
0
Thiabendazole
1
0.011
0.011
4
0
Trifloxystrobin
1
0.004
0.004
0.7
0
Total (%)
(4 %)
(96 %)
10
1 (4 %)
Apricot
(22)0
22
Acetamiprid
1
0.015
0.015
0.8
0
Azoxystrobin
2
(0.003–0.146)
0.0745
2
0
Bifenazate
1
0.013
0.013
2
0
Boscalid
1
0.047
0.047
5
0
Chlorpyrifos
2
(0.002–0.02)
0.011
0.01
1
Deltamethrin
1
0.017
0.017
0.015
1
Difenoconazole
1
0.048
0.048
0.7
0
Fenbuconazole
1
0.071
0.071
0.6
0
Fludioxonil
1
0.965
0.965
5
0
Imazalil
1
0.027
0.027
0.01
1
Imidacloprid
1
0.239
0.239
0.01
1
Lambda-Cyhalothrin
2
(0.007–0.033)
0.02
0.15
0
Myclobutanil
1
0.037
0.037
3
0
Pyrimethanil
2
(0.005–0.244)
0.125
10
0
Spirodiclofen
1
0.147
0.147
2
0
Tebuconazole
1
0.005
0.005
0.6
0
Thiabendazole
1
0.006
0.006
0.01
0
Triadimenol
1
0.042
0.042
0.01
1
Total
0
(100 %)
18
5(22.72 %)
Banana
(8)3
5
Chlorpyrifos
1
0.003
0.003
0.01
0
Fenpropimorph
1
0.002
0.002
0.6
0
Myclobutanil
1
0.006
0.006
3
0
Thiabendazole
1
0.004
0.004
6
0
Thiamethoxam
1
0.011
0.011
0.02
0
Total
(37.5 %)
(62.5 %)
5
0
Fig
(10)0
10
Azoxystrobin
1
0.006
0.006
0.01
0
Bifenthrin
1
0.168
0.168
0.01
1
Cypermethrin
1
0.022
0.022
0.05
0
Difenoconazole
1
0.006
0.006
0.1
0
Deltamethrin
1
0.009
0.009
0.01
0
Fenpyroximate
1
0.028
0.028
0.01
1
Fludioxonil
1
0.019
0.019
0.01
1
Imidacloprid
1
0.035
0.035
0.01
1
Pyridaben
1
0.029
0.029
0.01
1
Thiophanate-methyl
1
0.012
0.012
0.1
0
Total
0 %
(100 %)
10
5 (50 %)
Grape
(5)1
4
Boscalid
2
(0.009–0.012)
0.01
5
0
Fluopyram
2
(0.267–0.352)
0.331
2
0
Total
20 %
80 %
2
0
Kiwi(5)
0
5
Cypermethrin
1
0.011
0.011
0.05
0
Pyrimethanil
2
(0.006–0.007)
0.006
0.01
0
Thiabendazole
1
0.015
0.015
0.01
1
Thiamethoxam
1
0.094
0.094
0.01
1
Total
0 %
100 %
4
2 (40 %)
Lemon
(21)2
19
2-phenylphenol
2
(0.006–0.014)
0.01
10
0
Cypermethrin
1
0.005
0.005
2
0
Imazalil
6
(0.04–0.542)
0.140
5
0
Imidacloprid
1
0.083
0.083
0.9
0
Methomyl
1
0.005
0.005
0.01
0
Pyrimethanil
2
(0.057–0.078)
0.082
8
0
Pyriproxyfen
1
0.006
0.006
0.6
0
Thiabendazole
3
(0.014–0.05)
0.04
7
0
Thiamethoxam
2
(0.007–0.009)
0.008
0.15
0
Total
9.52 %
90.48 %
9
0 %
Mandarin (9)
1
8
2-phenylphenol
1
0.006
0.006
10
0
Cypermethrin
1
0.002
0.002
2
0
Fludioxonil
2
(0.004–0.011)
0.007
10
0
Imazalil
2
(0.009–0.034)
0.021
5
0
Pyrimethanil
1
0.008
0.008
8
0
Thiabendazole
1
0.048
0.048
7
0
Total
11.11 %
88.89 %
6
0 %
Orange
(20)0
20
2-phenylphenol
2
(0.012–0.014)
0.013
10
0
Chlorpyrifos
1
0.002
0.002
0.01
0
Cypermethrin
2
(0.003–0.005)
0.004
2
0
Imazalil
8
(0.044–0.619)
0.192
4
0
Pyrimethanil
3
(0.052–0.090)
0.07
8
0
Thiabendazole
4
(0.027–0.043)
0.034
7
00
Total
0 %
100 %
6
0 %
Peach
(9)0
9
Acetamiprid
1
0.008
0.008
0.01
0
Azoxystrobin
1
0.01
0.01
2
0
Chlorpyrifos
1
0.002
0.002
0.01
0
Difenoconazole
1
0.007
0.007
0.5
0
Fenbuconazole
1
0.174
0.174
0.6
0
Fludioxonil
1
0.036
0.036
10
0
Lambda-Cyhalothrin
1
0.019
0.019
0.15
0
Malathion
1
0.003
0.003
0.02
0
Pyrimethanil
1
2.233
2.233
10
0
Total
0 %
100 %
9
0 %
Pear
(14)0
14
Acetamiprid
1
0.011
0.011
0.4
0
Boscalid
1
0.159
0.159
1.5
0
Chlorantraniliprole
1
0.038
0.038
0.4
0
Chlorpyrifos
1
0.124
0.124
0.01
1
Deltamethrin
1
0.039
0.039
0.1
0
Difenoconazole
1
0.005
0.005
0.8
0
Fludioxonil
3
(0.142–1.807)
1.1
5
0
Lambda-Cyhalothrin
1
0.023
0.023
0.08
0
Pyraclostrobin
1
0.019
0.019
0.5
0
Pyrimethanil
2
(0.007–0.055)
0.031
0.3
0
Tebuconazole
1
0.028
0.028
0.3
0
Total
0 %
100 %
10
1 (7.14 %)
Pomegranate
(13)2
11
Abamectin
1
0.014
0.014
0.01
1
Chlorpyrifos
1
0.231
0.231
0.01
1
Cypermethrin
1
0.005
0.005
0.05
0
Deltamethrin
1
0.064
0.064
0.01
0
Diazinon
1
0.006
0.006
0.01
0
Emamectin
1
0.025
0.025
0.002
0
Ethoprophos
1
0.011
0.011
0.01
1
Fenamiphos
1
0.185
0.185
0.01
1
Fludioxonil
1
0.006
0.006
3
0
Indoxacarb
1
0.578
0.578
0.02
1
Pendimethalin
1
0.027
0.027
0.05
0
Total
15.38 %
84.62 %
11
5(38.46 %)
Frequency of presence of pesticide residues in different types of collected fruit samples.
3.1 Apple (Malus pumila)
96 % of apple samples were contaminated with highly toxic pesticides (class II), about 12.5 % of samples contaminated with moderately toxic pesticides (Class III). Others were contaminated with compounds that unlikely to pose an acute hazard with normal use. Fortunately, only 4 % of contaminated samples exceeded the MRL established by EU [1].
3.2 Apricot (Prunus armeniaca)
All apricot samples were contaminated with 18 compounds and about 66.7 % (12) of these compounds were highly toxic pesticides (class II) like Acetamiprid, chlorpyrifos, deltamethrin lambda-cyhalothrin represent different chemical groups. Two pesticides were moderately toxic (class II) and the other two compounds were unlikely to pose an acute hazard with normal use. Residue levels of each of chlorpyrefos, deltamethrin, imazalil, imidacloprid and triadimenol exceeded in 22.7 % of samples.
3.3 Banana (Musa paradisiaca Linn)
5 Out of 8 (62 %) banana samples were contaminated with 5 different types of pesticides, 3 of which were thiabendazol, triadmenol and myclobutanil, considered highly toxic (class-II). While thiamethaoxam and fenpropimorph were moderately toxic compounds (class-III). All residue levels did not exceed the MRLs
3.4 Fig (Ficus Carica)
All collected fig samples were contaminated with 10 different types of pesticides, 8 of which was highly toxic (Class-II) while the other 2 were unlikely to pose an acute hazard with normal intake. Bifenthrin, fenpyroximate, fludioxonil, imidacloprid and pyridaben exceed the MRLs in 50 % of samples.
3.5 Grapes (Vitis vinifera)
Four out of 5 (80 %) grapes samples were contaminated with only two types of pesticides; 2 samples were contaminated with boscalid which is unlikely to pose an acute hazard. However, the other 2 samples were contaminated with fluopyram (class-III). Both pesticides residue levels did not exceed the MRLs [1].
3.6 Kiwi (Actinidia deliciosa)
Four types of pesticides were detected in the kiwi collected samples, two of which were pyrimethanil (class-III), while each of cypermethrin (class-II) thiabendazole (class II) and thiamethoxam (class-III) were present in the other 3 samples. The last two pesticides exceed the MRLs [1].
3.7 Lemon (Citrus limon)
90.5 % of collected lemon samples were contaminated with 9 types of pesticides, four of which were highly toxic (class II), three were moderately toxic (class III), one lemon sample had an extremely toxic methomyl residue (class Ib). Pyreiproxyfen pesticide was detected in one lemon sample. The recorded results showed that all detected pesticides limits were less than the MRLs [1].
3.8 Mandarin (Citrus reticulate)
As regards to mandarin, 88.9 % of samples had varying degrees of pesticide residues; imazalil, cypermethrin and thiabendazole were highly toxic compounds (class II). 2phenylphenol and pyrimethanil were moderately toxic (class-III) in addition to fludioxonil were unlikely to pose an acute hazard with normal use. The residues limit of all pesticide was less than MRLs.
3.9 Orange (Citrus)
All collected samples contained detectable residues of 6 different pesticides related to different chemical groups with limits below the MRLs. Four types of pesticides were highly toxic (class II) and two other pesticides were moderately toxic (class III).
3.10 Peach (Prunus persica)
All peach samples were contaminated with different pesticides. 6 samples contained highly toxic (class II) compounds and one sample contained moderately toxic compound (class III). The remaining 2 samples were unlikely to pose an acute hazard with normal use. The limits of the detected pesticide residues limit below the MRLs.
3.11 Pear (genus Pyrus)
All pear samples were contaminated with 10 types of pesticides. Six samples contained six highly toxic (class-II) compounds. Residue limit of chlorpyrifos (class-II) exceeds MRLs. Pyrimethanil and pyraclostrobin (class-III) residues were detected in 3 samples. Moreover, 3 samples contained boscalid and fludioxonil compounds that were unlikely to pose an acute hazard with normal use.
3.12 Pomegrenate (Punica granatum)
Eleven out of 13 pomegranate samples (84.62 %) contained pesticides residues. Seven samples contained highly toxic compounds (class-II), 3 of which (abamectin, chlorpyrifos and indoxacarb) exceeded MRLs. Extremely toxic compounds (ethoprophos and finamiphos) class Ia & Ib were detected in 2 samples with limits exceeding MRLs. The other 2 samples contained pendimethalin (class-III) and fludioxonil which were unlikely to pose an acute hazard.
Descriptive data in Table 4 revealed that pesticide residues detected in each fruit sample had an EDI less than ADI and consequently HI less than 1 which meant there were no hazard risk. However, fluopyram pesticide detected in 50 % of collected grapes samples had HIs above 1 (1.324), an indicator for hazard risk on human health especially with the increase the consumption of grapes (15.8 g/day) as demonstrated in Table 4. Furthermore, Imazalil was the most frequently detected pesticide in orange samples present in 40 % (8 samples) the health HIs were 2.76 > 1 thus human health was vulnerable to hazards risk due to increase consumption (31.5 g/day). The health HI of highly toxic pesticide malathion residue (class II) was detected in one sample of peach. Chlorpyrifos, finamiphos and indoxacarb were detected in three pomegranate samples with health hazard indices were >1 (10.5 g/day). Lastly, to assess the risk of exposure of human health to the pesticide residues, the individual components of dietary intakes were presented in supplementary Table 1 for each type of collected fruits according to 13 GEMS/Food Consumption Cluster Diets based on FAO Food Balance Sheet data from 183 countries. Note: NA not available, ADI acceptable daily intake, EDI estimated daily intake, HI hazard index, HR health risk, MRL maximum residue limit.
Fruit
(No)a.i
N
Min.-Max.(mg/kg)
Mean (mg/kg)
EU(MRL)
EDI
ADI
HI%
HR
(Yes-No)
Apple
(25)Acetamiprid
3
(0.018–0.057)
0.037
0.4
1.2E-05
0.025
4.8E-02
No
Boscalid
1
(0.081)
0.081
2
8.7E-06
0.04
2.2E-02
No
Bupirimate
4
(0.003–0.05)
0.019
0.3
8.1E-06
0.05
1.6E-02
No
Fludioxonil
5
(0.005–0.458)
0.204
5
1.1E-04
0.37
3.0E-02
No
Phosmet
1
(0.014)
0.014
0.5
1.5E-06
0.01
1.5E-02
No
Pirimicarb
3
(0.018–0.268)
0.102
0.5
3.3E-05
0.035
9.4E-02
No
Pyrimethanil
3
(0.019–4)
1.623
15
5.2E-04
0.125
4.2E-01
No
Tetraconazole
2
(0.01–0.013)
0.011
0.3
2.4E-06
NA
NA
No
Thiabendazole
1
0.011
0.011
4
1.2E-06
0.1
1.2E-03
No
Trifloxystrobin
1
0.004
0.004
0.7
4.3E-07
0.1
4.3E-04
No
Apricot
(22)Acetamiprid
1
0.015
0.015
0.8
6.4E-07
0.025
2.6E-03
No
Azoxystrobin
2
(0.003–0.146)
0.0745
2
6.4E-06
0.2
3.2E-03
No
Bifenazate
1
0.013
0.013
2
5.6E-07
0.01
5.6E-03
No
Boscalid
1
0.047
0.047
5
2.0E-06
0.04
5.0E-03
No
Chlorpyrifos
2
(0.002–0.02)
0.011
0.01
9.4E-07
0.001
9.4E-02
No
Deltamethrin
1
0.017
0.017
0.015
7.3E-07
0.01
7.3E-03
No
Difenoconazole
1
0.048
0.048
0.7
2.1E-06
0.01
2.1E-02
No
Fenbuconazole
1
0.071
0.071
0.6
3.0E-06
0.006
5.1E-02
No
Fludioxonil
1
0.965
0.965
5
4.1E-05
0.37
1.1E-02
No
Imazalil
1
0.027
0.027
0.01
1.2E-06
0.025
4.6E-03
No
Imidacloprid
1
0.239
0.239
0.01
1.0E-05
0.06
1.7E-02
No
Lambda-Cyhalothrin
2
(0.007–0.033)
0.02
0.15
1.7E-06
0.0025
6.9E-02
No
Myclobutanil
1
0.037
0.037
3
1.6E-06
0.025
6.3E-03
No
Pyrimethanil
2
(0.005–0.244)
0.125
10
1.1E-05
NA
NA
No
Spirodiclofen
1
0.147
0.147
2
6.3E-06
NA
NA
No
Tebuconazole
1
0.005
0.005
0.6
2.1E-07
NA
NA
No
Thiabendazole
1
0.006
0.006
0.01
2.6E-07
0.1
2.6E-04
No
Triadimenol
1
0.042
0.042
0.01
1.8E-06
0.05
3.6E-03
No
Banana
(8)Chlorpyrifos
1
0.003
0.003
0.01
3.6E-07
0.001
3.6E-02
No
Fenpropimorph
1
0.002
0.002
0.6
2.4E-07
0.003
7.9E-03
No
Myclobutanil
1
0.006
0.006
3
7.1E-07
0.025
2.8E-03
No
Thiabendazole
1
0.004
0.004
6
4.7E-07
0.1
4.7E-04
No
Thiamethoxam
1
0.011
0.011
0.02
1.3E-06
0.026
5.0E-03
No
Fig
(10)Azoxystrobin
1
0.006
0.006
0.01
2.0E-07
0.025
7.9E-04
No
Bifenthrin
1
0.168
0.168
0.01
5.5E-06
0.015
3.7E-02
No
Cypermethrin
1
0.022
0.022
0.05
7.2E-07
0.05
1.4E-03
No
Difenoconazole
1
0.006
0.006
0.1
2.0E-07
0.01
2.0E-03
No
Deltamethrin
1
0.009
0.009
0.01
3.0E-07
0.01
3.0E-03
No
Fenpyroximate
1
0.028
0.028
0.01
9.2E-07
0.01
9.2E-03
No
Fludioxonil
1
0.019
0.019
0.01
6.2E-07
0.37
1.7E-04
No
Imidacloprid
1
0.035
0.035
0.01
1.2E-06
0.06
1.9E-03
No
Pyridaben
1
0.029
0.029
0.01
9.5E-07
NA
NA
No
Thiophanate-methyl
1
0.012
0.012
0.1
3.9E-07
0.08
4.9E-04
No
Grape
(5)Boscalid
2
(0.009–0.012)
0.01
5
4.5E-06
0.04
1.1E-02
No
Fluopyram
2
(0.267–0.352)
0.331
2
1.6E-04
0.012
1.3E+00
yes
Kiwi(5)
Cypermethrin
1
0.011
0.011
0.05
1.6E-08
0.05
3.1E-05
No
Pyrimethanil
2
(0.006–0.007)
0.006
0.01
1.7E-08
No
Thiabendazole
1
0.015
0.015
0.01
2.1E-08
0.1
2.1E-05
No
Thiamethoxam
1
0.094
0.094
0.01
1.3E-07
0.026
5.2E-04
No
Lemon
(21)2-phenylphenol
2
(0.006–0.014)
0.01
10
5.4E-07
0.4
1.4E-04
No
Cypermethrin
1
0.005
0.005
2
1.4E-07
0.05
2.7E-04
No
Imazalil
6
(0.04–0.542)
0.140
5
2.3E-05
0.025
9.1E-02
No
Imidacloprid
1
0.083
0.9
2.3E-06
0.06
3.8E-03
No
Methomyl
1
0.005
0.01
1.4E-07
0.0025
5.4E-03
No
Pyrimethanil
2
(0.057–0.078)
0.082
8
4.5E-06
NA
NA
No
Pyriproxyfen
1
0.006
0.006
0.6
1.6E-07
NA
NA
No
Thiabendazole
3
(0.014–0.05)
0.04
7
3.3E-06
0.1
3.3E-03
No
Thiamethoxam
2
(0.007–0.009)
0.008
0.15
4.3E-07
0.026
1.7E-03
No
Mandarin (9)
2-phenylphenol
1
0.006
0.006
10
7.4E-07
0.4
1.8E-04
No
Cypermethrin
1
0.002
0.002
2
2.5E-07
0.05
4.9E-04
No
Fludioxonil
2
(0.004–0.011)
0.007
10
1.7E-06
0.37
4.7E-04
No
Imazalil
2
(0.009–0.034)
0.021
5
5.2E-06
0.025
2.1E-02
No
Pyrimethanil
1
0.008
0.008
8
9.8E-07
NA
NA
No
Thiabendazole
1
0.048
0.048
7
5.9E-06
0.1
5.9E-03
No
Orange
(20)2-phenylphenol
2
(0.012–0.014)
0.013
10
1.2E-05
0.4
2.9E-03
No
Chlorpyrifos
1
0.002
0.002
0.01
9.0E-07
0.001
9.0E-02
No
Cypermethrin
2
(0.003–0.005)
0.004
2
3.6E-06
0.05
7.2E-03
No
Imazalil
8
(0.044–0.619)
0.192
4
6.9E-04
0.025
2.8E+00
yes
Pyrimethanil
3
(0.052–0.090)
0.07
8
9.5E-05
NA
NA
No
Thiabendazole
4
(0.027–0.043)
0.034
7
6.1E-05
0.1
6.1E-02
No
Peach
(9)Acetamiprid
1
0.008
0.008
0.01
1.4E-08
0.025
5.7E-05
No
Azoxystrobin
1
0.01
0.01
2
1.8E-08
0.2
8.9E-06
No
Chlorpyrifos
1
0.002
0.002
0.01
3.6E-09
0.001
3.6E-04
No
Difenoconazole
1
0.007
0.007
0.5
1.3E-08
0.01
1.3E-04
No
Fenbuconazole
1
0.174
0.174
0.6
3.1E-07
0.006
5.2E-03
No
Fludioxonil
1
0.036
0.036
10
6.4E-08
0.37
1.7E-05
No
Lambda-Cyhalothrin
1
0.019
0.019
0.15
3.4E-08
0.0025
1.4E-03
No
Malathion
1
0.003
0.003
0.02
5.4E-09
0.03
1.8E-05
yes
Pyrimethanil
1
2.233
2.233
10
4.0E-06
NA
NA
No
Pear
(14)Acetamiprid
1
0.011
0.011
0.4
5.2E-07
0.025
2.1E-03
No
Boscalid
1
0.159
0.159
1.5
7.5E-06
0.04
1.9E-02
No
Chlorantraniliprole
1
0.038
0.038
0.4
1.8E-06
1.56
1.2E-04
No
Chlorpyrifos
1
0.124
0.124
0.01
5.8E-06
0.001
5.8E-01
No
Deltamethrin
1
0.039
0.039
0.1
1.8E-06
0.01
1.8E-02
No
Difenoconazole
1
0.005
0.005
0.8
2.4E-07
0.01
2.4E-03
No
Fludioxonil
3
(0.142–1.807)
1.1
5
1.6E-04
0.37
4.2E-02
No
Lambda-Cyhalothrin
1
0.023
0.023
0.08
1.1E-06
0.0025
4.3E-02
No
Pyraclostrobin
1
0.019
0.019
0.5
9.0E-07
NA
NA
No
Pyrimethanil
2
(0.007–0.055)
0.031
0.3
2.9E-06
NA
NA
No
Tebuconazole
1
0.028
0.028
0.3
1.3E-06
NA
NA
No
Pomegranate
(13)Abamectin
1
0.014
0.014
0.01
2.2E-06
0.0025
8.6E-02
No
Chlorpyrifos
1
0.231
0.231
0.01
3.6E-05
0.001
3.6E+00
yes
Cypermethrin
1
0.005
0.005
0.05
7.7E-07
0.05
1.5E-03
No
Deltamethrin
1
0.064
0.064
0.01
9.9E-06
0.01
9.9E-02
No
Diazinon
1
0.006
0.006
0.01
9.3E-07
0.0002
4.6E-01
No
Emamectin
1
0.025
0.025
0.002
3.9E-06
0.0005
7.7E-01
No
Ethoprophos
1
0.011
0.011
0.01
1.7E-06
0.0004
4.2E-01
No
Fenamiphos
1
0.185
0.185
0.01
2.9E-05
0.0008
3.6E+00
yes
Fludioxonil
1
0.006
0.006
3
9.3E-07
0.37
2.5E-04
No
Indoxacarb
1
0.578
0.578
0.02
8.9E-05
0.006
1.5E+00
yes
Pendimethalin
1
0.027
0.027
0.05
4.2E-06
0.125
3.3E-03
No
4 Discussion
In this study, 161 samples of 12 different types of locally purchased fruits in SA were analyzed for pesticide residues and concomitant health risk. Pesticide residues were found in 151 (94 %) samples. While most analyzed samples (87.4 %) had pesticide residues below MRLs, around 12 % contained pesticide residues above safety limits. Our study revealed that 44 pesticides belonged to different chemical groups were detected in 151 contaminated fruit samples. 40.91 % of the detected pesticides belong to fungicides pesticides. 40.91 % belong to insecticides. 2.72 % belong to herbicides. However, acaricide and nematicides represented 9.09 % and 6.82 % respectively. The findings indicated that eight chemicals were in class U, ten pesticides were in class III (slightly hazardous), twenty-three pesticides were classified as moderately harmful (class II), and three very toxic compounds (class Ib and Ia) were also found. The use of different types of pesticides to protect fruits against pests may accumulate multiple residues in samples (Łozowicka, Kaczyński et al. 2012). Several pesticide residues were found in 1,146 samples of fruits and vegetables in Incheon, Korea belonged to different types of pesticides [15 fungicides (46.9 %), 14 insecticides (43.7 %), 2 herbicides (6.3 %) and 1 growth regulator (3.1 %)] that had different toxicity levels (Park, Kwon et al. 2022). In Egypt, reported pesticide residues were estimated in 176 samples of the most popularly consumed vegetables collected from markets in Dakahlia, Egypt, and revealed that 111 (63.1 %) samples were contaminated with pesticide residues of which 29 samples (16.5 %) had higher than the maximum residue limits (MRL) (Shalaby, Abdou et al. 2021). Moreover, our results revealed that each of 11 types of analyzed samples had multiple of pesticides residues some of these residues exceeds MRLs established by EU may result from misinformed farmers on the proper methods, and pre-harvest intervals for pesticide application. Inadequate supervision by relevant departments, a lack of proper guidance regarding the application of pesticides, and non-compliance with best agricultural practices can also result in contaminated fruit and vegetables, which are thought to pose a risk to consumer health (Li, Nie et al. 2018, Yu, Hu et al. 2018). To assess risk of human exposure to the pesticide residues, individual components of dietary intakes were taken according to 13 GEMS/Food Consumption Cluster Diets based on FAO Food Balance Sheet data from 183 countries (Vandevijvere, Monteiro et al. 2013). Results of the present study showed that the consumption of orange > grapes > pomegranate > banana > mandarin > apple > pear > apricot > fig > lemon > peach > kiwi. Risk assessment was calculated separately for individual pesticides detected positively in each type of collected fruit. The well-developed assessment method considers the average exposure levels in comparison to the ADI values set for specific pesticides. Consumers exposed to persistently harmful pesticide residues would only be at risk for health problems if they consumed more food than the ADI on a daily basis for an extended period of time. The estimated daily intake (EDI) was compared with ADI to calculate hazard Index (HI) and Hazard Risk (HR) if the EDI was less than ADI then HI is less than one that mean there was no hazard risk on consumers (Akoto, Azuure et al. 2016). Our results revealed that most of the investigated samples had hazard index below one so there was no risk dangerous on human health these findings were in consistence within (Liu, Bei et al. 2023). The dietary risk assessment of pesticide residues in analyzed fruit samples revealed that HQa for all pesticides did not exceed the unit value (HQa < 1). Therefore, the pesticide residues in these fruits can be considered safe for human consumption (Hossain, Fakhruddin et al. 2015), and that while the individual and cumulative health risk assessments linked to pesticide exposure in vegetables revealed minimal effects on consumers, the intake of vegetables and fruits can raise concerns due to the consumption of uncooked foods that may be unwashed. As observed in the present study, the most consumed fruits (orange, grapes and pomegranate) were contaminated with fluopyram, imazalil, chlorpyrifos, finamiphos and indoxacarb respectively. In addition to malathion detected in peach with limits exceeding MRLs. Typically, a scientific risk assessment is used to set MRLs (Torres, Picó et al. 1996) and control pesticide residue regulations, which vary among nations because of various agricultural circumstances that directly affect pesticide application rate (Wang, Wang et al. 2013). Exceeding MRLs may be due to non-compliance, contamination from a prior use of persistent pesticides, cross-contamination or spray drift, and/or unexpectedly slow pesticide residue degradation (Wang, Wang et al. 2013). In addition, the calculated HI of the previous detected pesticides in the present study were more than one. These findings suggested that pesticide residues in samples may accumulate over time and could be the root cause of harmful long-term impacts on human health. Health risk would be done if dietary intake exceeded the ADI every day for an extended period of time (Gad Alla, Thabet et al. 2013). As the detected pesticides belongs to different chemical classes long exposure period may elicit cancer development (Araoud, Gazzah et al. 2012). Meanwhile, long-term pesticide exposure to parents or kids can cause a variety of cancers in kids, including brain tumors, lymphomas, leukemia, neurological disorders, colorectal cancer, germ cell cancer, Hodgkin's disease, eye cancer, kidney, liver, thyroid, and skin cancer. However, pesticides are linked to a number of malignancies, including adult leukemia. Cancers of the brain, testicles, lungs, ovary, pancreas, prostate, bladder, kidney, stomach, colon, rectal, lip, and connective tissue (Watts 2012).
The authors acknowledge some limitations. While the fruits were purchased locally, it was difficult to confirm whether they were harvested within or imported elsewhere, since SA imports most of its produce. Further investigations targeting only locally grown crops could provide a clearer picture of the pesticide residue status within the domestic sphere. Lastly, while the use of QuEChERS, LC-MS/MS and GC–MS/MS was chosen for low cost accuracy, the authors do acknowledge emerging techniques for enhanced detection and monitoring of agriculture products such as plasmon enhanced sensors (Singh, Pombeiro et al. 2024), metal organic frameworks (MOFs) based luminescent and electrochemical sensors (Mohan, Singh et al. 2023), nanocomposite platforms(Mohan, Virender et al. 2024) and metal organic framework (MOF) materials (Mohan, Kamboj et al. 2023) should be considered in future studies, in collaboration with experts, to reinforce findings and transfer technology in SA.
5 Conclusions
In conclusion, 161 samples of 12 different types of locally purchased fruits in SA different markets were analyzed for pesticide residues. 44 Pesticide residues were found in 151 (94 %) samples. While most analyzed samples (87.4 %) had pesticide residues below MRLs, around 12 % contained pesticide residues above safety limits. HIs of detected pesticides indicate that majority were less than one and therefore pose no risk. Orange, grapes and pomegranate were the most consumed fruit types contaminated with pesticide residues fluopyram, imazalil, chlorpyrifos, finamiphos and indoxacarb with level exceeds MRLs having HIs > 1. Fruits purchased from SA markets might still be harmful to people's health; thus, care should be taken. Regular monitoring of local agricultural products, as well as using good agricultural practices, is necessary to eventually reduce the usage of highly toxic pesticides. The results provide important information about the current state of pollution in marketed fruits in different Saudimarkets. The obtained data can be used to develop strategies and improve pesticide MRLs for the safe management of vegetables in SA.
Funding
This project was funded by the National Plan for Science, Technology and Innovation (MAARIFAH), King Abdulaziz City for Science and Technology, Kingdom of Saudi Arabia (Award No: 14-ENV2482-02).
CRediT authorship contribution statement
Majed S. Alokail: Writing – review & editing, Funding acquisition, Conceptualization. Manal E.A. Elhalwagy: Writing – original draft, Formal analysis, Data curation. Sherif H. Abd-Alrahman: Writing – review & editing, Supervision, Investigation, Formal analysis. Abdullah M. Alnaami: Writing – review & editing, Methodology, Investigation. Syed D. Hussain: Writing – review & editing, Formal analysis. Osama E. Amer: Writing – review & editing, Investigation, Data curation. Shaun Sabico: Writing – review & editing, Project administration, Investigation. Nasser M. Al-Daghri: Writing – review & editing, Project administration, Investigation.
Acknowledgments
The authors are grateful to the CBCD team for their support.
Declaration of Competing Interest
The authors declare that they have no known competing financial interests or personal relationships that could have appeared to influence the work reported in this paper.
References
- Dissipation of hexythiozox on beans pods by HPLC–DAD. Bull. Environ. Contam. Toxicol.. 2013;90:504-507.
- [Google Scholar]
- Dissipation rate of different commercial formulations of propamocarb-hydrochloride applied to potatoes using HPLC–DAD. Arab. J. Chem.. 2016;9:S1402-S1405.
- [Google Scholar]
- Pesticide residues in water, sediment and fish from Tono Reservoir and their health risk implications. Springerplus. 2016;5(1):1-11.
- [Google Scholar]
- Increased cancer burden among pesticide applicators and others due to pesticide exposure. CA Cancer J Clin. 2013;63(2):120-142.
- [Google Scholar]
- Monitoring of pesticide residues in Saudi Arabia agricultural soils. Res. J. Environ. Sci.. 2011;5(3):269.
- [Google Scholar]
- Rapid multi-residue method for the determination of pesticide residues in human serum. Afr. J. Biotechnol.. 2012;11(62):12579-12585.
- [Google Scholar]
- The global distribution of acute unintentional pesticide poisoning: estimations based on a systematic review. BMC Public Health. 2020;20(1):1875.
- [Google Scholar]
- EFSA, E. F. S. A. (2007). Guidance Document for the use of the Concise European Food Consumption Database in Exposure Assessment. EFSA J. 438. EFSA, EFSA. EFSA/DATEX/2008/01.
- Farha, W., A. M. Abd El-Aty, M. M. Rahman, J. H. Jeong, H. C. Shin, J. Wang, S. S. Shin and J. H. Shim (2018). “Analytical approach, dissipation pattern and risk assessment of pesticide residue in green leafy vegetables: A comprehensive review.” Biomed Chromatogr 32(1).
- Monitoring and risk assessment of pesticide residues in some Egyptian vegetables. Middle East Journal of Applied Sciences. 2013;3(4):216-230.
- [Google Scholar]
- Pesticide-residue analysis in soils by the QuEChERS method: A review. Molecules. 2022;27(13):4323.
- [Google Scholar]
- Health risk assessment of selected pesticide residues in locally produced vegetables of Bangladesh. Int. Food Res. J.. 2015;22(1):110.
- [Google Scholar]
- Life cycle human toxicity assessment of pesticides: comparing fruit and vegetable diets in Switzerland and the United States. Chemosphere. 2009;77(7):939-945.
- [Google Scholar]
- An Improved Multiresidue Procedure for Determination of Pesticides in Vegetables. Pestic. Res. J.. 2001;13:32-35.
- [Google Scholar]
- Dissipation behavior and risk assessment of butralin in soybean and soil under field conditions. Environ Monit Assess. 2017;189(9):476.
- [Google Scholar]
- A monitoring survey and dietary risk assessment for pesticide residues on peaches in China. Regul. Toxicol. Pharm.. 2018;97:152-162.
- [Google Scholar]
- Pesticide residues risk assessment and quality evaluation of four characteristic fruits in Zhejiang Province, China. Front. Environ. Sci.. 2023;11:1124094.
- [Google Scholar]
- Pesticide residues in raspberries (Rubus idaeus L.) and dietary risk assessment. Food Additives and Contaminants: Part B. 2012;5(3):165-171.
- [Google Scholar]
- Mohan, B., Virender, R. K. Gupta, A. J. Pombeiro, A. A. Solovev and G. Singh (2024). “Advancements in Metal‐Organic, Enzymatic, and Nanocomposite Platforms for Wireless Sensors of the Next Generation.” Advanced Functional Materials: 2405231.
- Metal-organic frameworks (MOFs) materials for pesticides, heavy metals, and drugs removal: Environmental safety. Sep. Purif. Technol.. 2023;310:123175
- [Google Scholar]
- Metal-organic frameworks (MOFs) based luminescent and electrochemical sensors for food contaminant detection. J. Hazard. Mater.. 2023;453:131324
- [Google Scholar]
- Modified matrix solid phase dispersion-HPLC method for determination of pesticide residue in vegetables and their impact on human health: A risk assessment. Front Chem. 2022;10:1084350.
- [Google Scholar]
- Supply of Fruit and Vegetables for Consumption Health at a Glance: Europe 2010. Paris: O. Publishing; 2010.
- Organization), W. W. H. (2010). 2010. Inventory of IPCS and Other WHO Pesticide Evaluations and Summary of Toxicological Evaluations Performed by the Joint Meeting on Pesticide Residues (JMPRs).
- Monitoring of pesticide residues in vegetables marketed in Al-Qassim region, Saudi Arabia. Ecotoxicol. Environ. Saf.. 2010;73(6):1433-1439.
- [Google Scholar]
- Estimated daily intake of pesticide residues exposure by vegetables grown in greenhouses in Al-Qassim region, Saudi Arabia. Food Control. 2011;22(6):947-953.
- [Google Scholar]
- Detection of pesticide residues and risk assessment from the local fruits and vegetables in Incheon, Korea. Sci. Rep.. 2022;12(1):9613.
- [Google Scholar]
- Risk assessment of fungicide pesticide residues in vegetables and fruits in the mid-western region of China. J. Food Compos. Anal.. 2021;95:103663
- [Google Scholar]
- Market basket survey for some heavy metals in Egyptian fruits and vegetables. Food Chem Toxicol. 2006;44(8):1273-1278.
- [Google Scholar]
- Evaluation of Pesticide Residues in Vegetables from the Asir Region, Saudi Arabia. Molecules. 2020;25(1)
- [Google Scholar]
- Current situation of pesticide consumption and poisoning in Saudi Arabia. Journal of Entomology and Zoology Studies. 2016;4(3):153-158.
- [Google Scholar]
- SANTE (2021). Analytical Quality Control and Method Validation Procedures for Pesticide Residues Analysis in Food and Feed.
- Sarkar, S., J. D. B. Gil, J. Keeley and K. Jansen (2021). The use of pesticides in developing countries and their impact on health and the right to food.
- Multi-residues Analysis of Pesticides using Gas Chromatography Mass Spectrometry: I- Leafy Vegetables. Res. J. Environ. Sci.. 2011;5:248-258.
- [Google Scholar]
- S.E. Shalaby G.Y. Abdou I.M. El-Metwally G. Abou-elella Health risk assessment of pesticide residues in vegetables collected from Dakahlia, Egypt J. Plant Prot. Res. 2021 254–264-254-264.
- Simultaneous determination of 200 pesticide residues in honey using gas chromatography-tandem mass spectrometry in conjunction with streamlined quantification approach. J Chromatogr A. 2016;1427:142-160.
- [Google Scholar]
- Plasmon-enhanced fluorescence sensors for food and environmental samples monitoring. Microchem. J.. 2024;109888
- [Google Scholar]
- Determination of pesticide residues in fruit and vegetables. J. Chromatogr. A. 1996;754(1–2):301-331.
- [Google Scholar]
- Exposure Routes and Health Risks Associated with Pesticide Application. Toxics. 2022;10(6)
- [Google Scholar]
- Biodynamic agriculture research progress and priorities. Renewable Agric. Food Syst. 2009;24(2):146-154.
- [Google Scholar]
- US-EPA (2018). Residue Chemistry Test Guidelines and 860.1500 Crop Field Trials.
- Informas, Monitoring and benchmarking population diet quality globally: a step-wise approach. Obes. Rev.. 2013;14:135-149.
- [Google Scholar]
- Pesticide residues in market foods in Shaanxi Province of China in 2010. Food Chem.. 2013;138(2–3):2016-2025.
- [Google Scholar]
- Flexible Vis/NIR wireless sensing system for banana monitoring. Food Qual. Saf.. 2023;7
- [Google Scholar]
- Flexible wireless in situ optical sensing system for banana ripening monitoring. J. Food Process Eng. 2023;46(12):e14474.
- [Google Scholar]
- Human health impacts of exposure to pesticides. Contract ref: WWF Australia; 2012. p. :11005.
- A Critical Scoping Review of Pesticide Exposure Biomonitoring Studies in Overhead Cultures. Toxics. 2022;10(4)
- [Google Scholar]
- Successive monitoring surveys of selected banned and restricted pesticide residues in vegetables from the northwest region of China from 2011 to 2013. BMC Public Health. 2018;18(1):1-9.
- [Google Scholar]
- Flexible Vis/NIR sensing system for banana chilling injury. Postharvest Biol. Technol.. 2024;207:112623
- [Google Scholar]
Appendix A
Supplementary data
Supplementary data to this article can be found online at https://doi.org/10.1016/j.arabjc.2024.105993.
Appendix A
Supplementary data
The following are the Supplementary data to this article:Supplementary Data 1
Supplementary Data 1


