

Translate this page into:
Pharmacokinetics and metabolomics of the new psychoactive substance 4-chloroethylcathinone
⁎Corresponding authors. liusq@seu.edu.cn (Songqin Liu), cpuzjy@cpu.edu.cn (Junying Zhang), shuchang@cpu.edu.cn (Chang Shu)
-
Received: ,
Accepted: ,
This article was originally published by Elsevier and was migrated to Scientific Scholar after the change of Publisher.
Peer review under responsibility of King Saud University.
Abstract
Synthetic 4-Chloroethcathinone (4-CEC) is a derivative of cathinone that belongs to one of the more severe abused substances among new psychoactive substances (NPS). Current researches on 4-CEC mainly focus on metabolite identification studies, and there is a lack of researches on pharmacokinetic, tissue distribution and metabolomics studies in vivo. A sensitive and reliable LC-MS/MS assay was developed and validated for the determination of 4-CEC concentrations in plasma and tissue homogenates. According to the pharmacokinetic results, the absorption and elimination of 4-CEC were faster after administration. The Cmax was 1896 ± 876 ng/ml, the peak time Tmax was 10.1 ± 9.2 min, and the elimination half-life t1/2 was 100.4 min. Metabolomics studies showed that the highest concentrations of 4-CEC were found in brain, lung, kidney and liver. The results of tissue biopsy showed that the liver, kidney and brain tissue had a certain degree of damage. After 4-CEC administration, amino acid-related metabolism and biosynthesis, lipid metabolism, niacin and niacinamide metabolism in mice were interfered, suggesting that 4-CEC could cause energy metabolism disorder in mice. The metabolic pathways and toxicity mechanisms related to 4-CEC entry into the body were explained at the overall metabolic level by multivariate data analysis, screening and identification of differential metabolites and metabolic pathway analysis.
Keywords
4-Chloroethylcathinone
New psychoactive substance
Pharmacokinetics
Untargeted metabolomics

1 Introduction
Since the beginning of the 21st century, New Psychoactive Substances (NPS) have spread rapidly and been abused in the international “entertainment market”. In 2013, the United Nations Office on Drugs and Crime (UNODC) defined NPS as “substances of abuse in the form of pure substances or mixed preparations, which are not controlled by the Single Convention on Narcotic Drugs of 1961 or the Convention on Psychotropic Substances of 1971 but may pose a threat to public health”(Pieprzyca et al., 2020). NPS include a wide range of synthetic or plant-based substances, including synthetic cannabinoids, synthetic cathinones, phenylethylamines, piperazines, tryptamines, amininhydrins, and new synthetic opioids, among others. Among them, synthetic cathinones and phenylethylamines, as the main representatives of stimulants, occupy a considerable proportion in the international market (Valente et al., 2014). 4-Chloroethcathinone (4-CEC) belongs to ethylcathinones, i.e., ethyl is attached to the basic side chain -N- of the cathinone structure, and has a -Cl substitution on the benzene ring para position. 4-CEC was first reported in the annual report of the European Monitoring Centre for Drugs and Drug Addiction (EMCDDA) in 2016. At present, the research on 4-CEC mainly involves the qualitative and quantitative analysis of seized samples. Ye Haiying et al. used gas chromatography-mass spectrometry (GC–MS), direct analysis in real time high-resolution mass spectrometry (DART-MS) and nuclear magnetic resonance spectroscopy (NMR) to detect suspicious samples, eliminate isomer interference, and identify it as 4-chloroethcaxidone. Lopes et al. (Lopes et al., 2021) co-incubated four para-substituted synthetic cathinones, including 4-CEC, with human and rat liver microsomes for metabolic study, and used liquid chromatography-high-resolution tandem mass spectrometry (LC-HRMS/MS) to identify phase I metabolites and glucoside metabolites. Fabregat-Safont et al. (Fabregat-Safont et al., 2020) incubated 4-CEC with mixed human hepatocytes and used high resolution mass spectrometry (UHPLC-HRMS) to evaluate the metabolic behavior (Jalalvand et al., 2019). The results showed that no significant metabolism of 4-CEC occurred, suggesting that the parent compound should be used as a biomarker for monitoring 4-CEC consumption. However, Lea Wagmann et al. (Wagmann et al., 2020) studied the metabolism of 4-CEC using actual human blood and urine samples, while using mixed human liver S9 fraction (pS9) cultured in vitro. Nine metabolites of 4-CEC were found by LC-HRMS/MS and GC–MS analysis. There are four different monooxygenase isoforms involved in the phase I metabolic transformation of 4-CEC. In mixed human liver microsomal metabolic stability studies, 4-CEC was considered as low clearance compound.
In response to the increasing cases of poisoning and death caused by the increasing use of synthetic cathinones, conducting metabolic kinetic studies of the drug can provide more information about the in vivo dynamics, which is essential for analysis and comprehensive risk assessment (Shima et al., 2011; Martínez-Clemente et al., 2013; Minaeva et al., 2021; Minaeva et al., 2023; Chang et al., 2017; Šíchová et al., 2018; Zeng et al., 2020). The most common methods of ingestion of synthetic cathinone are inhalation (nasal aspiration), swallowing, sublingual or rectal administration, intramuscular injection or intravenous injection (Czerwinska et al., 2021). Among them, it has been reported that the pharmacokinetic characteristics of intraperitoneal injection of psychostimulants in rodents is similar to those observed when inhaled. The commonly used analytical methods are mainly the quantitative analysis of cathinone synthesis in blood, urine or related tissues by LC-MS/MS and GC–MS (Štefková et al., 2017). At present, most studies on 4-CEC involve the analysis of in vitro samples, and no information is available on its in vivo pharmacokinetics and tissue distribution data. Understanding the pharmacokinetics of 4-CEC may provide clues for its mechanism of action. Alternatively, the pharmacokinetic data of 4-CEC in animal models can help forensic toxicologists explain the findings in human subjects exposed to 4-CEC.
In this study, a sensitive and accurate LC-MS/MS method was established to determine the concentration of 4-CEC in biological samples such as plasma and tissue. The method was accurate and sensitive, and was used for pharmacokinetic and tissue distribution studies of 4-CEC. Based on high resolution mass spectrometry metabonomics technology, we screened characteristic differential metabolites related to 4-CEC entry, clarified the metabolic pathway disturbed by 4-CEC through metabolic pathway analysis and functional enrichment, and explained the toxicological mechanism of 4-CEC abuse from the metabolic level. The research results can provide an important basis for formulating treatment strategies and provide new ideas in the field of drug abuse.
2 Experiment
2.1 Reagents and materials
Chloroethylcathinone stock solution (50.00 mg/ml provided by Nanjing Public Security Bureau), Olaparib control (Yadu Jingwei Information Technology Co., Ltd.), acetonitrile (chromatographic purity, MERCK, USA), methanol (chromatographic purity, TEDIA, USA), L-2-chlorophenylalanine (purity 97%, Shanghai Bide Pharmaceutical Technology Co., Ltd.), ALT, AST and creatinine assay kit (Nanjing Jiancheng Institute of Biological Engineering), paraformaldehyde (Sinopharm Group Chemical Reagent Co. Ltd.), saline (Anhui Shuanghe Pharmaceutical Co., Ltd.) formic acid, ammonium acetate, ethyl acetate (all are analytically pure, Nanjing Chemical Reagent Co., Ltd.); sodium heparin (purity greater than 98%, Nanjing Chunqiu Biological Engineering Co., Ltd.), the rest of reagents are analytically pure, and water is deionized water.
2.2 Analytical methods
2.2.1 HPLC-MS/MS method of pharmacokinetic study
The pharmacokinetic study was performed on Thermo Scientific UPLC-TSQ MS coupled system (with UliMate 3000 UPLC ultra performance liquid chromatograph, electrospray ionization ion source ESI, Finnigan TSQ Quantum Ultra mass analyzer, Xcalibur data analysis software). The chromatographic column is Zorbax RX-C18 (4.6 × 250 mm, 5 μm). The pre-column is ANGELA C18cartridegs (4.0 × 10 mm). The mobile phase was 10 mM ammonium acetate aqueous solution (containing 0.1% formic acid) and acetonitrile (20:80, v/v). The flow rate was 0.4 ml/min. The column temperature was 40 °C and the injection volume was 20 μl.
Ionization mode was positive ion pneumatic assisted electron spray ionization (ESI) with multiple reaction monitoring (MRM) mode. Spray voltage is 3500 V, capillary temperature is 350 °C, sheath gas pressure is 20 Arb and auxiliary air pressure is 5 Arb. The ion pairs monitored of 4-CEC is m/z 212.1 → 194.1 with collision energy (CE) is 22 V. The ion pairs monitored of Internal standard is m/z 435.2 → 281.1 with CE is 23 V.
2.2.2 UPLC-MS/MS method of metabonomics study
The metabonomics study was performed on Thermo Scientific Q Exactive combination quadrupole orbitrap mass spectrometer (with HESI ion source, ion lens system, quadrupole mass filter, Orbitrap mass analyzer, C-Trap, HCD collision chamber) coupled with UltiMate 3000 UPLC, BSA124S electronic balance (Sartorius Scientific Instruments Co., Ltd.). The pre-column is ACQUITY UPLC HSS T3(1.8 μm). The chromatographic column is ACQUITY UPLC HSS T3(1.8 μm, 2.1 × 100 mm, Waters), and the mobile phase consists of 0.1% formic acid water solution (A) and 0.1% formic acid acetonitrile solution (B). The column temperature was 40 °C. The flow rate is 0.4 ml/min. The automatic sampler temperature is 8 °C and the injection volume was 5 μl.The samples were eluted by gradient, with 5% of phase B at 0 ∼ 2.5 min, 5%∼95% of phase B at 2.5 ∼ 18 min, 95%∼5% of phase B at 18 ∼ 21.5 min, 95%∼5% of phase B at 21.5 ∼ 22 min, and 5% of phase B at 22 ∼ 27 min. The mobile phase enters the mass spectrum at 0 ∼ 21.5 min, and the valve is switched to waste liquid at 21.5 min.
The mass spectrometry was performed using a Heated Electron Spray Ionization (HESI) source in the positive ion mode with Full MS/dd MS2 mode: The primary scanning mode was Full MS, and the parameters were as follows: the scanning range is 60–900 m/z, the resolution is 70,000 FWHM, and the AGC target is 3 × 10⁶, Maximum IT is 200 ms, sheath gas flow rate is 40 AU, auxiliary gas flow rate is 10 AU, purge gas flow rate is 1 AU, S-lens voltage is 50 AU, electric spray voltage is 3.5 kV, capillary temperature is 320 °C, auxiliary gas temperature is 350 °C. The secondary scanning mode is Full MS/dd MS2. The dd-MS2 parameters are as follows: the resolution is 17,500 FWHM, and the AGC target is 1 × 10⁵, Maximum IT is 50 ms, NCE is 10, 25, 40, and other parameters are the same as those in Full MS mode.
2.3 Pharmacokinetic studies
2.3.1 Animal feeding
Healthy ICR mice (SPF clean grade), male, 18–22 g, purchased from the Center for Comparative Medicine of Yangzhou University (No.202208748, Animal License No. SCXK2017-0007). The experimental animals were kept in a constant temperature environment (25 ± 2 °C) for 12 h alternating day and night, and fed and watered freely; fasted and watered freely 12 h before drug administration.
2.3.2 Plasma samples pretreatment
ICR mice were randomly divided into 11 groups (1 group at 1 time point), 5 mice in each group, and administered intraperitoneally at a dose of 40 mg/kg. At 0 min, 5 min, 10 min, 15 min, 30 min, 1 h, 2 h, 4 h, 6 h, 8 h, 10 h and 12 h after drug administration, about 0.3 ml of blood was collected from the orbital venous plexus, placed in a centrifuge tube treated with heparin sodium, centrifuged at 14000 rpm for 5 min, and the supernatant plasma was stored at −70 °C for testing.
Take 50 µl of plasma sample, put it in a 2 ml centrifuge tube, add 20 µl each of internal standard working solution, mix well, add 1 ml of ethyl acetate, vortex for 3 min, and centrifuge at 14000 rpm for 5 min. The supernatant was pipetted 920 µl into a clean centrifuge tube and concentrated to dryness under vacuum at 40 °C. The residue was re-dissolved by adding 80 µl of 10 mM aqueous ammonium acetate (containing 0.1% formic acid) and acetonitrile (20:80, v/v), vortexed for 3 min and centrifuged at 14000 rpm for 5 min, and the supernatant was extracted for LC-MS/MS analysis.
2.3.3 Tissue samples pretreatment
Mice were rapidly executed at 15 min, 30 min, 2 h, 4 h, 6 h, 8 h and 12 h. At the same time, collect the heart, lung, liver, kidney, spleen and brain tissues, wash them with normal saline immediately, absorb the residual water with filter paper, weigh them accurately, and store them at − 70 °C for testing.
Each tissue samples were taken, weighed precisely, and homogenized after adding normal saline 1:3 (w/v). Take 200 µl of tissue homogenate, place it in a 2 ml centrifuge tube. Add 20 µl each of internal standard working solution, mix well, add 1 ml of ethyl acetate, mix well, vortex for 3 min and centrifuge at 14000 rpm for 5 min. The supernatant was pipetted 920 µl into a clean centrifuge tube and concentrated to dryness under vacuum at 40 °C. The residue was re-dissolved by adding 80 µl of 10 mM aqueous ammonium acetate (containing 0.1% formic acid) and acetonitrile (20:80, v/v), vortexed for 3 min and centrifuged at 14000 rpm for 5 min, and the supernatant was extracted for LC-MS/MS analysis.
2.4 Metabolomics studies
2.4.1 Animal experiments
The 20 ICR mice were randomly divided into 3 groups. For 7 day administration group (n = 7), mice were given intraperitoneal injection of 4-CEC administration solution (40 mg/kg) at the same time period for 7 consecutive days. For 2 h administration group (n = 7), mice were given single intraperitoneal injection of 4-CEC administration solution (40 mg/kg). Mice were given intraperitoneal injection of the same volume of saline at the same time point for control group (n = 6). The diet and water intake, activity and health status of control and drug-administered mice were observed and recorded daily.
2.4.2 Biological samples pretreatment
At 2 h after the first administration (day 1) and 24 h after the last administration (day 7), about 0.4 ml of blood was collected from the orbital venous plexus of mice and placed in a centrifuge tube. Leave the collected whole blood at room temperature for 1 h, then centrifuged at 3000 rpm for 10 min at 4 °C, and the supernatant was extracted to obtain the serum sample. The serum samples were divided and stored at −70 °C for testing. The serum samples were thawed on ice and vortexed briefly for 5 s to homogenize them. Added 40 μl serum into a centrifuge tube, add 160 μl pre-cooled internal standard working solution, vortex for 3 min, then stand on ice for 20 min and centrifuge at 14000 rpm for 10 min at 4 °C 0.100 μl of supernatant was taken and diluted with 0.5 times 0.1% formic acid solution for UPLC Q-Exactive MS analysis. The mice were executed immediately after blood collection and dissected. Liver, kidney and brain tissues were taken for HE section staining.
2.4.3 Determination of biochemical indicators
AST(glutamic aminotransferase) and ALT (glutamic alanine aminotransferase) are important indicators for the evaluation of liver function. Take a 96-well plate, add 20 μl of preheated AST (or ALT) matrix solution at 37 °C to each well, add 5 μl of serum samples to be measured in the test wells and aspirate and mix repeatedly, while the control well was not added, and the samples were placed in a 37 °C water bath for 30 min. Subsequently, add 20 μl of 2, 4-dinitrophenylhydrazine solution to each well, and add 5 μl of blank serum sample to the control well. Suck and mix repeatedly, and put it in a water bath at 37 °C for 20 min. Finally, add 0.4 mmol/L NaOH solution 200 μl into each hole. Evenly mix, place at room temperature for 15 min, and record the OD value of each well by the microplate reader. Calculate the absolute OD value of the serum to be tested (OD value of the test well - OD value of the control well), and calculate the corresponding ALT and AST activity according to the standard curve.
Creatinine is a common indicator of renal function. In a 96-well plate, 6 μl of assay serum, standard and double-distilled water were added to the assay group, standard group and blank group respectively. Then add enzyme solution A 180 μl into each well. After incubate at 37 °C for 5 min, and measure the absorbance value A1. Finally, 60 μl of enzyme solution B was added to each well and the absorbance value A2 was measured after incubation at 37 °C for 5 min.
2.5 Data processing
WinNonlin software was applied to analyze the 4-CEC blood concentration–time data using a non-atrial model to calculate pharmacokinetic parameters by statistical moments, and t-test was applied to statistically analyze the experimental data. Multivariate statistical analysis (PCA, PLS-DA and OPLS-DA analysis) was performed on the normalized data by SIMCA 14.1 software, and the screening of differential metabolites between groups was performed by the VIP of variable weight values obtained from the OPLS-DA model. Using IBM SPSS Statistics 22 Software to test the normality and chi-square of the samples. Kruskal-Wallis was selected to test the statistical differences of the samples. Using VIP > 1 and adjusted P < 0.05 as screening criteria, the excimer ions were introduced into the HMDB (Human Metabolome Database) database (https://www.hmdb.ca/) for preliminary identification of metabolites within a mass accuracy of 20 ppm. According to the identification results, the secondary MS/MS fragments were matched with the mass spectrograms collected in HMDB database to further confirm the metabolite structure. The structurally confirmed differential metabolites were imported into MetaboAnalyst 5.0 (https://www.metaboanalyst.ca/), an online comprehensive analysis platform for quantitative metabolomic data, for metabolic pathway analysis.
3 Results and discussion
3.1 Validation of analytical methods
3.1.1 LC-MS/MS method
Different compositions and proportions of mobile phase were investigated in this experiment. When methanol was used as the organic phase, the peak shape was wider. After switching to acetonitrile, the elution capacity became stronger, the retention time shifted forward and the peak shape was sharp, which shortened the analysis time, so acetonitrile was finally selected as the organic phase. The chromatographic behaviors of pure water, 0.1 % formic acid aqueous solution, 10 mM ammonium acetate solution and 10 mM ammonium acetate (containing 0.1 % formic acid) aqueous solution as the aqueous phase were investigated, and it was found that the addition of ammonium acetate buffer salt to the aqueous phase was beneficial to improve the peak trailing. Since this experiment uses a positive ion detection mode, adding an appropriate amount of acid can promote ionization and improve the ionization efficiency, it was finally determined that 0.1 % formic acid was added to 10 mM ammonium acetate solution as the aqueous phase. The experiment investigated the peak of 4-CEC when the proportion of organic phase gradually increased from 30% to 80%. It was found that the 4-CEC peaks emerged later when the organic phase ratio was lower. When the ratio of acetonitrile was increased to 80 %, the peak shape of 4-CEC was symmetrical with the internal standard, the baseline was stable, and the peak appeared earlier, which shortened the analysis time of each needle sample and allowed the separation by isocratic elution. Therefore, 10 mM ammonium acetate (0.1 % formic acid) and acetonitrile (20:80, v/v) was selected as the mobile phase and the isometric elution method was adopted.
Mass spectrometric ESI full scan of 4-CEC and internal standard showed a strong response in positive ion mode. The corresponding detection ion pairs were formed, and the collision energy was optimized in the multiple reaction monitoring (MRM) mode, with the following results: 4-CEC m/z 212.1 → 194.1 (Fig. 1a), collision energy 22 V; internal standard olaparib m/z 435.2 → 281.1 (Fig. 1b), collision energy 23 V; tube lens 24 and 32, respectively. The mass spectrometry parameters such as spray voltage, capillary temperature, sheath gas pressure and auxiliary gas pressure were optimized to achieve the optimal response of the selected ions to the MS, and the optimized results were: spray voltage 3500 V, capillary temperature 350 °C, sheath gas pressure 20 Arb and auxiliary gas pressure 5 Arb.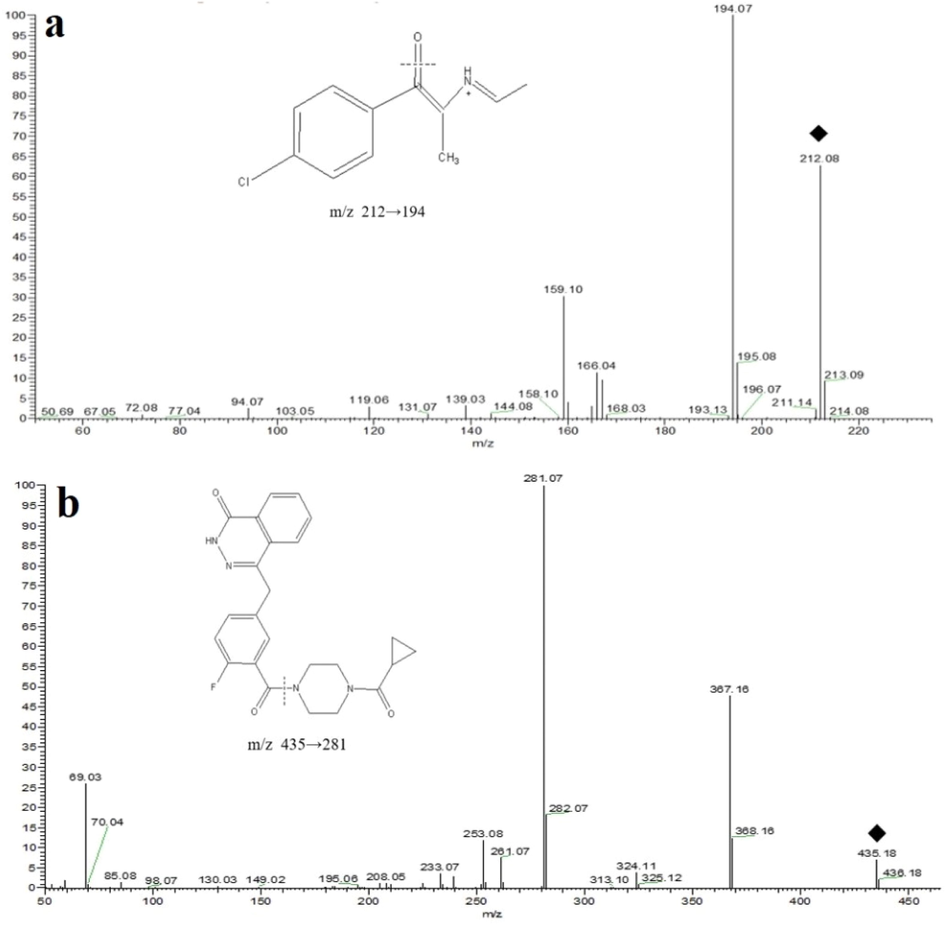
Product ion scan and cleavage pathways of 4-CEC (a) and olaparib (b).
3.1.2 Method validation
3.1.2.1 Specificity
To investigate whether endogenous substances in biological samples have any effect on the determination of 4-CEC and internal standard, mouse blank plasma or liver tissue homogenate, mouse blank plasma or liver tissue homogenate with standard working solution and internal standard working solution, and plasma samples or liver tissue after mouse administration were analyzed respectively as shown in Fig. S1. Under these chromatographic conditions, the determination of 4-CEC and internal standard was not affected by the interference of endogenous substances in plasma and tissue homogenates, with stable baseline and good peak shape. The method has high specificity and is capable of determining the concentration of 4-CEC in plasma and tissue homogenate. Fig. S1a-d are the blank samples of mouse plasma and liver, respectively. Fig. S2e-h are the blank samples of mouse plasma and liver with 4-CEC and internal standard, respectively. Fig. S2i-l are the chromatograms of the actual samples of mouse plasma and liver, respectively.
3.1.2.2 Linear range
50 µl of mouse blank plasma (or 200 µl of blank tissue homogenate) was added to 20 µl of different concentrations of the working solution series (1.000, 2.000, 5.000, 20.00, 50.00, 200.0, 500.0, 900.0 and 1000 ng/ml), respectively. LC-MS/MS analysis was performed according to the item “biological sample pretreatment”, and the peak areas of 4-CEC (As) and internal standards (Ai) were recorded. The ratio of the two peak areas (As/Ai) was calculated, and the concentration C (ng/ml) was fitted by the weight regression with the weight factor of 1/C2. The weight regression equation of the standard curve is shown in Table S1, and 4-CEC has a good linear relationship in the concentration range of 1.000–1000 ng/ml in plasma and tissue homogenate.
3.1.2.3 Precision and accuracy
Placing 50 μ l of blank plasma (200 μ l of blank liver homogenate) into a centrifuge tube and adding four different concentrations of 20 μl of working fluid respectively to prepare high concentration (800.0 ng/ml), medium concentration (250.0 ng/ml), medium low concentration (40.00 ng/ml) and low concentration (5.000 ng/ml) QC samples containing drugs were prepared in three analytical batches according to the operation under “Biological Sample Pretreatment”. Five copies of each concentration were prepared in parallel for each batch. The chromatograms were recorded, and the measured concentrations were calculated by substituting the accompanying standard curves, and the intra- and inter-batch precision and accuracy were calculated, and the results are shown in Table 1. The results showed that the accuracy of 4-CEC in plasma and liver was within the range of 80%∼120%, and the RSD of intra- and inter-batch precision was less than 15%, which met the analytical requirements of biological samples. conc.: concentration; SD: Standard Deviation; RSD: relative standard deviation; n: number of replicates; Diff: Deviation of the mean concentration from the labeled concentration.
Sample
Added Con. (ng/ml)
Concentration (ng/ml, Mean ± SD)
Precision RSD(%)
Accuracy (%)
intra-batch
inter-batch
Plasma
5.000
5.391 ± 0.891
10.5
12.1
107.8
40.00
42.29 ± 1.13
6.5
11.2
105.7
250.0
275.7 ± 1.4
10.3
5.9
110.3
800.0
821.7 ± 21.3
4.0
6.9
102.7
Liver
5.000
4.481 ± 0.233
10.1
13.5
89.60
40.00
43.34 ± 3.61
2.2
5.3
108.4
250.0
262.5 ± 10.8
1.8
4.7
105.0
800.0
841.6 ± 18.3
3.2
9.2
105.2
3.1.2.4 Extraction recovery and matrix effect
Blank matrix supernatant: take blank plasma and liver homogenate samples, and operate according to the item of “sample pretreatment”, except that no internal standard is added, to prepare blank matrix supernatant. Take 50 µl of blank plasma (200 µl of blank liver homogenate), add 20 µl of different concentrations of working solution, and prepare QC samples containing drugs at high (800.0 ng/ml), medium (250.0 ng/ml), low (40.00 ng/ml) and medium (5.000 ng/ml) concentrations, prepare 5 copies of each concentration in parallel, and analyze them. The chromatographic peak area A was obtained by analysis under “1.2.4 Sample pretreatment”; another blank matrix supernatant was taken and added to the working solution of corresponding mass concentration, and the chromatographic peak area B was obtained after analysis; another working solution of the substance to be measured and the internal standard solution were taken and analyzed without extraction into the sample to obtain the chromatographic peak area C of the pure solution. The results are shown in Table S2. The extraction recoveries of 4-CEC in plasma and liver tissue homogenate were 80.47–96.39 % and 87.43–99.25 %, respectively. The recovery of internal standard extraction was greater than 80 % and the recovery was stable; the matrix effect was in the range of 85.47–104.37 %, which was negligible.
3.1.2.5 Stability
Take 50 µ l of blank mouse plasma, add 20 µ l of series of working solutions with different concentrations respectively, prepare drug containing plasma samples with low (5.000 ng/ml) and high (800.0 ng/ml) concentrations respectively, prepare 3 samples in parallel, and analyzed by LC-MS/MS immediately according to the operation under “sample pretreatment”; At the same time, the stability of the samples was investigated at room temperature for 8 h, repeated freeze-thawing at −20 °C for three times, autosampler (8 °C) for 12 h and −70 °C for one week, respectively. The above samples were analyzed by LC-MS/MS, substituted into the accompanying calibration curves to obtain the measured concentrations, and the RE and RSD were calculated to investigate the stability. It can be seen from Table S3 that the sample has good stability under the above conditions.
3.1.2.6 Dilution effect
Take 40 µ l of blank plasma, add standard working solution and mix well to prepare a drug containing plasma sample with a concentration of 10.00 µ g/ml. Take 20 µ l of the prepared drug containing plasma, and then add 180 µ l of blank plasma. The plasma was then diluted 10 times and analyzed by LC-MS/MS according to the procedure under “Sample Pretreatment”. Record the chromatogram, and substitute it into the accompanying standard curve to calculate the measured concentration, and calculate the precision and accuracy. As shown in Table S4, the precision of 4-CEC dilution was good, and the determination results were accurate and reliable, so the samples exceeding the upper limit of quantification could be determined by dilution test.
3.2 Pharmacokinetics
The mean blood concentration–time curve of 4-CEC in mice after intraperitoneal administration is shown in Fig. 2a. After intraperitoneal injection of 4-CEC into mice, plasma concentrations of 4-CEC increased rapidly, reaching a maximum level at approximately 10 min. After that, the blood concentration decreases rapidly to a lower level within 10 min to 2 h, and then the concentration continues to decrease slowly until 12 h. Using WinNonlin 6.4 software to analyze the data of plasma drug concentration, using non-atrioventricular model to calculate pharmacokinetic parameters by statistical moment. As shown by the results of pharmacokinetic parameters (Table 2), the absorption and elimination of 4-CEC were faster in mice after intraperitoneal injection of 4-CEC. The peak concentration Cmax was 1896 ± 876 ng/ml, the peak time Tmax was 10.1 ± 9.2 min, i.e. the maximum blood concentration could be reached in about 10 min, and the elimination half-life t1/2 was 100.4 min. The apparent volume of distribution Vd was 52.2 L/kg, which was larger than the volume of body fluid, indicating that 4-CEC was widely distributed in various tissues of mice. The clearance rate of mice was 0.36 L/min/kg, suggesting that 4-CEC was eliminated quickly in plasma. SD: Standard Deviation; n: number of replicates.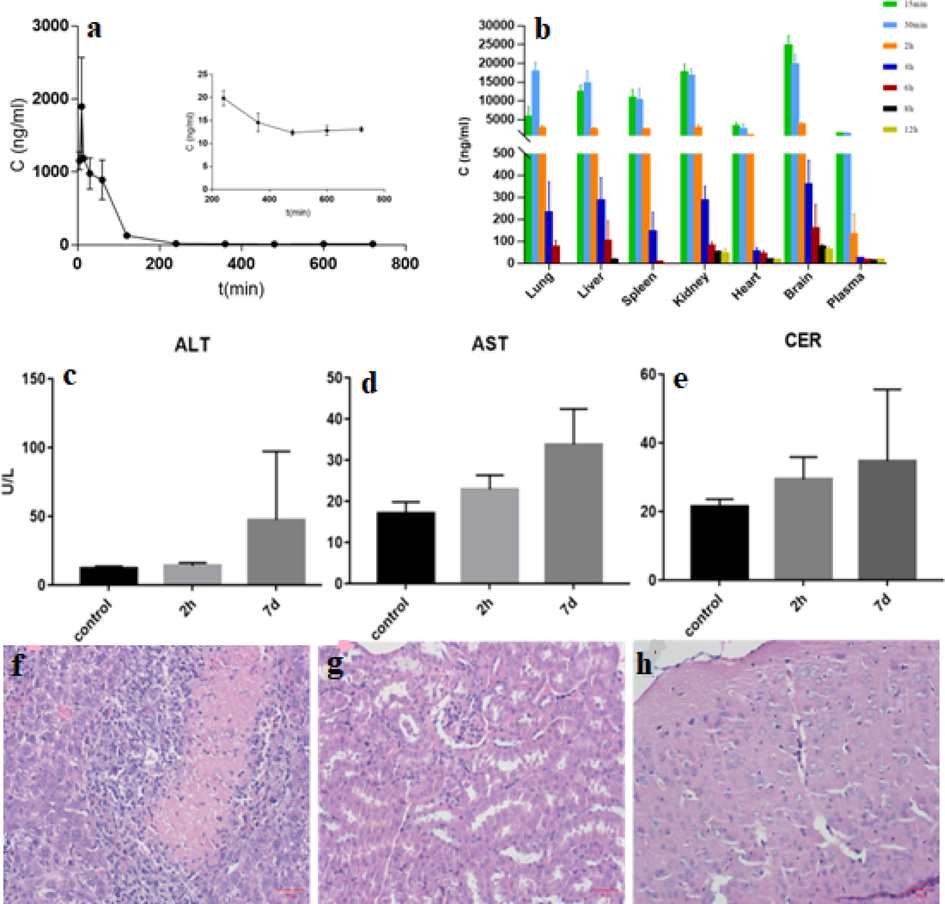
(a) Blood concentration–time curve after intraperitoneal administration in mice (n = 5). (b) Histogram of 4-CEC concentration changes in each tissue of mice after intraperitoneal injection. ALT (c), AST (d) and CER (e) levels in mice serum (Mean ± SEM, Control: saline control group; 7d: 4-CEC administration for 7 days group; 2 h: 4-CEC administration for 2 h group). HE staining of the 7-day administration group (f) liver (g) kidney (h) brain.
Parameter
Mean ± SD
t1/2 (min)
100.39 ± 1.34
Tmax(min)
10.1 ± 0.2
Cmax(ng/ml)
1896 ± 76
AUC0-t(ng min/ml)
109012 ± 457
AUC0-∞(ng min/ml)
111030 ± 478
MRT0-t(min)
73.45 ± 1.23
Vd(L/kg)
52.18 ± 0.12
CL/F(L/min/kg)
0.36 ± 0.03
3.3 Tissue distribution
3.3.1 Drug concentration in different tissues-time data
Each tissue sample was processed to determine the concentration of drug in the homogenate of each tissue at different time points. The results of the mean 4-CEC concentrations in different tissues (including plasma) are shown in Table S5, and the mean 4-CEC concentration versus time curves in different tissue homogenates are shown in Fig. S2. From these results, it is clear that 4-CEC showed a broad and rapid distribution, being present in plasma as well as in all tissues collected 15 min after drug administration, with a significant absorption phase of distribution in the lung and liver. This distribution was also reported to be observed in amphetamine. Fowler et al. used positron emission tomography (PET) to observe that methamphetamine was rapidly distributed in organs such as the heart, lungs, kidneys and liver of experimental animals after administration. In a similar study in healthy non-substance-abusing volunteers, the authors found that methamphetamine accumulated in various organs, particularly the lungs, liver, brain, and kidneys. 4-CEC showed the highest drug concentration in the brain, peaking at 15 min after administration (24.59 μg/ml), followed by the lung and kidney, peaking at 30 min (17.59 μg/ml) and 15 min (17.41 μg/ml), respectively. Overall, all tissues reached their peak within 30 min of administration and were rapidly eliminated from the tissues. After 4 h of administration, the concentration of all tissues decreased to a lower level, and then the concentration continued to decrease slowly until clearance.
3.3.2 Characteristics of drug distribution at different times
In order to visualize the dynamic distribution of 4-CEC in various tissues and plasma, the histograms of drug concentrations at different time points were plotted for comparison. As can be seen from Fig. 2b, at 15 min, the concentration of 4-CEC in mouse tissues was in the following order: brain > kidney > liver > spleen > lung > heart > blood. At 30 min and 2 h, the drug concentration of each tissue was in the order of brain > lung > kidney > liver > spleen > heart > blood. At 4 h, the order was brain > kidney > liver > lung > spleen > heart > blood. At 6 h, the order was brain > liver > kidney > lung > heart > blood > spleen. At 8 h, the order was: brain > kidney > heart > liver > blood, lung and spleen were not detected. At 12 h after administration, the drug concentration of each tissue was in the order of brain > kidney > heart > blood, and no drug was detected in lung, liver and spleen. The results showed that the organs with the highest concentration of 4-CEC were brain, lung, kidney and liver. In the study of Šíchová, the highest 4-MMC concentrations were also found in the lungs and brain after subcutaneous injection of 4-methylmethcathinone (4-MMC) in rats, considering that the influx of 4-MMC into the lungs and brain was attributed to the lipophilicity of cathinone. Stefkova et al. described that after 30 min of administration of Methylone in rats, the concentration in the brain was five times higher than the serum concentration. In this experiment, the concentration of drug in plasma was the lowest compared with that in various tissues, which was consistent with the reported results. It is clear from the results that 4-CEC was no longer detectable in the lungs, liver and spleen at 12 h of administration, which supports the rapid distribution and elimination of this class of drugs. On the whole, the cumulative concentration of 4-CEC in brain, liver and kidney is high, suggesting that brain, liver and kidney may be the target organs of 4-CEC toxicity. To further evaluate the targeting of 4-CEC distribution in each tissue, compare the AUC of each tissue with the AUC of plasma, and calculate the tissue/blood partition coefficient (Table 3). It can be seen that the AUC values of the tissues in descending order were brain, kidney, lung, liver, spleen and heart. The brain/blood partition coefficient reached 20.471 at 4 h after single administration, suggesting that 4-CEC May have better brain absorption.
Sample
AUC(0-4h)
(μg min/ml)KP
(AUCtissue/AUCplasma)
Plasma
87.539
Lung
1292.5
14.764
Liver
1199.1
13.698
Spleen
928.60
10.608
Kidney
1422.0
16.245
Heart
249.05
2.845
Brain
1792.0
20.471
3.4 Metabolomics studies
3.4.1 Animal behavioral performance
Experimental mice had shiny coats, high appetite, avoidance reactions and were generally docile during the adaptive feeding period. After a single intraperitoneal injection of 4-CEC, the mice showed rapid (onset of action within about 10 min) and strong responses, which were characterized by abnormal activity and excitement, repeated jumping movements, no foraging and drinking behavior, and aggressive behavior towards the experimenter's grasp (Li et al., 2017; Ren et al., 2018; Araújo et al., 2021b). After a period of time (about 1–2 h after drug administration), the mice gradually recovered and started to feed and drink without abnormal movements. After 7 consecutive days of administration, the mice had coarse and lusterless hair, were easily frightened and fought, and were depressed. The control group mice were injected intraperitoneally with the same amount of normal saline, and no abnormal activity was found.
3.4.2 Biochemical indicators
In clinical practice, liver injury is often judged by the AST and ALT levels in blood. Among them, ALT can reflect the degree of hepatocyte damage and AST can reflect the degree of hepatocyte necrosis. Serum creatinine (CER) level is one of the main methods to understand renal function and is an important indicator of renal function. The increase of serum creatinine means the damage of renal function. The levels of AST, ALT and creatinine in the serum of the experimental groups of mice are shown in Fig. 2c-e. The results showed that although there was no statistical difference in the levels of AST, ALT and CER in the administered group compared with the control group, they gradually increased with the increase of administration, indicating that the liver and kidney of the mice might be mildly damaged (Rouxinol et al., 2020; Wijnant et al., 2020; Czerwinska et al., 2021; Araújo et al., 2021a; Hemmer et al., 2021).
3.4.3 HE staining
The representative HE staining results observed in the liver, kidney and brain of the administered mice are studied. The arrangement of hepatocytes in liver tissue (Fig. 2f) was still regular, and there was no obvious edema, fatty degeneration and necrosis in hepatocytes. A few punctate inflammatory cell infiltration foci were seen in the interstitium, but no obvious fibrous hyperplasia was observed. Renal tissue (Fig. 2g) had clear cuticular and medullary boundaries, and the distribution of glomeruli and tubules was normal. There was no obvious glomerular sclerosis, mild edema and degeneration of focal tubular epithelium, no definite necrosis, and no tubular lumen dilatation or definite tubular shape. Interstitial renal pelvis place inside to see a small amount of inflammatory cell infiltration, did not see clear the fibrous tissue hyperplasia. Brain tissue (Fig. 2h) was mildly edematous, with neuronal consolidation and slightly widened perivascular lacunae in some of the vessels, with no clear tissue necrosis and no obvious inflammatory cell infiltration in the meningeal tissue (Kraemer et al., 2019; Bijlsma et al., 2019; Lin et al., 2020; bin Jardan et al., 2021). The pathological results showed that 4-CEC had a certain degree of damage to liver, kidney and brain tissue after intraperitoneal administration in mice.
3.4.4 UPLC-Q Exactive MS
The experimentally established UPLC-Q Exactive MS analytical method was used to scan mouse serum QC samples as shown in Fig. S3. The method is sensitive, high mass accuracy and rich in detected components, which is suitable for the detection of endogenous metabolites in serum samples. In positive ion detection mode, the retention time of L-2-chlorophenylalanine was 4.59 min, the mass-to-charge ratio of the quasi-molecular ion [M + H]+ was m/z 200.05, the mass spectral response was high (NL greater than 107), and there was no interference with the detection of endogenous metabolites in serum, making it suitable for use as an internal standard for metabolite analysis (Celma et al., 2019).
3.4.5 Data analysis
3.4.5.1 Principal component analysis (PCA)
After the metabolite information is obtained from the data preprocessing, the overall evaluation of the data is conducted through the unsupervised model identification, namely PCA analysis model [30]. The PCA score plot is shown in Fig. 3a and b, where each point represents a sample, all data are within the 95% confidence interval, and different subgroups (indicated by different colors) can be more concentrated in a certain area of the PCA score plot. From the PCA score chart, we can see that the QC group samples are closely gathered together and there is no abnormal value. The RSD of the calculated internal standard peak area is less than 3.0%, which indicates that the established UPLC-Q Exactive MS analysis method has good repeatability and the variation caused by instrument error is small in the whole experiment Therefore, this analytical method can be used to collect serum metabonomics data.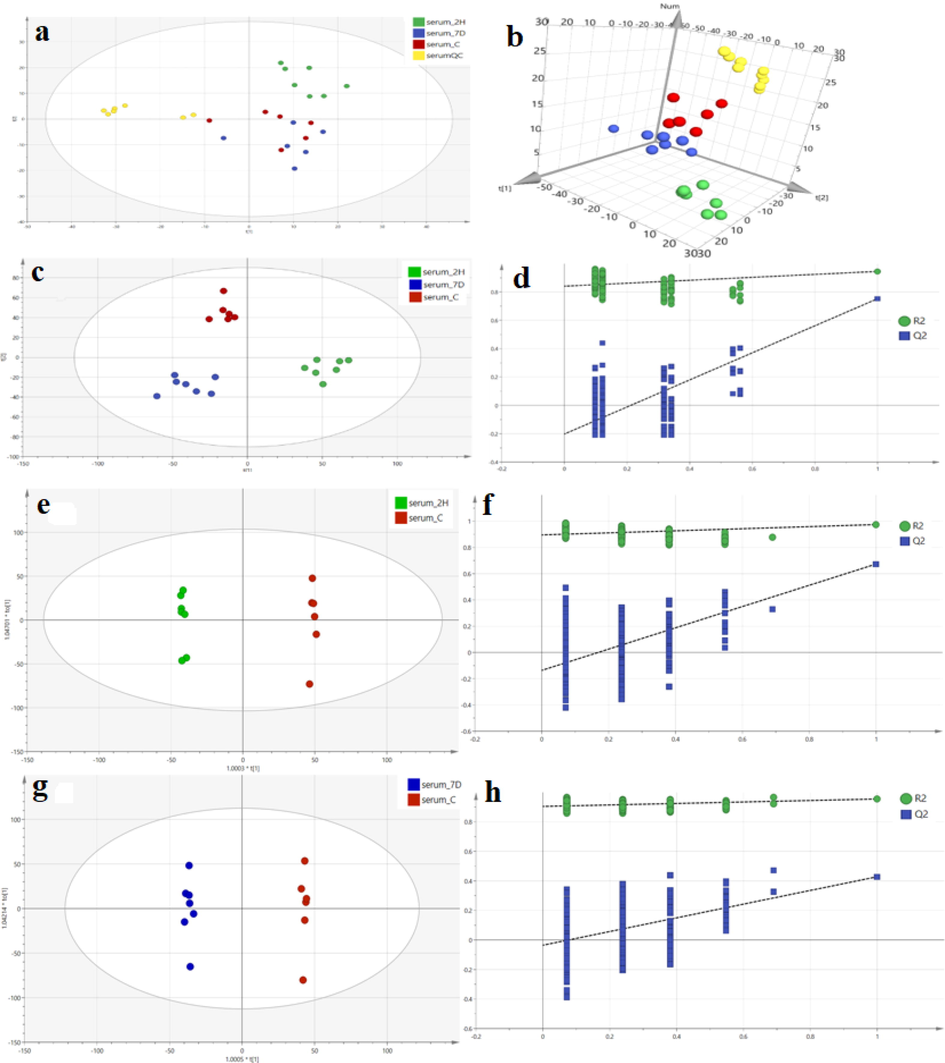
PCA score plots (a:2D, b:3D) for all samples (C: blank control group, 2H: single dose, 7D: continuous 7-day dosing group, QC: quality control group). Plot of PLS-DA scores (c) and substitution test (d) for the control, 2H and 7D groups. OPLS-DA score plots and replacement test plots for the control, 2H and 7D groups. Score graph (e) and replacement test graph (f) for the 2H group and the control group. Score plots (g) and replacement test plots (h) for group 7D versus control group.
3.4.5.2 Partial least squares discriminant analysis (PLS-DA)
PLS-DA is an analysis method with supervised pattern recognition that can ignore intra-group and random errors and focuses more on the analysis of between-group differences [31]. Establishment of PLS-DA model of blank control group and 2 h and 7 d after administration as shown in Fig. 3c. There was a significant difference between the control group and the administration group. It can be seen that the endogenous metabolites were significantly different in mice after 2 h and 7 d of continuous 4-CEC administration compared with control mice. The main parameters to evaluate the PLS-DA model are R2Y and Q2Y, respectively. R2Y reflects the fitting ability of the model, and Q2Y represents the prediction ability of the model. The fitted PLS-DA model is shown in Table 3-2. R2Y is 0.934 and Q2Y is 0.849. Q2Y > 0.5 is considered as an effective model. According to the data of this model, R2Y and Q2Y of the model are both greater than 0.5, and the difference between R2Y and Q2Y is less than 0.3, indicating that the model has good fitting ability and prediction ability. CV-ANOVA difference analysis was performed on the established model and P < 0.005, indicating that there was statistical difference between the control group and the administration group. In addition, in order to prevent the PLS-DA model from over-fitting, the model needs to be tested 200 times for replacement. The main parameter Q2 is less than 0. As shown in Fig. 3d, as can be seen from the figure, the intersection of regression line (blue) and Y axis is less than 0, and the intersection of fitting line (green) and Y axis is greater than 0. The intersection of two straight lines in the first quadrant shows that the model has not been over-fitted and has good prediction ability (Chong et al., 2019).
3.4.5.3 Orthogonal partial least squares discriminant analysis (OPLS-DA)
OPLS-DA integrates PLS-DA and orthogonal signal filtering techniques to make better sample separation between groups (Andries and vander Heyden, 2021). By establishing OPLS-DA model, the relationship between samples is further confirmed and the characteristic variables are screened to distinguish each group. The horizontal coordinate of the OPLS-DA score plot is the score value of the main component, and the vertical coordinate is the score value of the orthogonal component. The difference in the horizontal coordinate reflects the difference between groups and the difference in the vertical coordinate reflects the difference within groups. The OPLS-DA models for the control group and the 2 h and 7 d post-dose groups were established, and the model score plots are shown in Fig. 3e-h, which shows that each administration group and the control group can be distributed in different areas of the score chart with significant differences between groups and small differences within groups. The model-related parameters are shown in Table 4. R2Y of all groups is greater than 0.9, Q2Y is greater than 0.7, and the difference between Q2Y and R2Y is less than 0.3, indicating that the fitted OPLS-DA model has a good predictive ability and fitting degree. In addition, in order to prevent the PLS-DA model from over-fitting, the model needs to be tested 200 times for replacement, with Q2 less than 0 for each group, indicating that the model was not overfitted.
Mode
Group
R2Y
Q2Y
Permutation test
R2
Q2
PLS-DA
Control, 2 h and 7d
0.934
0.849
0.841
−0.202
OPLS-DA
Control and 2 h
0.974
0.846
0.894
−0.168
OPLS-DA
Control and 7d
0.955
0.855
0.905
−0.0357
3.4.5.4 Volcano plot
To more visually represent the differences in metabolite content between the control group and each administration group, SIMCA 14.1 was used to draw the volcanic map of metabolite. Results as shown in Fig. 4a and b. The horizontal coordinate is the logarithm of the ratio of the mean metabolite content (Fold Change, FC) in the control group to the mean metabolite content in each dosing group, i.e., when FC is greater than 1 (right side of the vertical coordinate), the substance is downregulated relative to the control group, and when FC is less than 1 (left side of the vertical coordinate), the substance is upregulated relative to the control group, and the vertical coordinate is the negative logarithm of the adjusted p value, i.e., the smaller the p value, the larger the vertical coordinate. Each dot in the volcano plot represents a metabolite, blue dots indicate metabolites with statistically different (adjusted p < 0.05) and up-regulated expression compared to controls, red dots indicate metabolites with statistically different and down-regulated expression compared to controls, and green dots indicate metabolites with no significant difference compared to controls.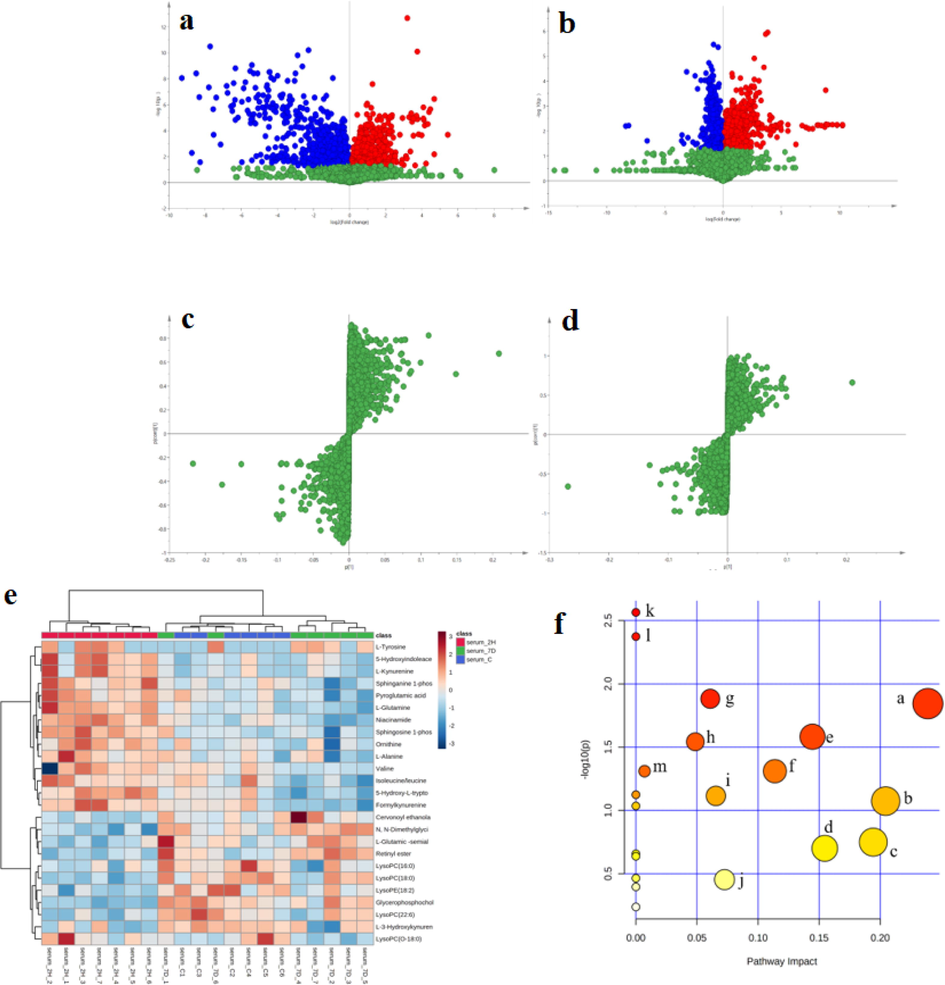
Volcano plot (a) Control group vs. single dose group (b) Control group vs. 7-day dosing group. S-plot (c and d) of control group, 2H group and 7D group. Heat map of cluster analysis (e). (Serum 2H: 2 h administration group; serum 7D: 7 d administration group; serum c: control group). (f) Differential metabolic pathway enrichment maps of control and 4-CEC administration groups (a: tryptophan metabolism, b: arginine and proline metabolism, c: niacin and nicotinamide metabolism, d: retinol metabolism, e: ether lipid metabolism, f: alanine, aspartate and glutamate metabolism, g: arginine biosynthesis, h: sphingolipid metabolism, i: glycerophospholipid metabolism, j: glycine, serine and threonine metabolism, k: aminoacyl tRNA biosynthesis, l: valine, leucine and isoleucine biosynthesis, m: glutathione metabolism).
3.4.6 Screening and identification of differential metabolites
According to the variable weight coefficient (VIP) obtained in OPLS-DA model, the differential metabolites with higher contribution rate were screened. The differential metabolites of administration group and control group were screened by double criteria of VIP > 1 and adjusted p < 0.05. The compounds were identified and matched by MS/MS secondary fragment ion comparison and comparison of database information based on HMDB and other databases as well as comprehensive scoring. Finally, 25 different compounds were identified (see Table S6). The variables at both end of the S-plot are considered to play an important role in model classification, so S-plot is often used to find differential metabolites and potential biomarkers for the model. Points further from the origin in the S-plot plot are important differential metabolites in the OPLS-DA model that distinguish the control group from the administered group (see Fig. 4c and d).
3.4.7 Clustering heat map
Hierarchical cluster analysis provides a more comprehensive and visual representation of the relationships between samples and the variability of metabolite expression across samples. Cluster heat maps were drawn by MetaboAnalyst 5.0 to present the variation of screened and identified differential metabolites across samples in a visual format. The results are shown in Fig. 4e, where the samples were well clustered in the 2 h administration group, which was significantly distinguished from the control group, indicating significant differences between groups, consistent with the previous results. Compared with the control group, 14 of the serum differential metabolites showed an increasing trend and 10 metabolite levels decreased in the 2-h administration group. The 7-d administration group was roughly distinguished from the control group, and some samples could not be clearly distinguished from the blank control group. Since the 7-d administration group was treated after 24 h of administration on day 7, it showed that after 24 h of recovery, the metabolites in mice were partially regulated back to approximately normal levels. In the aforementioned results, the mice reacted strongly within 2 h of administration and then gradually returned to calmness, which is consistent with the performance of the results after 24 h of this administration.
3.4.8 Metabolic pathway analysis
To investigate in depth the mechanism of action of the differential metabolites screened and identified in the administration group versus the control group, metabolic pathway analysis of the differential metabolites was performed using MetaboAnalyst 5.0. The Pathway impact indicates the importance weight of the identified differential metabolites in the relevant metabolic pathway, and a larger -log10(p) indicates a greater alteration in the enriched metabolic pathway. The results of the pathway analysis are shown in Fig. 4h. The main metabolic pathways affected in mice after intraperitoneal injection of 4-CEC are tryptophan metabolism, arginine and proline metabolism, niacin and nicotinamide metabolism, retinol metabolism, ether lipid metabolism, alanine, aspartate and glutamate metabolism, arginine biosynthesis, sphingolipid metabolism, glycerophospholipid metabolism, glycine, serine and threonine metabolism, aminoacyl tRNA biosynthesis, valine, leucine and isoleucine biosynthesis and glutathione metabolism. As shown in the figure, amino acid-related metabolism and biosynthesis, lipid metabolism and niacin and nicotinamide metabolism were disturbed in 4-CEC-exposed mice, among which tryptophan metabolism, niacin and nicotinamide metabolism, arginine and proline metabolism and arginine biosynthesis were more affected. In addition, energy-related metabolic pathways such as glycine, serine and threonine metabolism, and glycerophospholipid metabolism were disturbed, indicating that energy metabolism was disturbed in mice after drug administration.
4 Conclusion
The serum metabolomics of mice in the 4-chloroethylcathinone exposed group was explored in this study, and subsequent studies on urine and fecal metabolomes can be performed to screen biomarkers after 4-CEC exposure and further elucidate the mechanisms of 4-CEC effects on metabolism by comparison. Due to the complexity of the metabolome in blood and its many different metabolites, the differential metabolites screened in this experiment need further target metabolomics and kinetics studies, and deeper studies of the screened differential compounds are needed to explore the upstream and downstream of the compounds to more accurately elucidate and predict the mechanisms of 4-CEC toxicity. Nevertheless, the discovery of metabolic changes observed in this study may provide an important basis for the development of therapeutic strategies, potential biomarkers for predicting the severity of 4-CEC toxicity, and new ideas for the field of drug abuse.
Acknowledgements
This work was supported by the National Natural Science Foundation of China (No. 82074128 and 81473357), China Pharmaceutical University's “Double First Class” initiative (No. CPU2022QZ16), the Open Project Program of NMPA Key Laboratory for Impurity Profile of Chemical Drugs (No. NMPA-KLIPCD-2020-01), the program of innovation application of Ministry of Public Security (No. 2020YYCXJSST021), and the Project of Jiangsu Administration for Market Regulation (No. KJ207558).
Declaration of Competing Interest
The authors declare that they have no known competing financial interests or personal relationships that could have appeared to influence the work reported in this paper.
References
- Improved multi-class discrimination by common-subset-of-independent-variables partial-least-squares discriminant analysis. Talanta. 2021;234
- [CrossRef] [Google Scholar]
- Toxicometabolomics: Small molecules to answer big toxicological questions. Metabolites. 2021;11
- [Google Scholar]
- In vivo toxicometabolomics reveals multi-organ and urine metabolic changes in mice upon acute exposure to human-relevant doses of 3,4-methylenedioxypyrovalerone (MDPV) Arch. Toxicol.. 2021;95:509-527.
- [CrossRef] [Google Scholar]
- Monitoring new psychoactive substances use through wastewater analysis: current situation, challenges and limitations. Curr. Opin. Environ. Sci. Health. 2019;9:1-12.
- [Google Scholar]
- Development and validation of GC–MS method for determination of methcathinone and its main metabolite in mice plasma and brain tissue after SPE: Pharmacokinetic and distribution study. J. Pharm. Biomed. Anal.. 2021;194
- [CrossRef] [Google Scholar]
- Simultaneous determination of new psychoactive substances and illicit drugs in sewage: Potential of micro-liquid chromatography tandem mass spectrometry in wastewater-based epidemiology. J. Chromatogr. A. 2019;1602:300-309.
- [CrossRef] [Google Scholar]
- Identification of key metabolic changes during liver fibrosis progression in rats using a urine and serum metabolomics approach. Sci. Rep.. 2017;7
- [CrossRef] [Google Scholar]
- Using MetaboAnalyst 4.0 for comprehensive and integrative metabolomics data analysis. Curr. Protoc. Bioinformatics. 2019;68
- [CrossRef] [Google Scholar]
- Pharmacokinetics of mephedrone enantiomers in whole blood after a controlled intranasal administration to healthy human volunteers. Pharmaceuticals. 2021;14:1-10.
- [CrossRef] [Google Scholar]
- Metabolic profiling of four synthetic stimulants, including the novel indanyl-cathinone 5-PPDi, after human hepatocyte incubation. J. Pharm. Anal.. 2020;10:147-156.
- [CrossRef] [Google Scholar]
- Altered metabolic pathways elucidated via untargeted in vivo toxicometabolomics in rat urine and plasma samples collected after controlled application of a human equivalent amphetamine dose. Arch. Toxicol.. 2021;95:3223-3234.
- [CrossRef] [Google Scholar]
- Death cases involving certain new psychoactive substances: a review of the literature. Forensic Sci. Int.. 2019;298:186-267.
- [Google Scholar]
- Metabolomic profiling of brain tissues of mice chronically exposed to heroin. Drug Metab. Pharmacokinet.. 2017;32:108-111.
- [CrossRef] [Google Scholar]
- Pharmacokinetics of N-ethylpentylone and its effect on increasing levels of dopamine and serotonin in the nucleus accumbens of conscious rats. Addict. Biol.. 2020;25
- [CrossRef] [Google Scholar]
- Metabolic profile of four selected cathinones in microsome incubations: identification of Phase I and II metabolites by liquid chromatography high resolution mass spectrometry. Front. Chem.. 2021;8
- [CrossRef] [Google Scholar]
- Mephedrone pharmacokinetics after intravenous and oral administration in rats: Relation to pharmacodynamics. Psychopharmacology. 2013;229:295-306.
- [CrossRef] [Google Scholar]
- Hirshfeld surfaces analysis and DFT study of the structure and IR spectrum of N-ethyl-2-amino-1-(4-chlorophenyl)propan-1-one (4-CEC) hydrochloride. Comput. Theor. Chem.. 2021;1205
- [CrossRef] [Google Scholar]
- Manifestation of intermolecular interactions in the IR spectra of 2- and 4-methylmethcathinones hydrochlorides. Biointerface Res. Appl. Chem.. 2023;13(3):202.
- [CrossRef] [Google Scholar]
- Synthetic cathinones – From natural plant stimulant to new drug of abuse. Eur. J. Pharmacol.. 2020;875
- [Google Scholar]
- Advances in mass spectrometry-based metabolomics for investigation of metabolites. RSC Adv.. 2018;8:22335-22350.
- [CrossRef] [Google Scholar]
- Biodistribution and metabolic profile of 3,4-dimethylmethcathinone (3,4-DMMC) in Wistar rats through gas chromatography–mass spectrometry (GC–MS) analysis. Toxicol. Lett.. 2020;320:113-123.
- [CrossRef] [Google Scholar]
- Influences of methamphetamine-induced acute intoxication on urinary and plasma metabolic profiles in the rat. Toxicology. 2011;287:29-37.
- [CrossRef] [Google Scholar]
- Mephedrone (4-Methylmethcathinone): Acute behavioral effects, hyperthermic, and pharmacokinetic profile in rats. Front. Psych.. 2018;8
- [CrossRef] [Google Scholar]
- Pharmacokinetic, ambulatory, and hyperthermic effects of 3,4-methylenedioxy-n-methylcathinone (Methylone) in rats. Front. Psych.. 2017;8
- [CrossRef] [Google Scholar]
- Toxicokinetic studies of the four new psychoactive substances 4-chloroethcathinone, N-ethylnorpentylone, N-ethylhexedrone, and 4-fluoro-alpha-pyrrolidinohexiophenone. Forensic Toxicol.. 2020;38:59-69.
- [CrossRef] [Google Scholar]
- Validated ultra-high-performance liquid chromatography hybrid high-resolution mass spectrometry and laser-assisted rapid evaporative ionization mass spectrometry for salivary metabolomics. Anal. Chem.. 2020;92:5116-5124.
- [CrossRef] [Google Scholar]
- Anoectochilus roxburghii polysaccharide prevents carbon tetrachloride-induced liver injury in mice by metabolomic analysis. J. Chromatogr. B Anal. Technol. Biomed. Life Sci.. 2020;1152
- [CrossRef] [Google Scholar]
Appendix A
Supplementary material
Supplementary data to this article can be found online at https://doi.org/10.1016/j.arabjc.2023.105039.
Appendix A
Supplementary material
The following are the Supplementary data to this article:Supplementary data 1
Supplementary data 1


