

Translate this page into:
Phenolic compounds in olive oil by solid phase extraction – Ultra performance liquid chromatography – Photodiode array detection for varietal characterization
⁎Corresponding author. miguel.palma@uca.es (M. Palma)
-
Received: ,
Accepted: ,
This article was originally published by Elsevier and was migrated to Scientific Scholar after the change of Publisher.
Abstract
An new method for the extraction of phenolic compounds from olive oil has been proposed before the chromatographic analysis by UPLC-PDA (Ultra-Performance Liquid Chromatography-PhotoDiode Array). Recoveries for 20 individual phenolic compounds were compared using three cartridges of solid-phase extraction including C-18, Diol, and DVB (DiVinylBenzene) based cartridges. Diol based cartridge produced the best retention efficiency. The optimized method uses a reduced amount of solvents and allows for the determination of most phenolics in oil samples in less than 10 min. A full discrimination among the most common olive oil varieties was achieved using the relative levels for specific phenolics in the sample. Therefore, based in this study, a fingerprint based on the relative levels for quercetin, luteolin, oleuropein and vanillic acid can be proposed to characterized varietal olive oils. In that way, a detailed composition about phenolic compounds of varietal olive oils would not be needed for discrimination purposes.
Keywords
Discrimination
Olive oils
Olive varieties
Phenolic compounds
Solid-phase extraction (SPE)

1 Introduction
In recent years, wide research on phenolic compounds has been developed due to their therapeutic properties, including anticarcinogenic properties, benefits for preventing inflammatory disorders and for cardiovascular diseases (Ammar et al., 2018; Roleira et al., 2015; Schwingshackl et al., 2019). Phenolics are secondary metabolites that are naturally present in several different plants and fruits (Cheynier, 2012) as well as in olives and olive oils (Alu’datt et al., 2017; Reboredo-Rodríguez et al., 2018). Furthermore, phenolics could also contribute to the stability and nutritional value of olive oils (Bendini et al., 2006). Additionally, olive oils is an essential oil of the Mediterranean diet (Battino et al., 2019; Mazzocchi et al., 2019).
Some of the important the phenolic compounds present in olive oils are phenolic acids and phenolic alcohols (Olmo-García et al., 2017). The most usual chemical forms of phenolic acids in olive oils are derivatives from benzoic and cinnamic acids (Bendini et al., 2006). Besides of the aforementioned two classes of phenolic compounds, ester and aldehydes analogues are also found in olive oils (Veneziani et al., 2018). However, tyrosol and hydroxytyrosol are considered as the most prominent compounds whilst ferulic and sinapic acids present at a minor level (Nenadis et al., 2019). Flavonols have been also reported as important compounds in olive oils, however, their levels depend on the cultivar, location, climatic conditions and ripening period (Morrone et al., 2020; Valente et al., 2020).
Additionally phenolic compounds have been also used for the characterization of olive oils from different origins (Becerra-Herrera et al., 2018) or from different olive varieties (Bajoub et al., 2017). For those purposes, specific levels for some phenolic compounds can be used (Mohamed et al., 2018).
Two analytical methods have been traditionally used for recovery of phenolic compounds from olive oils: liquid-liquid extraction (LLE) and solid-phase extraction (SPE) (Alarcón Flores et al., 2012; Ricciutelli et al., 2017). LLE usually needs large amounts of organic solvents. Typically methanol/water mixtures were used as extraction solvent for phenolic compounds from olive oil. Usually the resulting extracts are not clean enough, so additional cleanup steps are needed, for example using a primary-secondary amine sorbent or magnesium silicate (Gilbert-López et al., 2014). In recent times, several novel extraction methods have been also introduced to avoid large amounts of organic solvents, including liquid–liquid microextraction (Pizarro et al., 2013) and matrix solid-phase dispersion (Monasterio et al., 2014). Some faster extraction methods have been also proposed, for example the ultrasound-assisted liquid-liquid extraction (Pizarro et al., 2013).
However, SPE is still the preferred method, mainly because of its simplicity and high recoveries for recovering phenolics from liquid samples (Płotka-Wasylka et al., 2017). In this research, an alternative method for the extraction of phenolic compounds from olive oil has been proposed before the analysis by UPLC-PDA. Several cartridges of SPE including C-18, Diol, and DVB based cartridges were compared regarding the recovery of 20 individual phenolic compounds because the relative levels of some phenolics compounds were used for discrimination purposes among different olive oil varieites.
2 Materials and methods
2.1 Chemicals and solvents
Methanol from Merck KGaA (Darmstadt, Germany) and ethanol from Panreac (Barcelona, Spain) were HPLC grade. A Milli-Q purification system (Billerica, MA, USA) was used to obtain purified water. The following phenolic compounds were used: Protocatechuic acid (PRO), vanillin (VAN), vanillic acid (VAA), gallic acid (GAL), ferulic acid (FER), and sinapic acid (SIN) were obtained from Fluka (Buchs, Switzerland). Syringic acid (SYR), p-coumaric acid (p-COU), o-coumaric acid (o-COU), m-coumaric acid (m-COU), caffeic acid (CAF), quercetin (QUE), isovanillic acid (IVA), homovanillic acid (HVA), rutin (RUT), syringaldehyde (SYA), luteolin-7-glucoside (LUG), oleuropein (OLE), luteolin (LUT), and tyrosol (TYR) were provided by Sigma-Aldrich (St. Louis, MO, USA). These phenolic compounds were selected because of they are usually found in olive oils (Bouymajane et al., 2020; Lorini et al., 2021). Stock solutions (1000 mg L−1) from the standard phenolic compounds were prepared in aqueous methanol 50:50 (v/v) and stored in a freezer at −32 °C. A mixture containing all phenolics at 5 mg L−1 in hexane was used for the development of the SPE method.
2.2 Olive oil samples
The olive oil samples were purchased in Spanish local markets in the summer of 2018. The oil samples were stored at 4 °C in amber glass bottles in darkness avoiding empty headspace until analysis.
2.3 Solid phase extraction
An automated system for Solid Phase Extraction Zymark Rapid Trace by Caliper (Hopkinton, MA, USA) was used for the SPE method development. Three different cartridges with different solid phases from different supplies were compared. Table 1 shows the most important characteristics of the cartridges
Commercial brand
Abbreviation
Solid phase
Amount of solid phase (mg)
Supplier
Discovery DSC-18
DSC-18
Octadecylsilica
500
Supelco
Discovery DSCDiol
DSC Diol
2,3-Dihydroxypropoxypropyl
500
Supelco
Strata X
Strata X
Modified divinylbenzene
200
Phenomenex
The regular working procedure during the evaluation of SPE cartridges was as it follows: first a conditioning step using 10 mL of methanol, 10 mL of n-hexane and 10 mL min−1 as flowrate for both of them. Later, the oil (1 g of oil diluted to 10 mL with n-hexane) was loaded using a flowrate of 2 mL min−1; subsequently, the washing step was applied using 10 mL of n-hexane at a flowrate of 10 mL min−1, finally the elution step using 4 × 2 mL of methanol at a flowrate of 10 mL min−1; the samples and washing residues were then collected. Both samples were analyzed to determine any losses during the SPE steps.
The DVB based cartridge contains lower amount of solid phase as it is usual for this kind of phase, usually reaching similar recoveries with lower amount of solid phases. However, some results previously reported (Ferreiro-González et al., 2014; Rostagno et al., 2005) have demonstrated that losses will not be produced if the solid phases have a high breakthrough volume for phenolic analyses even with lower bed mass (200 mg) for the solid phase compared to another solid phases volume cartridges (500 mg).
2.4 Ultrahigh-Performance Liquid Chromatography (UPLC)
An ACQUITY® UPLC H-Class system with an ACQUITY® UPLC PDA detector was used for the chromatographic analysis of the phenolic compounds. Empower™ 3 Chromatography Data Software (Waters Corporation, Milford, MA, USA) was used for data management of the resulting data. A wavelength range of 200–400 nm was used in the PDA detector to identify the compounds. The data rate was fixed at 40 points s−1. Whereas, for quantification the detector was set at fixed wavelength with collection data rate at 80 points s−1 at the following wavelengths 280, 300 and 320 nm. Phenolic compounds were identified in the samples by comparison of retention times and UV spectra with those of standards, later a confirmatory analysis was run using spiked samples with pure standards.
The injection volume used was 3.0 μL. A reverse phase (RP) C18 ACQUITY UPLC (Waters) column (2.1 mm I.D.; 100 mm length; 1.7 μm particle size) was used for separation at a temperature of 47 °C. A binary solvent system with two phases was used as mobile phase. Starting solvent (A) was water with acetic acid (2%) and solvent B was acetonitrile with acetic acid (2%) and the flowrate was 0.5 mL min−1. The gradient used for the separation was as follows (time (min), solvent B): 0, 15%; 3.30, 20%; 3.86, 30%; 5.05, 40%; 5.35, 55%; 5.64, 60%, 5.94, 95%. Following each analysis, a washing period of 3 min with solvent B was applied. Later the system was equilibrated before the next analysis for 3 min using solvent A.
2.5 Method validation
The ICH Guideline Q2 (R1) and suggestions by ISO 17025(ICH, 2005; ISO, 2005) were used for method validation. Linearity, working range, limit of detection (LOD) and limit of quantification (LOQ) method were calculated for the chromatographic method. Stock solutions for standards of phenolic compounds at 100 mg L−1 were prepared. Later solutions (in duplicate) from 5 to100 mg L–1 were obtained by proper dilutions including 6 different levels. Using the properties of the regression curve, the LOD and LOQ were calculated, i.e. the standard deviation estimated for the response and the slope were then used (AOAC, 2012). The linearity, range, LOD and LOQ of the method were evaluated and results are described in Table 2. GAL: gallic acid, PRO: Protocatechuic acid, SYR: syringaldehyde, VAA: vanillic acid, HVA: homovanillic acid, VAN: vanillin, o-COU: o-coumaric acid, m-COU: m-coumaric acid, TYR: tyrosol, OLE: oleuropein, IVA: isovanillic acid, SYA: Syringic acid, CAF: caffeic acid, FER: ferulic acid, p-COU: p-coumaric acid, RUT: rutin, QUE: quercetin, SIN: sinapic acid, LUG: luteolin-7-glucoside, LUT: luteolin.
Wavelength (nm)
Compound
R2
Linear Equation (peak area (y) vs cocentration (x))
LOD (mg L-1)
LOQ (mg L-1)
280
GAL
0.9987
0.94
3.13
PRO
0.9982
1.12
3.73
SYR
0.9972
1.42
4.73
VAA
0.9999
0.73
2.43
HVA
0.9974
1.34
4.47
VAN
0.9995
0.58
1.93
o-COU
0.9998
1.51
5.03
m-COU
0.9969
1.52
5.05
TYR
0.9999
1.43
4.77
OLE
0.9967
1.54
5.13
300
IVA
0.9996
0.56
1.87
SYA
0.9999
1.28
4.27
320
CAF
0.9973
1.46
4.87
FER
0.9965
1.58
5.27
p-COU
0.9999
1.16
3.87
RUT
0.9926
1.15
3.83
QUE
0.9970
1.58
5.27
SIN
0.9975
1.34
4.47
LUG
0.9999
1.70
5.67
LUT
0.9998
1.90
6.33
For the extraction method, repeatability (intraday) and intermediate precision (interday) were used to indicate the precisions of the new SPE method. Nine analyses of the same sample (Hojiblanca oil) were used to determine the intermediate precision, i.e. three independent analyses on three consecutive days. Six independent analyses of the same sample on the same day were used to establish the value for the repeatability. Coefficients of variation (CVs) of chromatographic peak area were used to express the precision. CVs ranged from 8.3% for LUT to 14.6% for o-COU for intermediate precision and from 8.1% for QUE to 12.8% for o-COU for repeatability.
3 Results and discussion
Solid Phase Extraction (SPE) is considered as an efficient extraction method for phenolic compounds from different food matrices (Alarcón Flores et al., 2012). In this work, the extraction recovery of the three SPE sorbents has been compared in order to obtain the most suitable cartridge for sample preparation during the varietal characterization of the olive oils. There are previous publications using different solid phases during the SPE, mainly related to the full description of phenolic composition in olive oils (Aparicio-Ruiz et al., 2016; Bouymajane et al., 2020; Lorini et al., 2021; Pizarro et al., 2013). For the main goal in this paper, the most important phenolic compounds related to varietal characterization were used as target for the recoveries, instead of the full composition on phenolic compounds. So, a new solid phase extraction method was developed for specific purposes.
3.1 Comparison of SPE solid phases
Silica (C18), Diol and DVB are the most common sorbents used for SPE. C-18 silica based solid phases, also known as octadecil silica solid phase (ODS), are based on a numerous number of C-18 chains attached on the surface of silica gel. Their final properties are related to the degree of endcapping, it means the percentage of silanol groups in the silica gel with an attached C-18 group. They are mainly used for the recovery of medium polar compounds from polar matrices, usually aqueous matrices. Their affinities for phenolic compounds is high enough to allow for the recovery of these compounds from organic matrices also.
For Diol solid phases, the surface of the silica gel is usually bonded with 2,3-dihydroxypropoxypropyl functional groups. Those groups allow for specific interactions with polar compounds. So, it is usually applied for the recovery of polar compounds from non polar matrices. They have been used for phenolic compounds in several matrices.
DVB solid phases are not based on silica gel but on a macroporous polymeric sorbent polystyrene-divinylbenzene, which has a high specific surface area. Interactions with retained compounds are due to the hydrophobic nature of the polymer. It has also been used for phenolic compounds in different kind of matrices.
The recovery values throughout the SPE steps i.e. loading, washing and eluting were studied to recover the greatest amount of phenolic compounds. The recovery values were presented by the relative amount (%) of phenolics concentrations in the sample after passing through a certain SPE steps, i.e. loading (Fig. 1) and washing (Fig. 2).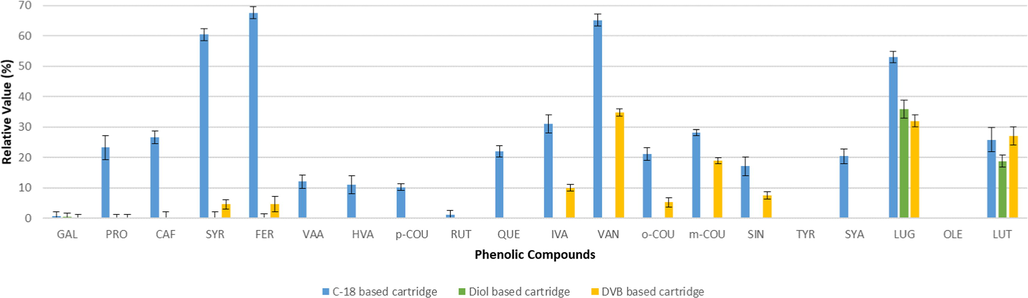
Average levels found for phenolics in the liquids eluted from the solid cartridges during the loading step (n = 2).
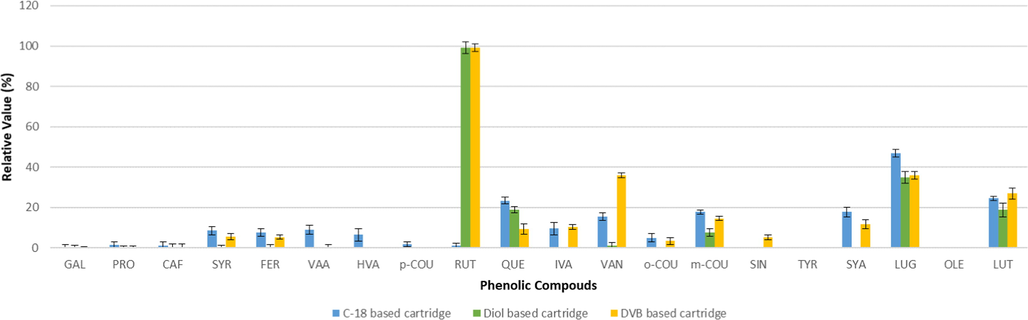
Average levels found for phenolic compounds in the liquids eluted from the solid cartridges during the washing step (n = 2).
Loading is the second step in SPE procedure after the conditioning step. This step includes the passage of the liquid sample through the sorbent. The sorbent should provide sufficient binding capacity to retain phenolic compounds from the sample matrix. The higher binding capacity of the studied sorbents was indicated by low amount of phenolic compounds found in the post-cartridge effluent (Fig. 1).
The C-18 based cartridge showed the highest levels in the eluting sample that indicates higher losses compare to the other studied cartridges. The result consistent with the former report that the loading capacities of polymer-based sorbents are higher than silica (Wu and Wells, 2003). The losses occurred for most studied phenolic compounds except TYR and OLE during sample loading step.
The DVB based cartridge provided higher retention of phenolic compounds than the C-18 based cartridge. This cartridge successfully retained a number of phenolic compounds (GAL, PRO, CAF, VAA, HVA, p-COU, RUT, QUE, and SYA) and alcohols (TYR and OLE). However, this cartridge appeared to have low retention for several phenolic compounds such as VAN, LUG, LUT, m-COU, SIN and IVA during the sample loading. It means some of the phenolic compounds with high molecular weights, including flavonoids.
On the other hand, no losses are recorded by the Diol based cartridge during the sample loading step except for LUG (36%) and LUT (19%). Most likely, these compounds are less retained because of their high molecular weights.
Next SPE step should be a washing step, as it is usually convenient for the solid phase extraction of phenolic compounds from organic or high fat matrices. It must be noted the chromatographic analysis for phenolic compounds are done using a methanol/water mobile phase and a C-18 based chromatographic column, so any residues from the starting matrix should be removed from the SPE cartridge using a non-polar solvent, in this case n-hexane.
The C-18 based cartridge provide low losses during washing step for several phenolic compounds. In this cases, these so feeble losses could be explained because of the high losses during loading step, therefore a reduced amount of phenolic compounds were retained during the loading step, so there were reduced level of phenolic compounds to be lost. Therefore, the C-18 based cartridge was removed from the option for subsequent method optimization. This kind of cartridges have been previously used for phenolic analysis by several authors (Alarcón Flores et al., 2012; Ricciutelli et al., 2017), however in this case most likely losses are due to the different matrix used in the study.
DVB based cartridges showed losses during washing steps for the majority of phenolic compounds. These losses are between 3% (o-COU) and 99% (RUT). Consequently, this cartridge was removed from the option for the development of extraction method.
On the other way, Diol based cartridge showed excellent performance, retaining the phenolic compounds without significant losses during the loading step, nor during the washing step. It means, Diol based cartridges is able to reach high retention capabilities of the studied phenolic compounds from the sample. Therefore, this cartridge was selected for extraction method development. Additionally, previous studies reported that the selected cartridge shown to have an excellent reproducibility (Rostagno et al., 2005).
3.2 Amount of eluting solvent
The amount of solvent needed to run the new method must be minimized, first because of reducing the waste production, furthermore, from an analytical point of view, lower amount of solvent, will produce a higher concentration in the final extract, allowing a higher signal in the detection system. However, if diminishing the amount of elution solvent, it could result in a poor recovery of the phenolic compounds from the cartridge. Therefore, the optimization of the amount of the solvent used for the elution step is mandatory. Therefore, four extractions were done on the same sample using subsequent amounts of extracting solvents. Specifically, elution of phenolic compounds with up to 8 mL (four different fractions using 2 mL were obtained) of MeOH were compared. All extractions were done in triplicate.
The majority of the compounds were eluted using only 2 mL of solvent. Recoveries results using a second extraction step with additional 2 mL of methanol produced full recovery for all these compounds instead. Levels for phenolic compounds in the second fraction were always below 10% of the levels found in fraction 1. Levels in the third extraction were always below 2% of the levels in the fraction 1. Therefore, only extractions 1 and 2 are needed to get a quantitative recovery of phenolic compounds.
3.3 Application to real samples
The new method established in this research was finally applied on real samples. In this case, the method was applied on a selection of oils from different olive varieties. There are several papers dealing with the characterization of different olive varieties, many of them using the phenolic composition as the tool to characterize varieties (Mohamed et al., 2018). A total of 12 commercial samples from 4 different varieties available in the Spanish markets were used. Specifically, the varieties Hojiblanca (3), Arbequina (4), Conicabra (1) and Picual (4) were selected as they are the most common olive varieties in the Spanish market. It was not possible to find equal distribution for the 4 varieties. Beside of those samples, one additional oil with not specific information about its variety was analyzed.
While the total levels for phenolic compounds can be related to the ripening period and the processing techniques for olives and oils, a common ratio among different phenolic compounds can be expected for the same olive varieties even through different commercial brands. So, relative values for different olive varieties were evaluated instead of specific levels for phenolic compounds. Fig. 3 shows the average relative levels for the main phenolics found in each variety. As Fig. 3 shows, QUE was the major compound for Picual, Arbequina and Hojiblanca, it accounts for more than 50% for Hojiblanca variety, and larger than 40% for Picual and Arbequina varieties. On the other hand, Cornicabra variety showed LUT as the main phenolic in the oil. Therefore, Cornicabra variety could be differentiated from the other studied varieties based on the level for LUT to be larger than QUE. Different phenolic levels were obtained for the different samples (Fig. 3). LUT was found higher than OLE for Picual varitiy, whilst Hojiblanca and Arbequina showed very similar values. Therefore, Picual could be characterized also based on the ratio LUT/OLE, it should be larger than 1.5. Finally, differences between Hojiblanca and Arbequina were much lower previous differences. Only a minor compound VAA was found in Arbequina and not appearing in Hojiblanca variety, was detected as difference for these varieties.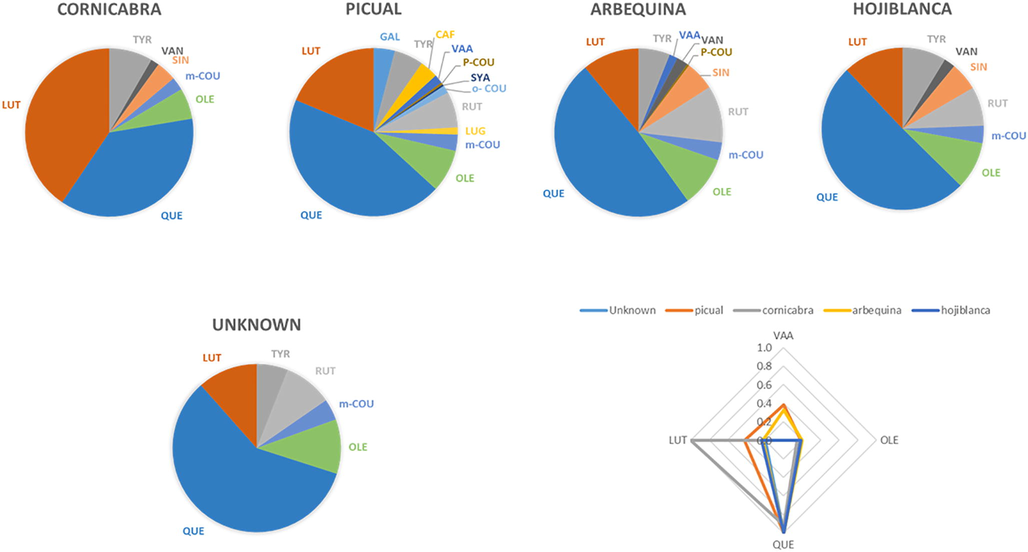
Relative distribution of phenolic compounds for the four olive varieties studied (n = 3) and resulting fingerprint proposed.
Therefore, based in this study, a fingerprint can be proposed for the studied varieties using the selected phenolics allowing for their characterization (Fig. 3). Specifically, values for QUE, LUT, OLE and VAA. The fingerprint proposed in Fig. 3 has been modified using values x10 for VAA for better clarity. If additional samples from other olive oil varieties are analyzed, it is supposed additional relative values would be needed.
Finally, a commercial sample without information about variety in the label was classified as Hojiblanca as it contains QUE higher than 50% of the total level for phenolic compounds, very similar values of LUT/OLE and VAA was not detected. The fingerprint in Fig. 3 confirms this proposal. Therefore, it has been demonstrated that using the relative values of some specific phenolics in the SPE extract, the specific variety of an unknown oil sample can be proposed.
Anyway, a larger number of real samples from different olive varieties will be needed to develop a robust discrimination model. However, the fingerprint graph used is a proposal for classification purposes.
4 Conclusions
The three studied SPE cartridges showed different performances in retaining the phenolic compounds. The C18 based cartridges showed high losses during the loading step and DVB based cartridge showed losses during the washing steps, therefore they were not useful for phenolic extraction in this kind of samples. Diol based cartridge showing satisfactory recoveries to be used for this purposed instead. The optimized method used a reduced amount of solvents (4 mL) and allows for the quantitative determination of most phenolic compounds in oil samples in less than 10 min. Based on the results, a full discrimination among the most common olive oil varieties was achieved using the relative levels for specific phenolic compounds in the samples.
Declaration of Competing Interest
The authors declare that they have no known competing financial interests or personal relationships that could have appeared to influence the work reported in this paper.
References
- Analysis of phenolic compounds in olive oil by solid-phase extraction and ultra high performance liquid chromatography-tandem mass spectrometry. Food Chem.. 2012;134:2465-2472.
- [CrossRef] [Google Scholar]
- A review of phenolic compounds in oil-bearing plants: Distribution, identification and occurrence of phenolic compounds. Food Chem.. 2017;218:99-106.
- [CrossRef] [Google Scholar]
- Anti-inflammatory activity and phenolic composition of prickly pear (Opuntia ficus-indica) flowers. Ind. Crops Prod.. 2018;112:313-319.
- [CrossRef] [Google Scholar]
- AOAC peer verified methods program, manual on policies and procedures. Maryland, USA, USA: AOAC International; 2012.
- Phenolic profile of virgin olive oils with and without sensory defects: Oils with non-oxidative defects exhibit a considerable concentration of phenols. Eur. J. Lipid Sci. Technol.. 2016;118:299-307.
- [CrossRef] [Google Scholar]
- Assessing the varietal origin of extra-virgin olive oil using liquid chromatography fingerprints of phenolic compound, data fusion and chemometrics. Food Chem.. 2017;215:245-255.
- [CrossRef] [Google Scholar]
- Relevance of functional foods in the Mediterranean diet: the role of olive oil, berries and honey in the prevention of cancer and cardiovascular diseases. Crit. Rev. Food Sci. Nutr.. 2019;59:893-920.
- [CrossRef] [Google Scholar]
- Characterization and evaluation of phenolic profiles and color as potential discriminating features among Spanish extra virgin olive oils with protected designation of origin. Food Chem.. 2018;241:328-337.
- [CrossRef] [Google Scholar]
- Protective effects of extra virgin olive oil phenolics on oxidative stability in the presence or absence of copper ions. J. Agric. Food Chem.. 2006;54:4880-4887.
- [CrossRef] [Google Scholar]
- Characterization of phenolic compounds, Vitamin E and fatty acids from monovarietal virgin olive oils of “Picholine marocaine” cultivar. Molecules. 2020;25
- [CrossRef] [Google Scholar]
- Phenolic compounds: From plants to foods. Phytochem. Rev.. 2012;11:153-177.
- [CrossRef] [Google Scholar]
- A new solid phase extraction for the determination of anthocyanins in grapes. Molecules. 2014;19:21398-21410.
- [CrossRef] [Google Scholar]
- Determination of polyphenols in commercial extra virgin olive oils from different origins (Mediterranean and South American Countries) by liquid chromatography-electrospray time-of-flight mass spectrometry. Food Anal. Methods. 2014;7:1824-1833.
- [CrossRef] [Google Scholar]
- ICH Topic Q2 (R1) Validation of Analytical Procedures. Geneva: Text and Methodology; 2005.
- ISO, 2005. ISO/IEC 17025:2005 General requirements for the competence of testing and calibration laboratories. Switzerland.
- Metabolic profile of olive leaves of different cultivars and collection times. Food Chem.. 2021;345
- [CrossRef] [Google Scholar]
- The secrets of the mediterranean diet. Does [only] olive oil matter? Nutrients. 2019;11
- [CrossRef] [Google Scholar]
- Discrimination of Tunisian and Italian extra-virgin olive oils according to their phenolic and sterolic fingerprints. Food Res. Int.. 2018;106:920-927.
- [CrossRef] [Google Scholar]
- Matrix solid-phase dispersion: A simple and fast technique for the determination of phenolic compounds in olive oil by liquid chromatography. Anal. Methods. 2014;6:8986-8995.
- [CrossRef] [Google Scholar]
- Chemical profiling of Bosana virgin olive oils produced in different areas of Sardinia. JAOCS, J. Am. Oil Chem. Soc.. 2020;97:1119-1129.
- [CrossRef] [Google Scholar]
- Physicochemical characteristics and antioxidant potential of the Greek PDO and PGI Virgin Olive Oils (VOOs) Eur. J. Lipid Sci. Technol.. 2019;121
- [CrossRef] [Google Scholar]
- Metabolic profiling approach to determine phenolic compounds of virgin olive oil by direct injection and liquid chromatography coupled to mass spectrometry. Food Chem.. 2017;231:374-385.
- [CrossRef] [Google Scholar]
- Comparison of different extraction methods to determine phenolic compounds in virgin olive oil. Food Anal. Methods. 2013;6:123-132.
- [CrossRef] [Google Scholar]
- New polymeric materials for solid phase extraction. Crit. Rev. Anal. Chem.. 2017;47:373-383.
- [CrossRef] [Google Scholar]
- Phenolic compounds isolated from olive oil as nutraceutical tools for the prevention and management of cancer and cardiovascular diseases. Int. J. Mol. Sci.. 2018;19
- [CrossRef] [Google Scholar]
- Olive oil polyphenols: A quantitative method by high-performance liquid-chromatography-diode-array detection for their determination and the assessment of the related health claim. J. Chromatogr. A. 2017;1481:53-63.
- [CrossRef] [Google Scholar]
- Plant derived and dietary phenolic antioxidants: Anticancer properties. Food Chem.. 2015;183:235-258.
- [CrossRef] [Google Scholar]
- Solid-phase extraction of soy isoflavones. J. Chromatogr. A. 2005;1076:110-117.
- [CrossRef] [Google Scholar]
- Impact of different types of olive oil on cardiovascular risk factors: A systematic review and network meta-analysis. Nutr. Metab. Cardiovasc. Dis.. 2019;29:1030-1039.
- [CrossRef] [Google Scholar]
- Modulation of phenolic and lipophilic compounds of olive fruits in response to combined drought and heat. Food Chem.. 2020;329
- [CrossRef] [Google Scholar]
- Characterization of phenolic and volatile composition of extra virgin olive oil extracted from six Italian cultivars using a cooling treatment of olive paste. LWT - Food Sci. Technol.. 2018;87:523-528.
- [CrossRef] [Google Scholar]
- Wu, J.-T., A.Wells, D., 2003. Chapter 14 On-line sample preparation: High throughput techniques and strategies for method development, Progress in Pharmaceutical and Biomedical Analysis. https://doi.org/10.1016/S1464-3456(03)80016-9


