

Translate this page into:
Phytochemical and Biological Characterization of Tephrosia nubica Boiss. Growing in Saudi Arabia
⁎Corresponding author. Sah_abdelaziz38@yahoo.de (Sahar Abdelaziz)
-
Received: ,
Accepted: ,
This article was originally published by Elsevier and was migrated to Scientific Scholar after the change of Publisher.
Peer review under responsibility of King Saud University.
Abstract
The chloroform (TNC), ethyl acetate (TNE) and n-butanol (TNB) fractions of Tephrosia nubica Bioss. growing in Saudi Arabia were investigated for the first time using UPLC-ESI-MS/MS in two ionization modes. The analysis revealed the tentative identification of 107 compounds. Moreover, the therapeutic potential of T. nubica fractions was determined by in vitro evaluation of their cytotoxic, antioxidant, and anti-obesity activities using MTT assay, DPPH radical scavenging activity and pancreatic lipase inhibitory assay, respectively. The results showed that TNE, TNB, TNC fractions revealed weak antioxidant activity with SC50 139.9 ± 0.8, 144.9 ± 1.5, 148.9 ± 1.3 µg/mL, respectively compared to ascorbic acid 14.2 ± 0.5 µg/ml. Moreover TNE, TNC fractions showed more significant cytotoxic activity against HepG-2 with IC50 82.1 ± 3.1, 101 ± 2.8 µg/mL and MCF-7 with IC50 114 ± 3.2, 124 ± 3.9 µg/mL respectively. The TNB fraction showed weak cytotoxic activity against both cell lines compared to the other fractions. Ultimately, TNE fraction showed a remarkable anti-obesity activity with IC50 62.4 ± 1.5 µg/mL compared to chloroform fraction with IC50 535.6 ± 2.1 µg/mL and n-butanol fraction which did not show any activity. In conclusion, these findings represent the first insights into the phytochemical constituents and pharmacological properties of T. nubica. The ethyl acetate fraction of T. nubica might be a promising source of functional constituents with antioxidant, cytotoxic and anti-obesity potentials. It might be a natural alternative therapy and nutritional strategy, for obesity treatment without dangerous side effects. Isolation of the bioactive compounds from the ethyl acetate fraction of T. nubica and evaluating their biological activities are recommended.
Keywords
Tephrosia nubica
UPLC-ESI-MS/MS
Antioxidant
Cytotoxicity
Anti-obesity

1 Introduction
Genus Tephrosia belongs to the family Fabaceae (Papilionaceae). This genus includes around 400 species eight of them are present in Saudi Arabia. Plants of this genus are annual perennial, prostrate or erect herbs or woody shrubs widely distributed in tropical and sub-tropical regions all over the world (Al-Ghamdi 2013; Touqeer et al. 2013). Many of Tephrosia plants have valuable traditional uses for the treatment of different diseases such as respiratory disorders, rheumatic pains, syphilis, dropsy, diarrhea, asthma, stomach ache, inflammation and wound healing. Additionally, most of Tephrosia species are characterized by the presence of variable constituents with anti-cancer, antioxidant, larvicidal and antiviral activities (Martinez et al. 2012; Touqeer et al. 2013). Variable classes of compounds are reported in the plants of this genus like chalcones, rotenoids, glucosides, terpenoids, sterols, essential and fixed oils, with the abundance of flavonoids such as flavanols, flavanones, prenylated flavonoids and isoflavones (Chen et al. 2014; Touqeer et al. 2013; Lodhi et al. 2013).
Isoflavones are found predominantly in most of the Fabaceae plants. They have exceptionally amazing therapeutic characteristics. In addition to the antimycotic, anti-inflammatory, and radical scavenging properties, isoflavones considered as phytoestrogens as they show estrogenic and antiestrogenic activities. They have been associated with a decreased risk of arthritis, hormone dependent cancers and neurodegenerative disorders. They also decrease the risk of diseases result from hormonal deficiency such as osteoporosis and cardiovascular troubles after menopause. Isoflavons may be important antioxidant agents since they exhibit hydroxyl groups in rings A and/or B and are thus, capable of donating hydrogen to free radicals (Hanganu et al. 2010).
T. nubica includes two subspecies, ssp. nubica and ssp. arabica (Boiss) which are present on the west costal region of Saudi Arabia. Up till now there are no reports on the phytoconstituents or the biological activities of T. nubica growing in Saudi Arabia. Therefore, it was deemed of interest to investigate the chemical composition of T. nubica chloroform, ethyl acetate and n-butanol fractions to identify their bioactive compounds using UPLC-ESI-MS/MS analysis in addition to the estimation of their antioxidant, cytotoxic and anti-obesity activities. Further studies are planned to isolate and identify major compounds from the most active fraction using variable spectroscopic and spectrometric techniques for future in vivo biological investigation.
2 Materials and methods
2.1 Plant material
The aerial parts of T. nubica Bioss. Fabaceae (Papilionaceae), were collected from south region of Saudi Arabia (20o0′0′' N 42o36′0′' E/ 20.00000oN 42.60000oE) in Feb 2014. Plant material was identified by Prof. Dr. Mohamed Yousef from the Pharmacognosy Department, College of Pharmacy, King Saud University and a Voucher specimen (TN/ 16244/14) was deposited in the herbarium of the Pharmacognosy Department, College of Pharmacy, King Saud University, Saudi Arabia.
2.2 Preparation of T. Nubica crude hydroalcoholic extract and fractions
Ethanol 95% (3x 3L) was used for the extraction of the air dried powdered aerial parts of T. nubica (1000 g). The dried hydroalcoholic extract (249.0 g) was diluted with water/methanol (1: 9) mixture and then successively partitioned with n-hexane, chloroform, ethyl acetate, and n-butanol to give 45.0 g, 38.4 g, 26.0 g, 36. 2 g of n-hexane, chloroform (TNC), ethyl acetate (TNE) and n-butanol (TNB) fractions respectively.
2.3 UPLC- ESI- MS/MS instrument and separation technique
Ultra performance liquid chromatography with electrospray ionization quadrupole linear ion trap tandem mass spectrometry analysis performed on ESI-MS positive and negative ion acquisition modes was carried out on a XEVO TQD triple quadruple instrument. Method in a multiple-reaction monitoring (MRM) mode was employed for the quantitative determination of phytochemicals. TNC, TNE and TNB fractions were analyzed by UPLC, in order to obtain chromatographic profiles of the more polar portions of the extracts, which contain phenolic and flavonoid compounds. The samples were dissolved in HPLC grade methanol, filtered through 0.2 μm membrane disc filter and resulting solution concentrations were in 0.2 to 0.5 mg/mL range, depending on each fraction. The UPLC system was a Waters Corporation, Milford, MA01757 U.S.A, mass spectrometer. The reverse-phase separations were performed (ACQUITY UPLC - BEH C 18 1.7 µm − 2.1 × 50 mm Column. (50 mm × 1.2 mm [inner diameter] and 1.7 µm particle size) at 0.2 m/mL flow rate. A previously reported gradient program was applied for the analysis (Hassan et al., 2019). The mobile phase comprised of acidified water containing 0.1% formic acid (A) and acidified methanol containing 0.1% formic acid (B). The employed elution conditions were: 0–2 min 10% B isocratic; 2–5 min, linear gradient B 10 to 30%; 5–15 min, linear gradient from 30% to 70% B; 15–22 min, linear gradient from 70% to 90% B; 22–25 min, 90% B isocratic and finally washing and reconditioning of column was done. Electrospray ionization (ESI) was performed in both negative and positive ion modes to obtain more data. The parameters for analysis were carried out using negative ion mode as follows: source temperature 150 °C, cone voltage 30 eV, capillary voltage 3 kV, desolvation temperature 440 °C, cone gas flow 50 L/h, and desolvation gas flow 900 L/h. Mass spectra were detected in the ESI between m/z 100–1000 atomic mass unit. Chemical constituents were identified by their ESI- QqQLIT–MS/MS spectra and fragmentation patterns. The peaks and spectra were processed using the Maslynx 4.1 software and tentatively identified by comparing its retention time (Rt), mass spectrum with reported data and Library search (such as FooDB (http://www.Foodb.ca)).
2.4 Antioxidant assay
The antioxidant activity of TNC, TNE and TNB fractions of T. nubica Boiss was determined at the Regional Center for Mycology and Biotechnology (RCMB) at Al-Azhar University, Cairo, Egypt, using the free radical 2,2-diphyenyl-picrylhydrazyl (DPPH) scavenging assay, as described by (Al Khateeb et al. 2017).
2.4.1 DPPH radical scavenging activity (Yen and Duh 1994)
Freshly prepared (0.1 mM) solution of 2,2-diphenyl-1-picrylhydrazyl (DPPH) and different tested extracts prepared at 5, 10, 20, 40, 80, 160 and 320 µg/mL in methanol were used and stored at 10 C° in the dark (Gülçin et al. 2004). Absorbance measurements of the DPPH radical without antioxidant (control) and the reference compound ascorbic acid (5, 10, 20, 40, 80, 160 and 320 µg/mL) were recorded immediately with a UV–visible spectrophotometer (Milton Roy, Spectronic 1201). All the determinations were performed in three replicates and averaged. The percentage inhibition of the DPPH radical was calculated according to the formula: where AC = Absorbance of the control solution and AS = absorbance of the sample in DPPH solution.
The percentage of DPPH radical-scavenging was plotted against each extract concentrations and ascorbic acid (µg/mL) to determine scavenging capacity (SC50) which is the concentration required to scavenge DPPH by 50% (i.e. concentration giving 50% reduction in the absorbance of a DPPH solution from its initial absorbance).
2.5 Cytotoxicity assay
The cytotoxic effect of T. nubica fractions (TNC, TNE, TNB) against HepG-2 and MCF-7 cells was investigated using 3-(4, 5- dimethylthiazole-2-yl)-2, 5- diphenyl-tetrazolium bromide (MTT) against DMSO and cisplatin as negative and positive controls, respectively. HepG-2 and MCF-7cell lines were obtained from American Type Culture Collection (ATCC, Rockville, MD). The cells were propagated on Dulbecco’s modified Eagle’s medium (DMEM) supplemented with 10% heat-inactivated fetal bovine serum, 1% L-glutamine, HEPES buffer and 50 µg/mL gentamycin. The cells were maintained at 37 °C in a humidified atmosphere with 5% CO2 and were subcultured two to three times a week. For antitumor assays, the tumor cell lines were suspended in medium at concentration 5x10⁴ cell/well in Corning® 96-well tissue culture plates, and then incubated for 24 hr. The tested extracts were then added into 96-well plates (six replicates) to achieve eight concentrations for each extract. Six vehicle controls with media or 0.5% DMSO were run for each 96 well plate as a control. After incubating for 24 h, the numbers of viable cells were determined by the MTT test. Briefly, the media was removed from the 96 well plates and replaced with 100 µL of fresh culture DMEM medium without phenol red then 10 µL of the 12 mM MTT stock solution (5 mg of MTT in 1 mL of phosphate buffered saline (PBS)) to each well including the untreated controls. The 96 well plates were then incubated at 37 °C and 5% CO2 for 4 h. An 85 µL aliquot of the media was removed from the wells, and 50 µL of DMSO was added to each well and mixed thoroughly with the pipette and incubated at 37 °C for 10 min. Then, the optical density was measured at 590 nm with the microplate reader (SunRise, TECAN, Inc, USA) to determine the number of viable cells and the percentage of viability was calculated.
Cell viability % = [1-(ODt/ODc)]x100% where,
ODt is the mean optical density of wells treated with the tested sample and ODc is the mean optical density of untreated cells.
The relation between surviving cells and each extract concentration (1–500 μg/mL) is plotted to get the survival curve of each tumor cell line after treatment with the tested fraction. The 50% inhibitory concentration (IC50), the concentration required to cause toxic effects in 50% of intact cells, was estimated from graphic plots of the dose response curve (log extract concentration on X-axis vs. percentage viability from untreated cells on Y-axis) for each conc. using non-linear regression analysis (Dose-response inhibition, log inhibitor vs. normalized response-variable slop) of GraphPad Prism 5 software (GraphPad Software, San Diego, California) (Gomha et al. 2015; Mosmann 1983). All experiments were repeated at least three times. Results are reported as means ± SD.
2.6 In vitro anti-obesity activity using pancreatic lipase inhibitory assay
The lipase inhibition activity of TNC, TNE and TNB fractions of T. nubica was determined by (Kim et al. 2010) method. In this assay, the porcine pancreatic lipase activity was measured using p-nitrophenyl butyrate (NPB) as a substrate. Lipase solution (100 µg/mL) was prepared in a 0.1 mM potassium phosphate buffer (pH 6.0). Samples with different concentrations (7.81–1000 μg/mL) were pre-incubated with 100 µg/mL of lipase for 10 min at 37 °C. The reaction was then started by adding 0.1 mL NPB substrate. After incubation at 37 °C for 15 min, p-nitrophenol amount released in the reaction was measured using Multiplate Reader. Orlistat was used with the same concentrations as a control. The results were expressed as percentage inhibition, which was calculated using the formula, Inhibitory activity (%) = (1 − As/Ac) × 100, where, As is the absorbance in the presence of test substance and Ac is the absorbance of control. The IC50 value was defined as the concentration of pancreatic lipase inhibitor to inhibit 50% of its activity under the assay conditions. Estimation of IC50 was done from dose response curve graphic plots for each conc. by using non-linear regression analysis of GraphPad Prism 5 software. Each experiment was performed in triplicates, and all values are represented as means ± standard deviation of triplicates.
3 Results and discussion
3.1 Structural identification of polyphenols and other constituents by UPLC-ESI-MS/MS
In this study, UPLC- ESI-MS/MS in both negative and positive ion modes was used to analyze TNC, TNE and TNB fractions of T. nubica for the first time. The identification of compounds based on their MS2 data given by mass of the precursor ion and their fragments, together with neutral mass loss and known fragmentation patterns for the given classes of compounds as well as comparison with the available literature library search. The compounds were arranged according to retention time (Rt).
The distribution of the identified compounds in the three analyzed samples can be checked in Table 1 that lists the 107 compounds detected with UPLC-ESI-MS/MS in negative and positive modes. The table includes compounds' names, retention times' (Rt) of the assigned peaks, molecular ion value either [M−H]- or [M + H]+ as well as MS2 signals and used published references which helped to confirm the proposed identification of compounds in different tested fractions of T. nubica. *= Potassium adduct; **= Sodium adduct; Rt = Retention time; Ref. = Reference; TNC = Chloroform; TNE = Ethyl acetate; TNB = n- butanol.
No.
Compound name
Rt
(min)[M−H]-
(m/z)[M + H]+
(m/z)MS2 fragments (m/z)
TNC
TNE
TNB
Ref.
1
Oleuropein
0.82
539
377, 341, 307, 215, 179
+
+
(Zemmouri et al. 2014)
2
Tyrosol
0.82
121
103, 93, 77
+
+
(Lambert et al. 2015)
3
Succinic acid
1.12
117
117, 99, 73
+
(Jackson Seukep et al. 2020)
4
p-Hydroxybenzoic acid
1.78
137
93
+
(El-Sayed et al. 2017)
5
p-Hydroxy benzoic acid isomer
4.85
139
121, 111
+
(FooDB 2020)
6
Hydroxy methoxy benzoic acid hexoside (vanillic acid glucoside)
6.73
329
329, 167 [M−H−162]-, 123
+
(Ancillotti et al. 2018)
7
Loliolide
7.04
197
179, 161, 135, 107
+
+
+
(Abu-Reidah et al. 2019)
8
Naringenin-7-O-glucoside
7.67
433
433, 271, 151, 119
+
(Jackson Seukep et al. 2020)
9
Succinic acid isomer
8.85
117
117, 99, 73
+
(Jackson Seukep et al. 2020)
10
Quercetin hexoside
8.95
463
301, 300
+
(Natić et al. 2015)
11
Succinic acid isomer
9.07
117
99, 73
+
(Jackson Seukep et al. 2020)
12
Hydroxy methoxy benzoic acid hexoside (vanillic acid glucoside) isomer
9.28
329
329, 167 [M−H−162]-, 123
+
(Ancillotti et al. 2018)
13
Artonin G
9.34
503
475, 447
+
(Ye et al. 2019)
14
Syringaresinol O-D-glucopyranoside
9.51
579
417 [M−H−162]-
+
(Ni et al. 2008)
15
Apigenin-O-glucoside
9.58
431
269 [M−H−162]-, 225, 151
+
(Jackson Seukep et al. 2020)
16
p-Hydroxybenzoic acid isomer
9.76
137
93
+
(El-Sayed et al. 2017)
17
Peonidin-3-O-glucoside
10.01
463
301
+
(Lee et al. 2009)
18
Apigenin-O-hexoside
10.16
433
271, 153
+
(Abu-Reidah et al. 2019)
19
Kaempferl-3-O- rhamnoside (afzelin)
10.27
433
471*, 433, 287 [M + H- 146]+
+
(Jang et al. 2018)
20
kaempferol-3-O-galactoside (trifolin)
10.46
449
471**, 449, 287
+
(Jang et al. 2018)
21
Luteolin-7-O- glucoside
10.46
447
285, 257, 243
+
+
(Ziani et al. 2018)
22
kaempferol-3-O-galactoside (trifolin) isomer
10.62
449
471**, 449, 287
+
+
(Jang et al. 2018)
23
Luteolin-7-O- glucoside isomer
10.62
447
285, 257, 243
+
+
(Ziani et al. 2018)
24
Nonanedioic acid (Azelaic acid)
10.88
187
125, 97
+
+
(Jackson Seukep et al. 2020)
25
Kaempferol-3-O-glucuronide
10.93
461
285
+
(Davis et al. 2006)
26
6-Methyl brosimacutin D/
6-Methyl brosimacutin E10.93
355
337, 295, 283, 235, 217 (100%), 163
+
(Xu et al. 2012)
27
Dehydrocycloxanthohumol
11.21
353
233, 147
+
(Stevens et al. 1997)
28
5-Hydroxy-3,4′,7-trimethoxy-flavone
11.23
327
312, 297
+
(Simirgiotis et al. 2015)
29
Heterophyllin
11.85
503
285, 259, 243
+
(Ye et al. 2019)
30
Kaempferol-3-O-glucoside (astragalin)
12.46
449
471**, 287[M + H-162]+
+
+
(Jang et al. 2018)
31
Kaempferol -O-dihexoside
12.47
609
285[M-H-162–162]-
+
(Ziani et al. 2018)
32
Formononetin
12.61
267
252
+
(Clarke et al. 2008)
33
7,3′,4′-Trihydroxyflavone
12.68
271
243
+
(Aldini et al. 2011)
34
Heterophyllin isomer
13.37
503
285, 259, 243
+
(Ye et al. 2019)
35
Succinic acid isomer
13.49
117
99
+
(Jackson Seukep et al. 2020)
36
Genistein
13.58
269
133
+
+
(Singh et al. 2010)
37
Apigenin-O-hexoside isomer
13.60
433
271 [M + H-162]+, 153
+
+
(Abu-Reidah et al. 2019)
38
Axillarin hexoside
13.76
509
449, 347, 303
+
(Bakr et al. 2016)
39
Hispidulin-7-O-hexoside
13.76
461
447, 299, 255
+
(Spínola et al. 2015)
40
Moracin F
13.90
285
285, 255, 213
+
+
(FooDB 2020)
41
Cirsimaritin (5,4′-dihydroxy-6,7-dimethoxyflavone)
14.10
313
298, 283
+
(Hossain et al. 2010)
42
Isorhamnetin
14.13
317
302, 168
+
+
(Abu-Reidah et al. 2019)
43
Scrophulein
14.51
315
300, 282, 254
+
(Abu-Reidah et al. 2019)
44
Daidzein
14.71
255
295 [M + 2H + K]+, 278** 237, 199, 157, 137
+
(de Rijke 2005; Lee et al. 2005)
45
Chrysin hexoside
14.71
415
415, 253[M-H-162]-, 209
+
(FooDB 2020)
(Fabre et al. 2001)
46
Dehydrocycloxanthohumol isomer
15.09
353
233, 147
+
(Stevens et al. 1997)
47
Hydroxy methoxy benzoic acid hexoside (vanillic acid glucoside) isomer
15.20
329
329, 167 [M−H−162]-, 123
+
(Ancillotti et al. 2018)
48
Glucaric acid derivative
15.45
425
327, 209
+
(Spínola et al. 2015)
49
Nonanedioic acid (Azelaic acid) isomer
15.50
187
187, 125, 97
+
(Jackson Seukep et al. 2020)
50
(-)-Pinellic acid
15.56
329
329, 311, 229, 211, 171, 139, 99
+
(Jackson Seukep et al. 2020)
51
Lactuside B
15.67
429
231, 185, 175, 157
+
(Abu-Reidah et al. 2019)
52
Carnosol
15.91
329
285
+
(Hossain et al. 2010)
53
(+)- Catechin
15.92
291
273, 249, 165, 151, 139, 123, 119
+
(Aldini et al. 2011)
54
(-)-Pinellic acid isomer
16.01
329
329, 311, 229, 211, 171, 139, 99
+
(Jackson Seukep et al. 2020)
55
Cinnamic acid-O-xylosylhexoside
16.14
487
548 [M−2H + Na + K]-, 509 [M−2H + Na]-, 441, 293
+
(Spínola et al. 2015)
56
Corylidin
16.14
369
391**, 323, 309, 297, 295, 281, 269
+
(Xu et al. 2012)
57
Dehydrocycloxanthohumol isomer
16.17
353
233, 147
+
(Stevens et al. 1997)
58
(-)-Pinellic acid isomer
16.32
329
329, 311, 229, 211, 171, 139, 99
+
+
(Jackson Seukep et al. 2020)
59
Artonin G isomer
16.53
503
447
+
(Ye et al. 2019)
60
Corosolic acid
16.72
471
427
+
(Abu-Reidah et al. 2019)
61
Euchrenone a7 malonate
17.11
427
341[M + H-86]+, 205, 163, 149, 145, 135, 121, 117, 93, 69, 65
+
+
(Xu et al. 2012)
62
Glucaric acid derivative
17.13
425
327, 209
+
(Spínola et al. 2015)
63
Cinnamic acid-O-xylosylhexoside isomer
17.35
487
548 [M−2H + Na + K]-, 509 [M−2H + Na]+, 441, 293
+
(Spínola et al. 2015)
64
Psorachalcone A
17.35
341
269, 221, 203, 175, 161, 149, 147, 121, 119, 93
+
+
+
(Xu et al. 2012)
65
Glucaric acid derivative
17.94
425
327, 209
+
+
+
(Spínola et al. 2015)
66
Bakuchiol
17.94
257
145, 133, 121, 107, 81, 69
+
+
(Xu et al. 2012)
67
Kaempferol hexoside glucuronide
18.36
625
449, 287
+
+
(Bakr et al. 2016)
68
(-)-Pinellic acid isomer
18.47
329
329, 311, 229, 211, 171, 139, 99
+
+
(Jackson Seukep et al. 2020)
69
Linoleic acid
18.50
279
261
+
(Della Corte et al. 2015)
70
(-)cis-Rotenolone
18.81
411
393, 381, 378, 367, 257, 207, 187, 143, 139, 109, 85, 81, 43
+
+
(FooDB 2020)
(Caboni et al. 2008)
71
Oxooctadecadienoic acid
19.42
293
275, 235
+
(Abu-Reidah et al. 2019)
72
Moracin L
19.47
323
323, 255, 225
+
(FooDB 2020)
73
Naringenin-O-diglucoside
19.50
595
433[M-H-162]-, 313, 271[M-H-162–162]-, 177
+
(Jackson Seukep et al. 2020)
74
Quercetin
19.75
301
227, 151
+
(Hossain et al. 2010)
75
Dimethyl rosmarinic acid glucuronide
19.81
563
387, 359
+
(Achour et al. 2018)
76
Bakuchalcone/ bavachromanol
20.19
341
221, 203, 163, 161
+
(Xu et al. 2012)
77
13S-Hydroxyoctadecadienoic acid
20.25
295
295, 251
+
(Jackson Seukep et al. 2020)
78
Oxooxtadecadienoic acid isomer
20.52
293
275, 235
+
(Abu-Reidah et al. 2019)
79
13-Keto-9Z,11E-octadecadienoic acid
20.68
293
293, 265
+
+
+
(Jackson Seukep et al. 2020)
80
13S-Hydroxyoctadecadienoic acid isomer
21.15
295
295, 251
+
+
+
(Jackson Seukep et al. 2020)
81
Myricetin
21.19
319
277, 263, 245, 153
+
+
(de Rijke 2005)
82
(-)-Epicatechin
21.69
291
331 [M + H2O + Na]+, 291
+
(Jang et al. 2018)
83
7,3′,4′-Trihydroxyflavone isomer
21.80
271
243
+
(Aldini et al. 2011)
84
Moracin O
23.18
325
325, 293
+
(FooDB 2020)
85
Gancaonin A / Gancaonin M
23.31
353
391*, 375**, 297, 285, 269, 221, 69
+
(Xu et al. 2012)
86
6-Prenylnaringenin derivative
23.90
517
339, 219
+
+
(Clarke et al. 2008)
87
Artoindonesianin I
24.09
505
447, 285
+
(Ye et al. 2019)
88
Psoralenol
24.24
339
377*, 321, 279 , 267, 251, 239, 223, 137
+
+
(Xu et al. 2012)
89
Lanopalmitic acid
24.36
271
225
+
+
+
(Abu-Reidah et al. 2019)
90
3-(6-malonyl-glucopyranosyl)-rosmarinic acid
24.89
609
361
+
(Abu-Reidah et al. 2019)
91
Gancaonin A / Gancaonin M isomer
25.06
353
391*, 375**, 297, 285, 269, 221, 69
+
+
+
(Xu et al. 2012)
92
Cohumulone
25.24
347
278
+
(Quifer-Rada et al. 2015)
93
Quercetin isomer
25.37
303
179, 151
+
(Abu-Reidah et al. 2019)
94
Isoxanthohumol
25.82
355
299, 235, 179, 147
+
(Stevens et al. 1997)
95
Ethyl myristate
26.31
255
255
+
+
+
(Jackson Seukep et al. 2020)
96
7,3′,4′-Trihydroxyflavone isomer
26.31
271
243
+
+
(Aldini et al. 2011)
97
Oleic acid
26.74
281
281
+
+
+
(Jackson Seukep et al. 2020)
98
Icariside E7
27.09
595
351, 207
+
+
(Abu-Reidah et al. 2019)
99
Morachalcone A
27.47
341
382 [M + H + H2O + Na] +, 380*, 359 [M + H + H2O]+, 267 [M + H-74]+, 149
+
+
+
(Seo et al. 2015)
100
Apigenin
28.25
271
271, 153
+
(Abu-Reidah et al. 2019)
101
Oleic acid isomer
28.43
281
281
+
(Jackson Seukep et al. 2020)
102
Naringenin
28.47
271
187, 151
+
(Chen et al. 2015)
103
Conidendrin
29.17
355
340 (M−H−CH3)-, 337 (M−H−H2O)-, 322, 310 (M−H−CH2−O−CH3)-, 295
+
+
(Sanz et al. 2012)
104
Ethyl myristate isomer
29.44
255
255
+
(Jackson Seukep et al. 2020)
105
Cistanoside F
30.48
487
487, 179, 161, 135
+
(Sanz et al. 2012)
106
Ethyl myristate isomer
31.11
255
255
+
(Jackson Seukep et al. 2020)
107
Dimethyl rosmarinic acid
31.23
387
359
+
(Achour et al. 2018)
When using negative polarity in LC-MS analyses, the major signal found in the spectra was the pseudomolecular ion [M - H]-. On the contrary, in positive ion mode, in many cases [M + H]+ was not the usual MS signal; water losses were very common ([M + H-H2O]+) and alkali adducts (mainly [M + Na]+ and [M + K]+) were also regularly existed.
3.1.1 Phenolic derivatives
Tyrosol (2) was characterized by two fragments m/z 93; corresponding to the phenol group and m/z 77; corresponding to the aromatic ring, respectively (Lambert et al. 2015). Tyrosol showed a protonated molecular ion at m/z 121 that not refer to the [M + H]+ ion, but to the [M−H2O + H]+ according to Lambert et al. (2015)
Succinic acid (3) and its isomers (9, 11 and 35) (Jackson Seukep et al. 2020) and p-hydroxybenzoic acid (4) and its isomers (5 and 16) (El-Sayed et al. 2017; FooDB 2020) were recognized by comparing its MS2 fragmentation pattern with the previously reported data.
The LC–ESI–MS/MS spectra of the molecular ion peak [M−H]- at m/z 329 gave the fragment ion at m/z 167 that indicate the neutral loss for one glucose moiety (162 Da) assigned a hydroxy methoxy benzoic acid hexoside that known as vanillic acid glucoside (6) and its isomers (12, 47) (Ancillotti et al. 2018).
Azelaic acid (nonanedioic acid) (24) and its isomer (49) which are dicarboxylic acids were identified (Jackson Seukep et al. 2020).
Compound 55 and its isomer (63) exhibited molecular ion at m/z 487 in MS spectrum. However, the product ion in MS/MS spectrum was at m/z 293 [M + H-162–132]+ corresponding to cinnamic acid in structure and to the neutral loss of hexosyl (162 Da) and xylosyl (132 Da) moieties. Therefore, the compound was assigned to cinnamic acid-O-xylosylhexoside (Spínola et al. 2015).
Three rosmarinic acid derivatives were detected in the chloroform fraction of T. nubica. The precursor ion of compound 75 was detected at m/z 563 [M−H]- and its characteristic MS2 fragment ions at m/z 387 [M−H−176]- suggesting the neutral loss of glucuronide moiety (176 Da) and at m/z 359 related to deprotonated rosmarinic acid and consequently it was tentatively identified as dimethyl rosmarinic acid glucuronide, while compound 107 produced a pseudomolecular ion at m/z 387 with main MS2 fragment at m/z 359 and was tentatively identified as dimethyl rosmarinic acid (Achour et al. 2018). Compound 90 was identified as 3-(6-malonyl-glucopyranosyl)-rosmarinic acid (MS1 at m/z 609 [M + H]+, MS2 at m/z 361 [M + H-176–86]+ revealing the loss of glucuronide (176 Da) and malonyl (86 Da) moieties) (Abu-Reidah et al. 2019).
Cohumulone (92) (Quifer-Rada et al. 2015) and conidendrin (1 0 3) (Sanz et al. 2012) were annotated by matching with previous reports. Additionally, the peak eluting at Rt 30.48 min was tentatively assigned to a phenylethanoid derivative, which has been described as cistanoside F (1 0 5). Its fragmentation pattern was characterized by a major signal at m/z 179 [M−H−caffeoyl−rhamnosyl]-, m/z 161 corresponding to further loss of water molecule and at m/z 135 [caffeic acid-CO2]- (Sanz et al. 2012).
3.1.2 Lignans
Syringaresinol-O-D-glucopyranoside (14) (Ni et al. 2008) and icariside E7 (98) (Abu-Reidah et al. 2019) were identified by LC-MS as previously published.
3.1.3 Fatty acids
The compounds tentatively annotated as fatty acid derivatives, were showed only in negative mode. The fatty acids found were a (-)-pinellic (50), its isomers (54, 58 and 68), 13S-hydroxyoctadecadienoic (77), its isomer (80), 13-keto-9Z,11E-octadecadienoic (79), ethyl myristate (95), its isomers (104, 106), oleic (97), its isomer (1 0 1) (Jackson Seukep et al. 2020), linoleic (69) (Della Corte et al. 2015) oxooctadecadienoic (71), its positional isomer (78) and lanopalmitic acid (89) (Abu-Reidah et al. 2019).
3.1.4 Flavonoids
3.1.4.1 Flavanones
Six flavanones (8, 26, 61, 73, 86, 102) were identified in the evaluated samples (four of them were in negative ionization mode and the other two were in positive mode).
Compound 26 with [M + H]+ at m/z 355 was tentatively assigned as 6-methylbrosimcutin D/ 6-methylbrosimcutin E showing daughter ions at m/z 337, 295, 283, by successive diagnostic losses of H2O (18 Da), C3H8O (60 Da) and C4H8O (72 Da), respectively that yielded from a 2,2-dimethyl-3-hydroxydihydropyran ring suggesting that there was a mono-hydroxy-prenyl group in its structure (Xu et al. 2012). Compound 61 with a protonated ion at m/z 427 was tentatively assigned as euchrenone a7 malonate (7,2′,4′-trihydroxy-8-isoprenylflavanone malonate) with main MS2 fragment ion at m/z 341 [M + H-86]+ corresponding to loss of a malonic acid moiety (86 Da) and producing identical product ions as euchrenone a7 (Xu et al. 2012).
Two naringenin glycosides, naringenin-7-O-glucoside (8) and naringenin-O-diglucoside (73), were detected at Rt 7.67 and 19.50 min (Jackson Seukep et al. 2020). Compound 86 with [M−H]- at m/z 517 was characterized as a 6-prenylnaringenin derivative showing typical aglycone at m/z 339 (Clarke et al. 2008). Naringenin (1 0 2) was recognized by comparing its MS2 fragmentation pattern with the previously reported data (Chen et al. 2015).
3.1.4.2 Flavonols
Five flavonols were detected in examined fractions. Quercetin hexoside was proposed for compound 10 at Rt 8.95 min (m/z 463, [M−H]-). In the MS2 spectrum, a fragment ion at m/z 301, which corresponds to quercetin in structure after hexose unit loss (Natić et al. 2015). Quercetin (74) and its isomer (93) were recognized by comparing its MS/MS fragmentation pattern with the previously reported data either in negative ionization mode (Hossain et al. 2010) or positive mode (Abu-Reidah et al. 2019), respectively.
Compound 38 showed mass spectrum with a precursor ion at m/z 509 [M + H]+. This precursor ion showed MS/MS spectrum with a product ion at m/z 449 [M−H−60]- after the neutral loss of two methoxy moieties (60 Da) and MS2 fragment at m/z 347 [M + H-162]+ suggesting the neutral loss of hexose moiety and was tentatively identified as axillarin hexoside (axillaroside) (Bakr et al. 2016). Compound related to peak 42 was identified as isorhamnetin. It exhibited a protonated molecular ion at m/z 317 (Abu-Reidah et al. 2019)
3.1.4.3 Flavones
For compounds 13 and 59, the neutral loss of 56 Da (C4H8 unit) from [M -H]- ion at m/z 503 to produce ion peak at m/z 447 and loss of 28 Da (CO unit) from deprotonated molecular ion to produce ion peak at m/z475, suggested that these compounds identified as prenylated flavonoid known as artonin G (Ye et al. 2019).
Four apigenine derivatives were detected. Compound 15 with [M−H]- at m/z 431 was characterized as apigenin-O-glucoside showing typical aglycone at m/z 269 after loss of 162 mass units (glucosyl moiety) (Jackson Seukep et al. 2020). Additionally compound 18 and its isomer (37) showed a protonated pseudomolecular ion at m/z 433 (MS2 at m/z 271 [M + H−glc.]+ which have been described as apigenin-O-hexoside, while apigenin aglycone (1 0 0) was identified as previously published (Abu-Reidah et al. 2019) and it was considered as a major compound in TNE(+) fraction. Luteolin-7-O-glucoside was proposed for compounds 21 and 23 as previously reported (Ziani et al. 2018) and it was represented as the major compound in n-butanol spectrum (in negative mode).
Seven kaempferol derivatives were detected. Kaempferol-3-O-glucuronide (25) (Davis et al. 2006), and kaempferol-O-dihexoside (31) (Ziani et al. 2018), kaempferol-3-O-rhamnoside (afzelin) (19) were tentatively identified by neutral loss of 176 Da (glucuronide moiety), 324 Da (two hexosyl moiety), 146 Da (rhamnosyl moiety), respectively. While kaempferol-3-O-galactoside (trifolin) (20), its isomer (22), and kaempferol-3-O-glucoside (astragalin) (30) (Jang et al. 2018) were identified by neutral loss of 162 Da (galactose or glucose moieties). Kaempferol hexoside glucuronide (67) was identified by loss of 176 Da (glucuronyl moiety) and additional loss of 162 Da (hexosyl moiety) (Bakr et al. 2016).
Compound 28, showed a deprotonated molecular ion at m/z 327 producing daughter fragment ions at m/z 312 [M−H−CH3]- and m/z 297 [M−H−2CH3]-, was identified as 5-hydroxy-3,4′,7-trimethoxy flavone (Simirgiotis et al. 2015). 5,4′-dihydroxy-6,7-dimethoxyflavone that is known as cirsimaritin (41) (Hossain et al. 2010) was identified as previously published in negative ionization mode while scrophulein (43), which is known as cirsimaritin, was detected in positive ionization mode (Abu-Reidah et al. 2019).
Heterophyllin (29), its positional isomer (34) and artoindonesianin I (87) were identified in the ethyl acetate fraction by the comparison of their MS spectrum in full scan mode and MS/MS spectrum with the published data (Ye et al. 2019). Chrysin hexoside (45) (Fabre et al. 2001) and hispidulin-7-O-hexoside (39) (Spínola et al. 2015) were tentatively identified as previously published. Three isomers (33, 83 and 96) with a molecular ion at m/z 271 in ESI+ mode were tentatively identified as 7,3′,4′-trihydroxyflavone (Aldini et al. 2011). Myricetin (3,5,7,3′,4′,5′-hexahydroxyflavone) was proposed for the compound 81 (de Rijke 2005).
3.1.4.4 Isoflavones
Six isoflavones such as formononetin (32), genistein (36), daidzein (44), gancaonin A/gancaonin M (85, 91) and psoralenol (88) were identified. The major compound in ethyl acetate spectrum was formononetin (32) (7-hydroxy-4′-methoxy isoflavone) that showed a [M−H]- at m/z 267 producing a daughter fragment ion at m/z 252 [M−H−CH3]- (Clarke et al. 2008). Genistein (36) (5,7,4′-trihydroxy isoflavone) (Singh et al. 2010) and daidzein (44) (Lee et al. 2005; de Rijke 2005) were identified as previously published.
Compounds 85, 88 and 91 were identified as prenylated isoflavonoids. Gancaonin A / gancaonin M (85) and its isomer (91) have one prenyl chain in its structure which was evidenced by a characteristic fragment ion at m/z 69 of the isoprene (C5H9) moeity in addition to presence of daughter ion at m/z 297 [M + H-56]+ due to the neutral loss of C4H8 (56 Da) moiety (Xu et al. 2012; Seo et al. 2015). Gancaonin A / gancaonin M was the major compound in TNC(+) and TNE(+) spectra.
Psoralenol (88) showed MS1 at m/z 339 [M + H]+, MS2 at m/z 267 [M + H-72]+, 279 [M + H-60]+ and 321 [M + H-18]+ revealing the loss of C4H8O (72 Da), C3H8O (60 Da) and H2O (18 Da) moieties that indicated that this compound contains 2,2-dimethyl-3-hydroxydihydropyran ring. In addition to MS2 peak at m/z 137 that suggest the presence of mono-hydroxy-prenyl group in ring A (Xu et al. 2012).
3.1.4.5 Flavanols
Flavanols as (+)- catechin (53) (Aldini et al. 2011) and (-)- epicatechin (82) (Jang et al. 2018) with [M + H]+ at m/z 291 for both of them were identified in positive ionization mode in tested ethyl acetate fraction as previously published.
3.1.5 Chalcones
Seven chalcones were described in different fractions of T. nubica in LC-ESI-MS-MS positive mode. Dehydrocycloxanthohumol (27), its isomers (46 and 57), isoxanthohumol (94) (Stevens et al. 1997), bakuchalcone/ bavachromanol (76), psorachalcone A (64) (Xu et al. 2012) and morachalcone A (99) (Seo et al. 2015) were confirmed by comparing their MS/MS spectra with those of reported data. Morachalcone A (99) was the major compound in n-butanol fraction.
3.1.6 Terpenoid derivatives
Carnosol proposed for compound 52 (m/z 329, [M−H]-) (Hossain et al. 2010), while corosolic acid is proposed for compound 60 (m/z 471, [M−H]-) (Abu-Reidah et al. 2019) and bakuchiol (66) (Xu et al. 2012) as monoterpene phenol were identified as previously reported. Bakuchiol was the major compound in chloroform fraction.
3.1.7 Anthocyanins
Compound 17 was tentatively identified as peonidin-3-O-glucoside as it exhibited [M + H]+ ion at m/z 463 and MS2 base peak ion at m/z 301 [M + H-162]+ after the neutral loss of glucosyl moiety (162 Da) (Lee et al. 2009).
3.1.8 Benzofurane compounds
In negative mode analysis, three benzofurane derivatives were identified, moracin F (40), moracin L (72) and moracin O (84) with [M−H]- at m/z 285, 323 and 325, respectively (FooDB 2020) while in positive ionization mode only loliolide (7) as benzofurane derivative with [M + H]+ at m/z 197 was detected (Abu-Reidah et al. 2019).
3.1.9 Miscellaneous compounds
Oleuropein (1) showed a deprotonated pseudomolecular ion at m/z 539 (MS2 at m/z 377 [M−H−glc.]- and 307 [M−H−glc.-C4H6O]-) (Zemmouri et al. 2014). Oleuropein was previously reported to be identified in Tephrosia (Nigam and Arnold 2018). Glucaric acid derivatives (48, 62, 65) with [M + H]+ at m/z 425 were identified in negative ionization mode as major compound in tested chloroform fraction (Spínola et al. 2015).
In positive mode analysis, one sesquiterpene lactone known as lactuside B (51) with [M + H]+ at m/z 429 (Abu-Reidah et al. 2019), one rotenoid known as (-)cis-rotenolone (70) with [M + H]+ at m/z 411 (Caboni et al. 2008; FooDB 2020) were detected. As well as, one coumarin compound, corylidin (56), with [M + H]+ at m/z 369 and MS2 fragments at m/z 309 [M + H-60]+ corresponding to loss of C2H4O2 and at m/z 297 [M + H-72]+ corresponding to loss of C4H8O (Xu et al. 2012) was detected.
3.2 The antioxidant activity
Antioxidants are able to decrease, delay or maybe inhibit the oxidative damage through scavenging of free radicals. These reactive oxygen species play a vital role within the pathogenesis of various diseases like cancer, hypertension, diabetes, atherosclerosis, and inflammatory disease (Sharma et al. 2018; Vladimir-Knežević et al. 2011). Polyphenols especially flavonoids are one of the most important natural antioxidants which are widely distributed in various plant families including Fabaceae. This family includes many species which are valuable sources of natural antioxidants (Hanganu et al. 2010).
Plants fortified with antioxidants, such as isoflavonoid, can also be regarded as an alternative method for handling and treating chronic diseases linked to oxidative stress (de Mendonça et al. 2020).
It was reported that flavonoids are strong free radical scavengers as they are able to donate hydrogen from their phenolic groups (Hanna 2011; Tripoli et al. 2007). The flavonoids antioxidant activity is related to the presence of catechol structure (3′, 4′ hydroxyl groups) in the B ring which enhances lipid peroxidation inhibition. Additionally, the presence of 2, 3-double bond in conjugation with the carbonyl group and the hydroxyl groups in C3 and C5 increase the antioxidant activity of flavonoids (Heim et al. 2002; Tripoli et al. 2007). On the other hand, the absence of the hydroxyl group attached to C3 in flavonones decreases the antioxidant activity (Hanna 2011; Tripoli et al. 2007). (See Fig. 1)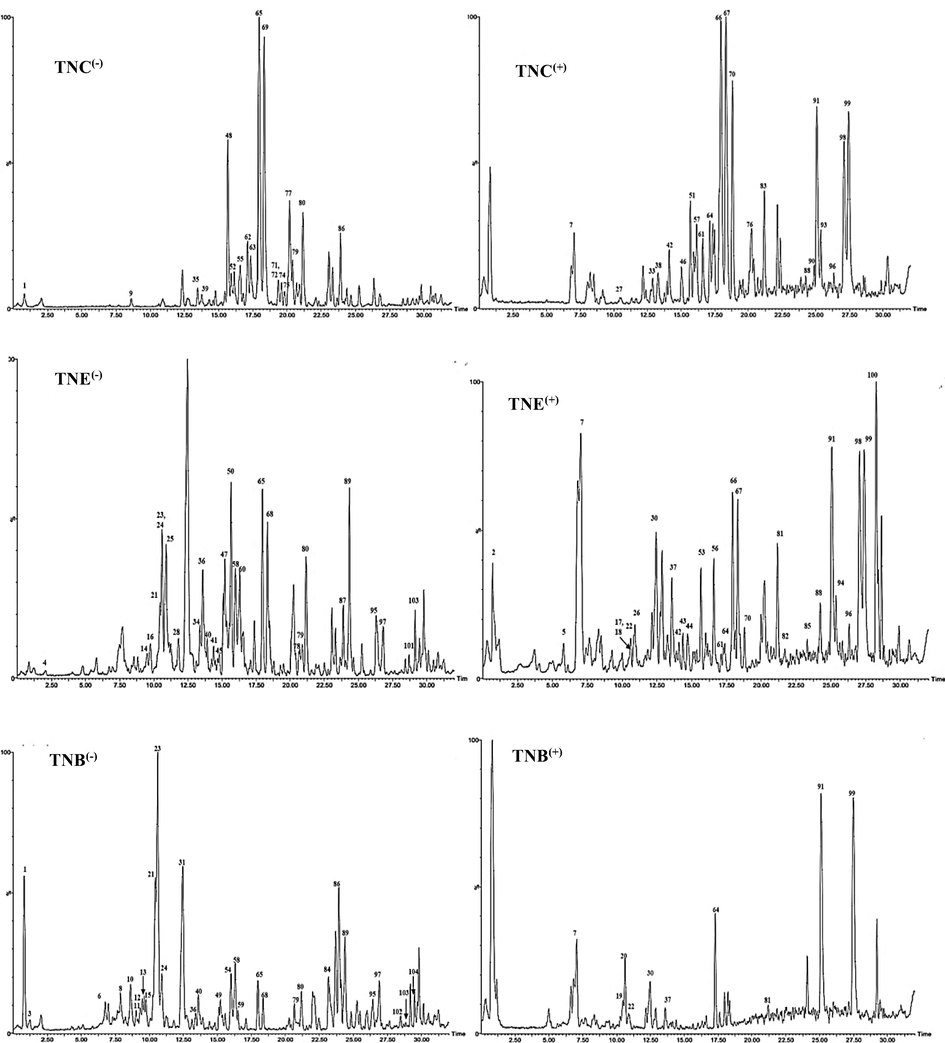
UPLS-ESI-MS chromatograms of T. nubica aerial parts chloroform (TNC), ethyl acetate (TNE) and n-butanol (TNB) fractions in negative (−) and positive (+) ionization modes.
In the present research, series of concentrations ranged from 5 to 320 μg/mL in methanol were used. The DPPH scavenging percentage of TNC, TNE and TNB as well as ascorbic acid as standard and SC50 values (the concentration required to scavenge DPPH by 50%) are presented in Fig. 2 A and B, respectively. All of them showed a concentration-dependent antioxidant activity as demonstrated by increase in their DPPH radical scavenging activity. The smaller the SC50 the higher the scavenging activity is. The tested fraction or compound is considered as a very strong antioxidant when SC50 values < 50, strong (50–100), moderate (100–150), and weak (151–200) µg/mL (Winarsi and Yuniaty 2019) Therefore, according to the SC50 values, all the tested fractions of T. nubica (TNE, TNC, and TNB) showed a moderate antioxidant activity with SC50 139.9 ± 0.8, 144.9 ± 1.5 and 148.9 ± 1.3 µg/mL respectively compared to ascorbic acid 14.2 ± 0.5 µg/mL.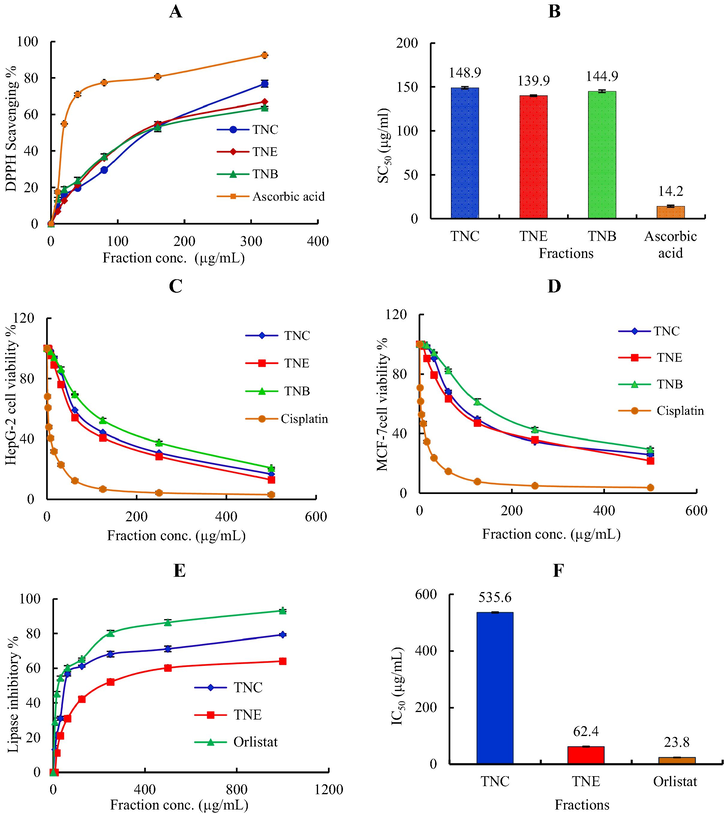
(A): 2,2-diphyenyl-picrylhydrazyl (DPPH) radical scavenging activity of different concentrations (5–320 µg/mL) of T. nubica fractions. Data are presented as averages ± standard deviations from three experiments. (B): SC50 of antioxidant activity of T. nubica fractions and ascorbic acid. (C): Cytotoxic activity of T. nubica fractions against HepG-2 cell line at different concentrations (D): Cytotoxic activity of T. nubica fractions against MCF-7 cell line at different concentrations. (E): In vitro lipase inhibitory activity of T. nubica fractions compared to orlistat standard. (F): IC50 of anti-obesity activity of T. nubica fractions and orlistat. TNC (chloroform fraction), TNE (ethyl acetate fraction) and TNB (n-butanol fraction).
TNE exhibited the highest antioxidant activity compared to the other two tested fractions as indicated by its high DPPH scavenging percentage (68%) at 320 μg/mL and low SC50 values (139.9 ± 0.8 μg/mL). Its activity can be attributed to the presence of monoterpene phenol (bakuchiol) (Ma et al. 2020) and polyphenolic compounds such as phenolic acids and flavonoids (i.e., p-hydroxybenzoic acid, vanillic acid glucoside, formononetin, apigenin, kaempferol-3-O-glucuronide, genistein and artoindonesianin I).
During this study, bakuchiol and many major flavonoids were detected in LC-MS analysis of TNE (formononetin, apigenin, kaempferol-3-O-glucuronide, genistein and artoindonesianin I). Correlation between radical scavenging ability, SC50 values, and the identified phenolic acids and flavonoids in LC-MS analysis is considerable as extracts with higher flavonoids and/or phenolics contents showed higher antioxidant activity and lower SC50 value. These results are in accordance with the previous reports about the antioxidant properties of many Tephrosia species (Egharevba et al. 2019; Sindhu et al. 2017; Martinez et al. 2012; Hanganu et al. 2010).
3.3 The cytotoxic activity
The risk of neoplasia is increasing worldwide with higher mortality rates every year. Breast cancer is the main cause of cancer death among females that is responsible for 15–25% of all cancer cases and deaths. Liver cancer is much more common in males. Furthermore, it is the second major cause of cancer death in men all over the world especially in underdeveloped countries (Torre et al. 2015). Recently, natural products and plant-derived compounds have attracted the attention of many researchers as a promising cancer therapy (Al-Abbasi et al. 2016; Solowey et al. 2014; Wannes et al. 2017).
The in-vitro cytotoxic activity T. nubica (TNC, TNE, and TNB) fractions against HepG-2 (hepatocellular carcinoma) and MCF-7 (breast carcinoma) using MTT assay and cisplatin as a positive standard was also studied. The rule used to evaluate the activity of T. nubica fractions depends on the IC50 values as reported by (Srisawat et al. 2013)). The tested fraction is considered as highly active when IC50 = 20 µg/mL, moderately active, IC50 = 21–200 µg/mL, weakly active IC50 = 201–500 µg/mL and inactive IC50 > 501 µg/mL.
According to the IC50 values, all the tested fractions of T. nubica (TNC, TNE, and TNB) as shown in (Fig. 2 C & D and Table 2), showed a decline in the cell viability in a dose-dependent manner against HepG-2 and MCF-7 cells. The ethyl acetate and chloroform fractions showed more significant cytotoxic activity against HepG-2 with IC50 82.1 ± 3.1, 101 ± 2.8 µg/mL and MCF-7 with IC50 114 ± 3.2, 124 ± 3.9 µg/mL respectively. While n-butanol fraction showed moderate cytotoxicity against HepG-2 with IC50 145 ± 7.9 µg/mL and a weak cytotoxic effect against MCF-7 with IC50 201 ± 5.8 µg/mL compared to the other fractions (Table 2). These are the mean of three determinations.
Cell line
Tested fractions
IC50 (µg/mL)
TNC
TNE
TNB
Cisplatin
HepG-2 (Hepatocellular carcinoma)
101 ± 2.8
82.1 ± 3.1
145 ± 7.9
3.67 ± 3.8
MCF-7 (Breast carcinoma)
124 ± 3.9
114 ± 3.2
201 ± 5.8
5.71 ± 1.3
In case of HepG-2 cell line, the cytotoxicity of the applied fractions was arranged as follows: TNE > TNC > TNB. Unfortunately, TNB exhibited the weakest cytotoxic activity against HepG-2 cell line with IC50 of 145 ± 7.9 μg/mL when compared to cisplatin, 3.67 ± 3.8 μg/mL. The higher activity of TNE (IC50 = 82.1 ± 3.1 μg/mL) as a strong cytotoxic may be attributed to the presence of major compounds such as formononetin (de Mendonça et al. 2020).
Also, as indicated by IC50 values, the cytotoxicity of tested fractions against MCF-7 cell line is arranged as follow: TNE > TNC > TNB. A close cytotoxic effect was shown by TNE and TNC (IC50 114 ± 3.2 and 124 ± 3.9 μg/mL, respectively).The cytotoxic activity of TNE may be attributed to formononetin as it was reported as a cytotoxic agent in a previous study (de Mendonça et al. 2020), and this cytotoxic activity may be enhanced by the presence of bakuchiol according to (Zhang et al. 2016)
This is the first report about the cytotoxic activity of T. nubica and these results are in agreement with the previous literatures about different Tephrosia species antitumor activities. The ethyl acetate fraction of T. purpurea showed hepatoprotective activity against CCl4 induced hepatotoxicity in rats at doses of 50 mg/kg (Shah et al. 2011). Additionally, flavonoids isolated from the stems of T. toxicaria ethyl acetate fraction have cancer chemopreventive activity (Jang et al. 2003). Moreover, T. calophylla, T. candida and T. tinctoria have been studied using different cell lines (Ganapaty et al. 2009a; Ganapaty et al. 2009b; Parmar et al. 1988; Roy et al. 1986). In a different study the root extract of T. calophylla inhibited growth and induced apoptosis in the human breast carcinoma (Adinarayana et al. 2009). Investigation of the chloroform fraction of T. nubica in a previous study revealed the presence of prenylated flavones in addition to flavones and isoflavones. However, kaempferol 3,7 dirhamnoside, quercetin 3-galactoside 7-rhamnoside, and quercetin 3, 7 dirhamnoside, rotenone and deguelin were isolated from T. nubica methanolic extract (Sharaby and Ammar 1997).
The significant cytotoxic activity of the ethyl acetate and chloroform fractions of T. nubica in the current study may be attributed to the presence of bakuchiol and high flavonoidal content especially isoflavones.
3.4 The anti-obesity activity
Obesity is a serious worldwide health problem afflicting both developed and undeveloped countries and affecting all ages of populations. It is considered as a risk factor related to the development of different metabolic disorders such as hypertension, cardiovascular disease, type 2 diabetes, atherosclerosis and dyslipidemia (Zielinska-Blizniewska et al. 2019; Roh and Jung 2012). Currently, natural products and plant-derived compounds have attracted the attention for the obesity management by developing safe and efficient anti-obesity drugs (Nderitu et al. 2017).
Up to date nothing was reported about the anti-obesity activity of T. nubica growing in Saudi Arabia. In the present study screening of T. nubica ethyl acetate, chloroform and n-butanol fractions by pancreatic lipase inhibitory assay was carried out and shown in Fig. 2 (E & F).
The results showed that TNE exhibited remarkable inhibitory activity than the TNC with IC50 62.4 ± 1.5, 535.6 ± 2.1 µg/mL respectively. The IC50 value of ethyl acetate fraction (62.4 ± 1.5) is comparable with that of orlistat (23.8 ± 0.7). It was reported that organic acids (such as p-hydroxybenzoic acid) (Huang et al. 2015) and polyphenolic compounds (such as apigenin, formononetin, kaempferol-3-O-glucuronide, genistein and artoindonesianin I) (Yajima et al. 2005; Lei et al. 2007) in the plants are responsible for the anti-obesity activity. These compounds were detected as major compounds in TNE and absent in TNB chromatograms that may explaine why TNB fraction showed no anti-obesity activity.
Recently, the management of obesity by using natural compounds is not fully investigated and might be a significant substituent for producing harmless and efficient anti-obesity drugs (Nderitu et al. 2017). To the best of our knowledge, nothing was reported on the anti-obesity activity of T. nubica, so future studies are planned to isolate and purify the active compounds of T. nubica active fractions for further in vivo evaluation.
4 Conclusion
The current study represents the first research reporting the phytochemical constituents and pharmacological properties of T. nubica. Based on the results it could be concluded that the ethyl acetate fraction of T. nubica showed significant antioxidant, cytotoxic and anti-obesity activities compared to the other tested fractions. Finally, it might be an important natural alternative therapy especially for obesity treatment that makes it the good candidate for further anti-obesity drug development. Isolation of the major bioactive compounds from the most active fractions and investigation of their biological activities are planned in the further studies.
Acknowledgments
The authors thank Prof. Dr. Mohamed Yousef, Pharmacognosy Department, College of Pharmacy, King Saud University (KSU) for the plant identification.
Funding/support
This research did not receive any specific grant from funding agencies in the public, commercial, or not-for-profit sectors.
Authors’ contributions
All authors made considerable contributions to the manuscript. HA, SA, WH, and ME designed the study. WH, HA, SA and ME performed the experiments. SA,WH and ME interpreted the results. ME, SA, HA, and WH wrote the manuscript. All authors revised the manuscript and confirmed it for publication.
Declaration of Competing Interest
The authors declare that there are no conflicts of interest.
References
- Untargeted metabolite profiling and phytochemical analysis of Micromeria fruticosa L. (Lamiaceae) leaves. Food Chem.. 2019;279:128-143.
- [Google Scholar]
- Bioavailability and metabolism of rosemary infusion polyphenols using Caco-2 and HepG2 cell model systems. J. Sci. Food Agric.. 2018;98(10):3741-3751.
- [Google Scholar]
- Growth inhibition and induction of apoptosis in estrogen receptor positive and negative human breast carcinoma cells by Tephrosia calophylla roots. Pharm. Chem. J.. 2009;3:35-41.
- [Google Scholar]
- Gingerol synergizes the cytotoxic effects of doxorubicin against liver cancer cells and protects from its vascular toxicity. Molecules. 2016;21(7):886.
- [Google Scholar]
- Morphological Diversity of Some Tephrosia Species (Fabaceae) in Saudi Arabia. Am. J. Plant Sciences. 2013;4(3):543-548.
- [Google Scholar]
- In vitro propagation, genetic stability, and secondary metabolite analysis of wild lavender (Lavandula coronopifolia Poir.) Hortic. Environ. Biotechnol.. 2017;58(4):393-405.
- [Google Scholar]
- An integrated high resolution mass spectrometric and informatics approach for the rapid identification of phenolics in plant extract. J. Chromatogr. A. 2011;1218(20):2856-2864.
- [Google Scholar]
- Untargeted metabolomics analytical strategy based on liquid chromatography/electrospray ionization linear ion trap quadrupole/orbitrap mass spectrometry for discovering new polyphenol metabolites in human biofluids after acute ingestion of Vaccinium myrtillus berry supplement. J. Am. Soc. Mass Spectrom.. 2018;30(3):381-402.
- [Google Scholar]
- Phenolic profile of Centaurea aegyptiaca l. Growing in egypt and its cytotoxic and antiviral activities. Afr. J. Tradit. Complement. Altern. Med.. 2016;6:135-143.
- [Google Scholar]
- LC–MS–MS determination of rotenone, deguelin, and rotenolone in human serum. Chromatographia. 2008;68(9–10):739-745.
- [Google Scholar]
- Characterization and quantification by LC-MS/MS of the chemical components of the heating products of the flavonoids extract in Pollen typhae for transformation rule exploration. Molecules. 2015;20(10):18352-18366.
- [Google Scholar]
- Determination of phytoestrogens in dietary supplements by LC-MS/MS. Food Addit. Contam.. 2008;25(5):534-547.
- [Google Scholar]
- Identification of isomeric flavonoid glucuronides in urine and plasma by metal complexation and LC-ESI-MS/MS. J. Mass Spectrom.. 2006;41(7):911-920.
- [Google Scholar]
- de Mendonça, M.A., Ribeiro, A.R., Lima, A.K.d. et al., 2020. Red propolis and its dyslipidemic regulator formononetin: evaluation of antioxidant activity and gastroprotective effects in rat model of gastric ulcer. Nutrients 12 (10):2951.
- de Rijke, E., 2005. Trace-level determination of flavonoids and their conjugates: Application to plants of the Leguminosae family.
- A rapid LC–MS/MS method for quantitative profiling of fatty acids, sterols, glycerolipids, glycerophospholipids and sphingolipids in grapes. Talanta. 2015;140:52-61.
- [Google Scholar]
- Antidiabetic, antioxidant and antimicrobial activities of extracts of Tephrosia bracteolata leaves. Heliyon. 2019;5(8):e02275
- [Google Scholar]
- Phytoconstituents, LC-ESI-MS Profile, antioxidant and antimicrobial Activities of Citrus x limon L. Burm. f. cultivar Variegated pink lemon. J. Pharmaceutical Sci. Res.. 2017;9(4):375.
- [Google Scholar]
- Determination of flavone, flavonol, and flavanone aglycones by negative ion liquid chromatography electrospray ion trap mass spectrometry. J. Am. Soc. Mass Spectrom.. 2001;12(6):707-715.
- [Google Scholar]
- FooDB, 2020. The Metabolomics Innovation Centre https://foodb.ca/.
- Cytotoxicity and antiprotozoal activity of flavonoids from three Tephrosia species. J. Natural Remedies. 2009;9(2):202-208.
- [Google Scholar]
- Cytotoxic benzil and coumestan derivatives from Tephrosia calophylla. Phytochemistry. 2009;70(1):95-99.
- [Google Scholar]
- Synthesis, characterization, and pharmacological evaluation of some novel thiadiazoles and thiazoles incorporating pyrazole moiety as anticancer agents. Monatsh. Chem.. 2015;146(1):149-158.
- [Google Scholar]
- Antioxidant, antimicrobial, antiulcer and analgesic activities of nettle (Urtica dioica L.) J. Ethnopharmacol.. 2004;90(2–3):205-215.
- [Google Scholar]
- Hanganu, D., Vlase, L., OLAH, N., 2010. Phytochemical analysis of isoflavons from some Fabaceae species extracts. Notulae Botanicae Horti Agrobotanici Cluj-Napoca 38 (1):57-60.
- Isolation and structure elucidation of two diastereoisomeric prenylated flavonoids from Tephrosia apollinea root and their Chemotaxonomic Significance. Khartoum, Sudan, Master Master: The University of Khartoum; 2011.
- Chemical composition and biological activities of the aqueous fraction of Parkinsonea aculeata L. Growing in Saudi Arabia. Arabian J. Chem.. 2019;12(3):377-387.
- [Google Scholar]
- Flavonoid antioxidants: chemistry, metabolism and structure-activity relationships. J. Nutritional Biochemistry. 2002;13(10):572-584.
- [Google Scholar]
- Characterization of phenolic composition in Lamiaceae spices by LC-ESI-MS/MS. J. Agric. Food. Chem.. 2010;58(19):10576-10581.
- [Google Scholar]
- Effect of Hibiscus sabdariffa extract on high fat diet–induced obesity and liver damage in hamsters. Food & nutrition research. 2015;59(1):29018.
- [Google Scholar]
- In vitro antibacterial and antiproliferative potential of Echinops lanceolatus Mattf. (Asteraceae) and identification of potential bioactive Compounds. Pharmaceuticals (Basel). 2020;13(4):59.
- [Google Scholar]
- Potential cancer chemopreventive flavonoids from the stems of Tephrosia toxicaria. J. Nat. Prod.. 2003;66(9):1166-1170.
- [Google Scholar]
- Characterization and quantification of flavonoid glycosides in the Prunus genus by UPLC-DAD-QTOF/MS. Saudi J. Biological Sci.. 2018;25(8):1622-1631.
- [Google Scholar]
- Anti-obesity effect of Morus bombycis root extract: anti-lipase activity and lipolytic effect. J. Ethnopharmacol.. 2010;130(3):621-624.
- [Google Scholar]
- A high-throughput UHPLC-QqQ-MS method for polyphenol profiling in rosé wines. Molecules. 2015;20(5):7890-7914.
- [Google Scholar]
- Lee, J.H., Kang, N.S., Shin, S.-O. et al., 2009. Characterisation of anthocyanins in the black soybean (Glycine max L.) by HPLC-DAD-ESI/MS analysis. Food Chemistry 112 (1):226-231.
- Identification of flavonoids using liquid chromatography with electrospray ionization and ion trap tandem mass spectrometry with an MS/MS library. Rapid Commun. Mass Spectrom.. 2005;19(23):3539-3548.
- [Google Scholar]
- Evidence of anti-obesity effects of the pomegranate leaf extract in high-fat diet induced obese mice. Int. J. Obesity. 2007;31(6):1023.
- [Google Scholar]
- Wound-healing effect of flavonoid-rich fraction from Tephrosia purpurea Linn. on streptozotocin-induced diabetic rats. J. Herbs Spices Med Plants. 2013;19(2):191-205.
- [Google Scholar]
- Ma, W., Guo, W., Shang, F. et al., 2020. Bakuchiol alleviates hyperglycemia-induced diabetic cardiomyopathy by reducing myocardial oxidative stress via activating the SIRT1/Nrf2 signaling pathway. Oxidative Medicine and Cellular Longevity 2020.
- Tephrosia sinapou extract reduces inflammatory leukocyte recruitment in mice: effect on oxidative stress, nitric oxide and cytokine production. Revista Brasileira de Farmacognosia. 2012;22(3):587-597.
- [Google Scholar]
- Rapid Colorimetric Assay for Cellular Growth and Survival: Application to Proliferation and Cytotoxicity Assays.. 1983;vol 65
- Analysis and characterisation of phytochemicals in mulberry (Morus alba L.) fruits grown in Vojvodina North Serbia. Food Chemistry. 2015;171:128-136.
- [Google Scholar]
- Antiobesity activities of methanolic extracts of Amaranthus dubius, Cucurbita pepo, and Vigna unguiculata in progesterone-induced obese Mice. Evidence-Based Complementary Alternative Medicine 2017
- [Google Scholar]
- Fingerprint analysis of Eucommia bark by LC-DAD and LC-MS with the aid of chemometrics. Chromatographia. 2008;67(3–4):211-217.
- [Google Scholar]
- Phytochemical investigation and quantitative estimation of flavonoid and phenolic contents of the root, stem and leaves of tephrosia purpurea linn. Journal of Drug Delivery and Therapeutics. 2018;8(5-s):283-287.
- [Google Scholar]
- Phytochemical investigation of Tephrosia candida: HPLC separation of tephrosin and 12 α-hydroxyrotenone. J. Nat. Prod.. 1988;51(1) 185-185
- [Google Scholar]
- A comprehensive characterisation of beer polyphenols by high resolution mass spectrometry (LC–ESI-LTQ-Orbitrap-MS) Food Chem.. 2015;169:336-343.
- [Google Scholar]
- Screening of crude plant extracts with anti-obesity activity. Int. J. Mol. Sci.. 2012;13(2):1710-1719.
- [Google Scholar]
- LC-DAD/ESI-MS/MS study of phenolic compounds in ash (Fraxinus excelsior L. and F. americana L.) heartwood. Effect of toasting intensity at cooperage. J. Mass Spectrom.. 2012;47(7):905-918.
- [Google Scholar]
- Neuroprotective effect of prenylated arylbenzofuran and flavonoids from morus alba fruits on glutamate-induced oxidative injury in HT22 hippocampal cells. J. Med. Food. 2015;18(4):403-408.
- [Google Scholar]
- Evaluation of hepatoprotective activity of ethyl acetate fraction of Tephrosia purpurea. Pharmacologyonline. 2011;3:188-194.
- [Google Scholar]
- Biological activity of extracts of Tephrosia nubica (Boiss) Baker against Spodoptera littoralis (Boisd.) and Agrotis ipsilon (Hufn.) Der Tropenlandwirt-J. Agriculture Tropics Subtropics. 1997;98(2):143-150.
- [Google Scholar]
- A comprehensive review of free radicals, antioxidants, and their relationship with human ailments. Crit. Rev. Eukaryot. Gene Expr.. 2018;28(2):139-154.
- [Google Scholar]
- Antioxidant capacities and analysis of phenolic compounds in three endemic Nolana species by HPLC-PDA-ESI-MS. Molecules. 2015;20(6):11490-11507.
- [Google Scholar]
- A review on the pharmacological profile of Tephrosia calophylla. Indo American Journal of Pharmaceutical Sciences. 2017;4(5):1361-1365.
- [Google Scholar]
- High-throughput quantification of isoflavones, biochanin A and genistein, and their conjugates in female rat plasma using LC-ESI-MS/MS: Application in pharmacokinetic study. J. Sep. Sci.. 2010;33(21):3326-3334.
- [Google Scholar]
- Solowey, E., Lichtenstein, M., Sallon, S. et al., 2014. Evaluating medicinal plants for anticancer activity. The Scientific World Journal 2014.
- Identification and quantification of phenolic compounds of selected fruits from Madeira Island by HPLC-DAD-ESI-MSn and screening for their antioxidant activity. Food Chem.. 2015;173:14-30.
- [Google Scholar]
- Phytochemical screening and cytotoxicity of crude extracts of Vatica diospyroides Symington Type LS. Trop. J. Pharm. Res.. 2013;12(1):71-76.
- [Google Scholar]
- Torre, L.A., Bray, F., Siegel, R.L. et al., 2015. Global cancer statistics, 2012. CA: A Cancer Journal for Clinicians 65 (2):87-108.
- A review on the phytochemistry and pharmacology of genus Tephrosia. Phytopharmacology. 2013;4(3):598-637.
- [Google Scholar]
- Citrus flavonoids: Molecular structure, biological activity and nutritional properties: A review. Food Chem.. 2007;104(2):466-479.
- [Google Scholar]
- Antioxidant activities and polyphenolic contents of three selected Micromeria species from Croatia. Molecules. 2011;16(2):1454-1470.
- [Google Scholar]
- A review of Tunisian medicinal plants with anticancer activity. J. Complementary Integrative Medicine. 2017;15(1)
- [Google Scholar]
- Antioxidant exploration in cardamom rhizome potential as a functional food ingredient. IOP Conference Series: Earth and Environ. Sci.. 2019;1:012019
- [Google Scholar]
- Simultaneous characterization of prenylated flavonoids and isoflavonoids in Psoralea corylifolia L. by liquid chromatography with diode-array detection and quadrupole time-of-flight mass spectrometry. Rapid Commun. Mass Spectrom.. 2012;26(19):2343-2358.
- [Google Scholar]
- Prevention of diet-induced obesity by dietary isomerized hop extract containing isohumulones, in rodents. Int. J. Obesity. 2005;29(8):991.
- [Google Scholar]
- Characterization and identification of prenylated flavonoids from Artocarpus heterophyllus Lam. roots by Quadrupole Time-of-Flight and Linear Trap Quadrupole Orbitrap Mass spectrometry. Molecules. 2019;24(24):4591.
- [Google Scholar]
- Scavenging effect of methanolic extracts of peanut hulls on free-radical and active-oxygen species. J. Agric. Food Chem.. 1994;42(3):629-632.
- [Google Scholar]
- Zemmouri, H., Ammar, S., Boumendjel, A. et al., 2014. Chemical composition and antioxidant activity of Borago officinalis L. leaf extract growing in Algeria. Arabian Journal of Chemistry 12 (8):1954-1963.
- The chemical constituents and bioactivities of Psoralea corylifolia Linn.: a review. Am. J. Chinese Med.. 2016;44(01):35-60.
- [Google Scholar]
- Profiling polyphenol composition by HPLC-DAD-ESI/MSn and the antibacterial activity of infusion preparations obtained from four medicinal plants. Food Funct.. 2018;9(1):149-159.
- [Google Scholar]
- Plant extracts and reactive oxygen species as two counteracting agents with anti-and pro-obesity properties. Int. J. Mol. Sci.. 2019;20(18):4556.
- [Google Scholar]


