

Translate this page into:
Phytochemical composition, antioxidant, anti-tyrosinase, anti-cholinesterase, and anti-inflammatory activities of Rhynchanthus beesianus rhizome extracts
⁎Corresponding authors. mytian@gzu.edu.cn (Minyi Tian), dongxintang0319@163.com (Dongxin Tang)
-
Received: ,
Accepted: ,
This article was originally published by Elsevier and was migrated to Scientific Scholar after the change of Publisher.
Abstract
Rhynchanthus beesianus is a medicine food homology plant, and its rhizome is a food spice and traditional Chinese medicine used to treat inflammation-related disorders. Still, little research has been done on its phytochemicals and biological activities. Therefore, this study firstly reported the phytochemical analysis by UHPLC-Q-Orbitrap-MS, antioxidant, anti-enzymatic, and anti-inflammatory effects of R. beesianus rhizome water extract (WE) and 70% ethanol extract (EE). For phytochemical analysis, WE and EE had high total phenolic (25.57–28.19 mg GAE/g extract) and flavonoid (10.57–28.08 mg RE/g extract) contents, and further UHPLC-Q-Orbitrap-MS test identified sixty-one compounds, including twelve phenolic compounds and six flavonoids. In the antioxidant assay, WE and EE showed significant DPPH (IC50: 83.93 ± 5.90 and 69.48 ± 1.57 μg/mL, respectively) and ABTS (IC50: 73.46 ± 0.69 and 40.72 ± 0.67 μg/mL, respectively) radical scavenging ability, especially the efficacy of EE was superior or equivalent to that of positive control BHT. Moreover, the WE and EE exhibited poor inhibition on acetylcholinesterase (IC50: 3.31 ± 0.16 and 3.53 ± 0.14 mg/mL, respectively), butyrylcholinesterase (IC50: 1.29 ± 0.02 and 0.75 ± 0.08 mg/mL, respectively), and tyrosinase (IC50: 5.91 ± 0.63 and 21.30 ± 1.52 mg/mL, respectively). Interestingly, EE showed remarkable inhibition on NO, PGE2, IL-6, and TNF-α produced by LPS stimulation without cytotoxicity. It reduced ROS generation and down-regulated mRNA and protein levels of iNOS and COX-2 in LPS-stimulated RAW264.7 macrophages. Besides, EE decreased LPS-stimulated MAPKs (ERK, p38, and JNK) phosphorylation and inhibited NF-κB p65 nuclear translocation by suppressing the phosphorylation and degradation of IκBα. Therefore, R. beesianus can be used as a promising natural antioxidant, enzyme inhibitor, and anti-inflammatory agent with great exploitation potential in functional food and pharmaceuticals.
Keywords
Phytochemical composition
Antioxidant activity
Tyrosinase inhibition
Cholinesterase inhibition
Anti-inflammatory action

- WE
-
Water extract
- EE
-
70% Ethanol extract
- TPC
-
Total phenol content
- TFC
-
Total flavonoid content
- mg GAE/g extract
-
milligrams of gallic acid equivalent per gram of extract
- mg RE/g extract
-
milligrams of rutin equivalent per gram of extract
- UHPLC-Q-Orbitrap-MS
-
Ultra-high-performance liquid chromatography coupled to quadrupole-Orbitrap high-resolution mass spectrometry
- LPS
-
Lipopolysaccharide
- DXM
-
Dexamethasone
- ROS
-
Reactive oxygen species
- ELISA
-
Enzyme-linked immunosorbent assay
- qRT-PCR
-
Real-time quantitative PCR
- SDS-PAGE
-
Sodium dodecyl sulfate-polyacrylamide gel electrophoresis
- NO
-
Nitric oxide
- PGE2
-
Prostaglandin E2
- COX-2
-
Cyclooxygenase-2
- iNOS
-
Inducible nitric oxide synthase
- TNF-α
-
Tumor necrosis factor-alpha
- IL-6
-
Interleukin-6
- MAPK
-
Mitogen-activated protein kinase
- p38
-
MAPK p38
- JNK
-
c-Jun N-terminal kinase
- ERK
-
Extracellular signal-regulated kinase
- IκB
-
Inhibitor of κB
- NF-κB
-
Nuclear factor-κB
Abbreviations
1 Introduction
Overaccumulation of reactive oxygen species (ROS) can lead to severe harm to intracellular macromolecules like lipids, proteins, and nucleic acids, which are closely implicated in various diseases (Brieger, et al., 2012; Ho et al., 2019). Previous studies have demonstrated that antioxidants are beneficial in preventing and treating Alzheimer's disease and hyperpigmentation disorders (Bhatt et al., 2021; Ho et al., 2019). Besides, inhibition of macrophage-generated ROS can aid in treating inflammation-mediated illnesses (Rendra et al., 2019).
Enzymes are important targets for disease intervention and perform catalytic functions in diverse physiological responses (Copeland, 2013). More than 90 enzyme inhibitors have been marketed as drugs (Baloglu et al., 2019). Excess buildup of melanin on the skin's surface leads to freckles, age spots, melanoma, and other diseases; inhibition of tyrosinase, a crucial enzyme for melanin synthesis, is the main therapy for these diseases (Liu et al., 2022). As one of the commonly occurring neurodegenerative disorders, Alzheimer's disease is closely associated with a functional defect of the cholinergic system. Blocking cholinesterase function can restore cholinergic stability and relieve clinical symptoms of Alzheimer's disease (Elufioye et al., 2010).
Inflammation involves multiple pathological processes, including the above-mentioned Alzheimer's disease and hyperpigmentation disorders (Medzhitov, 2008; Rodrigues and Ayala-Cortés, 2018). Chronic inflammation is accompanied by the overproduction of pro-inflammatory factors, like pro-inflammatory mediators (NO and PGE2) and cytokines (IL-6 and TNF-α), and inhibiting their over-production has become an important means of inflammatory therapy (Gu et al., 2020). Inflammation-related signaling pathways, including MAPK and NF-κB, regulate the transcription of multiple pro-inflammatory factor-related genes, and their persistent activation can aggravate inflammation (Zhang et al., 2021). ROS act as secondary messengers and amplify inflammatory responses by activating MAPK and NF-κB (Liu et al., 2012; Park et al., 2015). Therefore, suppressing the activation of MAPK and NF-κB pathways mediated by ROS can ameliorate inflammation-related diseases.
Natural products of plant origin are rich in antioxidants, especially phenols and flavonoids, which can combat disease by regulating oxidative stress and scavenging free radicals (Boo, 2019). Phenolics and flavonoids can suppress inflammatory responses by inhibiting ROS generation and blocking MAPK and NF-κB activation (Hussain et al., 2016). In addition, natural products are excellent sources of enzyme inhibitors, including tyrosinase and cholinesterase (Filho et al., 2006; Gonçalves and Romano, 2017). Plant-derived compounds have fewer side effects than synthetic chemicals, so they have received increasing attention in the development of antioxidants, enzyme inhibitors, and anti-inflammatory agents (Virshette et al., 2019).
The genus Rhynchanthus J. D. Hooker belongs to the Zingiberaceae family (Gao et al., 2006; The Plant List, 2022). Rhynchanthus beesianus W. W. Smith is a medicine food homology plant with tuberous rhizomes, which is extensively cultivated in Southern China (Gao et al., 2006; Wu and Larsen. 2000). R. beesianus rhizome and tender leaf are consumed as a vegetable and food spice (Zhu et al., 2021). In addition, its rhizome is utilized in traditional Chinese medicine as an aromatic stomachic to remedy inflammation-related dyspepsia and stomachache (CHMC-Chinese Herbal Medicine Company, 1994; Chinese Materia Medica Editorial Committee, 1999; He, 2016). We have demonstrated that essential oils from R. beesianus have potent antibacterial and anti-inflammatory properties (Chen et al., 2021; Zhao et al., 2020). Besides, fifteen phenolic compounds were isolated and identified from R. beesianus rhizome, some of which were demonstrated to possess antioxidant and cytoprotective effects (Zhu et al., 2021). Currently, little research has been done on the phytochemicals and biological activities of R. beesianus, which may limit its industrial application. Hence, we analyzed the phytochemical constituents of R. beesianus rhizome WE and EE and assessed their antioxidant, anti-enzymatic, and anti-inflammatory capacities. To our knowledge, the phytochemical analysis by UHPLC-Q-Orbitrap-MS and biological activities of R. beesianus rhizome extracts were first reported.
2 Materials and methods
2.1 Chemicals and reagents
RAW264.7 mouse macrophages and L929 mouse fibroblast cells were supplied by Kunming cell bank (Kunming, China). Roswell Park Memorial Institute-1640 medium (RPMI-1640) and Dulbecco's modified eagle medium (DMEM) were purchased from Thermo Fisher Scientific (Waltham, MA, USA). Rutin, gallic acid, MTT (3-[4, 5-Dimethylthiazol-2-yl]-2, 5-diphenyltetrazolium bromide), dimethyl sulfoxide (DMSO), dexamethasone (DXM), lipopolysaccharide (LPS), and reactive oxygen species assay kit were from Solarbio Science & Technology (Beijing, China). NO detection kit, nuclear protein and cytoplasm protein extraction kit, RIPA lysis buffer, and BCA protein concentration quantitative kit were offered by Beyotime Biotechnology (Shanghai, China). Mouse prostaglandin E2, IL-6, and TNF-α ELISA kits were obtained from Multi Sciences (Lianke) Biotech, Co., Ltd. (Hangzhou, China). Cell Signaling Technology (Danvers, MA, USA) supplied the antibodies involved in this study.
2.2 Plant material
Rhynchanthus beesianus was collected in August 2020 at Aihua Town, Lincang City, Yunnan Province, and was identified by Professor Guoxiong Hu, an expert in plant taxonomy. A voucher specimen (herbarium code: HC20200802) was kept in our laboratory.
2.3 Extraction of WE and EE
The fresh rhizomes were washed, cut into pieces, added in round bottom flasks (500 g), and soaked overnight in 3,000 mL of ultrapure water or 70% ethanol at a ratio of 1:6 (m/V). Then, the rhizomes were heat reflux extracted for 2 h, the filtrate was collected, and the residue was extracted again for 2 h. To remove the solvent, the two filtrates were combined, concentrated at 70 °C under reduced pressure, and freeze-dried by a freeze vacuum dryer. Finally, the freeze-dried powders (WE and EE) were stored hermetically at 4 °C. The yield of WE or EE (%) = weight of WE or EE / weight of fresh rhizome × 100%.
2.4 Total phenol (TPC) and flavonoid (TFC) contents
2.4.1 TPC assay
TPC was determined by the Folin-Ciocalteu method, and gallic acid was used as a standard (Tian et al., 2020). Folin-Ciocalteu reagent (2.5 mL) was mixed thoroughly with R. beesianus extracts (WE and EE) or standard solutions (0.5 mL) by vortexing for 5 min. Then, 7.5% Na2CO3 solution (2 mL) was added and incubated for 1 h, and the absorbance was measured at 760 nm. A standard curve was established by regression analysis of gallic acid concentration and absorbance values. Then, the TPC of the extracts was calculated according to the standard curve and expressed in milligrams of gallic acid equivalent per gram of extract (mg GAE/g extract).
2.4.2 TFC assay
TFC was estimated by the AlCl3 colorimetric method, and rutin was used as a standard (Chouhan and Singh, 2011). The extracts were dissolved into 5 mg/mL methanol solution. Then, extracts or standard solutions (1 mL) and 2% AlCl3 solution (1 mL) were mixed thoroughly and reacted at 25 °C for 10 min, and their absorbance was recorded at 415 nm. A standard curve of rutin concentration and absorbance values was generated by regression analysis. The TFC of extracts was calculated and presented as milligrams of rutin equivalent per gram of extract (mg RE/g extract).
2.5 UPLC-Q-Orbitrap MS analysis
The phytochemical composition of R. beesianus extracts was further analyzed using UHPLC-Q-Orbitrap-MS (ultra-high-performance liquid chromatography coupled to quadrupole-Orbitrap high-resolution mass spectrometry). The UHPLC conditions were as follows: liquid phase system (model: Dionex Ultimate 3000 RSLC), column (Thermo Fisher Hypersil GOLD aQ, 100 mm × 2.1 mm, 1.9 μm), injection volume (5 μL), flow rate (0.3 mL/min), column temperature (40 °C), and mobile phase (A: 0.1% formic acid acetonitrile and B: 0.1% formic acid aqueous solution). The separation of the components in WE and EE was performed by gradient elution under the following elution program: 0 ∼ 2 min, 5% A; 2 ∼ 42 min, 5%∼95% A; 42 ∼ 47 min, 95% A; 47 ∼ 47.1 min, 95%∼5% A; 47.1 ∼ 50 min, 5% A.
The mass spectrometry system was the Thermo Scientific Q Exactive Focus with a thermal spray ion source HESI-II. The spray voltages were 3.0 kV and 2.5 kV in positive and negative ion modes, respectively. The sheath and auxiliary gases were 35 arb and 10 arb, and the capillary temperature was set at 320 °C. The analyses were performed in the primary full scan and data-dependent secondary mass spectrometry scan mode with a full scan range of 100 to 1500 m/z. The settings were as follows: maximum injection time 100 ms (Full MS) and 50 ms (MS2); resolution 70,000 (Full MS) and 17,500 (MS2); maximum capacity of ion number in C-Trap (AGC target) 1e6 (Full MS) and 2e5 (MS2). Mass spectral data of chemical components were processed using Xcalibur 4.1 (Thermo Fisher Scientific, Waltham, MA, USA) and identified by comparing the mzCloud and mzVault databases and the references. The allowed relative mass deviation was set at 10 ppm.
2.6 Determination of antioxidant capacity
DPPH and ABTS radical scavenging assays were used to assess the antioxidant effect of WE and EE (Tian et al., 2022). WE and EE were dissolved in ultrapure water and prepared as a 5 mg/mL solution. As positive controls, ascorbic acid and BHT were dissolved as 1 mg/mL by ultrapure water and anhydrous ethanol, respectively.
2.6.1 DPPH assay
DPPH was dissolved and diluted with anhydrous ethanol to 0.08 mmoL/L. Extracts solution (2 mL) was added to an equal amount of DPPH solution and reacted for 30 min under light-free conditions at room temperature. The absorbance was recorded at 517 nm. Data were presented as IC50 values and in milligrams of ascorbic acid equivalent per gram of extract (mg AE/g extract).
2.6.2 ABTS assay
ABTS was dissolved with anhydrous ethanol at a concentration of 0.7 mmoL/L. K2S2O8 aqueous solution (50 mL, 2.45 mmoL/L) and ABTS solution (50 mL) were mixed and reacted under light-free conditions for 16 h to obtain ABTS•+ solution. Subsequently, 0.4 mL of extracts solution was reacted with 4 mL of ABTS•+ solution for 10 min without light. Optical density was recorded at 734 nm, and the IC50 values and milligrams of ascorbic acid equivalents per gram of extract (mg AE/g extract) were calculated to present ABTS radical scavenging effect.
2.7 Determination of enzyme inhibitory capacity
2.7.1 Tyrosinase inhibition
Tyrosinase solution (100 μL, 100 U/mL) and extracts solution (70 μL) were added to a 96-well plate and reacted for 5 min at 37 °C, then 80 μL L-tyrosine solution (5.5 mM) was injected into each well and maintained for 30 min at 37 °C. The absorbance was recorded at 492 nm, and IC50 values and milligrams of arbutin equivalent per gram of extract (mg ARE/g extract) were calculated to express tyrosinase inhibition.
2.7.2 Cholinesterase inhibition
In a 96-well plate, 50 µL of extracts solution was reacted with 10 µL of acetylcholinesterase (AChE) or butyrylcholinesterase (BChE) solution (pH 8.0, 0.5 U/mL) for 10 min at 4 °C. Acetylthiocholine or butyrylthiocholine solution (20 µL, 2 mM) and 5,5′-dithiobis-(2-nitrobenzoic acid) solution (20 µL, 2 mM) were injected into each well and maintained for 30 min at 37 °C. After detecting the optical density at 405 nm, IC50 values and milligrams of galanthamine equivalent per gram of extract (mg GALAE/g extract) were calculated to present cholinesterase inhibition.
2.8 Anti-inflammatory capacity analysis
2.8.1 Cell culture and analysis of cytotoxicity
L929 cells and RAW264.7 macrophages were cultured at 37 °C in humidified incubators containing 5% CO2 in RPMI 1640 and DMEM medium, respectively. Both media were provided with 10% FBS, 100 μg/mL streptomycin, 100 U/mL penicillin, and 2 mmoL/L glutamine. The MTT method was used to evaluate the cytotoxicity of WE and EE (Zhao et al., 2020). Cells were inoculated into a 96-well plate (2 × 10⁴ cells per well) and maintained at 37 °C for 24 h. After treatment with different doses of WE or EE for 24 h, MTT solution (5 mg/mL, 10 μL) was injected into each well, maintained at 37 °C for 4 h, and gently removed the liquid. Then, DMSO (150 μL) was added to fully dissolve the remaining crystals, and the optical density was measured at 490 nm.
2.8.2 Determination of NO, PGE2, TNF-α, and IL-6 levels
RAW264.7 cell suspension (100 μL, 2 × 10⁵ cells/mL) was distributed into a 96-well plate and cultivated in an incubator at 37 °C for 24 h. Macrophages were pretreated with different doses of extracts or dexamethasone (DXM, 20 μg/mL) for 2 h. Then, LPS (1 μg/mL) was added to induce the inflammation for 24 h. Cell supernatants were collected, in which NO content was measured using the NO detection kit (Beyotime, Shanghai, China). In addition, the contents of PGE2, IL-6, and TNF-α were detected by the respective ELISA kits.
2.8.3 Determination of ROS levels
RAW264.7 cell suspension (1 mL, 6 × 10⁵ cells/mL) was distributed into a 6-well plate and cultivated for 24 h. After pretreatment with a range of concentrations (62.5, 125, 250 μg/mL) of EE for 2 h, LPS (1 μg/mL) was injected to induce the inflammation for 24 h. According to the instructions of the ROS assay kit (Solarbio Science & Technology, Beijing, China), cells were treated with 1 mL of DCFH-DA solution at 37 °C for 20 min, washed with serum-free DMEM, and observed under a Leica DMi8 microscope (Leica Microsystems, Germany). Besides, the cells were collected in a 96-well plate, and their fluorescence values were quantitatively detected by a microplate reader at 488/525 nm (excitation/emission wavelength).
2.8.4 qRT-PCR assay
Cells were incubated in a 6-well plate (6 × 10⁵ cells per well) for 24 h and pretreated with EE (62.5, 125, and 250 µg/mL) for 2 h before induction with LPS (1 μg/mL) for 24 h. Total RNA was extracted by E.Z.N.A.®Total RNA Kit I (Omega Bio-Tek, Norcross, GA, USA), and its concentration was measured using an ultra-micro UV spectrophotometer. RT EasyTM II kit (FOREGENE, Chengdu, China) was used to reverse transcribe RNA into cDNA. According to the instructions of the Real-time PCR EasyTM-SYBR Green I kit (FOREGENE, Chengdu, China), the CFX ConnectTM Real-Time System (Bio-Rad, CA, USA) was utilized to quantitatively detect mRNA expression levels. The primers are shown in Table 1. The results were analyzed by Bio-Rad CFX Maestro 1.0 software, and GAPDH served as a reference gene.
Gene
Forward (5′-3′)
Reverse (5′-3′)
iNOS
TCGGGTTGAAGTGGTATGC
GAGGCCAGTGTGTGGGTCT
COX-2
TGACTGCCCAACTCCCAT
GAACCCAGGTCCTCGCTT
GAPDH
AGCCTCGTCCCGTAGACAAAA
GATGGCAACAATCTCCACTTT
2.8.5 Western blot assay
In a 6-well plate, macrophages (1 mL per well, 6 × 10⁵ cells/mL) were cultured for 24 h, pretreated with EE (62.5, 125, and 250 µg/mL) for 2 h, and induced with LPS (1 μg/mL) for 24 h. Total protein was extracted by radioimmunoprecipitation assay (RIPA) lysis buffer. Nuclear protein and cytoplasmic protein were obtained by a nuclear protein and cytoplasmic protein extraction kit (Beyotime Biotechnology, Shanghai, China) based on the manufacturer's instructions. After quantifying the protein using the BCA kit (Beyotime Biotechnology, Shanghai, China), proteins (20–40 μg) were separated using 10% SDS-PAGE and transferred to PVDF membranes. The blots were blocked with blocking solution (TBST containing 5% nonfat milk solution) for 60 min, immunolabeled with primary antibodies at 1:1000 (v/v) overnight at 4 °C, and incubated with secondary antibody at 1:1000 (v/v) for 60 min. ECL reagent was used to detect the blots, and the obtained images were quantitatively analyzed using Image Lab software (Bio-Rad, CA, USA).
2.8.6 Immunofluorescent staining assay
In a 6-well plate with sterile glass slides, macrophages (1 mL per well, 6 × 10⁵ cells/mL) were inoculated for 24 h, pretreated with EE (250 µg/mL) for 2 h, and induced with LPS (1 μg/mL) for 24 h. The cells on glass slides were treated with fixative solution (4% paraformaldehyde) for 15 min and closure solution (1 × PBS, 0.3% TritonX-100, and 5% goat serum) for 1 h. Subsequently, cells were incubated overnight at 4 °C with NF-κB p65 primary antibody and conjugated with Alexa Fluor 488-labeled secondary antibody for 90 min. DAPI was used to stain nuclei for 5 min. Before each subsequent step, cells on glass slides were washed with PBS for 15 min. Leica TCS SP8 laser confocal microscope (Leica Microsystems, Germany) was utilized to assess the nuclear translocation of NF-κB p65.
2.9 Statistical analysis
Based on three independent experiments, the data were analyzed with SPASS 25 statistical software and presented as the means ± SD (standard deviation). The significant difference between the two groups was examined by one-way analysis of variance (ANOVA) and Fischer’s LSD post hoc test or the two-tailed unpaired t-test at *p < 0.05, **p < 0.01, and ***p < 0.001.
3 Results and discussion
3.1 Phytochemical composition of WE and EE
The yields of WE and EE from fresh R. beesianus rhizome were 1.03% and 1.26%, respectively. The TPC and TFC of R. beesianus rhizome WE and EE were examined, and data are presented in Fig. 1. The TPC of WE and EE were 28.19 ± 0.60 mg GAE/g extract and 25.57 ± 0.07 mg GAE/g extract, respectively. Besides, their TFC were 10.57 ± 1.22 mg RE/g extract and 28.08 ± 1.00 mg RE/g extract, respectively. The TPC in WE was significantly greater than that in EE. But the TFC of EE was higher, nearly three times that of WE.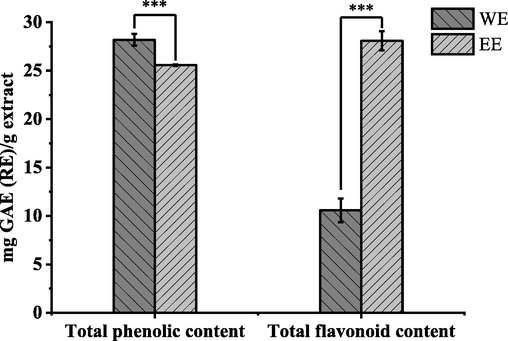
Total phenolic and flavonoid contents of R. beesianus rhizome WE and EE, ***p < 0.001.
The phytochemical constituents of WE and EE were further analyzed using UHPLC-Q-Orbitrap-MS. A total of 61 compounds were identified (Fig. 2 and Table S1, Supplementary Material), of which 44 were identified in WE and 41 in EE. As shown in Fig. 3, twelve identified phenolic compounds were protocatechuic acid (8), isopropyl 4-hydroxybenzoate (12), protocatechualdehyde (13), vanillic acid (16), 2-hydroxy-4-methoxybenzaldehyde (17), (+)-magnoflorine (19), p-coumaric acid (20), ginkgolic acid (C13:0) (24), 5-hydroxy-1-tetralone (30), ethyl 3,4-dihydroxybenzoate (33), bisdemethoxycurcumin (44), and carnosol (57). Besides, six identified flavonoids were isomucronulatol 7-O-glucoside (37), naringenin chalcone (41), kaempferol (42), gardenin B (43), 6-demethoxytangeretin (48), and pectolinarigenin (53). Based on past studies on the phytochemical constituents of R. beesianus (Chen et al., 2021; Zhao et al., 2020; Zhu et al., 2021), except for kaempferol (42), the remaining 60 compounds were first identified from R. beesianus rhizome. The above data indicated that R. beesianus WE and EE were rich in phenolic and flavonoid compounds.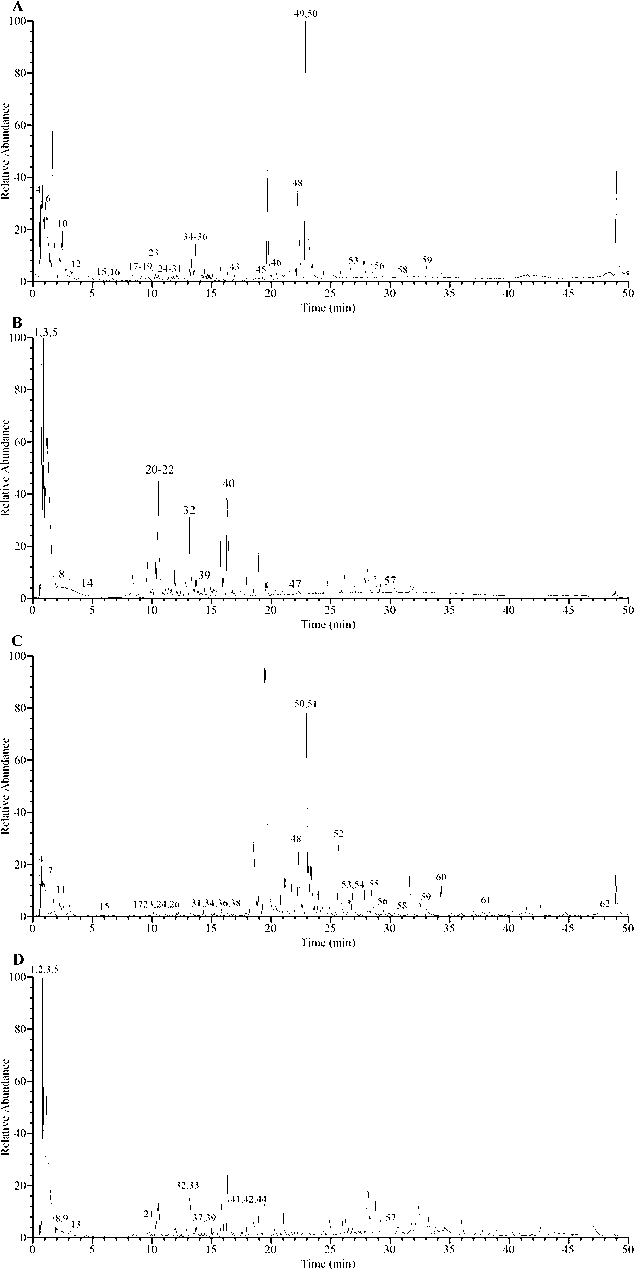
UHPLC-Q-Orbitrap-MS chromatograms of R. beesianus rhizome WE and EE. (A) WE in positive ion mode; (B) WE in negative ion mode; (C) EE in positive ion mode; (D) EE in negative ion mode.
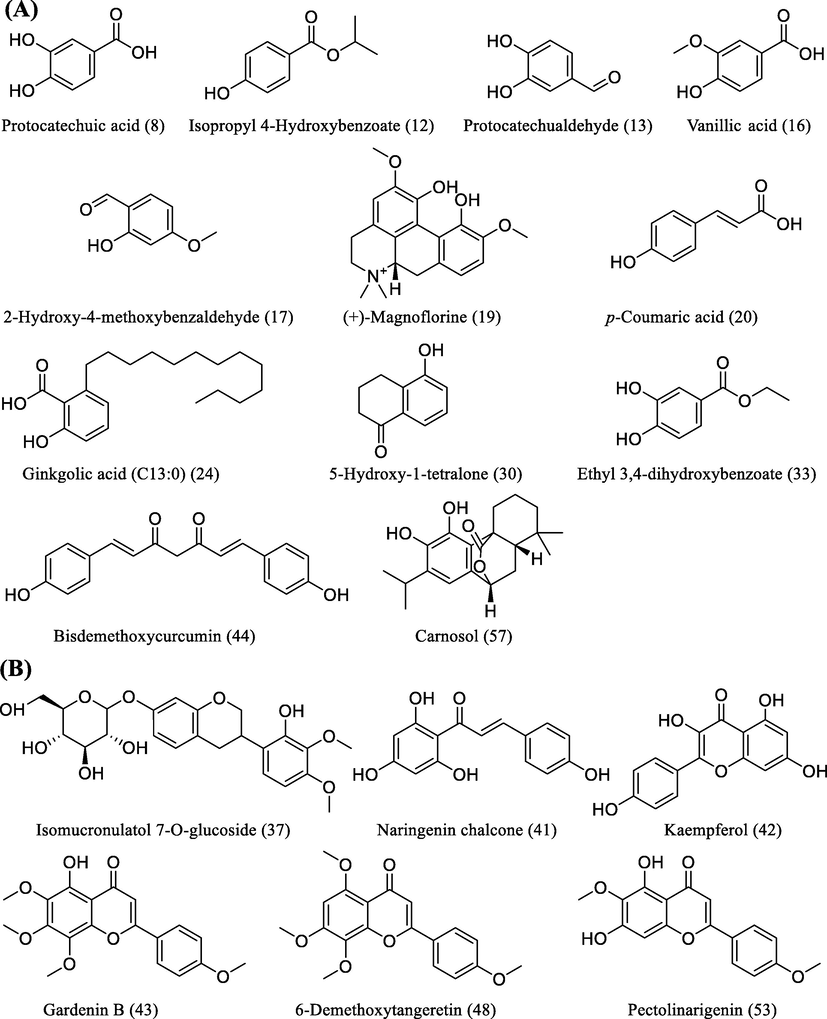
Twelve identified phenolics (A) and six identified flavonoids (B) in WE and EE.
3.2 Antioxidant effect of WE and EE
The antioxidant properties of R. beesianus extracts were estimated by DPPH and ABTS free radical scavenging assays. As shown in Table 2, WE (IC50: 83.93 ± 5.90 and 73.46 ± 0.69 μg/mL, respectively) and EE (IC50: 69.48 ± 1.57 and 40.72 ± 0.67 μg/mL, respectively) revealed significant DPPH and ABTS scavenging ability, especially EE's anti-free radical efficacy was superior or equivalent to that of positive control BHT (IC50: 72.61 ± 2.42 and 48.05 ± 1.52 μg/mL, respectively). The antiradical ability of WE and EE in ABTS assay (45.05 ± 1.14 and 81.28 ± 2.58 mg AE/g extract, respectively) was more potent than that in DPPH assay (29.09 ± 2.46 and 35.00 ± 0.55 mg AE/g extract, respectively). In past studies, plant extracts' DPPH and ABTS scavenging capacities have been well-demonstrated to correlate positively with total phenolic and flavonoid contents (Jaganath and Crozier, 2010; Mustafa et al., 2010). The high TPC and TFC in WE and EE may explain their antioxidant properties. BHT is a synthetic antioxidant and preservative, but its adverse effects are causing increasing concern among consumers (Ghosh et al., 2020). Interestingly, EE revealed superior or equal antioxidant activity to BHT. Hence, R. beesianus rhizome could be a natural source of antioxidants for functional foods and pharmaceuticals. a-d Significant differences were represented by different letters in the same column (p < 0.05).
Treatment
DPPH
ABTS
IC50 (μg/mL) 1
mg AE/g extract 2
IC50 (μg/mL) 1
mg AE/g extract 2
WE
83.93 ± 5.90 a
29.09 ± 2.46 a
73.46 ± 0.69 a
45.05 ± 1.14 a
EE
69.48 ± 1.57b
35.00 ± 0.55b
40.72 ± 0.67b
81.28 ± 2.58b
Ascorbic acid
2.43 ± 0.04c
3.31 ± 0.07c
BHT
72.61 ± 2.42b
48.05 ± 1.52 d
3.3 Enzyme inhibition of WE and EE
Inhibition of tyrosinase, a crucial enzyme for melanin synthesis, has become an important approach for treating hyperpigmentation disorders (Liu et al., 2022). As shown in Table 3, the tyrosinase inhibition of WE (IC50: 5.91 ± 0.63 mg/mL, 46.69 ± 5.71 mg ARE/g extract) was better than that of EE (IC50: 21.30 ± 1.52 mg/mL, 12.89 ± 1.19 mg ARE/g extract). Compared with the arbutin (IC50: 0.27 ± 0.02 mg/mL), the tyrosinase inhibition of WE and EE was poor. Phenolics and flavonoids can serve as excellent sources of tyrosinase inhibitors (Gonçalves and Romano, 2017). Protocatechuic acid reduced tyrosinase activity and melanin level in α-MSH-stimulated B16 cells and reduced melanin production in mice (Chou et al., 2010). Vanillic acid decreased α-MSH-induced intracellular tyrosinase activity and melanin generation in B16F10 cells (Liu et al., 2019). According to previous research, 2-hydroxy-4-methoxybenzaldehyde (Kubo and Hori, 1999), p-coumaric acid (An et al., 2010), and kaempferol (Solimine et al., 2016) displayed stronger tyrosinase inhibitory properties than arbutin or kojic acid. Besides, (+)-magnoflorine (Xu et al., 2020) and ginkgolic acid (C13:0) (Fu et al., 2013) have been proven to display moderate tyrosinase inhibition. Hence, the tyrosinase inhibition of WE and EE could be attributed to these phenolic and flavonoid constituents. IC50: Sample doses afforded a 50% inhibition. The mg ARE/g extract represents milligrams of arbutin equivalent per gram of extract; mg GALAE/g extract means milligrams of galanthamine equivalent per gram of extract. a-c Significant differences were represented by different letters in the same column (p < 0.05).
Samples
Tyrosinase
Acetylcholinesterase
Butyrylcholinesterase
IC50 (mg/mL)
(mg ARE/g extract)
IC50 (mg/mL)
(mg GALAE/g extract)
IC50 (mg/mL)
(mg GALAE/g extract)
WE
5.91 ± 0.63 a
46.69 ± 5.71 a
3.31 ± 0.16 a
0.079 ± 0.004 a
1.29 ± 0.02 a
6.38 ± 0.03 a
EE
21.30 ± 1.52b
12.89 ± 1.19b
3.53 ± 0.14 a
0.074 ± 0.003 a
0.75 ± 0.08b
11.05 ± 1.34b
Arbutin
0.27 ± 0.02c
Galanthamine*
0.26 ± 0.01b
8.23 ± 0.14c
Blocking cholinesterase function can restore cholinergic stability and is a common means of alleviating Alzheimer's disease (Elufioye et al., 2010). WE and EE revealed poor AChE and BChE inhibition compared with the positive control galanthamine. For AChE inhibitory activity, WE (IC50 = 3.31 ± 0.16 mg/mL, 0.079 ± 0.004 GALAE/g extract) and EE (IC50 = 3.53 ± 0.14 mg/mL, 0.074 ± 0.003 mg GALAE/g extract) displayed equivalent inhibitory effects (p > 0.05). However, the BChE inhibition of EE (IC50 = 0.75 ± 0.08 mg/mL, 11.05 ± 1.34 mg GALAE/g extract) was better than that of WE (IC50 = 1.29 ± 0.02 mg/mL, 6.38 ± 0.03 mg GALAE/g extract) (p < 0.05). Various phenolics and flavonoids identified from WE and EE can be used as cholinesterase inhibitors, such as protocatechualdehyde (Aderogba et al., 2013), vanillic acid (Işık and Beydemir, 2021), 2-hydroxy-4-methoxybenzaldehyde (Kundu and Mitra, 2013), (+)-magnoflorine (Durmaz et al., 2022), and carnosol (Ramírez et al., 2018); especially protocatechuic acid (Adefegha et al., 2016), p-coumaric acid (Kim et al., 2017; Nugroho et al., 2017), bisdemethoxycurcumin (Touqeer and Anwar, 2008), and kaempferol (Beg et al., 2018) have been demonstrated to possess cholinesterase inhibitory effects and memory-enhancing properties in vivo. Hence, these phenolic and flavonoid compounds could be responsible for AChE and BChE inhibition of WE and EE.
3.4 Anti-inflammatory ability of WE and EE
3.4.1 Cytotoxicity of WE and EE
MTT assay was conducted on RAW264.7 and L929 cells to determine the cytotoxic activity of WE and EE. As shown in Fig. 4, compared to untreated cells, WE and EE did not display significant cytotoxicity to RAW264.7 and L929 cells at doses ranging from 31.25 to 250 µg/mL (p > 0.05). Hence, WE and EE at the dose range of 62.5–250 µg/mL without cytotoxicity were used in subsequent assays.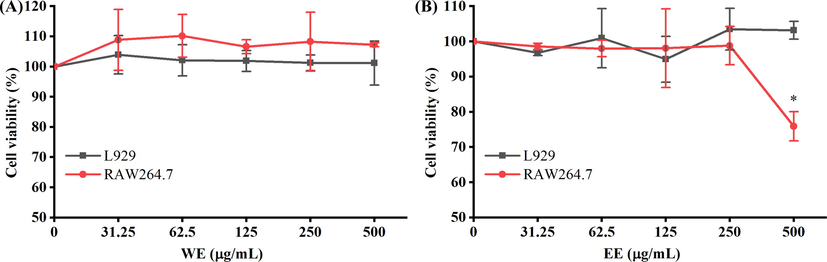
Cytotoxic activity of WE (A) and EE (B) on L929 cells and RAW264.7 macrophages. *p < 0.05 versus the untreated cells.
3.4.2 WE and EE inhibited LPS-stimulated NO, PGE2, IL-6, and TNF-α secretion
The pathogenesis of inflammation is associated closely with the overproduction of inflammatory factors, such as NO, PGE2, IL-6, and TNF-α, and suppressing their overexpression is a vital means to treat inflammatory diseases (Zhao et al., 2021). As shown in Fig. 5, after LPS stimulation of RAW264.7 cells alone, NO, PGE2, IL-6, and TNF-α release were obviously raised in comparison to the control group (p < 0.05). Pretreatment of RAW264.7 with EE (62.5, 125, and 250 μg/mL) resulted in a significant decrease in NO, PGE2, and TNF-α release compared to the LPS group (p < 0.05). Besides, EE at 125 and 250 μg/mL markedly lowered LPS-stimulated IL-6 secretion (p < 0.05). In particular, EE at the dose of 125 and 250 μg/mL was equivalent or superior to DXM (20 μg/mL) in inhibiting inflammatory factors (NO, PGE2, and TNF-α) release. However, RAW264.7 pretreated with WE failed to significantly reduce IL-6 secretion compared to the LPS group. Meanwhile, the inhibitive ability of WE on LPS-stimulated NO and PGE2 release did not appear dose-dependent. According to the above results, EE significantly inhibited the release of pro-inflammatory factors (NO, IL-6, PGE2, and TNF-α) in RAW264.7 cells stimulated by LPS, and its inhibitory effect was superior to that of WE. Thus, we selected EE for further studies on anti-inflammatory activity and related mechanisms.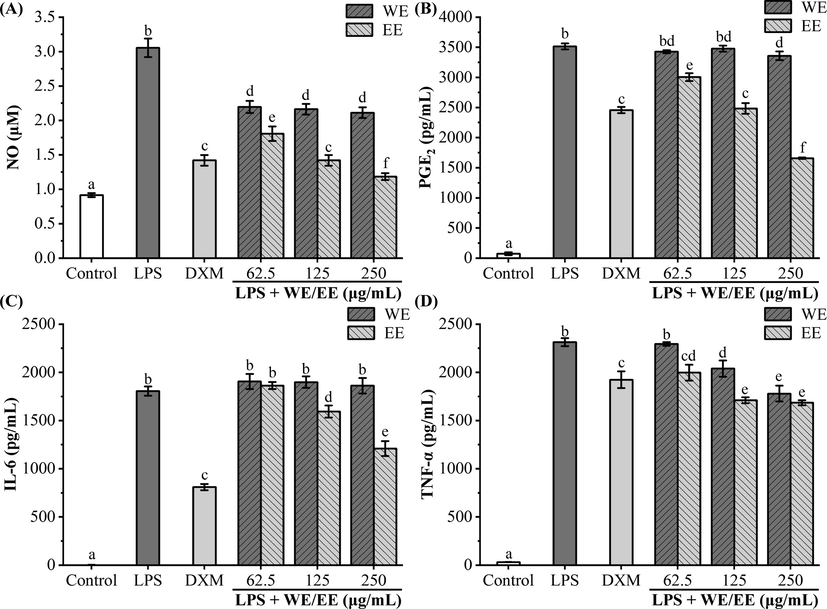
Effects of R. beesianus rhizome WE and EE on LPS-stimulated excessive secretion of pro-inflammatory mediators and cytokines in RAW264.7 cells. (A, B) Griess reaction and ELISA kit tested the release of pro-inflammatory mediators NO (A) and PGE2 (B), respectively. (C, D) ELISA kits detected the accumulation of pro-inflammatory cytokines IL-6 (C) and TNF-α (D) in the cell supernatants. Data were represented as mean ± SD, and significant differences were indicated by different letters above bars (p < 0.05).
3.4.3 EE inhibited LPS-induced ROS generation
ROS, as second messengers, can promote pro-inflammatory factors secretion via activating MAPK and NF-κB pathways (Liu et al., 2012; Park et al., 2015). EE had a remarkable free radical scavenging effect in the above antioxidant assay. To determine whether EE could reduce intracellular ROS levels, the effect of EE on LPS-induced ROS generation was detected using DCFH-DA fluorescent probe. Morphological changes of RAW264.7 cells were observed by a phase-contrast microscope (Fig. 6A). Control group's cells were in a regular spherical shape, but cells in the LPS-stimulated group increased in volume and showed fusiform or irregular pseudopodia. After pretreatment with EE at 62.5, 125, and 250 μg/mL, the cell morphology gradually returned to a spherical shape. The effect of EE on LPS-stimulated ROS generation was detected by a microplate reader using DCFH-DA fluorescent probe. As shown in Fig. 6B and C, the LPS group's ROS generation was significantly increased compared to the control group. EE (62.5, 125, 250 μg/mL) significantly and dose-dependently decreased LPS-induced ROS generation. Therefore, R. beesianus rhizome EE can suppress inflammatory response by inhibiting LPS-induced ROS production.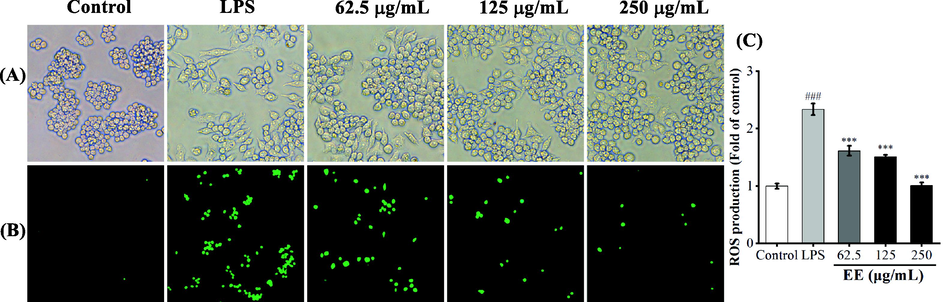
Effects of EE on ROS production in RAW264.7 macrophages induced by LPS. (A) RAW264.7 cells' morphology was observed by a phase-contrast microscope (200 × magnification). (B) Intracellular ROS was detected using DCFH-DA fluorescent probe, which was observed by fluorescence microscopy (100 × magnification). (C) Relative ROS levels in macrophages were quantified by a microplate reader.
3.4.4 EE inhibited LPS-stimulated gene and protein expression of iNOS and COX-2
iNOS and COX-2 are critical rate-limiting enzymes for synthesizing NO and PGE2, which catalyze the conversion of L-arginine to NO and arachidonic acid to PGE2, respectively (Kawahara et al., 2015; Zamora et al., 2000). Hence, the effect of EE on iNOS and COX-2 mRNA and protein overexpression induced by LPS was analyzed using qRT-PCR and western blot. As depicted in Fig. 7A and B, compared to the control group, iNOS and COX-2 mRNA expression levels in the LPS group were significantly upregulated (p < 0.001). EE (62.5, 125, 250 μg/mL) significantly and dose-dependently reduced LPS-stimulated iNOS and COX-2 mRNA expression levels. As depicted in Fig. 7C and D, LPS stimulation observably upregulated the expression levels of iNOS and COX-2 proteins compared with the control group (p < 0.001). After pretreatment with different concentrations of EE, the protein expression levels of iNOS and COX-2 significantly and concentration-dependently decreased (p < 0.001). The above data demonstrated that EE could decrease the release of NO and PGE2 via downregulating the transcriptional and translational levels of iNOS and COX-2.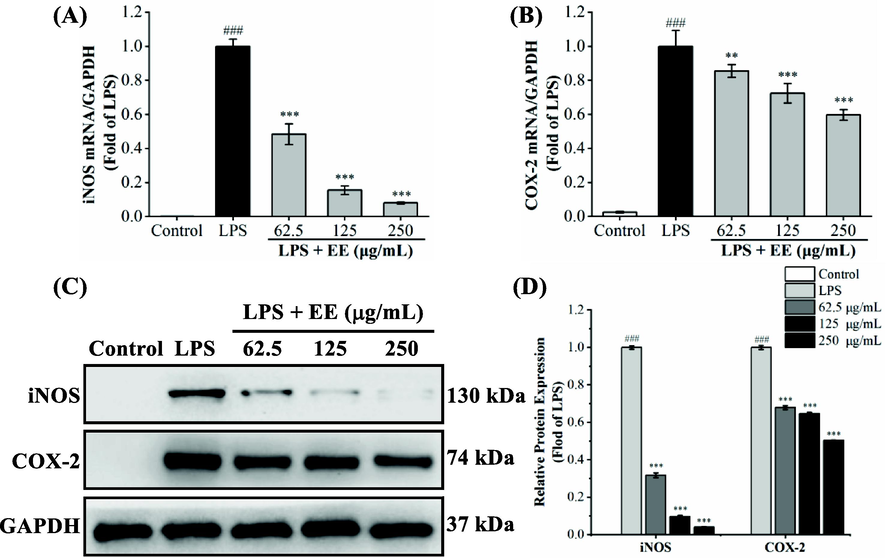
Effects of EE on mRNA and protein overexpression of iNOS and COX-2 in RAW264.7 macrophages stimulated by LPS. The internal reference was GAPDH. (A, B) qRT-PCR analyzed the mRNA relative expression levels of iNOS and COX-2. (C, D) The protein levels of iNOS and COX-2 were determined by western blot. Results expressed the mean ± SD. ###p < 0.001 vs. control group. **p < 0.01, ***p < 0.001 vs. LPS group.
3.4.5 EE inhibited LPS-stimulated phosphorylation of MAPKs
After stimulation of RAW264.7 cells with LPS, MAPKs (JNK, p38, and ERK) were phosphorylated and activated, which regulated the expression of pro-inflammatory factors, including IL-6, TNF-α, iNOS, and COX-2 (Zhang et al., 2020). Therefore, the protein levels of p38, p-p38, ERK, p-ERK, JNK, and p-JNK were assessed using western blot (Fig. 8). The p38, ERK, and JNK phosphorylation levels of the LPS group were dramatically higher than those of the control group (p < 0.001). After treatment with different doses of EE (62.5, 125, and 250 μg/mL), their phosphorylation levels observably and dose-dependently down-regulated. The above results indicated that EE could inhibit LPS-stimulated phosphorylation levels of MAPKs in RAW264.7 cells.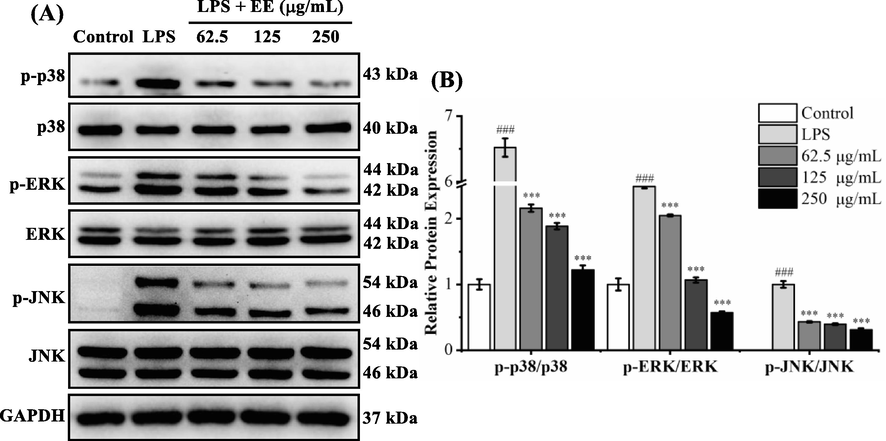
Effects of EE on LPS-stimulated MAPKs phosphorylation. The internal reference was GAPDH. (A) The phosphorylated and total protein levels of p38, ERK, and JNK were measured using a western blot. (B) The ratio of phosphorylated protein to total protein was expressed as the mean ± SD. ###p < 0.001 vs. control group. ***p < 0.001 vs. LPS group.
3.4.6 EE inhibited LPS-stimulated NF-κB activation
NF-κB regulates the gene transcription of various pro-inflammatory factors like IL-6, TNF-α, iNOS, and COX-2 (Pahl, 1999). Normally, NF-κB (comprising p50 and p65 subunits) binds to the inhibitor of κB (IκB) and forms an inactive complex in the cytoplasm. After stimulating RAW264.7 cells with LPS, IκB is phosphorylated and rapidly degraded, thereby releasing NF-κB. Released NF-κB translocates into the nucleus and regulates pro-inflammatory genes transcription (Tian et al., 2023). Hence, we detected the effects of EE on LPS-stimulated phosphorylation and degradation of IκBα and NF-κB nuclear translocation by western blot. As depicted in Fig. 9A–C, the phosphorylation and degradation of IκBα in the LPS group were significantly increased than those in the control group (p < 0.001). After pretreatment with EE at 62.5, 125, and 250 μg/mL, the phosphorylation level of IκBα was markedly decreased (p < 0.001), while the IκBα protein level was significantly increased (p < 0.001). The above data showed that EE could dramatically suppress the phosphorylation and degradation of IκBα in RAW264.7 cells induced by LPS. As depicted in Fig. 9D and E, after LPS induction, the p65 protein level in the cytoplasm was significantly decreased compared with the control group (p < 0.001), while the p65 protein level in the nucleus was dramatically increased (p < 0.001), indicating the nuclear translocation of NF-κB p65. A significant increase in cytosol p65 and a significant decrease in nucleus p65 were observed after pretreatment with EE (62.5, 125, 250 g/mL). The results showed that EE could effectively suppress LPS-stimulated nuclear translocation of NF-κB p65 by blocking IκBα phosphorylation and degradation.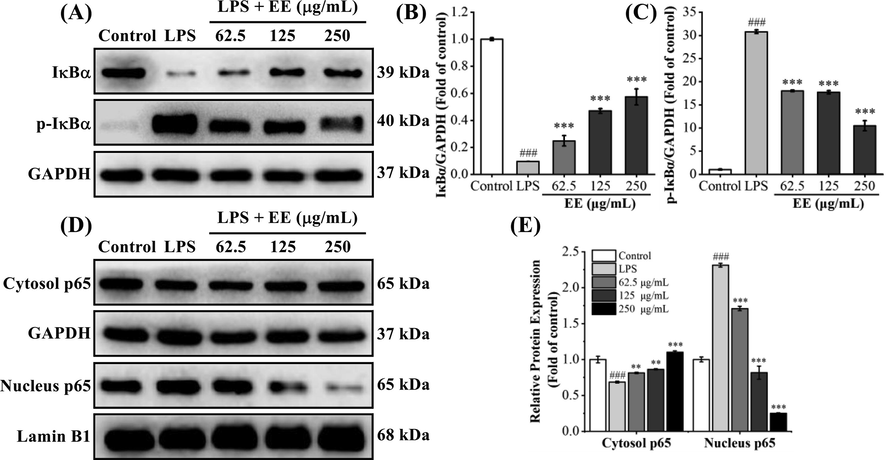
Effects of EE on LPS-stimulated NF-κB activation. (A–C) The protein levels of IκBα and p-IκBα were detected using western blot. (D, E) The protein levels of cytosol p65 and nucleus p65 were measured by western blot. Results expressed mean ± SD. ###p < 0.001 vs. control group. **p < 0.01, ***p < 0.001 vs. LPS group.
To visualize the effects of EE on NF-κB nuclear translocation, NF-κB p65 was detected by immunofluorescent staining and observed under a laser scanning confocal microscope. As shown in Fig. 10, the control group's NF-κB p65 (green fluorescence) was surrounded outside the nucleus (blue fluorescence), and the LPS group's NF-κB p65 was mainly concentrated in the nucleus. However, after pretreatment with EE (250 μg/mL), NF-κB p65 primarily existed in the cytoplasm, suggesting that EE suppressed NF-κB p65 nuclear translocation stimulated by LPS.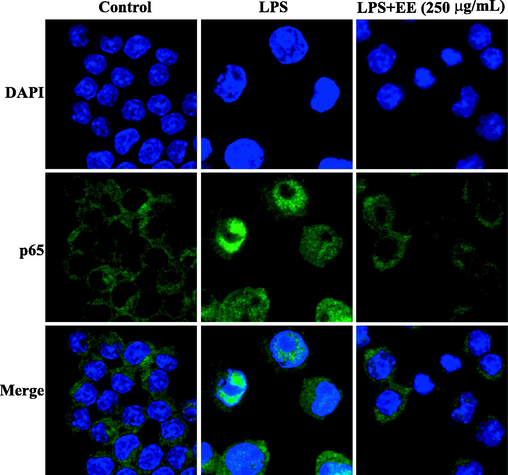
Effects of EE on LPS-stimulated nuclear translocation of NF-κB. Nuclear translocation of NF-κB p65 was assessed under a laser scanning confocal microscope. NF-κB p65 (green) was detected using Alexa Fluor 488-labeled immunostaining, and nuclear (blue) was stained using DAPI.
The anti-inflammatory activity of phenols and flavonoids is closely related to reducing ROS levels and blocking MAPK and NF-κB activation, thereby suppressing pro-inflammatory factors release (Hussain et al., 2016). In this study, EE has high TPC and TFC, and 7 phenolic compounds and 5 flavonoids were identified by UHPLC-Q-Orbitrap-MS, among which multiple phenolic and flavonoid compounds have been found to have anti-inflammatory properties. For example, past studies have shown that protocatechuic acid is a potent antioxidant with higher potency than α-tocopherol and can reduce ROS production and activation of MAPK and NK-κB pathways (Song et al., 2020). Protocatechualdehyde attenuated intracellular ROS levels and suppressed NF-κB and MAPK activation in ultraviolet radiation (UV)-irradiated human dermal fibroblast (HDF) cells (Ding et al., 2020). Kaempferol has been confirmed to reduce oxidative stress and inflammatory responses by downregulating ROS-dependent MAPK and NF-κB pathways (Liu et al., 2021). In addition, other phenolic and flavonoid compounds identified from EE, such as ethyl 3,4-dihydroxybenzoate (Singh et al., 2016), bisdemethoxycurcumin (Kong et al., 2018), carnosol (Johnson, 2011), naringenin chalcone (Hirai et al., 2007), 6-demethoxytangeretin (Kim et al., 2014), and pectolinarigenin (Heimfarth et al., 2021), have been proved to possess anti-inflammatory effects by NF-κB and MAPK pathways. Therefore, these phenolic and flavonoid compounds may be responsible for EE's outstanding anti-inflammatory capacity.
In conclusion, EE showed remarkable DPPH and ABTS scavenging activities and significantly reduced ROS production and activation of MAPK and NF-κB in RAW264.7 cells stimulated by LPS, suggesting that EE might inhibit LPS-induced oversecretion of pro-inflammatory mediators and cytokines via blocking ROS-mediated activation of MAPK and NF-κB pathways. As depicted in Fig. 11, R. beesianus rhizome EE reduced LPS-induced ROS generation and further blocked the activation of MAPKs (via inhibiting ERK, p38, and JNK phosphorylation) and NF-κB (via suppressing the phosphorylation and degradation of IκBα to prevent NF-κB nuclear translocation). Inhibiting MAPKs and NF-κB activation further down-regulated the genes and proteins expression of pro-inflammatory enzymes (iNOS and COX-2), which reduced the release of pro-inflammatory mediators (NO and PGE2) and cytokines (IL-6 and TNF-α). Hence, R. beesianus rhizome EE can be used as a promising natural anti-inflammatory agent with great exploitation potential in functional food and pharmaceuticals.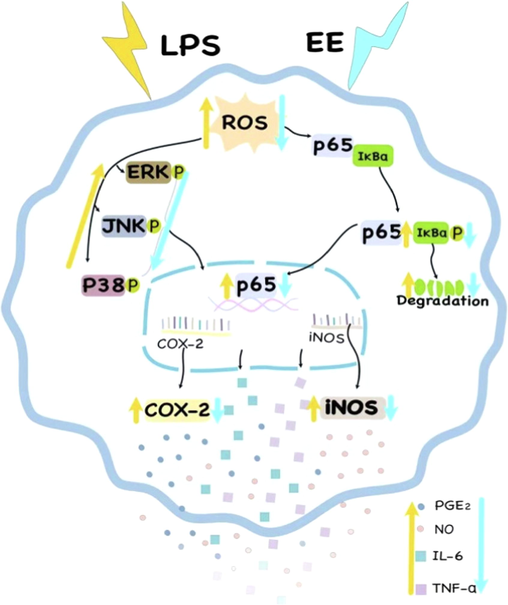
The putative mechanism of R. beesianus rhizome EE inhibited LPS-stimulated over-secretion of pro-inflammatory mediators and cytokines via repressing ROS-mediated activation of MAPK and NF-κB pathways in RAW 264.7 macrophages.
4 Conclusion
To our knowledge, the phytochemical analysis by UHPLC-Q-Orbitrap-MS, antioxidant, anti-enzymatic, and anti-inflammatory properties of Rhynchanthus beesianus rhizome WE and EE were studied for the first time. WE and EE were high total phenolic and flavonoid contents and showed significant antioxidant properties, but had poor inhibitory activities against tyrosinase, AChE, and BChE. Interestingly, EE exhibited remarkable anti-inflammatory effect and inhibited LPS-induced oversecretion of pro-inflammatory mediators (NO and PGE2) and cytokines (IL-6 and TNF-α) by repressing ROS-mediated activation of MAPK and NF-κB pathways in RAW264.7 macrophages. Furthermore, the UHPLC-Q-Orbitrap-MS test identified twelve phenolic compounds and six flavonoids, which might be responsible for the bioactivities of R. beesianus rhizome. Therefore, R. beesianus can serve as a promising natural antioxidant and anti-inflammatory agent. The above findings should facilitate the utilization of R. beesianus in the functional food and pharmaceutical industries.
CRediT authorship contribution statement
Xiaoyan Jia: Investigation, Methodology, Resources, Validation. Yao Yang: Investigation, Methodology. Qinqin Wang: Validation. Yufeng Tian: Investigation. Yi Hong: Resources, Validation. Minyi Tian: Methodology, Validation, Supervision, Writing – original draft, Writing – review & editing, Funding acquisition. Dongxin Tang: Conceptualization, Writing – review & editing, Funding acquisition.
Acknowledgment
The authors are grateful for the financial support grant from the Introduced Talent Research Project of Guizhou University, China (Gui Da Ren Ji He Zi (2021) 85) and Science and Technology Program of Guizhou province, China [Qian Ke He Zhi Cheng (2020) 1Y133, Qian Ke He Ji Chu-ZK (2021) Yiban 150].
Declaration of Competing Interest
The authors declare that they have no known competing financial interests or personal relationships that could have appeared to influence the work reported in this paper.
References
- Alterations of Na+/K+-ATPase, cholinergic and antioxidant enzymes activity by protocatechuic acid in cadmium-induced neurotoxicity and oxidative stress in Wistar rats. Biomed. Pharmacother.. 2016;83:559-568.
- [Google Scholar]
- Acetylcholinesterase inhibitory activity and mutagenic effects of Croton penduliflorus leaf extract constituents. S. Afr. J. Bot.. 2013;87:48-51.
- [Google Scholar]
- p-coumaric acid not only inhibits human tyrosinase activity in vitro but also melanogenesis in cells exposed to UVB. Phytother. Res.. 2010;24:1175-1180.
- [Google Scholar]
- Multidirectional insights on Chrysophyllum perpulchrum leaves and stem bark extracts: HPLC-ESI-MSn profiles, antioxidant, enzyme inhibitory, antimicrobial and cytotoxic properties. Ind. Crop. Prod.. 2019;134:33-42.
- [Google Scholar]
- Protective Effect of Kaempferol on the Transgenic Drosophila Model of Alzheimer's Disease. CNS Neurol. Disord. Drug Targets. 2018;17:421-429.
- [Google Scholar]
- Role of reactive oxygen species in the progression of Alzheimer's disease. Drug Discov. Today. 2021;26(3):794-803.
- [Google Scholar]
- Can Plant Phenolic Compounds Protect the Skin from Airborne Particulate Matter? Antioxidants. 2019;8:379.
- [Google Scholar]
- Chemical composition, antibacterial, and anti-inflammatory activities of essential oils from flower, leaf, and stem of Rhynchanthus beesianus. BioMed. Res. Int.. 2021;2021:5562461.
- [Google Scholar]
- Zhong Hua Ben Cao [Chinese Materia Medica] Shanghai Science and Technology Press, Shanghai, China. 1999;8:648.
- [Google Scholar]
- The Chinese Traditional Medicine Resource Records. China: Science Press, Beijing; 1994. p. :1513.
- Inhibition of melanogenesis and oxidation by protocatechuic acid from Origanum vulgare (oregano) J. Nat. Prod.. 2010;73:1767-1774.
- [Google Scholar]
- Phytochemical analysis, antioxidant and anti-inflammatory activities of Phyllanthus simplex. J. Ethnopharmacol.. 2011;137:1337-1344.
- [Google Scholar]
- Evaluation of enzyme inhibitors in drug discovery: a guide for medicinal chemists and pharmacologists. Hoboken, New Jersey: John Wiley & Sons Inc; 2013. p. :1-20.
- Protocatechuic Aldehyde Attenuates UVA-Induced Photoaging in Human Dermal Fibroblast Cells by Suppressing MAPKs/AP-1 and NF-κB Signaling Pathways. Int. J. Mol. Sci.. 2020;21:4619.
- [Google Scholar]
- Antioxidant, Antidiabetic, Anticholinergic, and Antiglaucoma Effects of Magnofluorine. Molecules. 2022;27:5902.
- [Google Scholar]
- Acetylcholinesterase and butyrylcholinesterase inhibitory activity of some selected Nigerian medicinal plants. Rev. Bras. Farmacogn.. 2010;20(4):472-477.
- [Google Scholar]
- Natural products inhibitors of the enzyme acetylcholinesterase. Rev. Bras. Farmacogn.. 2006;16(2):258-285.
- [Google Scholar]
- Novel chemical synthesis of Ginkgolic Acid (13:0) and evaluation of its tyrosinase inhibitory activity. J. Agric. Food Chem.. 2013;61:5347-5352.
- [Google Scholar]
- Reproductive ecology of Rhynchanthus beesianus WW Smith (Zingiberaceae) in South Yunnan, China: A ginger with bird pollination syndrome. J. Integr. Plant Biol.. 2006;48(11):1294-1299.
- [Google Scholar]
- Development and validation of a headspace needle-trap method for rapid quantitative estimation of butylated hydroxytoluene from cosmetics by hand-portable GC-MS. RSC Adv.. 2020;10:6671-6677.
- [Google Scholar]
- Inhibitory properties of phenolic compounds against enzymes linked with human diseases. In: Soto-Hernández M., Tenango M.P., García-Mateos R., eds. Phenolic Compounds-Biological Activity. Rijeka, Croatia: InTech; 2017. p. :99-118.
- [Google Scholar]
- Berry phenolic and volatile extracts inhibit pro-inflammatory cytokine secretion in LPS-stimulated RAW264.7 cells through suppression of NF-κB signaling pathway. Antioxidants. 2020;9:871.
- [Google Scholar]
- Yu Long Ben Cao [Yulong Materia Medica]. China: Yunnan Science and Technology Press, Kunming; 2016. p. :242.
- Neuroprotective and anti-inflammatory effect of pectolinarigenin, a flavonoid from Amazonian Aegiphila integrifolia (Jacq.), against lipopolysaccharide-induced inflammation in astrocytes via NFκB and MAPK pathways. Food Chem. Toxicol.. 2021;157:112538
- [Google Scholar]
- Inhibitory effect of naringenin chalcone on inflammatory changes in the interaction between adipocytes and macrophages. Life Sci.. 2007;81:1272-1279.
- [Google Scholar]
- A new natural antioxidant biomaterial from Cinnamomum osmophloeum Kanehira leaves represses melanogenesis and protects against DNA damage. Antioxidants. 2019;8:474.
- [Google Scholar]
- Oxidative Stress and Inflammation: What Polyphenols Can Do for Us? Oxid. Med. Cell Longev.. 2016;2016:7432797.
- [Google Scholar]
- The impact of some phenolic compounds on serum acetylcholinesterase: kinetic analysis of an enzyme/inhibitor interaction and molecular docking study. J. Biomol. Struct. Dyn.. 2021;39:6515-6523.
- [Google Scholar]
- Dietary Flavonoids and Phenolic Compounds. In: Fraga C.G., ed. Plant Phenolics and Human Health: Biochemistry, Nutrition, and Pharmacology. Hoboken, New Jersey: John Wiley & Sons Inc; 2010. p. :1-49.
- [Google Scholar]
- Carnosol: a promising anti-cancer and anti-inflammatory agent. Cancer Lett.. 2011;305:1-7.
- [Google Scholar]
- Prostaglandin E2-induced inflammation: relevance of prostaglandin E receptors. Biochim. Biophys. Acta. 2015;1851:414-421.
- [Google Scholar]
- A citrus flavonoid, 6-demethoxytangeretin, suppresses production and gene expression of interleukin-6 in human mast cell-1 via anaplastic lymphoma kinase and mitogen-activated protein kinase pathways. Biol. Pharm. Bull.. 2014;37(5):871-876.
- [Google Scholar]
- p-Coumaric acid enhances long-term potentiation and recovers scopolamine-induced learning and memory impairments. Biochem. Biophys. Res. Commun.. 2017;492:493-499.
- [Google Scholar]
- MAPKs and NF–κB pathway inhibitory effect of bisdemethoxycurcumin on phorbol–12–myristate–13–acetate and A23187–induced inflammation in human mast cells. Mol. Med. Rep.. 2018;17:630-635.
- [Google Scholar]
- 2-Hydroxy-4-methoxybenzaldehyde: a potent tyrosinase inhibitor from African medicinal plants. Planta Med.. 1999;65:019-022.
- [Google Scholar]
- Flavoring extracts of Hemidesmus indicus roots and Vanilla planifolia pods exhibit in vitro acetylcholinesterase inhibitory activities. Plant Foods Human Nutr.. 2013;68:247-253.
- [Google Scholar]
- Attenuation of in vitro and in vivo melanin synthesis using a Chinese herbal medicine through the inhibition of tyrosinase activity. Phytomedicine. 2022;95:153876
- [Google Scholar]
- Protective role of quercetin against lead-induced inflammatory response in rat kidney through the ROS-mediated MAPKs and NF-κB pathway. Biochim. Biophys. Acta. 2012;1820:1693-1703.
- [Google Scholar]
- Vanillic acid in Panax ginseng root extract inhibits melanogenesis in B16F10 cells via inhibition of the NO/PKG signaling pathway. Biosci. Biotechnol. Biochem.. 2019;83(7):1205-1215.
- [Google Scholar]
- Pretreatment with kaempferol attenuates microglia-mediate neuroinflammation by inhibiting MAPKs-NF-κB signaling pathway and pyroptosis after secondary spinal cord injury. Free Radic. Biol. Med.. 2021;168:142-154.
- [Google Scholar]
- Total phenolic compounds, flavonoids, and radical scavenging activity of 21 selected tropical plants. J. Food Sci.. 2010;75:C28-C35.
- [Google Scholar]
- Anti-acetylcholinesterase activity of the aglycones of phenolic glycosides isolated from Leonurus japonicus. Asian Pac. J. Trop. Biomed.. 2017;7(10):849-854.
- [Google Scholar]
- Activators and target genes of Rel/NF-κB transcription factors. Oncogene. 1999;18:6853-6866.
- [Google Scholar]
- Mitochondrial ROS govern the LPS-induced pro-inflammatory response in microglia cells by regulating MAPK and NF-κB pathways. Neurosci. Lett.. 2015;584:191-196.
- [Google Scholar]
- Carnosol from Lepechinia mutica and tiliroside from Vallea stipularis: two promising inhibitors of BuChE. Rev. Bras. Farm.. 2018;28:559-563.
- [Google Scholar]
- Reactive oxygen species (ROS) in macrophage activation and function in diabetes. Immunobiology. 2019;224:242-253.
- [Google Scholar]
- Post-inflammatory hyperpigmentation. In: Kumarasinghe P., ed. Pigmentary Skin Disorders. Cham, Switzerland: Springer; 2018. p. :197-208.
- [Google Scholar]
- Ethyl 3,4-dihydroxybenzoate (EDHB): a prolyl hydroxylase inhibitor attenuates acute hypobaric hypoxia mediated vascular leakage in brain. J. Physiol. Sci.. 2016;66:315-326.
- [Google Scholar]
- Tyrosinase inhibitory constituents from a polyphenol enriched fraction of rose oil distillation wastewater. Fitoterapia. 2016;108:13-19.
- [Google Scholar]
- New progress in the pharmacology of protocatechuic acid: A compound ingested in daily foods and herbs frequently and heavily. Pharmacol. Res.. 2020;161:105109
- [Google Scholar]
- The Plant List. Version 1.1. Available online: http://www.theplantlist.org/tpl1.1/search?q=Rhynchanthus (accessed on 11 November 2022).
- Antioxidant, Antibacterial, Enzyme Inhibitory, and Anticancer Activities and Chemical Composition of Alpinia galanga Flower Essential Oil. Pharmaceuticals. 2022;15:1069.
- [Google Scholar]
- Phytochemical analysis, antioxidant, antibacterial, cytotoxic, and enzyme inhibitory activities of Hedychium flavum rhizome. Front. Pharmacol.. 2020;11:572659
- [Google Scholar]
- Hedychium flavum flower essential oil: Chemical composition, anti-inflammatory activities and related mechanisms in vitro and in vivo. J. Ethnopharmacol.. 2023;301:115846
- [Google Scholar]
- Curcuminoids possess acetylcholinesterase inhibitory and memory enhancing activities. Planta Med.. 2008;74:PA115.
- [Google Scholar]
- A review on medicinal plants used as anti-inflammatory agents. J. Pharmacogn. Phytochem.. 2019;8(3):1641-1646.
- [Google Scholar]
- Wu Z.Y., Raven P.H., eds. Rhynchanthus. J. D. HookerFlora of China. St. Louis: Science Press, Beijing & Missouri Botanical Garden Press; 2000. p. :346-347.
- Magnoflorine: a review of its pharmacology, pharmacokinetics and toxicity. Pharmacol. Res.. 2020;152:104632
- [Google Scholar]
- Inducible nitric oxide synthase and inflammatory diseases. Mol. Med.. 2000;6(5):347-373.
- [Google Scholar]
- Anti-inflammatory and antioxidant effects of Chaetoglobosin Vb in LPS-induced RAW264.7 cells: Achieved via the MAPK and NF-κB signaling pathways. Food Chem. Toxicol.. 2021;147:111915
- [Google Scholar]
- TREM-2-p38 MAPK signaling regulates neuroinflammation during chronic cerebral hypoperfusion combined with diabetes mellitus. J. Neuroinflammation. 2020;17:2.
- [Google Scholar]
- Chemical composition, antibacterial, anti-inflammatory, and enzyme inhibitory activities of essential oil from Rhynchanthus beesianus rhizome. Molecules. 2020;26:167.
- [Google Scholar]
- Inflammation and tumor progression: signaling pathways and targeted intervention. Signal Transduct. Target. Ther.. 2021;6:263.
- [Google Scholar]
- Antioxidant and Cytoprotective Effects of New Diarylheptanoids from Rhynchanthus beesianus. J. Agric. Food Chem.. 2021;69:6229-6239.
- [Google Scholar]
Appendix A
Supplementary data
Supplementary data to this article can be found online at https://doi.org/10.1016/j.arabjc.2023.104952.
Appendix A
Supplementary data
The following are the Supplementary data to this article:Supplementary data 1
Supplementary data 1


