

Translate this page into:
Phytochemical from Zingiberaceae as a sustainable optical probe for heavy metal determination
⁎Corresponding author. kriangsaks@g.swu.ac.th (Kriangsak Songsrirote)
-
Received: ,
Accepted: ,
This article was originally published by Elsevier and was migrated to Scientific Scholar after the change of Publisher.
Peer review under responsibility of King Saud University.
Abstract
Pinostrobin (PS) extracted from fingerroot was successfully applied as a dual signalling optical sensor that selectively detected Fe3+ and Al3+ via colorimetric and fluorometric methods, respectively. The selectivity of detection was pH-dependent and was optimal at pH 7. Chelation between PS and Fe3+ resulted in the formation of a brown complex with a maximum absorbance of 335.0 nm, while the formation of a colorless complex with Al3+ caused an enhancement of fluorescent intensity of PS at the wavelength of 500.0 nm. The linearity range for Fe3+ were 1–150 ppm and 0.05–100 ppm for Al3+. The limits of detection were 0.27 ppm for Fe3+ and 0.02 ppm for Al3+. Binding stoichiometry for both metal ions to ligand was the same at 1:2 as Fe3+-(PS)2 and Al3+- (PS)2. The brown color of Fe3+- (PS)2 complex can be explained using the crystal field and charge transfer theory. For the Al3+- (PS)2 complex, the fluorescent intensity was considerably enhanced compared to that of free PS because the proton transfer process was inhibited by the complex formation. Theoretical calculation was performed to confirm the complex formation between PS and the metal ions. Based on the proposed complex structure, the binding energies of Fe3+ and Al3+ complexes were calculated, and the values were found to be −11.45 eV and −19.37 eV, respectively, indicating high stability of the structure and geometry of the metal complexes.
Keywords
Phytochemical
Optical sensor
Heavy metal
Fluorescent quenching
Pinostrobin

1 Introduction
Contamination of heavy metals in environmental resources has been a global concern for public health because they are highly toxic even at trace levels (Ihedioha et al., 2017; Jaishankar et al., 2014). In addition, heavy metals are non-biodegradable, consequently accumulating in the environment including in water, soil, and living organism (Ali et al., 2019; Wang et al., 2016). Heavy metals are present naturally in the environment and are also discarded through anthropogenic activities (Edelstein et al., 2018; Ihedioha et al., 2017). They generally exist in a form of ion species capable of interacting with other substances and are easily transferred among environmental spheres (Ali et al., 2018; Odika et al., 2020).
Several conventional techniques are used to monitor and determine the level of heavy metal contamination such as inductively coupled plasma optical emission spectrometry (Massadeh et al., 2020), atomic fluorescence spectrometry (Liang et al., 2004), and atomic absorption spectrometry (Assubaie 2015; Tüzen 2003). These analytical techniques offer high accuracy, selectivity, and sensitivity. However, they are hindered by high analysis cost, user skills, and a large sample volume. Therefore, simple and economical approaches for heavy metal determination have been developed including optical sensors, chromogenic and fluorogenic probes using nanoparticles (NPs) (He et al., 2020; Siangproh et al., 2016), quantum dots (QDs) (Liu et al., 2019; Thepmanee et al., 2020), and chemosensors (Zhang et al., 2017). Ironically, these optical sensors produce more heavy metals to the environment and consume a large amount of chemicals in the process of fabrication. Developing an environmentally friendly sensor that is also safe, simple and does not require extensive laboratory skills and a large sample volume has therefore been challenging.
Metal ions show high potential to form complexes with oxygen, nitrogen, and sulfur containing biological molecules (Adusei-Gyamfi et al., 2019; Petukh et al., 2014). Various herbs have potential to be used in the elimination of heavy metals and detoxification such as turmeric, cumin, onions, garlic, and tea (Qayoom et al., 2017; Winiarska-Mieczan 2018). The interaction between metal ions and natural compounds has been extensively scrutinized (Jing et al., 2017; Shi et al., 2015), and studies have found that phytochemicals such as oligosaccharides, phytochelatins, and polyphenol show promising chelating ability with metal ions (Shi et al., 2015; Kasprzak et al., 2015). In addition, various chemicals from plants have distinguished optical properties in the presence of hydrogen or metal ions (Li et al., 2014; Sigurdson et al., 2016). Consequently, natural products from plants are great candidates for metal ion detection as they are also abundant, sustainable, and safe.
Flavonoids are a group of polyphenolic compounds with a wide variety in chemical structures, characteristics, and biological and chemical activities (Dias et al., 2021). They are the largest group of plant chemicals and over 4,000 different flavonoids have been identified (Kumar et al., 2013). Owing to the carbonyl and hydroxyl groups in the structures, flavonoids generally are able to form complexes with metal ions via coordinate covalent bond (Jomová et al., 2019; Kasprzak et al., 2015). Although a large number of complex formation between flavonoids and metal ions has been investigated, most of these studies focused on biological activities of the complexes on medical applications such as antioxidant, anticancer activities, and neurodegenerative diseases (Kejík et al., 2021; Khater et al., 2019; Rodríguez-Arce et al., 2021). Only a few of these compounds were reported as optical probes for metal ion, such as anthrocyanins, naturally occurring pigments that produce red–purple-blue hues in nature (Sigurdson et al., 2016; Sigurdson et al., 2017). Pinostrobin (PS) is one of major bioflavonoids found in various plants including Zingiberaceae or the ginger family, widely distributed throughout tropical areas (Kanchanapiboon et al., 2020; Rosdianto et al., 2020). As PS can be abundantly extracted, this work aimed to use PS as an optical sensor for heavy metal determination in real water samples. Although the free-form PS is non-florescent and colorless, the PS-metal complexes showed interesting optical behaviors, which could be potentially developed as a sensitive and selective optical sensor for heavy metal detection. Moreover, the mechanism of the complex formation between PS extracted from Boesenbergia rotunda (L.) Mansf. (fingerroot) and metal ions was elucidated.
2 Materials and methods
2.1 Chemicals and materials
Metal ion salts were purchased from Sigma-Aldrich. Organic solvents, hydrochloric acid and sodium hydroxide were purchased from commercial suppliers and used without further purification. Boesenbergia rotunda (L.) Mansf. (fingerroot) was obtained from Tai-an-jan herbal store, Bangkok in 2021.
2.2 Pinostrobin extraction from fingerroot
Dried rhizomes of fingerroot (3.2 kg) were mashed and extracted exhaustively 5 times with 4 L of n-hexane at room temperature. The hexane extract was evaporated to dryness using a rotary evaporator to yield a crude extract. The crude hexane extract was fractionated by quick column chromatography eluting with a gradient of hexane-dichlorometane (50:50 to 0:100). The eluent was collected at every 600 mL producing 5 main fractions. The second fraction was added with cold ethanol to obtain a crude solid. Recrystallization of the crude solid with hexane-ethanol was performed to obtain pure PS.
2.3 Characterization of extracted pinostrobin
Absorption spectra of PS dissolved in 50 % ethanol were acquired using a spectrophotometer (Agilent 8453 UV–visible spectrophotometer with micro-volume cuvette) and the excitation and fluorescence emission spectra were measured using a fluorometer (Shimadzu RF-5301PC spectrofluoro photometer). Chemical compositions of PS were analyzed using fourier transform infrared (FTIR) spectroscopy in an attenuated reflection mode. FTIR spectra were obtained in the range of wavenumbers from 400 cm−1 to 4000 cm−1 and 64 scans with a 2 cm−1 resolution (Spectrum GX FTIR System, Perkin-Elmer, USA). Proton and carbon nuclear magnetic resonance (1H- and 13C NMR, Bruker Ascend 500), and mass spectrometry (Bruker micrOTOF-II) were also performed to confirm the structure and purity of PS.
2.4 Selectivity of and optimal conditions for metal ion binding
Selectivity of PS on metal ions was determined by monitoring the change in UV–Vis and fluorescent spectra of PS solution with and without the addition of various metal ions at the ratio of 1:1 by volume. The metal ions that caused the change in optical properties were further studied to achieve optimum conditions including pH, concentration of PS, and reaction time for metal ion detection. The pH ranging from 3 to 9 of PS and metal ion solutions were adjusted using 1.0 mM of HCl and 1.0 mM of NaOH.
2.5 Method validation
Figures of merit of the developed method were evaluated. The linear range, limit of detection (LOD), limit of quantification (LOQ), precision, and accuracy of the method were determined. Method validation was performed by measuring the recovery of the standard metal ions spiked in filtered water samples. All analyses were performed in triplicate and compared to those obtained by the conventional inductively coupled plasma (ICP) spectrometry (Perkin Elmer Avio 200). Significant differences between the two groups were identified using a paired sample t-test.
2.6 Study of complex formation between pinostrobin and metal ions
Solutions of PS and standard metal ions of the same concentration at pH 7 were mixed at different ratios. Then, the fluorescence intensities of the mixtures were measured at 538.0 nm by fluorophotometer under an excitation at 350 nm for Al3+ and Zn2+ ions. For Fe3+ and Cu2+ ions, absorbance values were recorded at 335.0 nm and 382.0 nm, respectively. Job’s plots were constructed using fluorescent and absorbance signals to determine the stoichiometry between metal ions and PS. To elucidate the binding mechanism, the solutions of the complex were dried under vacuum using a lyophilizer and the dried samples were subject to X-ray photoelectron spectrometer (Kratos Axis Ultra X-ray Photoelectron Spectroscopy (XPS) system).
2.7 Theoretical calculations
The ground-state geometries of the proposed structures between PS to each metal complexes were fully optimized using the density functional theory (DFT) calculation based on the long-range corrected exchange–correlation function at B3LYP (Kohn et al., 1965) with mixed basis sets. In these mixed basis sets, the effective core potential (ECP) LANL2DZ was set for Al3+ and Fe3+ ions (Pritchard et al., 2019), and the 6–311++G(d,p) was set for the remaining atoms (H, C, O), namely, LANL2DZ/6–311++G(d,p) basis set. The simulated absorption spectra based on their ground state (S0) geometries were calculated using time-dependent B3LYP or TD-B3LYP at the same basis as for the experimental spectrum. Then, to calculate the emission spectra, the geometry optimization was performed for the first excited-state (S1) using the TD-B3LYP at the same basis set. The solvent effects were evaluated using a non-equilibrium implementation of the conductor-like polarizable continuum model (C-PCM) from the self-consistent reaction field (SCRF) procedure in water solution (Cossi et al., 2003). All aforementioned computations were performed using the Gaussian 09 program package (Frisch et al., 2009).
3 Results and discussion
3.1 Pinostrobin extraction and characterization
PS is a major compound found in rhizomes of fingerroots. The extracts eluted from different liquid chromatographic fractions were investigated and comparatively estimated the amount of PS using thin-layer liquid chromatography (TLC) with standard PS. It was found that the second fraction contained the highest concentration of PS, and was further purified by recrystallization. The white powder of the purified PS was obtained with a yield of 0.52 %. Analytical techniques including NMR, FTIR, and MS were performed to confirm the structure of the compound.
Both 1H NMR (500 MHz, DMSO‑d6) and 13C NMR (125 MHz, DMSO‑d6) were performed to characterize the structure of the purified compound. The 1H NMR spectrum revealed the presence of a hydroxyl proton signal at δ 12.10 (1H, s) and aromatic proton signals at δ 7.53 (2H, brd, J = 7.2 Hz, H-2′, H-6′), δ 7.44 (2H, brt, J = 7.4 Hz, H-3′, H-5′) and δ 7.40 (1H, brt, J = 7.2 Hz, H-4′) ppm assignable to monosubstituted benzene. The aromatic proton signals at δ 6.16 (1H, brd, J = 2.0 Hz, H-8) and δ 6.11 (1H, brd, J = 2.1 Hz, H-6) ppm were assignable to aromatic protons of ring A (Fig. 1). The oxymethine proton resonated at δ 5.64 (1H, brd, J = 12.7 Hz, H-2) ppm, and methylene proton signal appeared at δ 3.29–3.35 (1H, dd, J = 17.1, 4.4 Hz, H-3b) and δ 2.85–2.81 (1H, dd, J = 17.1, 3.0 Hz, H-3a) ppm (Fig.S1(a-b), ESI). Additionally, 1H NMR spectrum showed one methoxyl group at δ 3.80 (3H, s). These signals corresponded to the structure of PS shown in Fig. 1. Signals of chemical shift from 13C NMR are as follows: δ 42.1 (C-3), 55.9 (OCH3), 78.5 (C-2), 93.8 (C-8), 94.7 (C-6), 102.6 (C-4a), 126.6 (C-2′, C-6′), 128.5 (C-3′, C-5′), 128.6 (C-4′), 138.5 (C-1′), 162.6 (C-8a), 163.2 (C-5), 167.4 (C-7), 196.5 (C-4).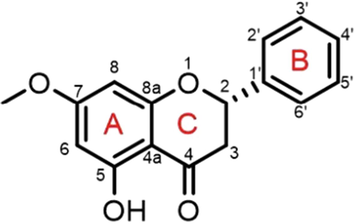
Structure of pinostrobin.
The IR spectrum displayed absorption bands of carbonyl (C = O), C = C aromatic, and ether (C-O-C) at 1642, 1619 (Mohammed et al., 2018) and 1157 cm−1, respectively. The high resolution electrospray mass spectrum showed [M + Na]+ at m/z 293.0791, corresponding to the molecular formula of pinostrobin, C16H14NaO4 (Fig.S1(c-d), ESI).
Optical properties in relation to absorption and fluorescence spectra of PS were recorded. PS exhibited two characteristic maximum absorption (λmax) of flavonoid at 285.0 nm relating to π → π * transition localized within ring A and ring C, and at 335.0 nm corresponding to n → π * transition of carbonyl group in ring C (Jomová et al., 2019). However, the fluorescence of PS in 50 % ethanol:H2O was rather weak (Fig. 2).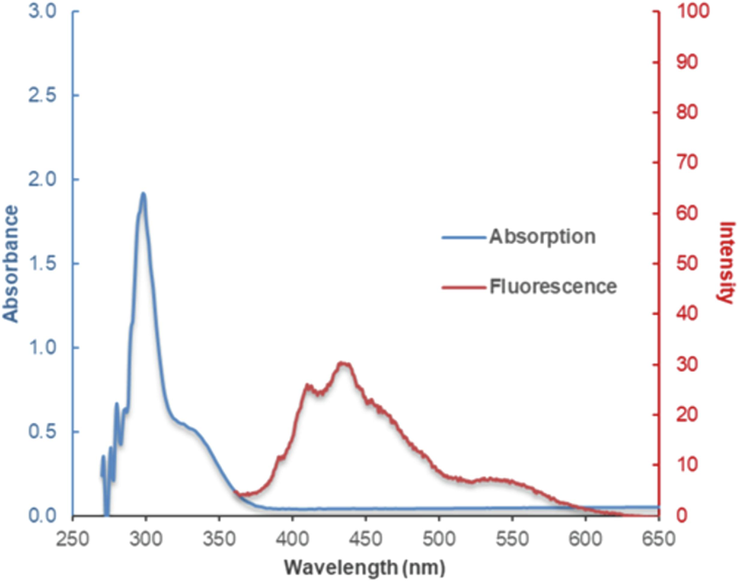
Absorption and fluorescence spectra of PS solution.
3.2 Optical behaviors of pinostrobin in the presence of metal ions
With electron-donating property of oxygen of the hydroxyl and carbonyl groups, PS has potential to form a complex with metal ions (Jomová et al., 2019; Kasprzak et al., 2015). To monitor the interaction between PS and different metal ions, optical changes of PS in the presence of metal ions were investigated. Among the studied metal ions, Fe3+ ion and Cu2+ ions caused a color change of PS from colorless to dark brown and light green, respectively, as shown in Fig. 3. In the case of Cr6+, Fe2+, and Co2+ ions, the colors of the mixture solutions appeared as the colors of metal ions themselves.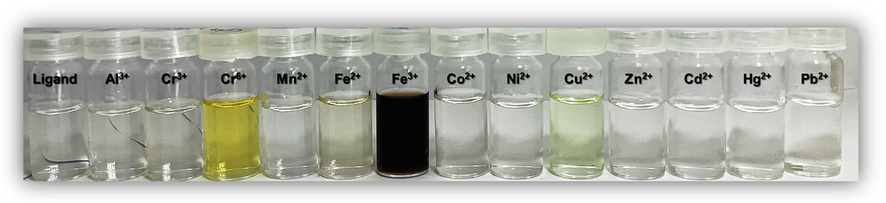
Appearance of mixture solutions of 100 ppm of PS (ligand) and 100 ppm of different metal ions.
Fluorescence emission of the metal ion-added PS solutions was recorded. Fluorescence spectra of the mixtures other than Al3+ and Zn2+were not significantly different from that of the PS blank solution. Al3+ and Zn2+ ions caused an emission enhancement of the PS solution with the maximum emission of 485.0 nm and 538.0 nm, respectively (Fig. 4). Therefore, optical properties of the PS solution with Al3+ and Zn2+ ions (based on fluorescence emission) and Fe3+ and Cu2+ (based on UV–Vis absorption) were further investigated.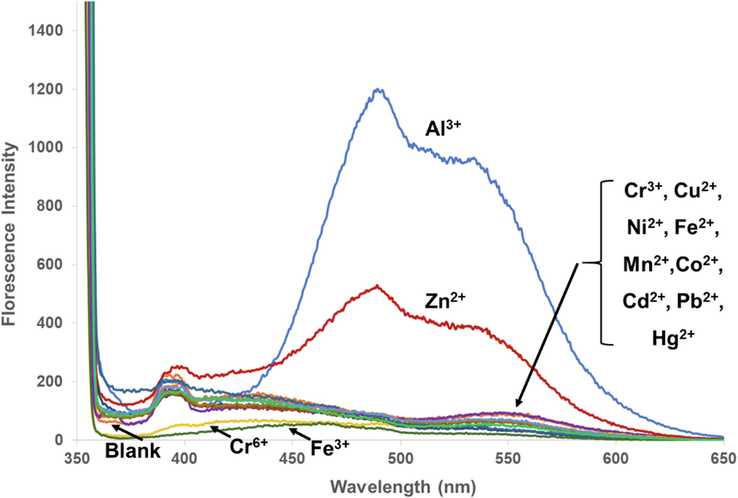
Fluorescence spectra of mixture solutions of 100 ppm of pinostrobin and 100 ppm of different metal ions.
3.3 Optimum conditions for the application of pinostrobin as an optical probe for metal ion detection
3.3.1 Effects of pH on metal ion detection
Complex formation is generally pH-dependent. Thus, the effect of different pH values on absorption spectra of Cu2+ and Fe3+ complexes, and fluorescence spectra of Al3+ and Zn2+ complexes was monitored. There were no significant changes in optical spectra in the free PS ligand mixed with a blank solution of pH 3 to 9 in the ratio of 1:1 (Fig. S2, ESI). In the presence of Cu2+ and Fe3+ ions, the absorption spectra of the complexes were different from that of the free ligand (Fig. 5). However, the Fe3+ complex showed the same absorption spectrum throughout the pH range from 3 to 9 (Fig.S3, ESI), but the spectra of Cu2+ complex changed when pH increased. At pH between 7 and 9, the signal at 335.0 nm decreased and that at 382.0 nm increased compared to the lower pH range (Fig. S4, ESI).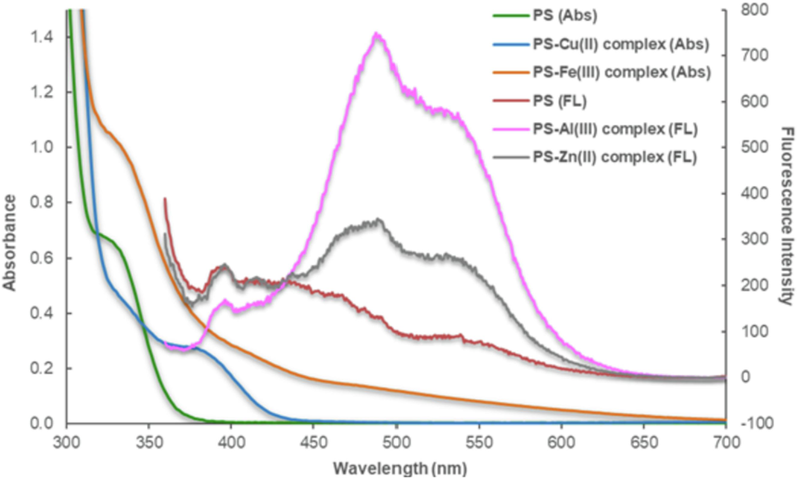
Absorption (Abs) spectra of free ligand (PS) and Cu2+ and Fe3+ complexes; and fluorescence (FL) spectra of free ligand (PS) and Al3+ and Zn2+ complexes.
The optimum pH for Al3+ and Zn2+ detection was determined via fluorescence spectrometer. The fluorescence intensity of the Al3+ complex was considerably enhanced over the pH range from 3 to 9 compared to that of the free ligand. The intensity at pH 3 was slightly less than others. The intensity of the fluorescence spectra of the Zn2+ complex increased slightly at pH 3–5, and significantly increased at pH 7–9 compared to that of the free ligand. Therefore, pH 7 was chosen for further study of metal ion determination.
3.3.2 Effects of concentration of pinostrobin on metal ion detection
The influence of PS concentration on metal ion detection was investigated because it resulted in changes in optical properties of the complex and solubility of PS. To optimize the concentration of PS, enhancement of fluorescence emission in terms of relative fluorescence intensity of Al3+ complex at the emission wavelength of 538.0 nm was monitored over the PS concentrations from 50 ppm to 1000 ppm (Fig. S5, ESI). The PS concentration of 100 ppm provided the largest percent of emission enhancement. Therefore, 100 ppm of PS concentration was chosen for further studies.
PS is soluble in organic solvent while metal ions are generally highly soluble in water. To facilitate the metal complex formation, the aqueous solution of Al3+, a representative of other metal ions, was mixed with PS solution. High concentration of PS can cause precipitation after mixing with the Al3+ aqueous solution. A suitable organic solvent for dissolving PS was also investigated. We found that ethanol was the most suitable solvent for PS because of good solubility with no precipitation of PS at high concentration up to 1000 ppm after adding the Al3+ aqueous solution. Moreover, it is a more environmental friendly organic solvent.
3.3.3 Effects of reaction time
The complex formation time to reach equilibrium was investigated to obtain an optimal reaction time between metal ions and PS. The reaction kinetic of the complexes of Fe3+ and Al3+ through absorbance and fluorescence emission, respectively, was recorded. The maximum absorbance of Fe3+ complex at 335.0 nm was achieved within 15 min (Fig. S6, ESI). For the Al3+ complex, the fluorescence intensity gradually increased and became steady after 24 min of reagents mixing. Thus, the reaction times to obtain the maximum signals for Fe3+ and Al3+ were at least 15 min and 24 min, respectively, prior to spectroscopic measurements.
3.4 Application of pinostrobin for metal ion measurement in environmental samples
The calibration curves of Cu2+, Fe3+, Al3+, and Zn2+ ions were constructed by measuring either absorbance or fluorescence emission of the complexes. Poor detection sensitivity of standard Cu2+ and Zn2+ solutions was obtained (data not shown). Hence, only Fe3+ and Al3+ were determined in environmental water samples (tap water, groundwater, and canal water) through the PS complex formation. We found that the absorbance of Fe3+- (PS)n at 335.0 nm was linearly proportional to the concentration of Fe3+ ions (Fig. 6a), while fluorescence intensity of Al3+- (PS)n at 538.0 nm increased exponentially with increasing concentration of Al3+ ions (Fig. 6b). Therefore, the linear correlation between the fluorescence intensities and concentrations of Al3+ in terms of logarithmic function was obtained. Linearity ranges of Fe3+ and Al3+ detection were 1–150 ppm and 0.05–100 ppm, respectively. Limit of detection (LOD) and limit of quantification (LOQ) for Fe3+ were 0.27 ppm and 0.90 ppm, respectively, while those for Al3+ were 0.02 ppm and 0.05 ppm, respectively. The LOD and LOQ were calculated based on the standard deviation (SD) at the lowest concentrations of linearity ranges of these ions and the slope of their calibration curves.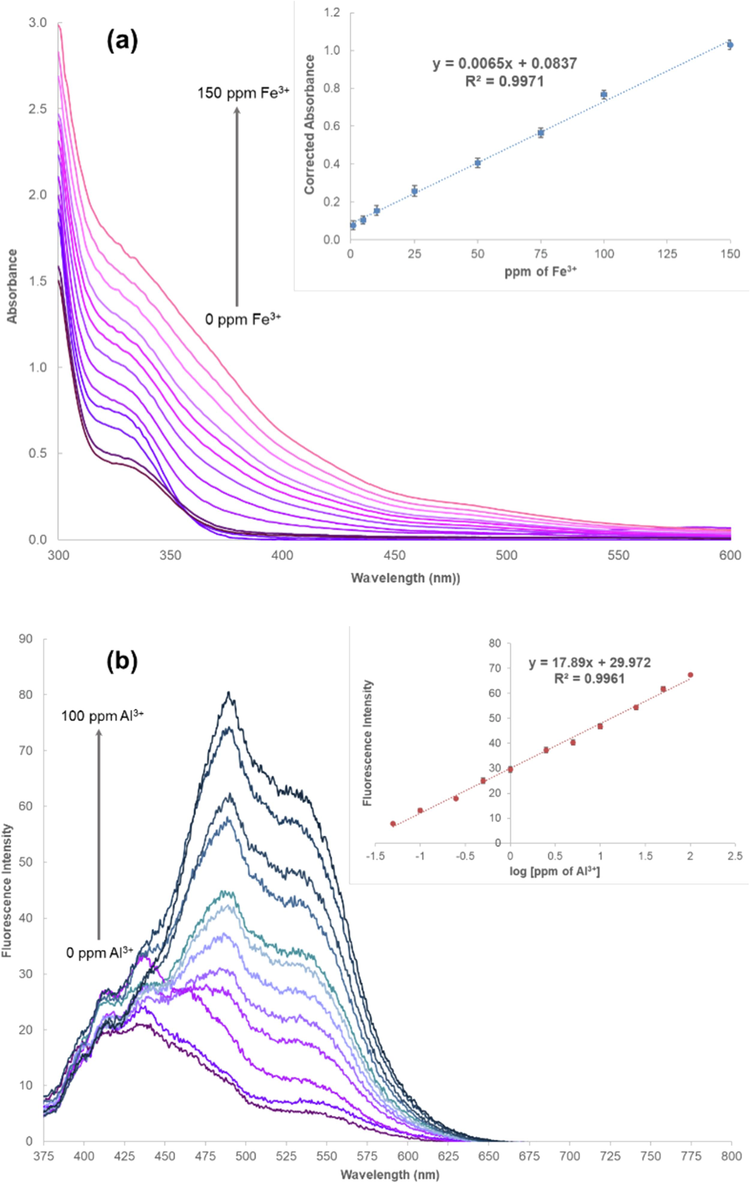
(a) Absorption spectra of Fe3+-(PS)n obtained from different concentrations of Fe3+ ions, and (b) fluorescence spectra of Al3+- (PS)n obtained from different concentrations of Al3+ ions with their calibration curves (inset).
The metal ions contaminated in samples of natural water including tap water, groundwater, and canal water were evaluated. A series of samples with different concentrations of metal ions were determined using the proposed method in comparison to the results obtained from ICP-OES. As shown in Table 1, Fe3+ ions were found in the range of 0.30–0.37 ppm, while Al3+ ions were not detected in the selected natural water determined by ICP-OES. Using the developed method, Fe3+ ions were detected at a significantly lower amount than by ICP-OES. The differences in detection may be due to the fact that the water samples contained less amount of Fe3+ ions than the LOQ of the developed method, leading to errors in the determination. In addition, the much higher detection value by ICP-OES was also attributed to ICP-OES not being able to differentiate between Fe3+ and Fe2+, resulting in an overestimation compared to the more selective developed method. The recoveries of Fe3+ and Al3+ ions in the real samples were between 91.00 and 107.08 % and 92.00–108.00 %, respectively. At concentrations of metal ions higher than the LODs, there were no significant differences in metal ion amounts determined by the two methods, indicating that the developed method was practical and applicable for the detection of Fe3+ and Al3+ in natural water samples.
Sample
Added metal standard (ppm)
Fe3+ determination
Al3+ determination
ICP-OES (ppm)
Proposed method (ppm)
Recovery (%)
ICP-OES (ppm)
Proposed method (ppm)
Recovery (%)
Tap water
0.0
0.34 ± 0.01
0.15 ± 0.06
–
0.00
0.00
–
1.0
1.26 ± 0.02
1.17 ± 0.12
102.0
0.94 ± 0.02
0.92 ± 0.08
92.00
25.0
26.83 ± 0.61
24.76 ± 1.05
98.44
24.77 ± 0.57
23.84 ± 0.98
95.36
Groundwater
0.0
0.37 ± 0.02
0.27 ± 0.05
–
0.00
0.00
–
1.0
1.32 ± 0.01
1.21 ± 0.16
94.00
0.98 ± 0.02
0.94 ± 0.10
94.00
25.0
26.68 ± 0.12
27.04 ± 1.13
107.08
23.97 ± 0.18
24.63 ± 1.22
98.52
Canal water
0.0
0.30 ± 0.00
0.18 ± 0.05
–
0.00
0.00
–
1.0
1.22 ± 0.02
1.09 ± 0.19
91.00
0.93 ± 0.01
1.08 ± 0.23
108.00
25.0
26.02 ± 0.32
24.84 ± 1.21
98.64
25.20 ± 0.54
24.21 ± 1.30
96.84
3.5 Binding mechanism between pinostrobin and metal ions
To understand the reaction between PS and metal ions, the complex formation mechanism was studied using several analytical techniques including FTIR, X-ray photoelectron spectrometry (XPS), UV–Vis spectrophotometry, and fluorescence spectrophotometry. The metal complexes were characterized using FTIR, and the spectra showed significant changes compared to that of blank PS (Fig. 7). The peak of C = O stretching at 1642 cm−1 disappeared, and a strong peak of 1065 cm−1 developed, which corresponds to deformational vibration of C-OH. These changes indicated an interaction between PS and metal ions through functional groups C = O and C-OH. The signals at 1619 cm−1 and 1157 cm−1 assigned to C = C and C-O-C, respectively, remained at the same wavenumber, which confirms non-complex formation sites. Moreover, the O–H stretching band of the complexes appeared at 3000–3500 cm−1, indicating the presence of water crystallization in the complexes (Mathiyalagan et al., 2021).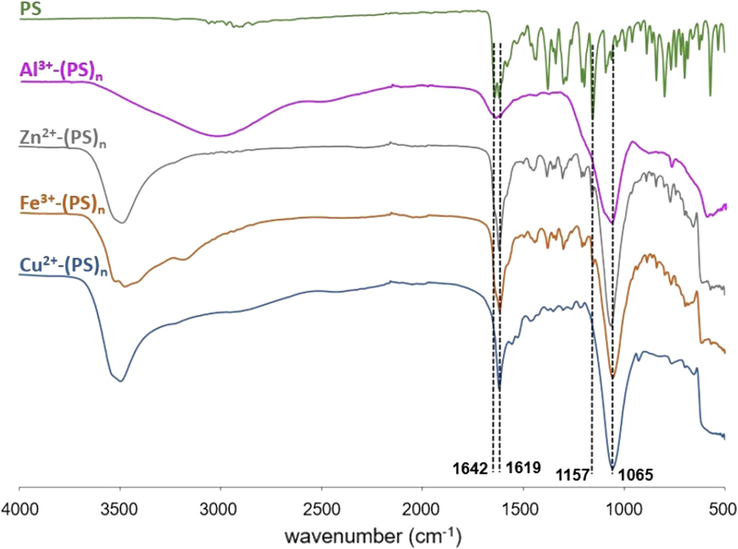
ATR-FTIR spectra of PS powder in comparison to PS complex with different metal ions (Mn+- (PS)n).
An XPS analysis was conducted on PS before and after the metal complex formation to elucidate the interaction mechanism. The photoelectron spectra of C 1 s (Fig. S7, ESI) and O 1 s (Fig. 8) were recorded. In free PS powder, the major peaks appeared at binding energies B.E.) of 531.750 eV and 533.233 eV, corresponding to –OH of the phenol hydroxyl group and C-O-C in the aromatic ring, respectively. A minor peak at 534.484 eV was detected, indicating an adsorbed water content 534.484 eV was detected, indicating an adsorbed water content in the sample. The same trend of B.E. of O 1 s was observed in all PS complexes with different metal ions [Table 2]. The B.E. of O 1 s of phenol hydroxyl group significantly increased (ΔB.E. ˃ 0.5), which indicates the coordinating formation to metal ions, while those of the ester group remained the same (ΔB.E. < 0.5). Therefore, the ester group was not involved in the complex formation. In the case of the Zn complex, the lower B.E. of O 1 s at 530.429 eV suggested the presence of a hydroxide species of Zn. This hydroxide species was less soluble compared to other metal hydroxide forms of other metal ions at pH ∼ 7 (Marchioretto et al., 2005). In addition, some of hydroxyl groups from the phenol moiety remained unbound to Zn ions as evident by the peak at 531.466 eV, which is close to that of free ligand. The results obtained from the XPS analysis showed good agreement with those from FTIR, suggesting that the hydroxyl and carbonyl groups of PS are the binding sites for complex formation with metal ions, causing the changes in optical property of PS.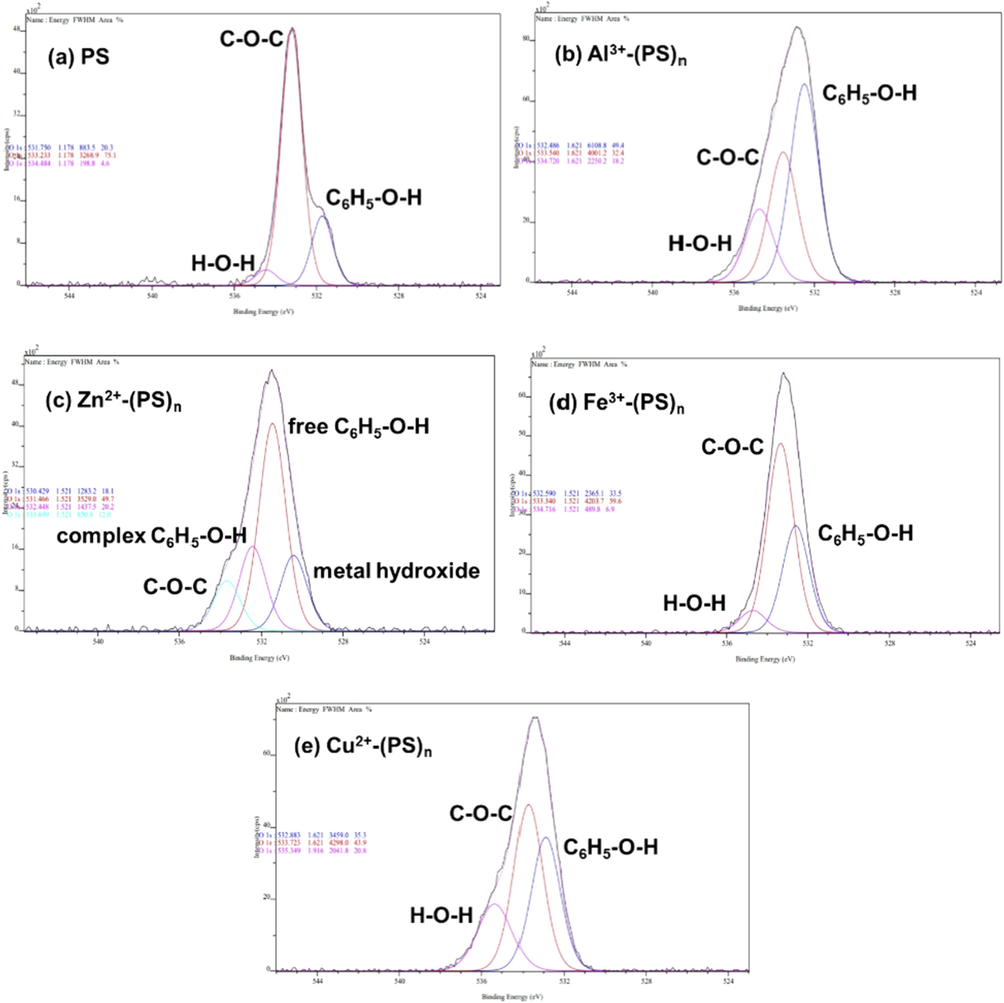
Deconvoluted peaks of O 1 s of PS (a), and PS complexes with metal ions (b-e).
B.E. (eV)
O 1 s
Assignment
Metal hydroxide (Dupin et al., 2000; Gomez-Bolivar et al., 2019)
C6H5-O′H (Shen et al., 2013)
C-O′-C (Far et al., 2017)
H-O–H (adsorbed) (Shen et al., 2013)
PS (free)
531.750
533.233
534.484
Al3+- (PS)n
–
532.486
533.540
534.720
Zn2+- (PS)n
530.429
531.466/532.448
533.699
–
Fe3+- (PS)n
–
532.590
533.340
534.716
Cu2+- (PS)n
–
532.883
533.723
535.349
The stoichiometry of metal ions and PS was determined using the continuous variation method (Job’s plot). A correlation between relative absorbance and mole fraction of metal ion was plotted for Fe3+ and Cu2+ complexes, while the values of relative fluorescence intensity were used for Al3+ and Zn2+ complexes. All complexes were formed with the ratio of metal to PS of 1:2 (Fig. S8, ESI). The structure of the complex is proposed in Fig. 9. Oxygen atoms of the carbonyl and hydroxyl groups from two molecules of PS bind to the center metal ion in a planar geometry. In addition, molecules of water, as detected in the complex crystal, attach to the center metal ion causing the formation of octahedral complex. Complex formation between Fe3+ or Cu2+ with PS caused the change in color of PS from colorless to brown and green, respectively. The shift in color can be explained using the crystal field and charge transfer theory. Coordination with PS results in d-orbital splitting of Fe3+ ion, leading to d-d transition and thus enhancing the absorbance at 500–600 nm. In addition, an increase in absorbance at 300 – 400 nm results from the charge transfer of PS (ligand) to d orbital of Fe3+. For the Cu2+ complex, a new peak appears at 375 nm, corresponding to the green color because of the d-d transition of Cu2+ ion. In the case of Al3+ and Zn2+ complexes, the solution remained colorless because there is no electron filled in d orbitals of Al3+ ion, while fully filled in d orbitals of Zn2+ ion. As a result, no d-d transition occurs.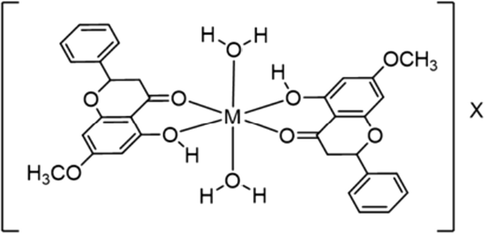
A Proposed structure of complex formation between metal ion and PS; M = metal ions including Fe3+, Cu2+, Al3+, Zn2+, and X = counter anion.
Originally, a solution of PS exhibits a weak fluorescence emission. Complexing with Al3+ and Zn2+ led to a significantly enhancement of fluorescence. This is possibly attributed to the inhibition of photo-induced ultrafast proton transfer or tautomerization process (Park et al., 2016) between the hydroxyl group and carbonyl group within the molecule of PS. In addition, the specificity of PS to Al3+ and Zn2+ caused a significant increase in fluorescence intensity due to the enhanced mobility of electrons in the structure of the complex and the internal electronic transition was reduced (Jianbo et al., 2018; Ravi Kishore et al., 2002).
3.6 Theoretical study of complex structure
To confirm the structure of the proposed complex, simulated absorption spectra based on ground state (S0) geometries of free PS and its complexes with Fe3+ and Al3+ ions were calculated using time-dependent B3LYP or TD-B3LYP at the same basis set as the experimental spectra (Fig. S9, ESI). The results showed that the calculated absorption spectrum of Fe3+ complex matched that of the experimental spectrum, while acceptable differences of approximately 30 nm of maximum absorption was observed between the experimental spectrum and calculated spectrum of the Al3+ complex. Thus, the proposed complex structure is likely accurate. The energy gap (ΔEgap) between the highest occupied molecular orbital (HOMO) and the lowest unoccupied molecular orbital (LUMO) is an indication of the stability of a molecule and its resistivity to light radiation. The predicted ΔEgap values and the spatial distributions of the Fe3+ (Fig. 10) and Al3+ complexes at ground states and the first singlet excited state of Al3+ complex (Fig. S10, ESI) in an aqueous solution were calculated. The results indicated that the formation between PS and Fe3+ was the most stable coordination complex at ground state as the smallest ΔEgap was obtained, and the energy significantly decreased compared to that of a free PS molecule. This observation aligns with the experimental results, which indicates that the binding of Fe3+ to PS stabilizes the system due to a decrease in the HOMO-LUMO energy gap of the complex. As shown in Fig. 10, the π electrons at HOMO are mainly distributed on PS rings whereas those at the LUMO are mainly distributed on the metal ions. For the Al3+ complex at ground state, the ΔEgap (0.143 eV) was also lower than that of free PS, but considerably higher than that of Fe3+, corresponding to the weak absorption behavior of the Al3+ complex. However, the ΔEgap (0.122 eV) of Al3+ complex at the first excited state was smaller than that at ground state. This could explain the preferable fluorescence behavior of the Al3+ complex. In addition, binding energies of both Fe3+ and Al3+ complexes were calculated, and the respective values of −11.45 eV and −19.37 eV were obtained, indicating high stability of the structure and geometry of the metal complexes.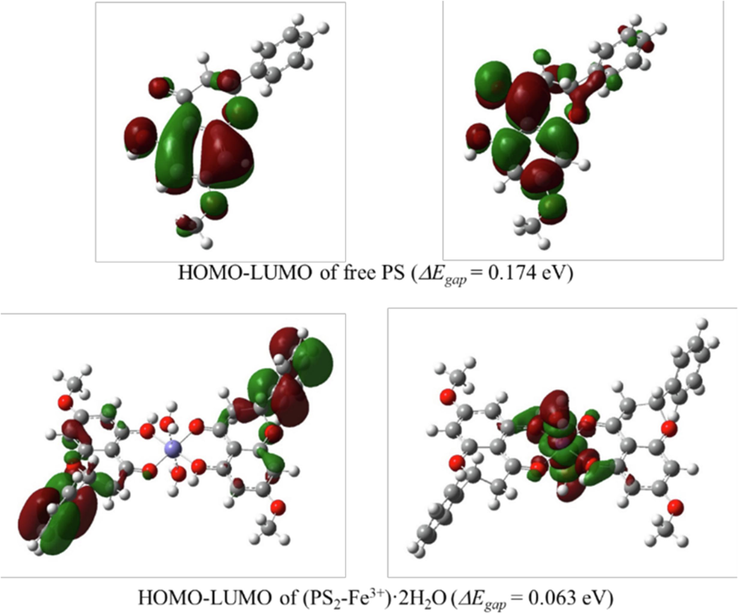
The HOMO and LUMO orbitals at ground state and the energy gaps (ΔEgap) of free PS and Fe3+ complexes calculated using the TD-B3LYP/LANL2DZ/6–311++G(d,p) method in CPCM water model.
4 Conclusions
This work presented a novel approach of using a colorless and non-luminescent PS molecule, a natural flavonoid, as an optical sensor for metal ion determination. The PS turned on its optical behaviour upon complex formation with specific metal ions. The resulting Fe3+ and Cu2+ complexes caused a color change, while Al3+ and Zn2+ complexes caused an enhancement of fluorescence intensity. With these unique optical properties, PS can be applied as a low cost and non-toxic probe for metal ion detection with high sensitivity and selectivity. The proposed approach would be useful for Fe3+ and Al3+ quantification in drinking water and natural water samples to ensure that they are safe for consumption (below 0.3 ppm of Fe3+ and 0.1 ppm of Al3+ as recommended by World Health Organization (WHO) and the Environmental Protection Agency (EPA) of the United States (Ji et al., 2019)). In addition, this study revealed that the carbonyl and hydroxyl groups of PS play an important role in complex formation with metal ions. The results from the experimental and theoretical studies were congruent, showing the formation of octahedral complexes of a center metal ion binding to two molecules of PS and water.
Acknowledgments
This project was fully supported by Thailand Science Research and Innovation Fund and Srinakharinwirot University (Grant No. 023/2565) and partially supported by Center of Excellence in Agricultural Innovation and Food Safety, Department of Chemistry, Faculty of Science, Srinakharinwirot University. The authors also acknowledge National e-Science Infrastructure Consortium, National Electronics, and Computer Technology Center (NECTEC) for providing computing resources that have partly contributed to the research results in this manuscript. URL:www.e-science.in.th
Declaration of Competing Interest
The authors declare that they have no known competing financial interests or personal relationships that could have appeared to influence the work reported in this paper.
References
- Natural organic matter-cations complexation and its impact on water treatment: A critical review. Water Res.. 2019;160:130-147.
- [Google Scholar]
- Bioaccumulation of non-essential hazardous heavy metals and metalloids in freshwater fish. Risk to human health. Environ. Chem. Lett.. 2018;16:903-917.
- [Google Scholar]
- Environmental chemistry and ecotoxicology of hazardous heavy metals: environmental persistence, toxicity, and bioaccumulation. J. Chem. 2019
- [CrossRef] [Google Scholar]
- Assessment of the levels of some heavy metals in water in Alahsa Oasis farms, Saudi Arabia, with analysis by atomic absorption spectrophotometry. Arab. J. Chem.. 2015;8:240-245.
- [Google Scholar]
- Energies, structures, and electronic properties of molecules in solution with the C-PCM solvation model. J. Comput. Chem.. 2003;24:669-681.
- [CrossRef] [Google Scholar]
- Plant flavonoids: Chemical characteristics and biological activity. Molecules. 2021;26:5377.
- [CrossRef] [Google Scholar]
- Systematic XPS studies of metal oxides, hydroxides and peroxides. PCCP. 2000;2:1319-1324.
- [Google Scholar]
- Heavy metals and metalloids: sources, risks and strategies to reduce their accumulation in horticultural crops. Sci. Hortic.. 2018;234:431-444.
- [Google Scholar]
- Air-oxidation of phenolic resin aerogels: backbone reorganization, formation of ring-fused pyrylium cations, and the effect on microporous carbons with enhanced surface areas. RSC Adv.. 2017;7:51104-51120.
- [Google Scholar]
- Frisch MJ, Trucks GW, Schlegel HB, et al., (2009) Gaussian 09, Revision B.01, Gaussian: Wallingford, CT.
- Synthesis of Pd/Ru bimetallic nanoparticles by Escherichia coli and potential as a catalyst for upgrading 5-hydroxymethyl furfural into liquid fuel precursors. Front. Microbiol.. 2019;10:1276.
- [CrossRef] [Google Scholar]
- Interfacing DNA with gold nanoparticles for heavy metal detection. Biosensors (basel). 2020;10:167.
- [CrossRef] [Google Scholar]
- Ecological and human health risk assessment of heavy metal contamination in soil of a municipal solid waste dump in Uyo, Nigeria. Environ. Geochem. Health. 2017;39:497-515.
- [Google Scholar]
- Toxicity, mechanism and health effects of some heavy metals. Interdiscip. Toxicol.. 2014;7:60-72.
- [Google Scholar]
- Optical detection of Fe3+ ions in aqueous solution with high selectivity and sensitivity by using sulfasalazine functionalized microgels. Sensors (basel). 2019;19:4223.
- [CrossRef] [Google Scholar]
- Study on relationship between fluorescence properties and structure of substituted 8-hydroxyquinoline zinc complexes. J. Fluoresc.. 2018;28:1121-1126.
- [Google Scholar]
- Study of interactions between metal ions and protein model compounds by energy decomposition analyses and the AMOEBA force field. J. Chem. Phys.. 2017;147:161733
- [CrossRef] [Google Scholar]
- A switch between antioxidant and prooxidant properties of the phenolic compounds myricetin, morin, 3′,4′-dihydroxyflavone, taxifolin and 4-hydroxy-coumarin in the presence of copper(II) ions: A spectroscopic, absorption titration and DNA damage study. Molecules. 2019;24:4335.
- [CrossRef] [Google Scholar]
- Boesenbergia rotunda extract inhibits Candida albicans biofilm formation by pinostrobin and pinocembrin. J. Ethnopharmacol.. 2020;261:113193
- [CrossRef] [Google Scholar]
- Properties and applications of flavonoid metal complexes. RSC Adv.. 2015;5:45853-45877.
- [Google Scholar]
- Iron Complexes of flavonoids-antioxidant sapacity and beyond. Int. J. Mol. Sci.. 2021;22:646.
- [CrossRef] [Google Scholar]
- Metal complexes of flavonoids: their synthesis, characterization and enhanced antioxidant and anticancer activities. Future Med. Chem.. 2019;11:2845-2867.
- [Google Scholar]
- Self-consistent equations including exchange and correlation effects. Phys. Rev.. 1965;140:A1133.
- [CrossRef] [Google Scholar]
- Chemistry and biological activities of flavonoids: an overview. Sci. World J. 2013
- [CrossRef] [Google Scholar]
- Blue transition metal complexes of a natural bilin-type chlorophyll catabolite. Chem. Sci.. 2014;5:3388-3395.
- [Google Scholar]
- Concentrations of hazardous heavy metals in environmental samples collected in Xiamen, China, as determined by vapor generation non-dispersive atomic fluorescence spectrometry. Anal. Sci.. 2004;20:85-88.
- [Google Scholar]
- Fluorescence characteristics of aqueous synthesized tin oxide quantum dots for the detection of heavy metal ions in contaminated water. Nanomaterials (basel). 2019;9:1294.
- [CrossRef] [Google Scholar]
- Heavy metals precipitation in sewage sludge. Sep. Sci. Technol.. 2005;40:3393-3405.
- [Google Scholar]
- Analysis of selected heavy metals in tap water by inductively coupled plasma-optical emission spectrometry after pre-concentration using Chelex-100 ion exchange resin. Water Air Soil Pollut.. 2020;231:243.
- [CrossRef] [Google Scholar]
- Stability comparison of quercetin and its metal complexes and their biological activity. Biointerface Res. Appl. Chem.. 2021;11:7890-7902.
- [Google Scholar]
- Characterization of two chalcone derivatives isolated from finger root with nutraceutical potentials. Int. J. Adv. Res.. 2018;6:1089-1094.
- [Google Scholar]
- Assessment of environmental geochemistry of lead-zinc mining at Ishiagu area, Lower Benue Trough, southeastern Nigeria. Earth Sci. Res.. 2020;9:31-44.
- [Google Scholar]
- Origin of ultraweak fluorescence of 8-hydroxyquinoline in water: photoinduced ultrafast proton transfer. RSC Adv.. 2016;6:9812-9821.
- [Google Scholar]
- New basis set exchange: an open, up-to-date resource for the molecular sciences community. J. Chem. Inf. Model.. 2019;59:4814-4820.
- [CrossRef] [Google Scholar]
- Turmeric powder as a natural heavy metal chelating agent: surface characterisation. Pak. J. Sci. Ind. Res. A: Phys. Sci.. 2017;60:1-8.
- [Google Scholar]
- On the assignment of the absorption bands in the optical spectrum of Alq3. Synth. Met.. 2002;126:199-205.
- [Google Scholar]
- Antioxidant properties of flavonoid metal complexes and their potential inclusion in the development of novel strategies for the treatment against neurodegenerative diseases. Biomed. Pharmacother.. 2021;143:112236
- [CrossRef] [Google Scholar]
- Bioactive compounds of Boesenbergia sp. and their anti-inflammatory mechanism: A review. J. Appl. Pharm. Sci.. 2020;10:116-126.
- [Google Scholar]
- Growth and stabilization of silver nanoparticles on carbon dots and sensing application. Langmuir. 2013;29:16135-111640.
- [Google Scholar]
- Several classes of natural products with metal ion chelating ability. Curr. Org. Chem.. 2015;19:1935-1953.
- [Google Scholar]
- Simple and fast colorimetric detection of inorganic arsenic selectively adsorbed onto ferrihydrite-coated silica gel using silver nanoplates. Talanta. 2016;153:197-202.
- [Google Scholar]
- Evaluating the role of metal ions in the bathochromic and hyperchromic responses of cyanidin derivatives in acidic and alkaline pH. Food Chem.. 2016;208:26-34.
- [Google Scholar]
- Spectral and colorimetric characteristics of metal chelates of acylated cyanidin derivatives. Food Chem.. 2017;221:1088-1095.
- [Google Scholar]
- A simple paper-based approach for arsenic determination in water using hydride generation coupled with mercaptosuccinic-acid capped CdTe quantum dots. Anal. Methods. 2020;12:2718-2726.
- [Google Scholar]
- Determination of heavy metals in fish samples of the middle Black Sea (Turkey) by graphite furnace atomic absorption spectrometry. Food Chem.. 2003;80:119-123.
- [Google Scholar]
- Responses of wheat yield, macro- and micro-nutrients, and heavy metals in soil and wheat following the application of manure compost on the North China plain. PLoS One 2016
- [CrossRef] [Google Scholar]
- Protective effect of tea against lead and cadmium-induced oxidative stress-a review. Biometals. 2018;31:909-926.
- [Google Scholar]
- Recent advances of electrospun nanofibrous membranes in the development of chemosensors for heavy metal detection. Small. 2017;13:1604293.
- [CrossRef] [Google Scholar]
Appendix A
Supplementary material
Supplementary data to this article can be found online at https://doi.org/10.1016/j.arabjc.2023.105321.
Appendix A
Supplementary material
The following are the Supplementary data to this article:Supplementary data 1
Supplementary data 1


