

Polycyclic aromatic hydrocarbons in citrus fruit irrigated with fresh water under arid conditions: Concentrations, sources, and risk assessment
⁎Corresponding author at: Chemistry Department, Faculty of Science, 61710, Mutah University, Karak, Jordan. al-madanat@iftc.uni-hannover.de (Osama Y. Al-Madanat)
-
Received: ,
Accepted: ,
This article was originally published by Elsevier and was migrated to Scientific Scholar after the change of Publisher.
Peer review under responsibility of King Saud University.
Abstract
Abstract
-
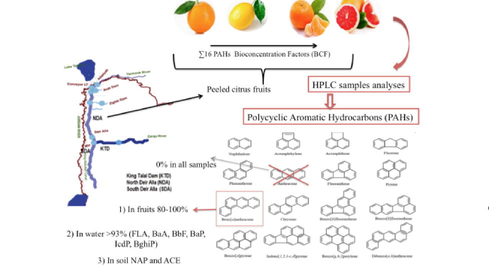
PAHs in citrus fruits grown in North of Deir-Alla, Jordan valley were investigated.
-
Grapefruits showed the highest ∑PAHs concentration (34.857 µg kg−1)
-
The ILCR in the study region indicated a potential cancer risks to population.
-
PAHs emission sources are biomass burning, vehicular emissions and petrogenic origin.
-
BCF for ∑16 PAHs was observed in the order of grapefruit > lemon > mandarin > orange.
Abstract
In Jordan, as well as in all the world countries, consumption of citrus fruits is an essential part of the daily diet, so it is important to assess the potential risk of the persistent organic pollutants such as polyaromatic hydrocarbons (PAHs) in these fruits to the human health and identify their sources in order to eliminate or reduce them. This study reports 16 priority PAHs content in four types of peeled citrus fruits grown in Jordan valley. PAHs were detected in all the studied samples in variable quantities depending on the type of citrus fruits. The results showed that the highest PAH level corresponded to acenaphthene (35.018 µg/kg) in grapefruit. Among the carcinogenic PAHs, benzo[a]anthracene (BaA) and benzo(a)pyrene (BaP) were the most representative and found in all the analyzed fruit, soil, and water samples, whereas anthracene (ANT) was not detected at all. The mean ∑16 PAHs for the different fruits were found to be 62.593 µg kg−1 in grapefruit, 24.840 µg kg−1 in lemon, 22.901 µg kg−1 in mandarin, and 5.082 µg kg−1 in orange. The dominance of naphthalene (NAP) and acenaphthene (ACE) in soil under hot climatic conditions indicates the recent and continuous input of these types in the investigated area. The bioconcentration factor (BCF) for ∑16 PAHs was observed in the order of grapefruit > lemon > mandarin > orange. Based on the results of the principal component analysis (PCA), the primary sources of PAHs in agricultural soils mainly originated from biomass burning and vehicular emissions. The incremental lifetime cancer risk (ILCR) indicated that consumption of these four citrus fruits may expose human health to potential cancer risk. The findings of this study call the policymakers and public administrations to the formulation of stringent policies and actions to control biomass burning and vehicular emissions.
Keywords
PAHs
Agricultural soils
Fruit
Source identification
Risk assessment
Environment

1 Introduction
Contamination of agricultural products is considered hazardous for a considerable portion of the inhabitants. The most dangerous and carcinogenic groups of contaminants that may present in agricultural products are polycyclic aromatic hydrocarbons (PAHs), chemical pesticides, and heavy metals. PAHs are one of the most hazardous pollutants that threaten the population if present in the food chain. PAHs are nonpolar compounds with two or more fused benzene rings (Wang et al., 2015). They are divided into two groups based on the number of rings, where the more stable and toxic heavy PAHs (HMW PAHs) with a structure of more than four rings and the less lipophilic light PAHs (LMW PAHs) that contain up to four rings (Lawal 2017). The particles and gases that contain PAHs are transported in different phases and deposited in different parts of the environment. PAHs are commonly detected in soil, water, and air, and microbes cause their major degradation process (Abdel-Shafy and Mansour, 2016). Most of the PAHs found in the environment come from natural sources, such as volcanic eruptions and forest fires. However, their elevated levels were also found due to industrial processes, fossil fuels, and coal production (Nie et al. 2014).
Their presence in food products is attributed to the various factors contributing to their production, such as air pollution and food processing. Depending on the properties of the PAHs, they can be transported through wet deposition or dry air (De Nicola et al., 2008). The increasing of the octanol-water partitioning coefficient (Kow) for PAH leads to an increase in PAHs lipophilicity, decreases the aqueous solubility, and increases the tendency for sorption to a particular soil (Abdel-Shafy and Mansour, 2016). The plant's uptake and mobility of LMW PAHs are easier than HMW PAHs, and thus, the plant can easily absorb and transport LMW PAHs due to their mobility and water solubility (Zelinkova and Wenzl, 2015). However, only 16 out of the hundreds of studied PAHs were considered priority pollutants due to their potential to cause health problems (Zelinkova and Wenzl, 2015). The presence of these compounds in plants and the environment can affect the food chain, and they can reach the soil, sewage sludges, aerosols, sediments, and water bodies through their various distribution points (Kipopoulou et al. 1999; Zohair et al. 2006). Due to atmospheric pollution, food items are usually contaminated with these compounds through particulate deposition on vegetables and fruits (Falcó et al., 2003). The most common method of transferring PAHs to plants is through atmospheric exposure, either as surface adsorption for low molecular mass PAHs or through adsorption to air particles for HMW PAHs (Paris et al., 2018).
The uptake of PAHs by plants from soil water depends on the compounds' physical properties, such as their solubility, volatility, and lipophilicity (Wang et al., 2017). However, in some cases, the presence of PAHs in soil and plant tissues has been shown to directly relate to the plant's uptake and transport of the compounds (Meudec et al., 2006). PAH concentration in certain plant tissues may vary depending on the compounds' physical properties, including the molecular weight, the organic matter, and the soil's characteristics (organic matters, texture, and aggregation) (Edwards, 1983). In vegetables, the abundance of HMW-PAHs was lower than in soil (Tao et al., 2004). While in fruits, PAH levels depend on plant variety, the fruit's part, and the fruit growing stage (Soceanu et al., 2016). Many PAHs and their epoxides have severe health threats to humans and animals due to their toxic, mutagenic, and carcinogenic properties (Yang et al., 2017). Exposure to high levels of PAHs is known to have detrimental effects on the health of organisms. Numerous studies have shown a strong link between cancer and dietary exposure to PAHs (Yoon et al., 2007). Humans consuming fruits with hydrophobic surface layers might risk getting PAHs from their particles (Broomhead et al., 2020; De Nicola et al., 2008; Shariatifar et al., 2021). The accumulation of PAHs in agricultural soils due to the various anthropogenic activities creates negative risks for humans through food chain bioaccumulation (Domingo and Nadal, 2015). In order to analyze such risks, it is crucial to investigate the concentrations and source of PAHs in both soils and fruits.
Several studies were carried out to evaluate the levels of PAHs in different types of fruit (Wennrich et al. 2002; Abou-Arab et al. 2014; Soceanu et al. 2016). In a study by Abou-Arab et al. (2014) the total concentration of PAHs in some Egyptian fruits collected from different regions in Cairo was the highest in apple (2.867 μg/kg), followed by guava (2.334 μg/kg). However, in another study the total mean concentration of PAHs in different fruit samples obtained from various places in Mumbai was the highest in apple (51.6 μg/kg) followed by guava (48.31 μg/kg), sapota (41.3 μg/kg), grapes (40.72 μg/kg), papaya (31.66 μg/kg) and pineapple (25.82 μg/kg) (Bishnoi et al., 2006). The PAH contents in different fruit and vegetable species cultivated in the industrial area of Bitterfeld-Wolfen (Germany) were decreased in the following order: parsley > kale > apples > potatoes > strawberries > tomatoes > kohlrabi > lettuce (Wennrich et al., 2002). Another study by Rojo Camargo and Toledo (2003) has determined the levels of PAHs in samples of lettuce, tomato, cabbage, apple, grape, and pear, and utilize these data to further calculate the dietary exposure of Brazilians to PAHs. In the same study, it was found that the mean levels of total PAHs were 13.53 µg/kg in lettuce, 9.50 µg/kg in tomato, 8.86 µg/kg in cabbage, 4.05 µg/kg in apple, 3.77 µg/kg in grape and 3.87 µg/kg in pear. For citrus fruits, it can be observed that PAHs concentrations in pulps are generally smaller than in peels, which may be ascribed to exposure to contaminated air (Soceanu et al., 2016). Moreover, several studies show that the concentrations of PAHs are generally higher on the plant surface and peels than in internal tissue (Abdel-Shafy and Mansour, 2016), due to the generally higher lipid content of peels than for cores (Chiou et al., 2001). Fruits, which are characteristic of a hydrophobic surface layer, can directly adsorb PAHs from particles (De Nicola et al., 2008), creating a health risk for humans when consumed (Broomhead et al., 2020). Citrus fruits in terms of nutritional value have an important role in the human diet. Thus, information regarding the accumulation of PAHs in citrus fruits is essential in human health risk assessment. However, information about PAHs' burden on agricultural soils and citrus fruits in this region is not available. This is, to the best of our knowledge, the first paper in which PAHs content in Jordanian citrus fruits is addressed and evaluated.
Therefore, the main aim of this research is to investigate the level of contamination by the most toxic 16 PAHs in one of the most known agricultural areas in Jordan. Specifically, our study had the following objectives: (1) to identify and quantify the levels of 16 priority PAHs in soil and four types of peeled citrus fruits (grapefruit, orange, lemon, and mandarin) from fields irrigated with the same water quality; (2) to identify the probable sources of 16 PAHs in soil by using PAH ratios and PCA; (3) to assess the transfer of PAHs from soil to plant; and (4) to calculate the ILCR posed by citrus fruits consumption. The obtained results would provide important information for the identification of the sources of PAHs in the agricultural areas to minimize the citrus fruits contamination and human health risks.
2 Methodology
2.1 Chemicals and reagents
All the chemicals were of analytical and HPLC-reagent grade, purchased from Sigma-Aldrich (NJ, USA) unless otherwise stated. OASIS HLB (6 mL/500 mg) cartridges for the solid-phase extraction were purchased from Waters® (Waters®, Ireland). A analytical standard mixture containing 16 PAHs in acetonitrile (10 µg L−1) were purchased from Merck (Darmstadt, Germany), which containing: naphthalene (NAP), acenaphthylene (ACY), acenaphthene (ACE), phenanthrene (PHE), fluorene (FLO), anthracene (ANT), pyrene (PYR), fluoranthene (FLA), benzo[a]anthracene (BaA), chrysene (CHR), benzo[b]fluoranthene (BbF), benzo[k]fluoranthene (BkF), benzo(a)pyrene (BaP), indo[1,2,3,c,d]pyrene (IcdP), dibenzo[a,h]anthracene (DahA), and benzo[g,h,i]perylene (BghiP). Milli-Q ultrapure water (18.2 MΩ cm, 25 °C) was obtained from a water purification system (Waters, Milford, MA, USA). Stock solutions of all target compounds at a concentration of 50 µg µL−1 were prepared in acetonitrile. A mixture of target analytes was also prepared in methanol at different concentrations as follows: 50 ng µL−1, 1000 ng µL−1, and 30000 ng µL−1. All of the stock standard solutions were stored at −20 °C in the dark for up to two months. The working standard solutions were prepared weekly, while the calibration standard solutions for quantitation were daily prepared by dilution in a mixture of water/acetonitrile, (0.1% formic acid) 50:50 (v/v). All reagents were used as received without any further purification.
2.2 Study area
The investigation area was located near the North of Deir-Alla (NDA) in Jordan valley, Jordan (Fig. 1). In this area, the irrigation water comes merely from the King Abdullah Canal (KAC). The quality and quantity of the KAC depend on the runoff water resources from different places including Jordan, Syria, and Golan Heights in the winter season. Due to the shortage quantity of the feeding water in the summer season, the canal is fed from the Arab and Ziglab dams in Jordan (Fig. 1), where the water quality is considered cleaner water than the King Talal dam water (Tahboub et al., 2017). The study area is characterized by its arid hot climatic conditions in the summer and mild in the winter seasons. The annual rainfall value is about 300 mm (Department of Statistics, 2020). It is containing intensive agricultural activities (∼23,000 ha) with different types of vegetables and fruits, where around 90% of the production of citrus fruits in Jordan originates from the Jordan valley. The Citrus fruit production comes from farms of around 79 × 106 m2 of calcareous soil producing more than 79,000 tons annually. Moreover, the sampling sites also have medium traffic densities that run parallel to the farms, which reduces the possibility of contamination from the surrounding environment.
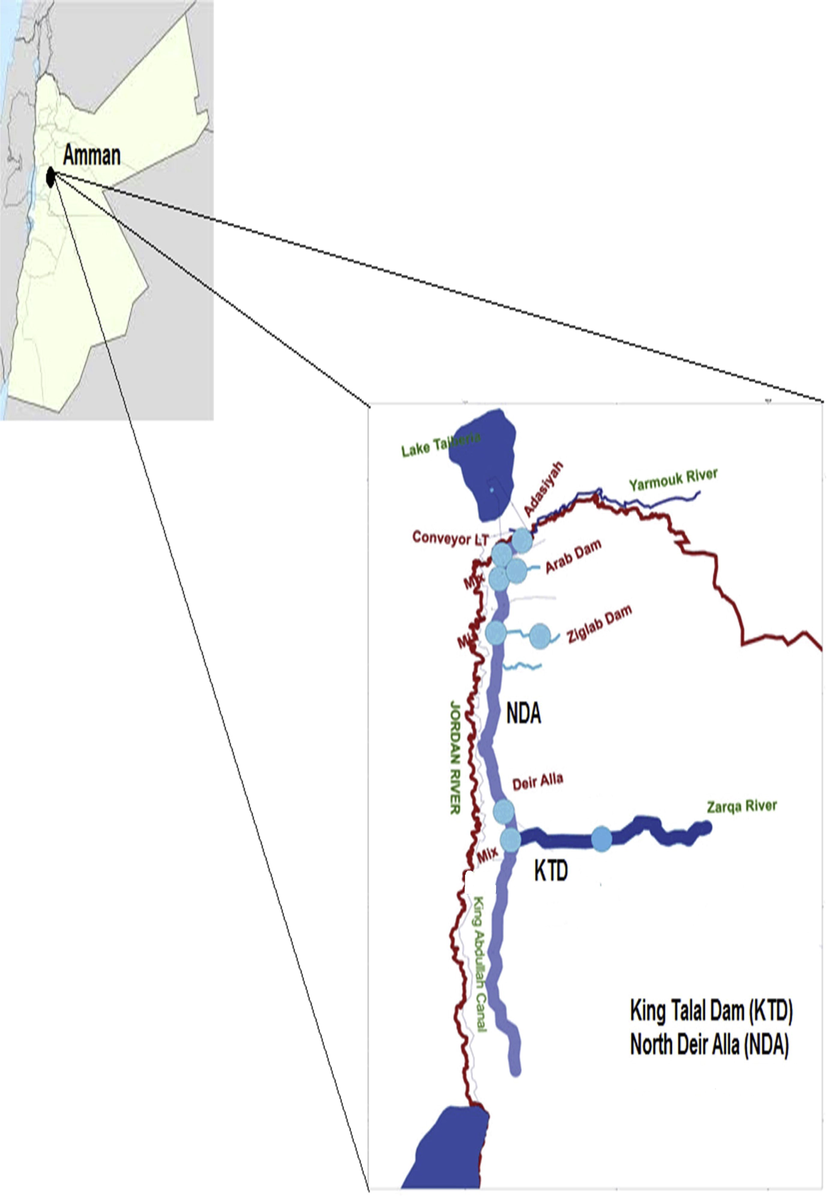
- Location Map of NDA in the Jordan valley, Jordan. Reproduced with permission from reference (Al-Nasir et al., 2020). Copyright 2020 Elsevier B.V.
2.3 Sampling
Soil, water, and citrus fruit samples were collected from the same cultivation site in 2018. Sampling took place in November–December at the end of the growing season of each product when the fruits are ripe and ready for harvesting. Four kinds of citrus fruit were included in the investigation: orange, lemon, grapefruit, and mandarin. Sampling was performed based on the sampling principles and methods outlined by the (European Commission, 2002). Ten samples per product were collected from different sites, whereas the sub-samples were taken from different locations throughout the entire of each investigation site. For each sample, about 1 kg of each product was gathered, placed in sterile bags and transported to the laboratory where the samples were cleaned with distilled water, dried with paper towels, and stored at 4 °C.
A total of 36 samples of irrigation water samples were collected on a monthly basis for one year throughout 2018. Sampling was performed triplicated using 1 L amber glass bottle, acidified to pH 2 by adding hydrochloric acid (1 M) and stored at 4 °C.
Twenty soil samples were collected with a clean stainless-steel soil auger from the investigated sites at two depths, the upper zone (0–15 cm) and the lower zone (15–30 cm). Each sample was a composite of five sub-samples (four from corners and one from the center of the area) collected within a 100 m × 100 m plot and thoroughly mixed to form a homogeneous composite sample of approximately 500–1000 g. All the samples were placed in a dark sterile container protected from light, transported to the laboratory, and stored at 2 °C. All the collected samples of the soil, plant, and water were extracted within three days of collection to avoid PAHs degradation or contamination.
2.4 Sample preparation and PAHs extracting
2.4.1 Sample pre-treatment
The fruits were cleaned using Milli-Q ultrapure water. Citrus fruits were peeled to assess the concentration of PAHs in the flesh that is usually eaten. Each sample of fruits was homogenized using a high-speed blender to prepare a smooth purée which was kept at −20 °C until analysis. A one litter sample of the collected water was filtrated via vacuum filtration apparatus fitted with a 35–40 μm pore size membrane (Hahnemühle GmbH, Dassel, Germany), and transferred subsequently to a Solid Phase Extraction (SPE) system (Agilent Varian, Santa Clara, CA, USA) fitted with an Oasis HLB cartridge (Waters Corporation, Milford, MA, USA) that equipped with a vacuum pump. The soil samples were sieved (<2 mm) to ensure homogeneity of the materials, then kept in a solvent-cleaned glass jar, and stored at −20 °C until the performance of instrumental analysis (Al Nasir and Batarseh, 2008).
2.4.2 Extraction of PAHs from water
Before the passage of the water sample in the SPE stage, the cartridge was pre-conditioned prior to use, firstly washed with 6 mL of ethyl acetate, followed by 6 mL of methanol, and the final wash with 6 mL of acidified HPLC grade water at a flow rate of 1 mL min−1. Then, the sample was loaded to the cartridge at a 3 mL min−1. Subsequently, the cartridge was washed with 6 mL 5% methanol in water, and pre-dried under low pressure for 5 min to remove the excess of water. Finally, the retained compounds were eluted using two mL aliquots of ethyl acetate at a flow rate of 1 mL min−1. The collected extract was passed through a small column (2 g) of anhydrous sodium sulfate to remove the water traces and then concentrated to around 0.5 mL using a gentle stream of nitrogen, and the residue was transferred and stored in amber glass vials for analysis.
2.4.3 Extraction of PAHs from soil and fruits
The extraction of PAHs from soil and fruits samples was performed by solid-liquid extraction (SLE) as described by (Al Nasir and Batarseh, 2008). The wet homogenized samples containing 50 g of soil, or 100 g of fruit materials were placed into 500 mL Erlenmeyer flask. PAHs extraction was carried out with 100 mL of a 2:1 acetone/water (v/v) mixture for the soil (after being adjusted to its moisture content), while, for fruits with 100 mL of acetone. The samples were overnight shaking using a horizontal shaker at a velocity of 220 cycles/min. The liquid/liquid partitioning was performed by adding 15 g of NaCl and 100 mL cyclohexane, and shaken for 1 h. The organic layer containing analytes was decanted into a 250 mL Erlenmeyer flask and dried over 15 g of anhydrous sodium sulfate. The dry extract was rotary evaporated to 1 mL then to dryness using gentle stream of N2 gas and then redissolved in 3 mL of hexane. of the extract were evaporated and dissolved in 5 mL of 1:1 ethylacetate and cyclohexane mixture (v/v).
2.4.4 Samples cleanup
The residues from the extraction step were cleaned up using alumina column to eliminate the organic interference substances and to remove the color from the extracted samples which enhance the identification and quantitation of target analytes. Before starting this step, the extracted residues were micro-filtered using a polytetrafluoroethylene (PTFE) syringe, and concentrated by mean of the rotary evaporator to around 1 mL. The alumina was fully activated overnight at 180 °C inside laboratory oven (ULM 600 Memmert, Germany), then it was partly deactivated with 2.0% H2O and shake for 2 h using horizontal shaker (SSL1 Stuart, UK). The chromatographic column was packed with 10 g of deactivated alumina (70–230 mesh) then 2 g of dried anhydrous sodium sulfate was loaded to the top of the column, and washed sequentially with 40 mL n-hexane. The residue extract was transferred to the top of the alumina column and eluted with 50 mL of n-hexane, then the elute was evaporated and concentrated using a gentle nitrogen stream. Finally, the sample was divided into four portions each of 1 mL into amber vials for analysis.
2.5 Instrumental analysis
The chromatographic analysis of the 16 PAHs were carried out on a symmetric biphenyl column (4.6 mm × 250 mm, 5.0 μm diameter) using a high-performance liquid chromatography (HPLC) system (Agilent 1200) equipped with a diode array (DE64262847) and a fluorescence detector (DE90959767). Milli-Q ultrapure water (A) and acetonitrile (B) mixture were used as the mobile phases to optimize separation of the PAHs applying the following gradient elution with a flow rate of 1 mL min−1: 0–10 min, 40% A; 10–35 min, 10% A; 35–40 min, 0% A; 40–40.1 min, 40% A, and kept constant to 45 min. The injection volume was 20 µL and the temperature of the column oven was controlled at 35 °C. Blank samples were prepared to prevent and detect contamination during treatment operation. Detection was carried out with the fluorescence detector wavelength switching program at an excitation wavelength of 260, 260, and 260 nm, and emission wavelength of 352, 420, and 460 nm. The concentrations of the 16 US EPA priority PAHs (NAP, ACY, ACE, FLO, PHE, ANT, FLA, PYR, BaA, CHR, BbF, BkF, BaP, IcdP, DahA, BghiP) were determined in the current study according to the internal standards (Fig. 2).
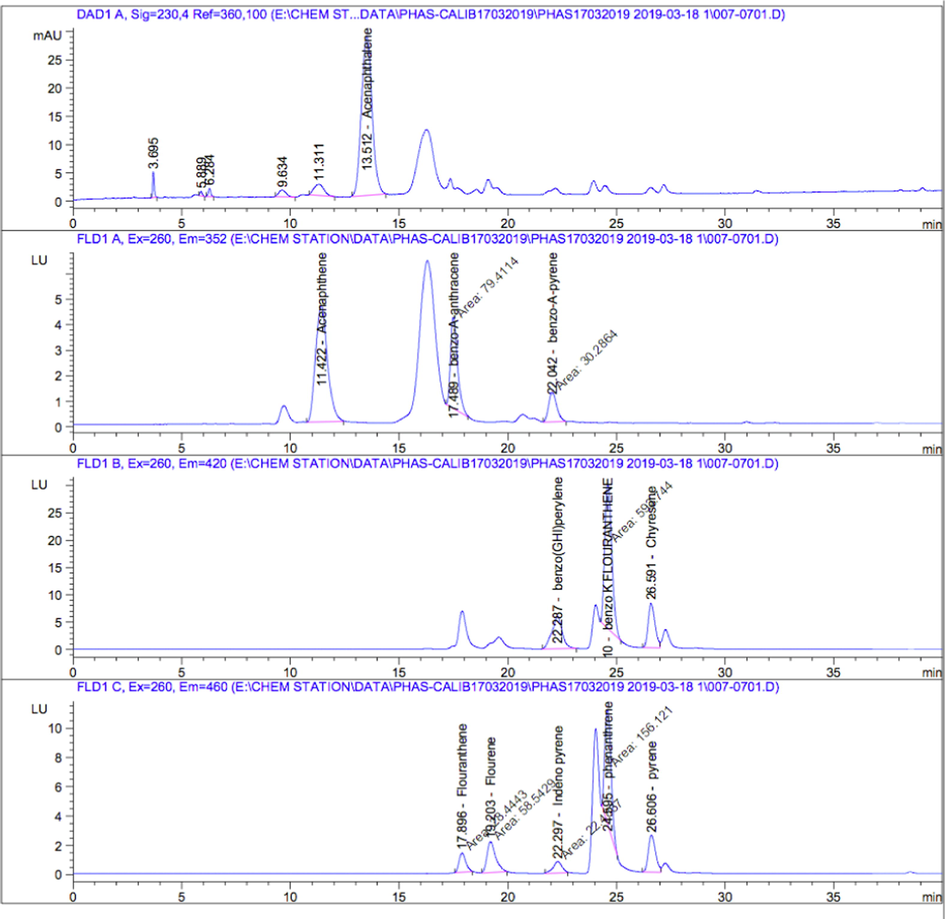
- HPLC chromatograms of PAHs standards.
2.6 Quality assurance and quality control
Method validation was evaluated by performing method blank, standard spiked recoveries, and determination of the HPLC detection limits. Before analysis, relevant standards containing all the analyte components were run to check column performance, peak height, resolution, the limits of detection (LOD), and the limit of quantitation (LOQ). Peak identification and quantification were done using an individual standard solution of each compound. The identification was accomplished using relative retention time techniques while quantification was done by comparison of peak areas of samples to those of standard solutions at known concentrations and using an external calibration method.
The LOD and LOQ for PAHs compounds were calculated based on a statistical method employing the concentrations of analytes in a sample gave rise to a peak with a signal-to-noise ratio (S/N) of 3 and 10, respectively (Pang et al., 2018). The LOD and LOQ were found to be ranged from 0.08 to 27.03 ng kg−1 and 0.27 to 89.20 ng kg−1 for the soil and plant samples, while, 0.05 to 3.96 ng l−1 and 0.17 to 13.15 ng l−1 for the water samples, respectively. The linearity of the calibration standards with R2 > 0.995 was considered to accept the calibration. In addition, the precision of the analytical procedures was expressed as relative standard deviation (RSD), where ±20% as RSD was the acceptable value (Gustavo González and Ángeles Herrador, 2007). The variation coefficients in the concentrations of different PAH between the duplicate samples were <10%.
Different recovery studies were performed employing 50 μg kg−1 level of each PAHs spiked with the fruit and soil samples, and 10 μg l−1 for the water sample, then the blank samples were also run. The mean recovery rates of the PAHs ranged between 79 and 107%, with RSD values ≤10. These analytical results were found in comparative agreement with other recovery rates reported for these compounds in different studies (Gratz et al., 2011; Kishikawa et al., 2003).
2.7 Bioconcentration factor (BCF)
The BCF is an index that shows the contaminant concentration in the plants with respect to its concentration in the soil substrate. BCF was calculated for various citrus fruit according to Rehman et al. (2017) using the Equation (1):
2.8 Estimates of cancer risk for PAHs
The ILCR via consuming contaminated fruits was calculated according to USEPA (2005),based on the relative Equation (2):
Total toxic BaP equivalent (TEQBap) for PAHs was computed using Equation (3):
2.9 Data analysis
PCA is a powerful multivariate analytical procedure that uses an orthogonal transformation to transform the primary set of data (measured PAH contents in soil) into a smaller set of linear combinations (principal components, PCs) that account for most of the variance of the original data to explain the relationship among the original variables. In this study, only major PCs having factor loadings higher than 0.5 were identified using Varimax rotation and eigenvalue >1. Each PCs was further evaluated and recognized by source markers or profiles as reasonable pollution sources according to the PAH source characterization in the literature. PCA was performed on concentration data from 13 PAHs. PHE, ANT, and DahA were excluded because of their rather lower detection frequencies in most of the soil samples. PCA was performed using SPSS 26.0 software.
3 Results and discussion
3.1 The PAHs levels in fruits
The concentrations of PAHs in the four types of peeled citrus fruits (orange, lemon, grapefruit, and mandarin) are summarized in Table 1. The results showed a significant difference in the accumulation and frequencies of PAHs in the analyzed samples, even within the same type of citrus fruit, which could be related to the physiological characteristics of the product rather than the similarity of the ecological characteristics at the sampling sites (Martorell et al., 2010). In total, among the analyzed PAHs, ACY (0.456–11.588 µg kg−1), BaA (0.225–5.553 µg kg−1), and BaP (0.004–18.585 µg kg−1) were the most dominant analytes present in all the analyzed samples, while, ANT was not detected in any sample. Our results suggested that the fruit samples were moderately contaminated, similar to other reports in Iran Iran (Khalili et al., 2021a), Korea (Lee et al., 2019), Spain (Martorell et al., 2010), and Brazil (Rojo Camargo and Toledo, 2003).
| NAP | ACY | ACE | FLO | PHE | ANT | FLA | PYR | BaA | CHR | BbF | BkF | BaP | IcdP | DahA | BghiP | Sum | ||
|---|---|---|---|---|---|---|---|---|---|---|---|---|---|---|---|---|---|---|
| Orange | Min | 0.095 | 0.456 | 0.763 | 0.156 | 0.007 | ND | 0.011 | 0.042 | 0.690 | ND | 0.063 | 0.007 | 0.004 | 0.087 | 0.074 | 0.031 | 2.486 |
| Max | 0.095 | 1.354 | 0.763 | 0.694 | 0.198 | ND | 0.011 | 0.123 | 1.159 | ND | 0.164 | 0.084 | 1.843 | 0.967 | 0.177 | 0.363 | 7.995 | |
| Mean | 0.095 | 0.905 | 0.763 | 0.347 | 0.061 | ND | 0.011 | 0.083 | 0.986 | ND | 0.114 | 0.029 | 1.060 | 0.345 | 0.126 | 0.157 | 5.082 | |
| Det% | 20 | 40 | 20 | 60 | 80 | ND | 20 | 40 | 100 | ND | 40 | 80 | 100 | 80 | 40 | 80 | NA | |
| Lemon | Min | ND | 5.007 | 10.689 | ND | ND | ND | ND | ND | 1.721 | ND | ND | ND | 1.556 | ND | ND | ND | 18.973 |
| Max | ND | 7.390 | 19.085 | ND | ND | ND | ND | ND | 2.869 | ND | ND | ND | 3.894 | ND | ND | ND | 33.238 | |
| Mean | ND | 6.199 | 13.843 | ND | ND | ND | ND | ND | 2.257 | ND | ND | ND | 2.541 | ND | ND | ND | 24.84 | |
| Det % | ND | 40 | 60 | ND | ND | ND | ND | ND | 80 | ND | ND | ND | 60 | ND | ND | ND | NA | |
| Grape Fruit | Min | ND | 20.658 | 19.831 | 1.509 | ND | ND | 2.407 | 1.070 | 0.225 | 0.066 | 0.090 | 0.014 | 0.823 | 5.368 | ND | 0.323 | 52.384 |
| Max | ND | 20.658 | 35.018 | 2.666 | ND | ND | 2.407 | 2.440 | 1.963 | 0.133 | 0.090 | 0.014 | 1.749 | 9.114 | ND | 0.323 | 76.575 | |
| Mean | ND | 20.658 | 26.218 | 1.928 | ND | ND | 2.407 | 1.777 | 0.895 | 0.100 | 0.090 | 0.014 | 1.362 | 6.821 | ND | 0.323 | 62.593 | |
| Det % | ND | 20 | 80 | 60 | ND | ND | 20 | 100 | 80 | 80 | 20 | 20 | 100 | 60 | ND | 20 | NA | |
| Mandarin | Min | 0.052 | 7.852 | ND | ND | 0.010 | ND | 0.154 | 0.030 | 2.208 | 0.033 | 0.182 | 0.006 | 2.316 | 0.051 | ND | 0.153 | 13.047 |
| Max | 0.325 | 11.588 | ND | ND | 0.010 | ND | 1.892 | 0.061 | 5.553 | 0.036 | 0.647 | 0.046 | 18.585 | 0.288 | ND | 0.780 | 39.811 | |
| Mean | 0.189 | 9.720 | ND | ND | 0.010 | ND | 0.762 | 0.044 | 3.532 | 0.035 | 0.316 | 0.022 | 7.742 | 0.163 | ND | 0.366 | 22.901 | |
| Det % | 50 | 50 | ND | ND | 25 | ND | 100 | 100 | 100 | 50 | 100 | 75 | 100 | 75 | ND | 100 | NA | |
The mean concentration of total PAHs content (ΣPAHs) in the citrus samples showed a decrease in the following order: grapefruit > lemon > mandarin > orange. A similar trend was reported for citrus fruits (grapefruit > tangerine > lemon > orange) marketed Tehran/Iran (Khalili et al., 2021a), and in citrus fruit juices produced in Brazil (Soceanu et al., 2011). The results of our study showed that the PAHs levels in fruits harvested from NDA in Jordan Valley are similar to that in Campinas / Brazil, while, they are lower than the reported results by Khalili et al,. in Tehran / Iran, which can be related to the cleaner irrigation water and the far industrial area from our study area comparing to the mentioned study (Khalili et al., 2021a),. A comparative assessment indicated that the PAHs levels in the peeled citrus fruits grown near NDA in the Jordan valley, namely, grapefruit (62.593 µg kg−1), mandarin (22.901 µg kg−1), lemon (24.840 µg kg−1), and orange (5.082 µg kg−1) are higher than those reported in the literature from other regions of the world. For instance, Soceanu et al. (2016), reported that the sums of 16 PAHs were 14.04 µg kg−1 in grapefruit, 9.50 µg kg−1 in mandarin, 11.01 µg kg−1 in lemon and 2.30 µg kg−1 in orange collected from Romania markets.
Moreover, as shown in Table 1, grapefruit showed the highest total PAHs concentration among the analysed citrus samples as its PAHs content ranged from 28.861 to 46.190 µg kg−1 with a mean concentration of 34.857 µg kg−1. >75% of the detected PAHs in grapefruit samples was attributed mainly to ACE which showed very high concentrations compared to other PAHS, ranging from 19.831 to 35.018 µg kg−1 with a mean value of 20.658 µg kg−1 in most of the analysed grapefruit samples (80% of the samples). Besides, ACY showed a high concentration in only one sample at 20.658 µg kg−1. A 50% of the LMW PAHs (NAP, PHE, and ANT) were not detected in all the grapefruit samples, which can be related to the higher volatility of these compounds (Marquès et al., 2016). In this context, it was reported that the initial concentration of naphthalene decreased around 30% in the presence of the UV light due to the photodegradation (Al-Madanat et al., 2020). For the HMW PAHs, BaP and IcdP were the dominant PAHs as BaP was detected in all the analysed grapefruit samples, whereas IcdP was found in 60% of the collected samples. The high concentration of HMW PAHs for grapefruit resulted from the deposition of particle bounded PAHs on the fruit and their uptake directly through the waxy cuticle of fruit (Jones et al., 1989).
For mandarin, the predominant detected PAHs in the analyzed samples were FLA, PYR, BaA, BbF, and BaP, which were found in all analysed mandarin samples. ACY was the major detected PAH as its concentration ranged from 7.852 to 11.588 µg kg−1 with a mean value of 9.720 µg kg−1. BaP, which is used as a marker for the occurrence and the effect of carcinogenic PAH in food based on a scientific opinion of the former Scientific Committee on Food (SCF) (Zelinkova and Wenzl, 2015), showed a wide range of concentrations as it ranged from 2.316 to 18.585 µg kg−1 with a mean concentration of 7.742 µg kg−1. In the case of orange, all analyzed PAHs were detected at different detection ratios except ANT and CHR. Among the carcinogenic PAHs (BaA, CHR, BbF, BkF, BaP, IcdP, DahA and BghiP), BaA and BaP as the most carcinogens PAHs were detected in all analyzed orange samples and exhibited the highest mean concentrations with a mean value of 0.986 µg kg−1 and 1.060 µg kg−1, respectively. A recent investigation by Lee et al. showed that the mean concentration of the eight carcinogenic PAHs in commercial orange samples collected from Seoul, Korea was found to be 0.33 ± 0.02 µg kg−1, which is much lower than their concentrations in the presented study (Lee et al., 2019).
For lemon, only four of the congeners were found in 40–80% of the samples with wide ranges of concentrations as follows ACY (5.007–7.390 µg kg−1), ACE (10.689–19.085 µg kg−1), BaA (1.721–2.869 µg kg−1) and BaP (1.556–3.894 µg kg−1). The total PAHs concentration was much higher in lemon than in orange fruit as their total concentration ranged from 18.973 to 33.238 µg kg−1 with a mean value of 24.840 µg kg−1. The highest concentration of the LMW PAHs that was detected in lemon samples compared to the HMW PAHs can be related to theirhigher solubility and entery to the pulp of the lemon through the gaseous form. However, the addition of lemon juice to barbecue products reduces the risk of PAHs in these products (Chen et al., 2018a).
Although grapefruit showed the highest PAHs concentration, it has the lowest carcinogenic content. The percentage of the carcinogenic PAHs to total PAHs was found to be the lowest in grapefruit (27%) and the highest in orange (83%) that showed the lowest PAHs content. The PAHs in the studied area are recent as indicated by the predominance of PAHs with fewer rings (≤3) and by the high variation in their concentrations on the same site (Cai et al., 2007a). Authors showed that further, two- and three-rings PAH compounds have a higher solubility in water than other PAH compounds and therefore have a relatively higher uptake by plants (Khalili et al., 2021a). Due to their bioavailability, two- and three-ring compounds are predominant among PAHs compared to other compounds, including relatively high solubility in water, and therefore have better uptake into plants (vegetables and fruits).
Comparing with vegetables and fruits, other crops could also contain a high amount of PAHs such as coffee and tea as nutritive elements consumed daily. Roudbari et al. (2021) showed that significant differences were observed in NAP, FLA, CHY, BaP among tea and coffee. However, mean of all PAH compounds in the coffee had the highest value. Among all PAHs, NAP had the highest mean in the samples, and it was found in coffee (6.39 ± 1.23 μg kg−1) and in tea (2.72 ± 0.66 μg kg−1). The lowest mean PAH concentrations in all samples belonged to ACE, ACY, FLO, PHE, ANT, PYR, BaA, BbF, BkF IcdP, DahA, and BghiP. Iwegbue et al. (2015) showed that the concentrations of the sum of the 16 PAHs in the cocoa-based food, coffee, and tea beverages ranged from 38.0 to 1406.4, 38.7 to 593.1, and 5.2 to 913.1 μg kg−1, respectively. As reported by Roudbari et al. (2021) the actual target hazard quotient (THQ) for the adult and children was equal to 1.63 × 10⁻⁴ and 1.67 × 10⁻⁴, respectively; hence, non-carcinogenic health risk for consumers is negligible.
Like vegetables, fruits, coffee and tea; cereal could contain high amount of PAHs; Khalili et al. (2022) revealed that the means of total PAHs were 98.2, 121.7, 134.9, 166.3, 176.3, 176.2, 130.1, and 248.3 μg kg−1, respectively for many kinds of bread (Barbari, Sangak, Baguette, Taftoon, Lavash), macaroni, lasagna, and cooked rice. During this study the authors showed that ILCR indexes in cereals were estimated to be 5.2 × 10⁻⁵ and 7.73 × 10⁻⁵, respectively, which were higher than the acceptable risk level (10−6).
3.2 PAHs in soil
The concentrations of the analyzed PAHs in the soil at two depths are shown in Table 2. Although the sampling sites are not far from each other, the PAHs concentrations are highly variable within the different locations. Despite the hot climatic condition in the study area, NAP and ACE were found at higher concentrations than many other HMW PAHs. Besides, individuial ΣLMW-PAHs (10.025 μg kg−1) and ΣHMW-PAHs (11.496 μg kg−1) in the surface (upper) layer of soil showed close values from both species. This can be attributed to the recent and continuous irrigation that frequently increase the levels of these compounds in the studied area (Li et al., 2008) and the strong adsorption of the LMW PAHs to the soil organic matter, thus reducing its losses by volatilization (Li et al., 2010). However, in the case of the lower depth, the HMW PAHs constitute the majority of PAHs in soil samples with a mean concentration of 13.191 μg kg−1 comparing to 4.536 μg kg−1 for the LMW PAHs, which can be related to their less mobility and the very low photodegradation rate (Al-Madanat et al., 2021), lower intake by plants, and the higher biodegradation rate of the low ring by the soil bacteria than high ring PAHs (Bossert et al., 1984).
| NAP | ACY | ACE | FLO | PHE | ANT | FLA | PYR | BaA | CHR | BbF | BkF | BaP | IcdP | DahA | BghiP | Sum | ||
|---|---|---|---|---|---|---|---|---|---|---|---|---|---|---|---|---|---|---|
| Site B (U) | Min | 0.117 | 3.136 | 1.013 | 0.094 | 0.012 | ND | 0.325 | 0.230 | 1.433 | 0.040 | 0.205 | 0.017 | 3.372 | 0.209 | 0.124 | 0.095 | 10.422 |
| Max | 7.199 | 3.136 | 7.948 | 0.404 | 0.012 | ND | 0.822 | 2.246 | 3.857 | 0.435 | 0.792 | 0.044 | 10.376 | 0.799 | 0.24 | 0.602 | 38.912 | |
| Mean | 2.174 | 3.136 | 4.481 | 0.222 | 0.012 | ND | 0.543 | 0.792 | 2.275 | 0.264 | 0.414 | 0.025 | 6.226 | 0.509 | 0.124 | 0.324 | 21.521 | |
| Det % | 100 | 17 | 33 | 88 | 17 | ND | 66 | 100 | 100 | 50 | 66 | 66 | 100 | 88 | 17 | 66 | ||
| Site B (L) | Min | 0.043 | 1.758 | ND | 0.200 | ND | ND | 0.079 | 0.055 | 0.347 | 0.049 | 0.113 | 0.013 | 0.739 | 0.047 | ND | 0.049 | 3.492 |
| Max | 7.189 | 3.136 | ND | 0.359 | ND | ND | 0.944 | 0.749 | 5.916 | 0.435 | 0.536 | 0.04 | 15.807 | 1.030 | ND | 1.274 | 37.415 | |
| Mean | 1.81 | 2.447 | ND | 0.279 | ND | ND | 0.521 | 0.476 | 2.727 | 0.10 | 0.342 | 0.028 | 8.072 | 0.491 | ND | 0.434 | 17.727 | |
| Det % | 88 | 50 | ND | 33 | ND | ND | 88 | 100 | 10 | 50 | 33 | 33 | 100 | 88 | ND | 66 | ||
In Jordan, the content of PAHs in soils is not yet regulated, and just a couple of guidelines exists worldwide. One of them is soil contamination criteria on the basis of the ∑16PAHs was defined by Maliszewska-Kordybach (1996), to evaluate the level of soil contamination by PAHs as follows: not contaminated soil (Σ16PAHs ≤ 200 μg kg−1), slightly contaminated soil (200 < Σ16PAHs ≤ 600 μg kg− 1), weakly contaminated (600 < Σ16PAHs ≤ 1000 μg kg−1), and heavily contaminated soil (Σ16PAHs > 1000 μg kg−1). According to this classification system, the agricultural field soil was considered as “not contaminated soil” (∑16PAHs ≤ 200 µg kg−1). The other classification was suggested by the Canadian Council of Ministers of the Environment and included three major classes, specifically, class A, or clean soil when the concentration of BaP is less than 100 µg kg−1; class B, or slightly polluted soil when the concentration of BaP is less than 1000 µg kg−1 (further investigation is required); and class C, or seriously polluted soil when the concentration of BaP is up to 10000 µg kg−1 (immediate remediation is needed) (CCME, 1991). According to this classification, the agricultural soils in Jordan valley-Jordan can be considered as a clean soil.
In order to clearly understand and evaluate the quality of the agricultural soils near NDA in Jordan valley, the ∑ 16PAH levels in this study were compared with the concentrations reported around the world in agricultural soils (Table 3). The concentration level of ∑16PAHs in the studied soil was significantly lower than most of the reported values for agricultural soils in Iran, Estonia, USA, Lebanon, Germany, UK, Brazil, Japan, and the USA, as well as in most places in China (Table 3), except Lishui and Henan in China, as well as Canada. Observed ∑16PAHs concentrations in the study were much lower than the typical concentration (200 µg kg−1) described for the sum of 16 EPA PAHs in arable soils (Wilcke, 2000). These comparisons indicated that the agricultural soil near NDA in the Jordan valley was slightly contaminated with PAHs compared with agricultural soil in other parts of the world.
| Location | ΣPAHs (mean) (µg kg−1) |
No. of PAHs | Depth (cm) | References |
|---|---|---|---|---|
| King Talal Dam (KTD), Jordan valley, Jordan | 25.01 | 16 | 0–30 | This study |
| Lishui, China | 10.95 | 16 | 0–20 | (Hu et al., 2009) |
| Japan | 320.00 | 16 | 0–15 | (Honda et al., 2007) |
| Uberlândia, Brazil | 96.00 | 20 | 0–20 | (Wilcke et al., 1999) |
| UK | 190.00 | 12 | -a | (Wild and Jones, 1995) |
| Germany | 1900.00 | 6 | -a | (Tebaay et al., 1993) |
| Dalian, China | 223.00 | 14 | 0–5 | (Wang et al., 2007) |
| Henan, China | 24.40 | 15 | 0–15 | (Feng et al., 2017) |
| Canada | 16.00 | 16 | -a | (Choi et al., 2009) |
| Nabatiyeh, Lebanon | 33.50 | 17 | 0–100 | (Soukarieh et al., 2018) |
| Estonian | 100.00 | 12 | 0–10 | (Trapido, 1999) |
| Great Plains, USA | 142.00 | 20 | 0–10 | (Wilcke and Amelung, 2000) |
| Ahvaz, Iran | 59.80 | 16 | 0–20 | (Bahrami et al., 2021) |
3.3 PAHs in irrigation water
The concentration of individual PAHs detected in irrigation water samples collected from the investigated fields is summarized in Table 4. Six PAHs mostly of heavy type (HMW) were detected in all irrigation water samples (FLA, BaA, BbF, BaP, IcdP, and BghiP) comprising more than 93% of the detected PAHs concentrations, Although the recovery experiment was able to detect all 16 PAHs, other types of PAHs (NAP, FLO, PHE, ANT) were not detected in all samples. BkF was detected in 75% of the samples, PYR in 50% of the sample and (ACY, ACE, CHR, and DahA) in only 25% of the analysed samples. The total concentrations of the detected PAHs ranged from 0.089 to 0.224 μg L−1 with a mean value of 0.193 μg L−1. The dominant PAHs were the most carcinogenic compounds, BaA and BaP, however, they were found at low concentrations.These concentration values are much higher than PAHs content of the same source that were reported by Jiries et al., in 2004 (Jiries et al., 2004). In a similar study, Li et al., determined 15 priority PAHs in water, sediment, soil, and plant samples collected from Aojiang River and its estuary. The authors found that the ∑ 15 PAHs ranged from 0.910 to 1.520 μg L−1 in water samples, which is higher than the presented reported values. A comparison study by Tahboub et al., for the Semi-volatile organic pollutants (including the PAHs) in Jordanian surface water reveals that Semi-volatile organic pollutants of surface water in Jordan are within the acceptable international limits, which is become with agreement with our results in this study (Tahboub et al., 2017).
| Irrigation water | NAP | ACY | ACE | FLO | PHE | ANT | FLA | PYR | BaA | CHR | BbF | BkF | BaP | IcdP | DahA | BghiP | Sum | |
| Min | ND | ND | ND | ND | ND | ND | 0.003 | 0.001 | 0.041 | ND | 0.001 | 0.001 | 0.035 | 0.005 | ND | 0.002 | 0.089 | |
| Max | ND | 0.025 | 0.006 | ND | ND | ND | 0.014 | 0.002 | 0.057 | 0.002 | 0.011 | 0.001 | 0.087 | 0.008 | 0.002 | 0.009 | 0.224 | |
| Mean | ND | 0.025 | 0.006 | ND | ND | ND | 0.008 | 0.019 | 0.049 | 0.002 | 0.013 | 0.001 | 0.054 | 0.007 | 0.002 | 0.007 | 0.193 | |
| Det % | 0 | 25 | 25 | 0 | 0 | 0 | 100 | 50 | 100 | 25 | 100 | 75 | 100 | 100 | 25 | 100 |
Based on the higher content of LMW PAHs in citrus fruits compared to their concentration in irrigation water, it seems that the quality of irrigation water has a low impact on the PAHs content in the citrus fruit, where we observed the prevalence of ACY and ACE prevalent in very high concentrations in some kinds of fruit such as lemon, grapefruit and mandarin. The easiest uptake of LMW PAHs by plant can be related to the great mobility of these compounds in air and soil and their higher water solubility compared to heavy PAHs (Paris et al., 2018).
3.4 Identification of PAHs sources in agricultural soil
The identification of PAHs sources in the soil is an important procedure in terms of risk management and pollution control. The PAHs molecular diagnostic ratios are considered a classical method used as a tool for identifying and assessing the pollution emission sources. Isomeric ratios of PAH species cannot create quantitative results. However, PCA is applied in soil source apportionment of PAHs with increasing frequency. Combined with PAH diagnostic ratios, PCA technique can present more accurate results regarding the possible sources of PAHs (Tobiszewski and Namieśnik, 2012).
3.4.1 Identifying PAHs sources using diagnostic ratios
PAH isomer ratios have been long used by environmental researchers as a technique for source identification of PAHs in different environmental matrices (Bahrami et al., 2021; Deelaman et al., 2020; Kalteh et al., 2020). The ratios of different PAHs are anticipated to differ with sources, most likely due to different paths of PAH formation under different combustion circumstances (Tobiszewski and Namieśnik, 2012). In this study, to distinguish the possible emission sources of PAHs in soil and citrus fruits, isomeric ratios of FLA/(FLA + PYR), LMW/HMW, IcdP/(IcdP + BghiP), BaA/(BaA + CHR), (BaP/BghiP), (∑COMB/∑16PAHs), (FLA/PYR), and BaP/(BaP + CHR) were applied (Fig. 3).
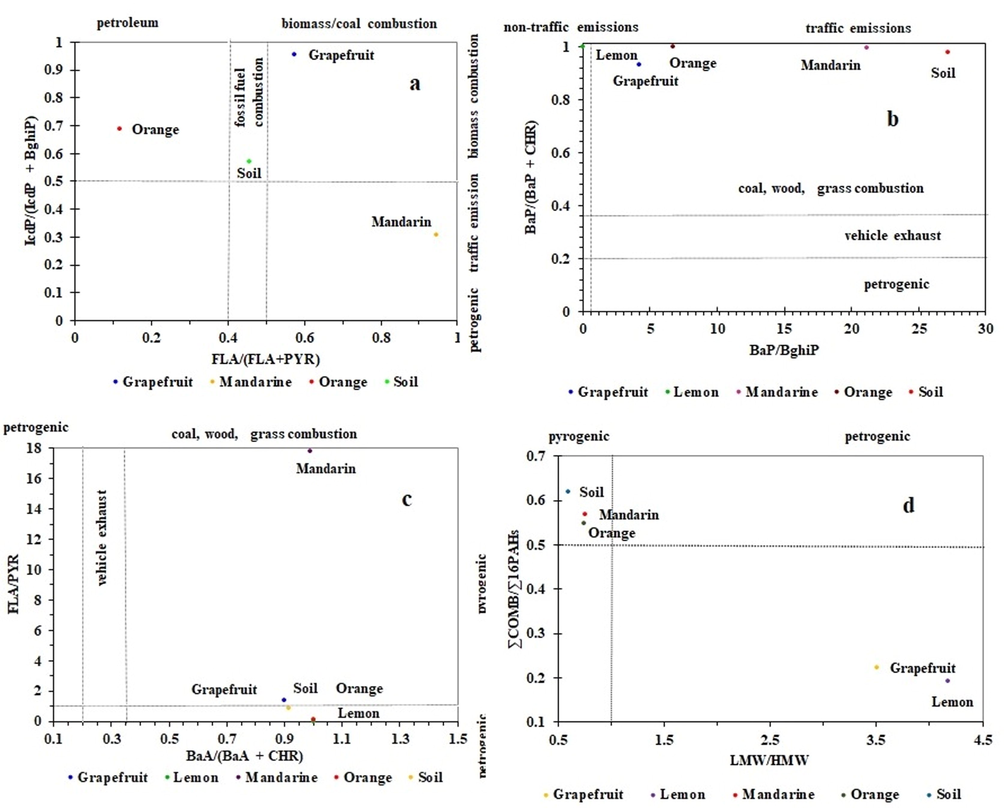
- Cross plots for the isomeric ratios of: (a) FLA/(FLA + PYR) vs. IcdP/(IcdP + BghiP), (b) BaP/BghiP vs. BaP/(BaP + CHR), (c) BaA/(BaA + CHR) vs. FLA/PYR, (d) LMW/HMW vs. ∑COMB/∑16PAHs in soil and Citrus fruits of NDA in the Jordan valley, Jordan.
In general, LMW/HMW ratios >1 indicates that the source is petrogenic, such as fuel or light refined petroleum products, whereas LMW/ HMW ratios <1 indicates a pyrogenic source such as coal, grass, and combustion of wood (Zhang et al., 2008). In the present study, the range of LMW/HMW for soil and citrus fruits was 0.60 – 4.18. The LMW/HMW ratios for soil, mandarin, and orange were less than 1 (Fig. 3), while grapefruit and lemon had ratios higher than 1. The ratios suggest a pyrogenic source for soil, mandarin and orange, whereas, a petrogenic source for grapefruit and lemon. In the case of FLA/(FLA + PYR) ratio: a value <0.4 is an indication of petroleum emission, a value between 0.4 and 0.5 range implies liquid fossil fuel (crude oil and vehicle) combustion, and a value >0.5 indicates biomass/coal combustion as the potential source (Yunker et al., 2002). Based on our results, the FLA/(FLA + PYR) ratio values range between 0.12 and 0.95 according to the citrus fruits type. In orange, the FLA/(FLA + PYR) ratio was <0.4, indicating petroleum emission. In mandarin and grapefruit, the values were >0.5 displaying biomass combustion, whereas, in soil, it is between 0.4 and 0.5 linking the emission to liquid fossil fuel combustion sources.
The FLA/PYR ratio >1 indicates a pyrogenic source, while that <1 is a characteristic of a petrogenic source (Sojinu et al., 2010). According to Yunker et al. (2002), the ratio IcdP/(IcdP + BghiP) <0.2 is recognized as an indication of a petroleum and petrogenic source; 0.2–0.5 indicates liquid fossil fuel combustion (mobile sources associated with vehicular) and >0.5 as biomass or coal combustion. In this study, the IcdP/(IcdP + BghiP) ratio value for mandarin was between 0.2 and 0.5 implies traffic emission source and for orange, grapefruit, and soil were >0.5 indicating biomass combustion source.
The BaA/(BaA + CHR) ratio <0.2 implies a petrogenic (petroleum) origin, while 0.2–0.35 indicates petroleum combustion (particularly liquid fossil fuel, vehicle, and crude oil), and >0.35 implies combustion of coal, grass, and wood (Akyüz and Çabuk, 2010). In addition, BaP/(BaP + CHR) ratio <0.20 suggests a petrogenic origin, while 0.2–0.35 suggests a vehicular and combustion source, and >0.35 implies coal, wood, and grass combustion source (Akyüz and Çabuk, 2008). However, the ratio of BaP/BghiP <0.6 implies non-traffic emissions, while >0.6 implies traffic emissions (Katsoyiannis et al., 2007). The BaA/(BaA + CHR) ratio for soil and citrus fruits (mandarin, orange, grapefruit, and lemon) was >0.35 suggesting that PAHs in the agricultural soil and citrus fruits resulted from wood and grass combustion. The ratio FLA/PYR was found to be 0.84 and 0.13 for soil and orange, respectively indicating the petrogenic origin of PAHs, while for mandarin and grapefruit the ratio was 17.80 and 1.35, respectively, suggesting pyrogenic source. Apparently, the use of kerosene as a herbicide is the reason for the observed petrogenic origin (Bahrami et al., 2021). In orange, grapefruit, mandarin, and agriculture soil, the BaP/BghiP ratio values were >0.6 indicating traffic emissions source. However, in orange, grapefruit, mandarin, lemon, and agriculture soil, BaP/(BaP + CHR) ratio values were >0.35 indicating combustion of biomass as a possible source.
PAH emissions from combustion during the pyrogenic process can be represented by combustion PAH species (∑COMB the sum of major combustion specific compounds including FLA, PYR, BaA, CHR, BbF, BkF, BaP, BghiP, and IcdP) and ratios of ∑COMB/∑16PAHs >0.50 indicates PAHs originated from combustion activities (Fu et al., 2009). The ratios of ∑COMB/∑16PAHs for soil, mandarin, and orange were 0.62, 0.57, and 0.55, respectively, which indicate that extensive combustion activities affected the PAHs in soils, mandarin and orange.
All diagnostic ratios above indicated that the sources of PAHs in soil and citrus fruits were mainly derived from the petrogenic origin, traffic emissions source, and biomass combustion.
3.4.2 Source identification by PCA
In spite of the fact that molecular diagnostic ratios have been extensively used in the source apportionment of PAHs, they have some uncertainty and limitation. Consequently, the PCA was used to improve the accuracy of the source identification and quantitatively identify the sources of PAHs. PCA has been considered to be an effective tool applied for the determination of the probable source of PAHs in soil (Yin et al. 2008; Yuan et al. 2014). The results of the PCA analysis of PAH concentrations are presented in Table 5. The PCA analysis extracted two principal components (PC1 and PC2) and explained 91.50% of the total variables.
| PAHs | Principle component (PC) | |
|---|---|---|
| PC 1 | PC 2 | |
| NAP | 0.95 | 0.37 |
| ACY | 0.84 | 0.43 |
| ACE | 0.88 | 0.18 |
| FLO | 0.85 | 0.19 |
| FLA | 0.71 | 0.20 |
| PYR | 0.88 | 0.18 |
| BaA | 0.35 | 0.60 |
| CHR | 0.39 | 0.91 |
| BbF | 0.13 | 0.57 |
| BkF | 0.42 | 0.88 |
| BaP | 0.25 | 0.56 |
| IcdP | 0.42 | 0.79 |
| BghiP | 0.25 | 0.83 |
| Variance (%) | 62.72 | 28.78 |
| Cumulative (%) | 62.72 | 91.50 |
| Possible source | biomass burning | vehicular emissions |
Bold number: Loading value>0.5 (heavy loading).
PC1 explained 62.72% of the total variance and was dominated by NAP (0.95), ACY (0.84), ACE (0.88), FLO (0.85), FLA (0.71), and PYR (0.88). It was concluded that low-temperature circumstances throughout open burning of biomass result in incomplete combustion and is distinguished by low molecular PAHs (NAP, ACE, ACY, FLO, and FLA) (Feng et al., 2014; Jenkins et al., 1996). In addition, PYR is often associated with the low-temperature pyrogenic processes, such as grass or wood-burning (Jiang et al., 2014). Therefore, PC1 reflected that these species were primarily derived from biomass burning origin. This is underscored by the fact that open burning of biomass (especially agricultural residue waste) is a common practice by the farmers in the studied area as they burn agricultural residues to save the crops against frost during many cold winter nights.
In contrast, PC2 explained 28.78% of the total variance and was loaded by BaA (0.60), CHR (0.91), BbF (0.57), BkF (0.88), BaP (0.56), IcdP (0.79), and BghiP (0.83). According to the literature (Liu et al. 2009), IcdP and BghiP were associated with diesel and gasoline-powered vehicles, while BkF and its isomers (BbF and BaP) are related to diesel-powered vehicles (Sharma et al. 2007). According to Rogge et al. (1993) and Jiang et al. (2009), BaA and CHR are originated from the combustion of diesel fuel. Consequently, PC2 reflected the source of vehicular emissions, which might be resulted from the use of tractors and generators in agricultural activities. In addition, agricultural soils are subjected to accidental inputs of diesel, which is regularly used in tractors and generators.
Overall, the PCA results led to the conclusion that PAHs concentrations in agriculture soil near NDA in the Jordan valley, mainly come from biomass burning and vehicular emissions.
3.5 PAHs transfer from soil to fruit
Generally, a soil-to-plant transfer is possible but contamination of citrus fruits through the air by PAHs volatilization from soil can be also a possible way of contamination, which has to be taken into consideration (Chen et al., 2018a,b). The BCF was calculated for individual PAHs in citrus fruit samples (Table 6) to determine the relative uptake of PAHs by the citrus fruit with respect to soil. Different citrus fruits showed different BCF values for PAHs, depending on the nature of PAH compounds, physiology of the plants, and characteristics of soil (Trapp and Legind, 2011).
| 16 PAHs | number rings | BCF Mandarine | BCF Grapefruit | BCF Lemon | BCF Orange |
|---|---|---|---|---|---|
| Naphthalene (NAP) | 2-rings | 0.09 | ND | ND | 0.05 |
| Acenaphthylene (ACY) | 3-rings | 3.63 | 7.72 | 2.32 | 0.34 |
| Acenaphthene (ACE) | 3-rings | ND | 5.85 | 3.09 | 0.17 |
| Fluorene (FLO) | 3-rings | ND | 6.07 | ND | 1.46 |
| Phenanthrene (PHE) | 3-rings | 0.81 | ND | ND | 4.94 |
| Anthracene (ANT) | 3-rings | ND | ND | ND | ND |
| Fluoranthene (FLA) | 4-rings | 1.47 | 4.54 | ND | 0.02 |
| Pyrene (PYR) | 4-rings | 0.07 | 2.80 | ND | 0.13 |
| Benzo[a]anthracene (BaA) | 4-rings | 1.41 | 0.36 | 0.90 | 0.39 |
| Chrysene (CHR) | 4-rings | 0.15 | 0.44 | ND | ND |
| Benzo[b]fluoranthene (BbF) | 5-rings | 0.84 | 0.24 | ND | 0.30 |
| Benzo[k]fluoranthene (BkF) | 5-rings | 0.85 | 0.53 | ND | 1.08 |
| Benzo[a]pyrene (BaP) | 5-rings | 0.75 | 0.13 | 0.25 | 0.10 |
| Indeno[1.2.3.4.cd]pyrene (IcdP) | 6-rings | 0.33 | 13.65 | ND | 0.69 |
| Dibenzo[a.h]anthracene (DahA) | 6-rings | ND | ND | ND | 1.01 |
| Benzo[g.h.i]perylene (BghiP) | 6-rings | 0.97 | 0.85 | ND | 0.41 |
| ∑16 PAHs | 0.92 | 2.48 | 0.99 | 0.20 | |
| ∑LMW-PAHs | 1.05 | 5.14 | 2.13 | 0.23 | |
| ∑HMW-PAHs | 0.83 | 0.88 | 0.31 | 0.19 | |
∑ Low molecular weight PAHs (LMW-PAHs) = two- to three-ring PAHs.
∑High molecular weight PAHs (HMW-PAHs) = four- to six-ring PAHs.
ND = not detected.
The grapefruit showed the highest BCF value (2.48) for ∑16 PAHs, followed by lemon (0.99), mandarine (0.92), and orange (0.20). Among the individual PAHs, the highest BCF was observed for IcdP (13.65), ACY (7.72), FLO (6.07), and ACE (5.85) in grapefruit followed by PHE (4.94) in orange, FLA (4.54) in grapefruit, ACY (3.63) in mandarine, ACE (3.09) and ACY (2.32) in lemon. Mostly, BCF values decrease with increasing ring numbers. The BCF value of LMW PAHs was higher than HMW PAHs. The uptake rate and availability of PAHs decline with increasing the number of benzene rings (Fismes et al., 2002). In our study, the results of BCF denoted that LMW PAHs have tremendous mobility. The BCF increases with the reduction of octanol/water partition coefficient and rise of PAHs solubility in water (Kipopoulou et al., 1999).
BCF value >1 denotes that the citrus fruit is an accumulator for the particular PAHs. It is obvious from the Table, that the studied citrus fruit behaves as an accumulator for ACY, ACE, FLO, PHE, FLA, PYR, BaA, BkF, IcdP, and DahA. However, grapefruit proved to be hyper-accumulators of IcdP (13.65), ACY (7.72), FLO (6.07), ACE (5.85), and FLA (4.54), respectively. The crop type has a very large effect on uptake processes, e.g. tree fruits are not in close contact with soil. As a result, in tree fruits, the accumulation of PAHs by uptake directly from the air is higher, whereas the accumulation of PAHs from soil is much lower (Trapp and Legind, 2011).
3.6 The incremental lifetime cancer risk of PAHs
Exposure to PAHs and bioaccumulation of PAHs in human bodies via food intake is recognized to pose increased risks to human health (Famiyeh et al., 2021). Various studies (e.g. Qi et al. 2019) revealed that exposure to PAHs could increase ILCR in humans. Anyway, the potentiality of PAHs to create a specific health problem largely depends on the vulnerability of individuals (Famiyeh et al., 2021). In this study, ILCR for PAHs was computed to assess potential carcinogenic risk to the inhabitants from PAHs exposure via citrus fruits consumption.
In terms of US-EPA standard, ILCR lower than 10−6 is considered to be an acceptable or negligible risk, ILCRs between 10−6 and 10−4 indicate potential risk, and ILCRs>10−4 denote a serious high cancer risk (USEPA, 1996). In this study, the ILCR for PAH dietary exposure was 6.99 × 10⁻⁶, 4.36 × 10⁻⁵, 3.66 × 10⁻⁶, and 2.56 × 10⁻⁶, for mandarin, grapefruit, lemon, and orange, respectively. The results of this study suggested a serious potential cancer risk related to lemon, orange, grapefruit, and mandarin consumption therefore, more attention should be paid to citrus fruits. Long-term exposure to PAHs could result in thier accumulation in human tissues, because PAHs are lipophilic and have long biological half-lives (Kim et al., 2013). It was found that the cumulative ILCR for PAH dietary exposure through four citrus fruits (lemon, orange, grapefruit, and mandarin) investigated in this study was 5.68 × 10⁻⁵. Ingestion of the chosen citrus fruits in the study area appears to pose a potential risk of cancer in regards to PAHs. Societal risk was calculated by multiplying the ILCR with Jordan’s current population number (10 million) and it was found that 56 extra cases of cancer are likely for lifetime ingestion exposure of the four chosen citrus fruits in Jordan.
The probabilistic health risk in vegetables and fruits samples of Tehran city, Iran, was evaluated by Khalili et al. (2021a) showed that the sum of 16 PAHs in vegetables were about 104.7 to 314.9 μg kg−1; with the highest PAH levels corresponded to acenaphthene (135.1 ± 7.1 μg kg−1) and naphthalene (114.1 ± 5 μg kg−1), wherease the sum of 8 PAHs in vegetables were from ND to 12.6 μg kg−1. Moreover, the authors showed that the highest ILCR in the four groups of samples belonged to fruits (4.3 × 10⁻⁴) and root vegetables (1.6 × 10⁻⁴) while the lowest was found in cabbage (3.5 × 10⁻⁷). However the mean of incremental lifetime cancer risk (ILCR) in vegetables and fruits according to are 5.20 × 10⁻⁵ and 7.70 × 10⁻⁵, which are higher than the acceptable risk level (10−6).
On other hand, the WHO Expert Committee of Food Additives, (2005) reported an average BaP intake of 0.004 μg kg−1b.W/Day corresponding to a daily intake of 0.23 μg per person (WHO Expert Committee of Food Additives, 2005). By Tehran Citizens, the higher ED value of PAHs among the consumed vegetable were in tomato (3378), potato (1251) and onion (6 3 9). Moreover, the lower ED values of PAH among the consumed vegetables were in radish (0.5), Spinach (6) and turnip (9.4) μg kg−1 per day.
4 Conclusion
The present study is the first comprehensive study to provided information about PAHs residue in four types of peeled citrus fruits (lemon, orange, grapefruit, and mandarin) grown near NDA in the Jordan valley, Jordan. Results showed that all samples contained PAHs at various amounts and frequencies. Since all the citrus fruits were grown up in the same environmental conditions and fed from the same water resources, differences in total PAHs content in these fruits such as grapefruit (highest) and orange (lowest) lead to conclude that citrus kind is the main factor governing the content of PAHs in the fruit. The isomer ratios reveal that the main sources of PAH contamination in soil and citrus fruits were mainly derived from the petrogenic origin, traffic emissions source, and biomass combustion. Based on the source identification by PCA, it was inferred that the PAHs in the agriculture soil samples originated mainly from biomass burning and vehicular emissions. ILCR indicated that PAHs in lemon, orange, grapefruit, and mandarin pose a potential cancer risk to human body health through exposure to PAHs in these fruits. Finally, incremental cancer risk assessment revealed that up to 56 excess cancer cases are expected in Jordan due to lifetime ingestion exposure to PAHs at their detected concentrations. Thus, the carcinogenic risk of PAHs caused by eating citrus fruits grown in this contaminated environment requires more attention from the local authorities and policymakers. Further, several precautions should be applied, including routine measurements of the contamination levels in different fruit samples, and holding workshops to educate farmers about the riskiness of these compounds, the ways they contaminate their crops, and how to eliminate or reduce the sources of these persistent organic pollutants.
Acknowledgement
The authors gratefully acknowledge the Scientific Research and Innovation Support Fund (SRISF), Amman, Jordan, for research funding, project number: WE/2/6/2015. The publication of this article was funded by the Open Access Publishing Fund of Leibniz Universität Hannover.
References
- A review on polycyclic aromatic hydrocarbons: Source, environmental impact, effect on human health and remediation. Egypt. J. Pet.. 2016;25:107-123.
- [CrossRef] [Google Scholar]
- Levels of polycyclic aromatic hydrocarbons (PAHS) in some Egyptian vegetables and fruits and their influences by some treatments. Int. J. Curr. Microbiol. App. Sci.. 2014;3:277-293.
- [Google Scholar]
- Gas–particle partitioning and seasonal variation of polycyclic aromatic hydrocarbons in the atmosphere of Zonguldak, Turkey. Sci. Total Environ.. 2010;408:5550-5558.
- [CrossRef] [Google Scholar]
- Particle-associated polycyclic aromatic hydrocarbons in the atmospheric environment of Zonguldak, Turkey. Sci. Total Environ.. 2008;405:62-70.
- [CrossRef] [Google Scholar]
- Mechanistic Insights into Hydrogen Evolution by Photocatalytic Reforming of Naphthalene. ACS Catal.. 2020;10:7398-7412.
- [CrossRef] [Google Scholar]
- TiO2 Photocatalysis for the Transformation of Aromatic Water Pollutants into Fuels. Catalysts. 2021;11:317.
- [CrossRef] [Google Scholar]
- Al-Nasir, F.M., Jiries, A.G., Al-Rabadi, G.J., Alu’datt, M.H., Tranchant, C.C., Al-Dalain, S.A., Alrabadi, N., Madanat, O.Y., Al-Dmour, R.S., 2020. Determination of pesticide residues in selected citrus fruits and vegetables cultivated in the Jordan Valley. LWT 123, 109005. https://doi.org/10.1016/j.lwt.2019.109005.
- Agricultural reuse of reclaimed water and uptake of organic compounds: Pilot study at Mutah University wastewater treatment plant, Jordan. Chemosphere. 2008;72:1203-1214.
- [CrossRef] [Google Scholar]
- Evaluation, source apportionment and health risk assessment of heavy metal and polycyclic aromatic hydrocarbons in soil and vegetable of Ahvaz metropolis. Hum. Ecol. Risk Assess. An Int. J.. 2021;27:71-100.
- [CrossRef] [Google Scholar]
- Bishnoi, N.R., Mehta, U., Pandit, G.G., 2006. Quantification of polycyclic aromatic hydrocarbons in fruits and vegetables using high performance liquid chromatography.
- Fate of Hydrocarbons During Oily Sludge Disposal in Soil. Appl. Environ. Microbiol.. 1984;47:763-767.
- [CrossRef] [Google Scholar]
- Chemical and elemental analysis of the edible fruit of five Carpobrotus species from South Africa: assessment of nutritional value and potential metal toxicity. Int. J. Environ. Health Res.. 2020;30:357-371.
- [CrossRef] [Google Scholar]
- Occurrence and assessment of polycyclic aromatic hydrocarbons in soils from vegetable fields of the Pearl River Delta, South China. Chemosphere. 2007;68:159-168.
- [CrossRef] [Google Scholar]
- Interim Canadian environmental quality criteria for contaminated sites. In: Canadian Council of Ministers of the Environment (CCME). 1991.
- [Google Scholar]
- Effects of Limonene on the PAHs Mutagenicity Risk in Roasted Fish Skin. J. Food Process. Technol.. 2018;9
- [CrossRef] [Google Scholar]
- Accumulation characteristics and potential risk of PAHs in vegetable system grow in home garden under straw burning condition in Jilin, Northeast China. Ecotoxicol. Environ. Saf.. 2018;162:647-654.
- [CrossRef] [Google Scholar]
- A partition-limited model for the plant uptake of organic contaminants from soil and water. Environ. Sci. Technol.. 2001;35:1437-1444.
- [CrossRef] [Google Scholar]
- Levels of polycyclic aromatic hydrocarbons in Canadian mountain air and soil are controlled by proximity to roads. Environ. Pollut.. 2009;157:3199-3206.
- [CrossRef] [Google Scholar]
- Leaf accumulation of trace elements and polycyclic aromatic hydrocarbons (PAHs) in Quercus ilex L. Environ. Pollut.. 2008;153:376-383.
- [CrossRef] [Google Scholar]
- Source identification of polycyclic aromatic hydrocarbons in terrestrial soils in Chile. J. S. Am. Earth Sci.. 2020;99:102514
- [CrossRef] [Google Scholar]
- Department of Statistics, 2020. Jordanian Statistics Press. Amman-Jordan.
- Human dietary exposure to polycyclic aromatic hydrocarbons: A review of the scientific literature. Food Chem. Toxicol.. 2015;86:144-153.
- [CrossRef] [Google Scholar]
- Polycyclic Aromatic Hydrocarbons (PAH’s) in the Terrestrial Environment—A Review. J. Environ. Qual.. 1983;12:427-441.
- [CrossRef] [Google Scholar]
- European Commission, 2002. Commission directive 2002/63/EC of 11 July 2002-Establishing community methods of sampling for the official control of pesticide residues in and on products of plant and animal origin and repealing directive 79/700, EEC.
- Polycyclic aromatic hydrocarbons in foods: human exposure through the diet in Catalonia, Spain. J. Food Prot.. 2003;66:2325-2331.
- [CrossRef] [Google Scholar]
- A review on analysis methods, source identification, and cancer risk evaluation of atmospheric polycyclic aromatic hydrocarbons. Sci. Total Environ.. 2021;789:147741
- [CrossRef] [Google Scholar]
- Potential source apportionment of polycyclic aromatic hydrocarbons in surface sediments from the middle and lower reaches of the Yellow River, China. Environ. Sci. Pollut. Res.. 2014;21:11447-11456.
- [CrossRef] [Google Scholar]
- Distribution, transfer, and health risks of polycyclic aromatic hydrocarbons (PAHs) in soil-wheat systems of Henan Province, a typical agriculture province of China. Environ. Sci. Pollut. Res.. 2017;24:18195-18203.
- [CrossRef] [Google Scholar]
- Soil-to-Root transfer and translocation of polycyclic aromatic hydrocarbons by vegetables grown on industrial contaminated soils. J. Environ. Qual.. 2002;31:1649-1656.
- [CrossRef] [Google Scholar]
- Composition, Distribution, and Characterization of Polycyclic Aromatic Hydrocarbons in Soil in Linfen, China. Bull. Environ. Contam. Toxicol.. 2009;82:167-171.
- [CrossRef] [Google Scholar]
- Screening and Determination of Polycyclic Aromatic Hydrocarbons in Seafoods Using QuEChERS-Based Extraction and High-Performance Liquid Chromatography with Fluorescence Detection. J. AOAC Int.. 2011;94:1601-1616.
- [CrossRef] [Google Scholar]
- A practical guide to analytical method validation, including measurement uncertainty and accuracy profiles. TrAC, Trends Anal. Chem.. 2007;26:227-238.
- [CrossRef] [Google Scholar]
- Residue level of polycyclic aromatic hydrocarbons in Japanese paddy soils from 1959 to 2002. Chemosphere. 2007;68:1763-1771.
- [CrossRef] [Google Scholar]
- Persistent Toxic Substances in Agricultural Soils of Lishui County, Jiangsu Province, China. Bull. Environ. Contam. Toxicol.. 2009;82:48-54.
- [CrossRef] [Google Scholar]
- Concentrations and Profiles of Polycyclic Aromatic Hydrocarbons in Some Commercial Brands of Tea-, Coffee-, and Cocoa-Based Food Drinks in Nigeria. Int. J. Food Prop.. 2015;18:2124-2133.
- [CrossRef] [Google Scholar]
- Emission Factors for Polycyclic Aromatic Hydrocarbons from Biomass Burning. Environ. Sci. Technol.. 1996;30:2462-2469.
- [CrossRef] [Google Scholar]
- Levels, composition profiles and sources of polycyclic aromatic hydrocarbons in urban soil of Shanghai, China. Chemosphere. 2009;75:1112-1118.
- [CrossRef] [Google Scholar]
- Status, source and health risk assessment of polycyclic aromatic hydrocarbons in street dust of an industrial city, NW China. Ecotoxicol. Environ. Saf.. 2014;106:11-18.
- [CrossRef] [Google Scholar]
- The Quality of Drinking Water at Source of West Amman, Jordan. Water Int.. 2004;29:392-397.
- [CrossRef] [Google Scholar]
- Changes in the polynuclear aromatic hydrocarbon content of wheat grain and pasture grassland over the last century from one site in the U.K. Sci. Total Environ.. 1989;78:117-130.
- [CrossRef] [Google Scholar]
- Health risk assessment of polycyclic aromatic hydrocarbons via dietary intake of leafy vegetables. Int. J. Environ. Anal. Chem.. 2020;1–16
- [CrossRef] [Google Scholar]
- On the use of PAH molecular diagnostic ratios in sewage sludge for the understanding of the PAH sources. Is this use appropriate? Chemosphere. 2007;69:1337-1339.
- [CrossRef] [Google Scholar]
- The analysis and probabilistic health risk assessment of polycyclic aromatic hydrocarbons in vegetables and fruits samples marketed Tehran:Chemometrics. Glob. NEST J.. 2021;23:497-508.
- [CrossRef] [Google Scholar]
- The analysis and probabilistic health risk assessment of polycyclic aromatic hydrocarbons in cereal products. Environ. Sci. Pollut. Res.. 2022;29:31099-31109.
- [CrossRef] [Google Scholar]
- A review of airborne polycyclic aromatic hydrocarbons (PAHs) and their human health effects. Environ. Int.. 2013;60:71-80.
- [CrossRef] [Google Scholar]
- Bioconcentration of polycyclic aromatic hydrocarbons in vegetables grown in an industrial area. Environ. Pollut.. 1999;106:369-380.
- [CrossRef] [Google Scholar]
- Determination of polycyclic aromatic hydrocarbons in milk samples by high-performance liquid chromatography with fluorescence detection. J. Chromatogr. B. 2003;789:257-264.
- [CrossRef] [Google Scholar]
- Polycyclic aromatic hydrocarbons. A review. Cogent Environ. Sci.. 2017;3:1339841.
- [CrossRef] [Google Scholar]
- Chemical analysis techniques and investigation of polycyclic aromatic hydrocarbons in fruit, vegetables and meats and their products. Food Chem.. 2019;277:156-161.
- [CrossRef] [Google Scholar]
- Polycyclic aromatic hydrocarbons in water, sediment, soil, and plants of the Aojiang River waterway in Wenzhou, China. J. Hazard. Mater.. 2010;173:75-81.
- [CrossRef] [Google Scholar]
- The concentrations, distribution and sources of PAHs in agricultural soils and vegetables from Shunde, Guangdong, China. Environ. Monit. Assess.. 2008;139:61-76.
- [CrossRef] [Google Scholar]
- Source apportionment of polycyclic aromatic hydrocarbons (PAHs) in surface sediments of the Huangpu River, Shanghai, China. Sci. Total Environ.. 2009;407:2931-2938.
- [CrossRef] [Google Scholar]
- Polycyclic aromatic hydrocarbons in agricultural soils in Poland: preliminary proposals for criteria to evaluate the level of soil contamination. Appl. Geochemistry. 1996;11:121-127.
- [CrossRef] [Google Scholar]
- Climate change impact on the PAH photodegradation in soils: Characterization and metabolites identification. Environ. Int.. 2016;89–90:155-165.
- [CrossRef] [Google Scholar]
- Polycyclic aromatic hydrocarbons (PAH) in foods and estimated PAH intake by the population of Catalonia, Spain: Temporal trend. Environ. Int.. 2010;36:424-432.
- [CrossRef] [Google Scholar]
- Evidence for bioaccumulation of PAHs within internal shoot tissues by a halophytic plant artificially exposed to petroleum-polluted sediments. Chemosphere. 2006;65:474-481.
- [CrossRef] [Google Scholar]
- Health risk assessment of dietary exposure to polycyclic aromatic hydrocarbons in Taiyuan, China. J. Environ. Sci.. 2014;26:432-439.
- [CrossRef] [Google Scholar]
- On-line combining monolith-based in-tube solid phase microextraction and high-performance liquid chromatography- fluorescence detection for the sensitive monitoring of polycyclic aromatic hydrocarbons in complex samples. J. Chromatogr. A. 2018;1571:29-37.
- [CrossRef] [Google Scholar]
- Polycyclic aromatic hydrocarbons in fruits and vegetables: Origin, analysis, and occurrence. Environ. Pollut.. 2018;234:96-106.
- [CrossRef] [Google Scholar]
- Cancer risk assessment of soils contaminated by polycyclic aromatic hydrocarbons in Shanxi, China. Ecotoxicol. Environ. Saf.. 2019;182:109381
- [CrossRef] [Google Scholar]
- Lead and cadmium contamination and exposure risk assessment via consumption of vegetables grown in agricultural soils of five-selected regions of Pakistan. Chemosphere. 2017;168:1589-1596.
- [CrossRef] [Google Scholar]
- Sources of fine organic aerosol. 2. Noncatalyst and catalyst-equipped automobiles and heavy-duty diesel trucks. Environ. Sci. Technol.. 1993;27:636-651.
- [CrossRef] [Google Scholar]
- Polycyclic aromatic hydrocarbons in Brazilian vegetables and fruits. Food Control. 2003;14:49-53.
- [CrossRef] [Google Scholar]
- Concentration and health risk assessment of polycyclic aromatic hydrocarbons in commercial tea and coffee samples marketed in Iran. Environ. Sci. Pollut. Res.. 2021;28:4827-4839.
- [CrossRef] [Google Scholar]
- Measurement of polycyclic aromatic hydrocarbons (PAHs) in edible mushrooms (raw, grilled and fried) using MSPE-GC/MS method: a risk assessment study. Appl. Biol. Chem.. 2021;64:61.
- [CrossRef] [Google Scholar]
- Characterization and source identification of polycyclic aromatic hydrocarbons (PAHs) in the urban environment of Delhi. Chemosphere. 2007;66:302-310.
- [CrossRef] [Google Scholar]
- Polycyclic Aromatic Hydrocarbons in Romanian Baby Foods and Fruits. Polycycl. Aromat. Compd.. 2016;36:364-375.
- [CrossRef] [Google Scholar]
- Polycyclic aromatic hydrocarbons in fruit juices. Ovidius Univ. Ann. Chem.. 2011;22:113-116.
- [Google Scholar]
- Polycyclic aromatic hydrocarbons in sediments and soils from oil exploration areas of the Niger Delta, Nigeria. J. Hazard. Mater.. 2010;174:641-647.
- [CrossRef] [Google Scholar]
- Impact of Lebanese practices in industry, agriculture and urbanization on soil toxicity. Evaluation of the Polycyclic Aromatic Hydrocarbons (PAHs) levels in soil. Chemosphere. 2018;210:85-92.
- [CrossRef] [Google Scholar]
- Semi-volatile organic pollutants in Jordanian surface water. Arab. J. Chem.. 2017;10:S3318-S3323.
- [CrossRef] [Google Scholar]
- Polycyclic aromatic hydrocarbons (PAHs) in agricultural soil and vegetables from Tianjin. Sci. Total Environ.. 2004;320:11-24.
- [CrossRef] [Google Scholar]
- Gehalte an Polycyclischen Aromatischen Kohlenwasserstoffen (PAK) und deren Verteilungsmuster in unterschiedlich belasteten Böden. Zeitschrift für Pflanzenernährung und Bodenkd.. 1993;156:1-10.
- [CrossRef] [Google Scholar]
- PAH diagnostic ratios for the identification of pollution emission sources. Environ. Pollut.. 2012;162:110-119.
- [CrossRef] [Google Scholar]
- Polycyclic aromatic hydrocarbons in Estonian soil: contamination and profiles. Environ. Pollut.. 1999;105:67-74.
- [CrossRef] [Google Scholar]
- Uptake of organic contaminants from soil into vegetables and fruits. In: Dealing with Contaminated Sites. Netherlands, Dordrecht: Springer; 2011. p. :369-408.
- [CrossRef] [Google Scholar]
- USEPA, 2017. Toxicological review of benzo[a]pyrene: CASRN 50-32-8. Integrated risk information system (IRIS). Washington, DC, USA.
- USEPA, 2005. Supplemental Guidance for Assessing Susceptibility from Early-Life Exposure to Carcinogens. Washington, DC.
- USEPA, 1996. Soil screening guidance: Technical background document, Washington, DC: US Environmental Protection Agency.[Accessed 7 March 2018].
- Characteristics and source identification of polycyclic aromatic hydrocarbons (PAHs) in urban soils: A review. Pedosphere. 2017;27:17-26.
- [CrossRef] [Google Scholar]
- Polycyclic aromatic hydrocarbons in soils from urban to rural areas in Nanjing: Concentration, source, spatial distribution, and potential human health risk. Sci. Total Environ.. 2015;527–528:375-383.
- [CrossRef] [Google Scholar]
- Wang, N., Lang, Y., 2010. Ecological risk assessment of polycyclic aromatic hydrocarbons (PAHs) in soils of Liaohe Estuarine Wetland. In: Conference on Environmental Pollution and Public Health.
- Distribution and sources of polycyclic aromatic hydrocarbons from urban to rural soils: A case study in Dalian, China. Chemosphere. 2007;68:965-971.
- [CrossRef] [Google Scholar]
- Polycyclic aromatic hydrocarbon burden in fruit and vegetable species cultivated in allotments in an industrial area. Int. J. Environ. Anal. Chem.. 2002;82:667-690.
- [CrossRef] [Google Scholar]
- WHO Expert Committee of Food Additives, 2005. JECFA, in: Ochratoxin A, in “Safety Evaluations of Specific Mycotoxins”. In: Prepared by the Fifty-Sixth Meeting of the Joint FAO/WHO Expert Committee on Food Additives, 6e15 February, Geneva.
- SYNOPSIS Polycyclic Aromatic Hydrocarbons (PAHs) in Soil — a Review. J. Plant Nutr. Soil Sci.. 2000;163:229-248.
- [CrossRef] [Google Scholar]
- Persistent Organic Pollutants in Native Grassland Soils along a Climosequence in North America. Soil Sci. Soc. Am. J.. 2000;64:2140-2148.
- [CrossRef] [Google Scholar]
- Wilcke, W., Lilienfein, J., do Carmo Lima, S., Zech, W., 1999. Contamination of highly weathered urban soils in Uberlândia, Brazil. J. Plant Nutr. Soil Sci. 162, 539–548. https://doi.org/10.1002/(SICI)1522-2624(199910)162:5<539::AID-JPLN539>3.0.CO;2-O.
- Polynuclear aromatic hydrocarbons in the United Kingdom environment: A preliminary source inventory and budget. Environ. Pollut.. 1995;88:91-108.
- [CrossRef] [Google Scholar]
- Characterization, source apportionment, and risk assessment of polycyclic aromatic hydrocarbons in urban soil of Nanjing, China. J. Soils Sediments. 2017;17:1116-1125.
- [CrossRef] [Google Scholar]
- Polycyclic aromatic hydrocarbons in soils in the vicinity of Nanjing, China. Chemosphere. 2008;73:389-394.
- [CrossRef] [Google Scholar]
- Estimation of excess cancer risk on time-weighted lifetime average daily intake of PAHs from food ingestion. Hum. Ecol. Risk Assess. An Int. J.. 2007;13:669-680.
- [CrossRef] [Google Scholar]
- Distribution, sources and potential toxicological significance of polycyclic aromatic hydrocarbons (PAHs) in surface soils of the Yellow River Delta, China. Mar. Pollut. Bull.. 2014;83:258-264.
- [CrossRef] [Google Scholar]
- PAHs in the Fraser River basin: a critical appraisal of PAH ratios as indicators of PAH source and composition. Org Geochem.. 2002;33:489-515.
- [CrossRef] [Google Scholar]
- The occurrence of 16 EPA PAHs in food – A review. Polycycl. Aromat. Compd.. 2015;35:248-284.
- [CrossRef] [Google Scholar]
- Source diagnostics of polycyclic aromatic hydrocarbons in urban road runoff, dust, rain and canopy throughfall. Environ. Pollut.. 2008;153:594-601.
- [CrossRef] [Google Scholar]
- Residues of polycyclic aromatic hydrocarbons (PAHs), polychlorinated biphenyls (PCBs) and organochlorine pesticides in organically-farmed vegetables. Chemosphere. 2006;63:541-553.
- [CrossRef] [Google Scholar]


