

Translate this page into:
Polymer chain dynamics in epoxy based composites as investigated by broadband dielectric spectroscopy
⁎Corresponding authors at: Center for Advanced Materials, Qatar University, Doha, Qatar (M.K. Hassan), The University of Southern Mississippi, School of Polymers and High Performance Materials, 118 College Drive #5050, Hattiesburg, MS 39406, United States (K.A. Mauritz). mohamed.hassan@qu.edu.qa (Mohammad K. Hassan), kenneth.mauritz@usm.edu (Kenneth A. Mauritz)
-
Received: ,
Accepted: ,
This article was originally published by Elsevier and was migrated to Scientific Scholar after the change of Publisher.
Peer review under responsibility of King Saud University.
Abstract
Epoxy networks of the diglycidyl ether of bisphenol A (DGEBA) were prepared using 3,3′- and 4,4′-diaminodiphenyl sulfone isomer crosslinkers. Secondary relaxations and the glass transitions of resultant networks were probed using broadband dielectric spectroscopy (BDS). A sub-Tg γ relaxation peak for both networks shifts to higher frequencies (f) with increasing temperature in Arrhenius fashion, both processes having the same activation energy and being assigned to phenyl ring flipping in DGEBA chains. A β relaxation is assigned to local motions of dipoles that were created during crosslinking reactions. 4,4′-based networks exhibited higher Tg relative to 3,3′-based networks as per dynamic mechanical as well as BDS analyses. The Vogel–Fulcher–Tammann–Hesse equation fitted well to relaxation time vs. temperature data and comparison of Vogel temperatures suggests lower free volume per mass for the 3,3′-based network. The Kramers–Krönig transformation was used to directly calculate dc-free ɛ″ vs. f data from experimental ɛ′ vs. f data. Distribution of relaxation times (DRT) curves are bi-modal for the 3,3′-crosslinked resin suggesting large-scale microstructural heterogeneity as opposed to homogeneity for the 4,4′-based network whose DRT consists of a single peak.
Keywords
Dielectric spectroscopy
Epoxy networks of the diglycidyl ether of bisphenol A
3,3′ and 4,4′-diaminodiphenyl sulfone isomers
Chain motions
Vogel temperature
Kramers–Krönig transformation

1 Introduction
Polymer composite resins based on the diglycidyl ether of bisphenol A (DGEBA) cured by simple aromatic amines (mainly diaminodiphenyl sulfone) are considered as a model system for studying epoxy networks. This system is a good model in that investigation of reaction chemistry and side reactions have already been established and structural models of networks in the rubbery state have been proposed; moreover, these polymers show very good mechanical properties in the glassy state (Oleinik, 1986). Simple curing chemistry, homogeneous structure and established glassy-state properties allow for a clear understanding of structure–property relationships of these polymers which forms a basis for understanding more complex epoxy systems (Oleinik, 1986).
Generally, many aspects of glassy networks cannot be understood without considering the chemistry of their formation, degree of crosslinking and behavior in the rubbery state.
Crosslink density has a significant effect on the behavior of a network. Higher crosslink density results in a higher mechanical tensile modulus (Hiemenz and Lodge, 2007). The extent of reaction at higher conversion results in higher crosslink density. Full conversion of functional groups in an epoxy network is usually unattainable due to the confining effects of vitrification and the final chemical structure is a combination of a majority of tertiary amines and a small amount of secondary amines. The molecular weight of the monomers determines the molecular weight between crosslinks. At theoretical full conversion, the crosslink density is inversely proportional to the average molecular weight of segments between junctions, Mc. Longer segments, due to less constraint of junctions, display more mobility and flexibility, which leads to a network with a lower modulus (Tucker et al., 2010).
Here are presented the results of an investigation of the dynamics of the glass transition (Tg) and secondary relaxations of epoxy networks formed from the reaction of DGEBA with the 4,4′-diaminodiphenyl sulfone (44 BisA) vs. 3,3′-diaminodiphenyl sulfone (33 BisA) crosslinkers. Although secondary and Tg-related motions for the networks formed from DGEBA and 44 BisA crosslinkers were studied in detail by others (Oleinik, 1986; Shimbo et al., 1984; Ochi et al., 1987, 1982, 1986a, 1986b; Mangion and Johari, 1990; Mikolajczak et al., 1987; Keenan et al., 1979; Mangion, 1990), to the best of our knowledge no reports mention the use of 33 BisA as a crosslinker for those epoxy networks.
Modern broadband dielectric spectroscopy (BDS) was used to interrogate chain molecular dynamics of these resin networks. Earlier, Mauritz et al. used BDS to characterize chain motions affected by chemical degradation in polylactides (Wiggins et al., 2006) and chemical degradation in Nafion® membranes (Rhoades et al., 2007) and presented a more detailed view of their consequent glass transition temperatures (Osborn et al., 2007).
BDS is a powerful tool of interrogation because information can be collected over a broad frequency (f) range (Kremer and Schönhals, 2003) so that motional processes that occur over broad time and distance scales can be investigated vs. temperature. In addition to polymer relaxations, significant differences in dielectric permittivity and/or charge conductivity across phase boundaries can cause fluctuating interfacial polarization that is manifest at low f on loss permittivity ɛ″ vs. f plots (Mauritz and Stefanithis, 1990).
Dielectric spectroscopy deals with the interaction of applied alternating electric fields with dipoles having reorientation mobility in materials. Conformational fluctuations on different distance scales affect dipole reorientation and the long range cooperative chain segmental motions that are affected at the glass transition.
The dielectric spectrum of an amorphous polymer generally shows multiple relaxations at different temperatures (T), where each is indicated by a peak in ɛ″ curves and an associated step decreases in storage permittivity ɛ′ vs. f curves at a fixed T.
2 Experimental
2.1 Preparation of cured epoxy resins
All reagents were used without further purification. 33 BisA and 44 BisA were purchased from Aldrich. EPON 825, DGEBA resin, was donated by Hexion.
33 BisA and 44 BisA were solubilized in DGEBA at 110 °C under vacuum, and the resins were cured between two stainless steel dielectric electrodes at 125 °C for 5 h and at 225 °C for 2 h. Rectangular samples were also prepared using the same temperature scheme for the dynamic mechanical analysis experiments.
2.2 Dynamic mechanical analysis (DMA)
Dynamic storage modulus E′ and tan δ = E″/E′ (E″ = loss modulus) vs. temperature curves were generated for samples using a DMA Thermal Analysis Q800 instrument. All samples were run in tensile mode at a frequency of 1 Hz and oscillation amplitude of 20 μm. The experiments were performed over the temperature range −120 to 300 °C at a heating rate of 2 °C/min.
2.3 Broadband dielectric spectroscopy (BDS) measurements and analysis
Dielectric spectra were collected isothermally using a Novocontrol GmbH Concept 80 Broadband Dielectric Spectrometer over the frequency range 0.1 Hz–3 MHz and temperature range of −80 to 300 °C. Temperature stability was controlled to within ±0.2 °C. Resins were cured between two stainless steel disks, the lower being of 4 cm diameter and the upper of 2 cm diameter. The thickness of both discs was determined before and after enclosure of the resin film between them to determine sample thickness. The electrode-sample assembly was kept in a Humidity Control Chamber (Model 503-20, Electro-tech Systems, Inc.) with RH <0.5% at room temperature for more than one week before BDS experiments were performed to decrease the obscuring influence of water on the dielectric response. Electrode-sample assemblies were then transferred to the instrument for data collection. To extract dielectric parameters the Havriliak–Negami (H–N) equation (Havriliak and Negami, 1966, 1967; Negami et al., 1982), shown below, was fitted to experimental data:
The dc term in Eq. (1) accounts for inherent or unintended (impurity) charge migration that is often subtracted to uncover loss peaks or at least make them more distinct.
3 Results and discussion
3.1 Curing process reactions
Epoxy networks are formed through a step-growth polymerization where glycidyl rings open in the presence of strong nucleophiles. Four functional diamines are commonly used as curing agents for epoxy resins due to their ability to crosslink and their high thermal stability. The cure procedure scheme that was used consisted of the two isothermal steps as shown in Fig. 1. The first step is generally a long, low temperature hold to promote linear polymer growth through reaction of the primary amine. In the second step, the system is heated above the ultimate glass transition temperature of the material to drive crosslinking between coiled linear polymeric chains. The steps shown in Fig. 1 were used to form epoxy networks of DGEBA with the 4,4′-diaminodiphenyl sulfone (44 BisA) and 3,3′-diaminodiphenyl sulfone (33 BisA) crosslinkers. It was seen that for curing at temperatures at ⩽110–120 °C, which is very close to the temperature in the first step, crosslinking proceeds practically without side reactions (Oleinik, 1986). An important factor affecting network formation is the relative reactivity of the primary and secondary amine groups involved in curing. It is also reported that under these conditions, regions with variable crosslink density can be formed which can be important with regard to properties; this idea will be utilized later in this discussion. When curing at temperatures >130–140 °C, which is the case in the second step which involved curing at 200 °C, the main side reaction is between secondary OH groups and unreacted epoxy rings (Oleinik, 1986). This reaction should lead to some changes in the network structure by forming additional crosslinks that usually occur after the end of the main crosslinking reaction. This leads to higher network connectivity and it is pronounced in a non-stoichiometric system with epoxy components. Thermal oxidation reactions take place when curing at temperatures ⩾130 °C for aliphatic amines and at ⩾220–240 °C for aromatic amine-based polymers conducted in air (Oleinik, 1986). It might be thought that these oxidation reactions might happen during the BDS experiment although this is unlikely owing to the fact that all experiments were conducted while the sample cell is under vacuum.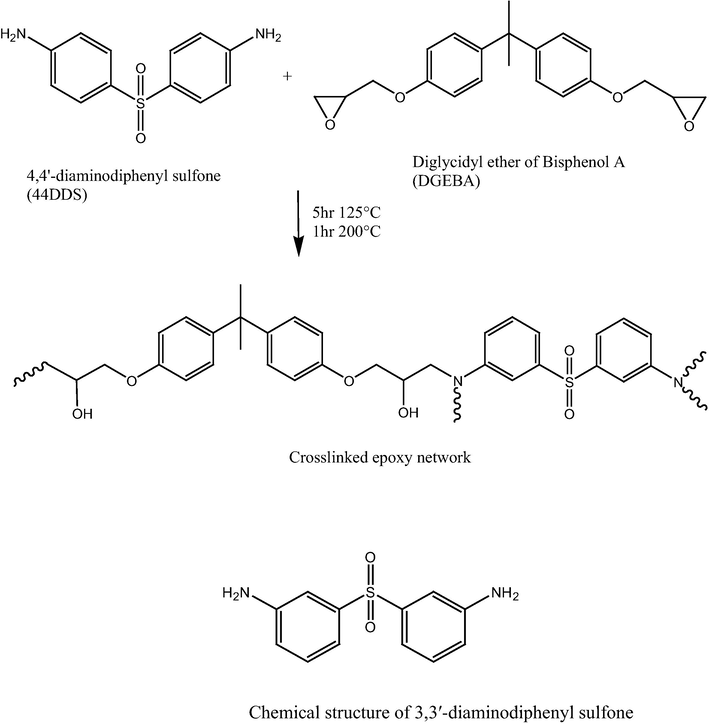
Scheme of reaction between the diglycidyl ether of bisphenol A (DGEBA) and 4,4′-diaminodiphenyl sulfone vs. 3,3′-diaminodiphenyl sulfone and the chemical structure 3,3′-diaminodiphenyl sulfone also used as a crosslinker in the scheme.
Real time, near infrared spectroscopic studies of reaction kinetics conducted in our laboratory showed reactivity differences between the 33 BisA and 44 BisA isomers (Jackson et al., 2011). After 2 h at 125 °C, rapid consumption of primary amine was observed for 33 BisA isomer compared to 44 BisA (∼99% consumption for 33 BisA compared to ∼50% for 44 BisA). For the case of 33 BisA isomer, and after 5 h at 125 °C, epoxide conversion approached 88% suggesting some secondary amine conversion. Primary amines react initially to form more linear chain segments; subsequently, secondary amines react to crosslink the system to a state of vitrification. After 5 h the temperature was raised to 200 °C for 2 h to further drive vitrified state reactions during which time remaining secondary amines reacted to near 100% conversion (Jackson et al., 2011).
For the 44 BisA isomer, primary amines continued to react slowly and secondary amine concentration increased until 5 h, at which point epoxide conversion remained below 50%. At this point primary amine was still present. As temperature increased (in this case to 225 °C for 2 h) the residual primary and secondary amines reacted simultaneously, resulting in rapid vitrification (Jackson et al., 2011). During vitrification the reaction slowed and the network eventually locked into highly random configurations leaving 6% of epoxide groups unreacted. This FTIR study also observed that higher post-cure temperatures for 44 BisA lead to chemical degradation of the networks (Oleinik, 1986; Jackson et al., 2011).
3.2 Dynamic mechanical analysis (DMA)
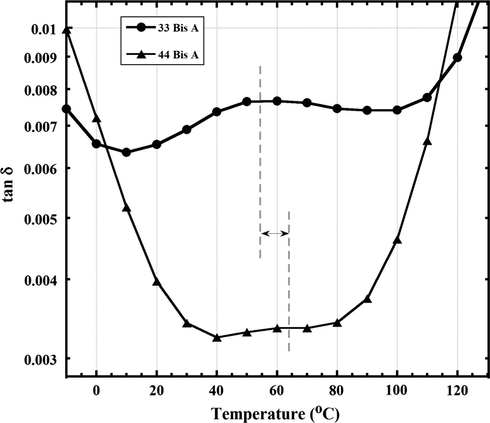
Fig. 2 shows dynamic mechanical tan δ vs. T curves for epoxy resins formed by reactions between DGEBA and 44 BisA as well as with 33 BisA. There are three distinct peaks having strengths ranging from weak to very strong. The lowest temperature peak, labeled γ for both crosslink types, is broad with a maximum at around −50 °C. There is another weak peak, labeled β for both crosslinkers, with maxima at ≈40 °C. As these are glassy state relaxations, they must involve motions of short macromolecular fragments within small free volumes. It is significant that these relaxations are largely independent of crosslink type which is reasonable considering the local, rather than long range nature of sub-Tg macromolecular motions. Assignments of the γ and β relaxations will be discussed in the next section.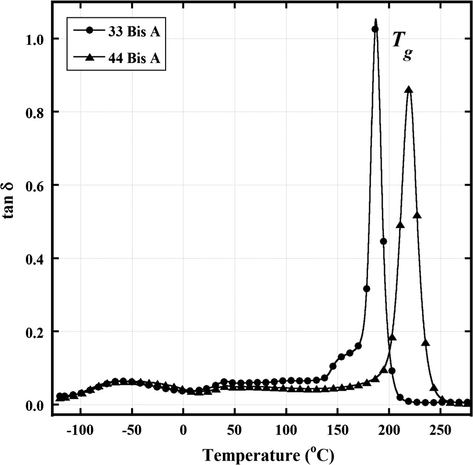
Dynamic mechanical tan δ vs. T at 1 Hz for epoxy networks formed by reaction between DGEBA and 4,4′-diaminodiphenyl sulfone and 3,3′-diaminodiphenyl sulfone.
The third and strongest relaxation for both networks is the glass transition, labeled α. Because the glass transition involves long range segmental motions, the width of these peaks reflects, at least in large part, the distribution of the contour length of sub-chains between the crosslinks. Given this interpretation, it would seem that, for both cases, the sub-chain length distribution is relatively narrow.
Tg, taken as the α peak temperature, is considerably higher for the 44 BisA-derived network compared to Tg for the 33 BisA-derived network by about 50 °C. This difference can be rationalized in terms of crosslink chemical isomer structure and crosslink density as related to cure temperature profile.
The glass transition peak for the network crosslinked with 33 BisA has a low temperature shoulder. Keenan et al. reported a similar feature in tan δ vs. T curves for networks formed by curing tetraglycidyl 4,4′-diaminodiphenyl methane epoxy with small amounts of 4,4′-diaminodiphenyl sulfone (Keenan et al., 1979). In this work, a similar additional peak was thought to result from additional cure in the sample that occurred separately in the DMA instrument during heating in the course of the experiment. The concept of such a post-cure was reinforced in their studies by a corresponding increase in the dynamic storage modulus vs. T curve over the same range as that for which the glass transition splitting occurs. An increase in E′ is in fact seen for both BisA 33 and BisA 44-derived samples in Fig. 3 but after the completion of the glass transition rather than before the onset. Thus, it would seem that the minor peak for the 33 sample is not associated with reactions driven by heating during the DMA experiment that would cause additional crosslinking. An alternate explanation is that there is an inhomogeneous crosslink density or distinct regions where there are different average molecular weights of chains between crosslinks (Mc).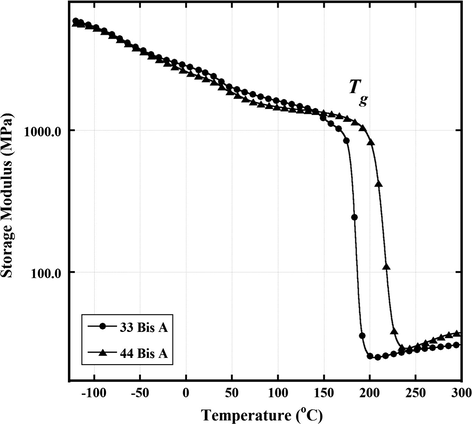
Dynamic storage modulus E′ vs. T at 1 Hz for epoxy networks formed by reaction between DGEBA and 44 BisA and 33 BisA crosslinkers.
3.3 Dielectric spectra analysis
3.3.1 Secondary relaxations
Fig. 4 shows dielectric loss tangent = tan δ = ɛ″/ɛ′ vs. T curves at 1 kHz for epoxy resins formed by reactions between DGEBA and 44 BisA as well as with 33 BisA. As also seen in the DMA curves in Fig. 2, there are two secondary relaxations, also labeled γ and β, and the glass transition. The weak β relaxation is not evident in Fig. 4 but is in fact visible upon expanding the vertical scale and selecting the measurement frequency to be lower at 1 Hz, as seen in Fig. 5. Decreasing the frequency by this much increases the time scale over which molecular motions can be sampled by a factor of 1000.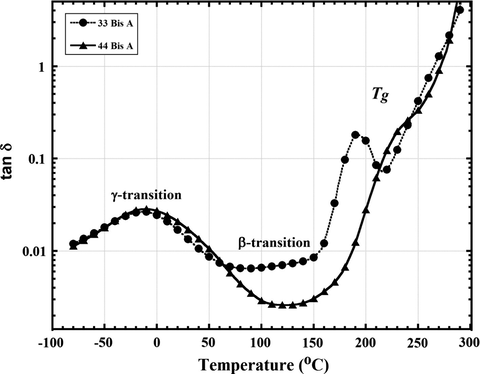
Dielectric tan δ vs. T curves at 1 kHz which shows relaxations for epoxy networks formed using 33 BisA and 44 BisA isomer crosslinkers.
Dielectric tan δ vs. T curves at the lower fixed frequency of 1 Hz over a restricted temperature range, and with expanded vertical axis, to reveal the broad β relaxation for epoxy networks formed by 33 BisA and 44 BisA isomer crosslinkers. The dashed lines indicate the β relaxation peak maximum in each case.
3.3.1.1 γ Relaxation
A γ relaxation was observed in cured epoxy networks having structures similar to those reported here (Shimbo et al., 1984; Ochi et al., 1987, 1982, 1986a, 1986b; Mangion and Johari, 1990; Mikolajczak et al., 1987; Keenan et al., 1979; Mangion, 1990). Johari and Mangion assigned such a relaxation to local motions of dipoles in unreacted components during thermoset curing. These dipoles may be parts of the DGEBA chain including unreacted epoxy groups and/or free amino-diphenyl or primary amine groups. Ochi et al. proposed that the dynamic mechanical γ relaxation is due to local motions of polymer segments involving at least four carbon atoms (Ochi et al., 1982).
For the epoxy networks reported here, well-resolved γ peaks for both the 33 BisA and 44 BisA crosslinked systems are clearly observed. To assist in the assignment of this relaxation, static deuterium NMR experiments were conducted at different temperatures on selectively deuterated moieties in the polymer (Tucker, 2010; Tu et al., 2011). The main result of this NMR study was the assignment of the γ transition to phenyl rings flipping in the DGEBA main chain which implies adjacent flexible ether linkages. Oleinik reported that chain sections between crosslinks are the only flexible elements of a glassy polymer and the conformations of aliphatic chains in epoxy-aliphatic amine networks depend on rotation about five skeletal bonds (Oleinik, 1986).
The same relative intensities of the tan δ curves for both 33 and 44 BisA crosslinks could indicate that the flexible fragments of these polymers, even in the glassy state, have somewhat equilibrium conformations, i.e., chains existing unperturbed as coils even in densely crosslinked epoxy–aromatic amine glasses, according to Oleinik (1986), Flory (1976) and Fischer et al. (1979).
It would seem, then, that the aromatic fragments of the polymer and flexible aliphatic chains created during glycidyl ring opening in the cure process affect the highest packing density (Oleinik, 1986).
In Fig. 6 it is seen that fmax, the frequency at ɛ″ peak maximum for the γ relaxation, increases with increasing T, which reflects faster molecular motions and shorter relaxation times in the usual sense. The HN equation was fitted to the data in Fig. 6 and the relaxation time τmax = 1/2π fmax was extracted at each temperature. Log τmax, when plotted against 1/T in Fig. 7, shows strong Arrhenius behavior according to the following equation:
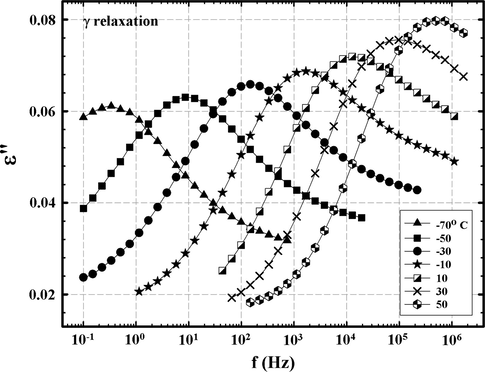
ɛ″ vs. f for different temperatures for an epoxy network formed by reaction between DGEBA and 3,3′-diaminodiphenyl sulfone in the region of the γ relaxation.
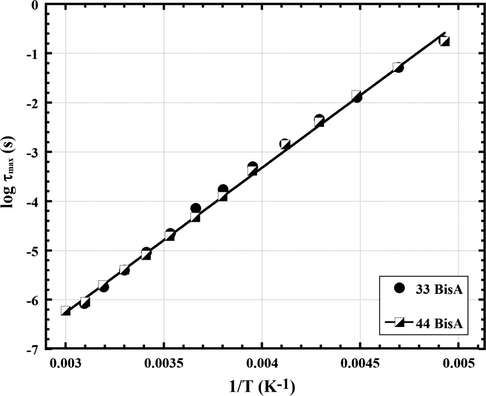
Arrhenius plots for the γ relaxation for epoxy networks formed using 44 BisA and 33 BisA crosslinkers.
3.3.1.2 β Relaxation
The β peak is tentatively assigned to local motions of dipoles, namely the hydroxyl ether and secondary or tertiary amine groups that were created during crosslinking reactions as previously reported (Shimbo et al., 1984; Ochi et al., 1987, 1982, 1986a, 1986b; Mangion and Johari, 1990). β peaks for each of the 33 BisA and 44 BisA networks are shown in the dielectric tan δ vs. temperature curves in Fig. 4. It was necessary to compare the dielectric tan δ vs. temperature curves at 1 Hz instead of 1 kHz in order to show the trends of the α and γ relaxations more clearly. At 1 Hz the timescale of the experiment is 1000 times longer than at 1 kHz so as to capture slow motions more effectively.
The β relaxation peak strength, in a general sense, is related to the number density of mobile dipoles contributing to this relaxation which, in turn, is affected by the nature of molecular packing and disorder in the glassy state (Mangion and Johari, 1990; Mangion, 1990). Johari and Mangion reported that the ‘rate’ (in their terms, the peak frequency position) of the β relaxation is less affected by the growth of polymer chains or of polymer networks during the first curing step than is the ‘rate’ of the α relaxation, but that the strength of the β relaxation is more affected. Consequently, the β relaxation becomes more prominent as the number of crosslinks and chain lengths increase during the curing process (Mangion and Johari, 1990; Mangion, 1990). This suggests that 33 BisA networks have a greater crosslink density so that a higher number of hydroxyl groups are formed and that there is decreased chain length compared to 44 BisA-crosslinked material. Although it is hard to compare both peak positions because of peak broadening and lower resolution in case of the 44 BisA networks as shown in Fig. 5, peak position is at a somewhat lower temperature for 33 BisA as compared to 44 BisA networks. It is suggested that the β relaxation peak position is more sensitive to the difference in distribution of local free volume, or the space surrounding the mobile dipolar segments, throughout the network. Different distributions of free volume within the network were formed from 33 BisA as compared to 44 BisA crosslinker.
3.3.2 α Relaxation: Glass transition chain dynamics
The α relaxation, or dynamic glass transition, is associated with long range chain segmental mobility which in this case depends on the nature and density of crosslinks. In Fig. 8, which consists of ɛ″ vs. f data at temperatures at or above Tg for the 33 BisA sample, it is seen that fmax increases with increasing temperature, as is usual. The linear curve segments at low f can be accounted for in terms of dc conduction which in the context of this experiment involves the sampling of charge hopping pathways that become progressively longer at increasingly lower f. As the experimental time scale, or half period of oscillation (2f)−1, increases, charge carriers, likely impurity ions, can execute more elementary hops before the applied field reverses. In the low frequency region for T > Tg, all log ɛ″ vs. log f plots are linear such that the slopes are around −1.0, which is the signature of dc conduction.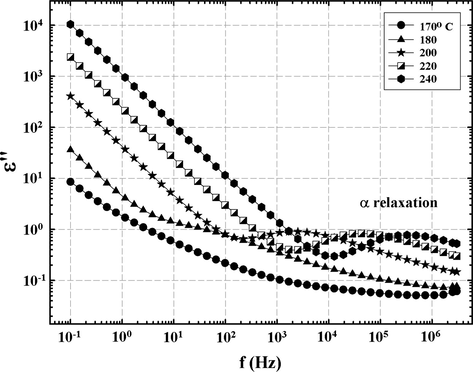
ɛ″ vs. f at different temperatures for epoxy networks formed using 33 BisA crosslinker showing the glass transition (α process) peak in the region of high f.
The monotonic vertical elevation of these linear segments with increase in temperature can be accounted for in terms of increased dc conductivity according to the equation σdc = 2π ɛ0 f ɛ″ that holds in the low f region. At a given f, greater ɛ″ values reflect greater σdc. This, presumably, is caused by increased chain segmental mobility in the rubbery state to which charge motions are coupled. The impurity ions become relatively mobile due to greater chain mobility activated at the onset of the glass transition. At low frequencies ions have enough time to accumulate at the sample/electrode interface during one-half cycle of applied electric field (Day et al., 1985; Schultz and Chartoff, 1996; Senturia and Sheppard, 1986). Ions can accumulate into charged layers at both electrodes and these layers can give rise to greater charge per unit area than those due to partial charges, in a plane, that were produced from simple dipole orientation. In this way, the real dielectric permittivity ɛ′ can be much greater than the actual bulk permittivity. This is exemplified by the large increase in ɛ′ values with decreasing f above 220 °C that is seen in Fig. 9 for the 33 BisA sample. The curves for 180 and 200 °C do not exhibit this feature because these temperatures are beneath Tg. The same general behavior was observed for the 44 BisA sample.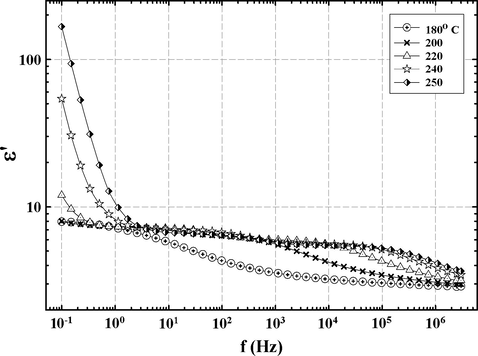
ɛ′ vs. f at different temperatures for a network formed using the 33 BisA crosslinker showing the strong presence of sample/electrode interfacial polarization in the region of low f.
Fig. 10 shows ɛ″ vs. f at 250 °C for resins formed from the use of 44 BisA and 33 BisA crosslinkers showing the glass transition-related peaks for each. A dc component is evident at low f where there are linear curve sections of slope −1.00. The dashed lines and arrow mark the separation in α peak maxima for the two relaxations. The α peak is weaker and very broad for 44 BisA and occurs at a lower frequency than that for 33 BisA which indicates slower chain motions in the former. This result is in harmony with the DMA results in which Tg is almost 50 °C higher for samples cured with 44 BisA. The same conclusion can be arrived at when comparing the dielectric tan δ at 1 kHz as shown in Fig. 4.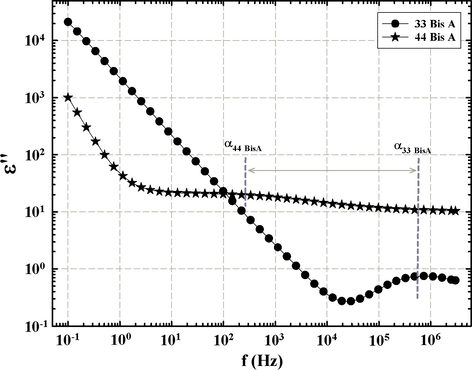
ɛ″ vs. f curves at 250 °C for epoxy networks formed from 44 BisA and 33 BisA crosslinkers, indicating the α transition for each. Dashed lines and arrow show separation in peak maxima.
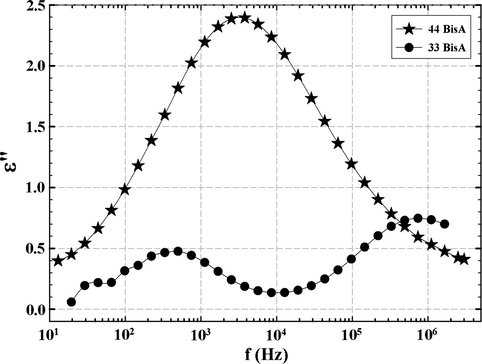
The HN equation was fitted to the spectra in Fig. 10 in the α relaxation region at different temperatures for both 33 BisA and 44 BisA-crosslinked samples. Then, the dc conductivity term was subtracted point-by-point for the purpose of uncovering loss peaks corresponding to these long range macromolecular motions. The dc-subtracted loss spectra shown in Fig. 11 does in fact render the peaks more distinct. The relaxation envelope for the 33 BisA sample is revealed as being bimodal while that of 44 BisA is a single broad peak. The 44 BisA peak lies between the two 33 BisA peaks and is closest to the lowest frequency peak of the latter. The evolution of the bimodal α peak of the 33 BisA sample with increase in temperature is seen in the dc-subtracted spectra in Fig. 12 where a shoulder is seen on the curve at 180 °C. As this peak moves to the right with increasing temperature, another curve emerges on the left at ∼200 °C. This lower temperature peak shifts to the right with increasing temperature and becomes better-resolved. These peaks correspond to the twin dynamic mechanical tan δ vs. T peaks where the low temperature peak corresponds to the high frequency peak component in Fig. 12. As in the discussion of the dynamic mechanical results, this behavior might reflect a network structure with two distinct regions having significantly different chain lengths between crosslinks.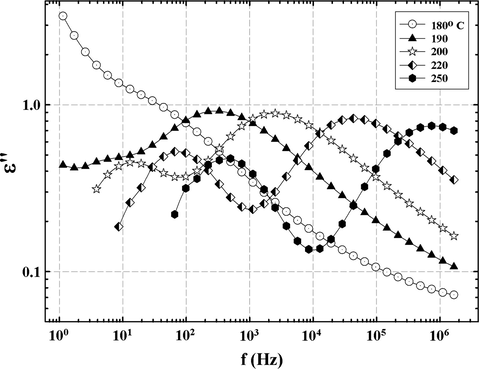
dc-conductivity subtracted spectra at different temperatures in the region of the α relaxation for the 33 BisA-crosslinked sample.
For both 33 and 44 BisA-crosslinked networks the relaxation time, τmax, corresponding to the ɛ″ vs. f peak maximum was obtained from fitting the HN equation to the data. The Vogel–Fulcher–Tammann–Hesse (VFTH) equation (Vogel, 1921; Fulcher, 1923; Tammann and Hesse, 1926), shown below, was then fitted to τmax vs. T data:
Fig. 13 shows log10 τmax vs. T−1 plots for the two networks. The two plots for 33 BisA are for separate fittings of the two relaxations in the α transition region. The curvature (as opposed to linearity) of all three plots is characteristic of long range motions in glass forming polymers. The curve for peak 1, associated with the glass transition of the 33 BisA sample, is significantly down-shifted relative to the curve for the 44 BisA sample, which indicates again that chain motions are faster in the 33 BisA sample. The curve for peak 2 for the 33 BisA sample crosses that for the 44 BisA sample at 230 °C. It is interesting that the 44 BisA curve exhibits slightly downward curvature at lower temperatures.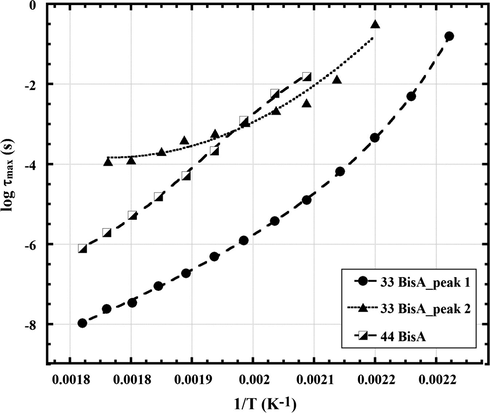
Log10 τmax vs. T−1 plots for peaks in the region of the α relaxation for epoxy networks formed using 44 and 33 BisA crosslinkers.
Vogel temperatures extracted from fitting Eq. (4) to the data in Fig. 13 were 349 K and 370 K for 44 BisA and 33 BisA (main peak), respectively. As commonly interpreted, higher TV corresponds to more efficient chain packing, i.e., lower free volume, in an hypothetical equilibrium-like state arrived at by quasi-static cooling. Given this view, a lower specific volume for the 33 BisA sample would suggest more efficient chain packing and therefore a higher glass transition, although observed Tg of the 33 BisA sample is lower than that of the 44 BisA sample, which requires an explanation. A positron annihilation lifetime spectroscopic analysis of free volume, as well as fluid uptake measurements, confirmed that the average hole (free volume) size was different in epoxy networks cured with 33 BisA as compared to 44 BisA isomers (Jackson et al., 2011). The amine isomer substitution altered reaction kinetics to produce different network architectures and molecular packing densities while keeping the chemical compositions of the network identical. 33 BisA exhibited smaller holes compared to 44 BisA (77 vs. 82 Å3, respectively) which is in harmony with the above-stated result of having lower specific volume for the 33 BisA sample on the basis of comparative TV values. Liquid uptake kinetics were faster for 44 BisA compared to 33 BisA networks: 44 BisA methyl ether ketone (MEK) mass uptake equilibrates at ∼2000 h compared to 6000 h for 33 BisA. Thus, smaller holes appear to restrict MEK sorption (Jackson et al., 2011).
3.3.3 Kramers–Krönig integral transformation applied to dielectric spectra in the dynamic glass transition region
Eq. (5) shows ɛ″ at a given frequency ω0 as the sum of two terms. The first term is an Ohmic resistance term (as in Eq. (1)) and the second term is an integral designated ɛ″kk which is the Kramers–Krönig (KK) integral transformation from the real to the imaginary permittivity evaluated at ω0 (Steeman and Turnhout, 1997; Wübbenhorst and Turnhout, 2002):
As discussed for Eq. (1) the relaxation terms in the sum become more distinct after subtraction of the obscuring dc conduction term from measured values of ɛ″(ω0) point-by-point over the frequency range. Eq. (5) offers an alternative route to this correction for conductivity that avoids the necessity of such a subtraction due to the fact that the integral ɛ″kk contains only the real permittivity which does not involve dc conductance. Therefore, pure relaxations can be extracted knowing experimental ɛ′ values over a broad frequency range and performing a numerical integration that yields ɛ″kk.
KK transformations were calculated using software from an algorithm developed by Steeman and van Turnhout in C programming language under the Linux operating system. The reader is referred to the original papers for details (Steeman and Turnhout, 1997; Wübbenhorst and Turnhout, 2002). ɛ″kk vs. f was calculated in this way for the 33 BisA sample from experimental ɛ′(ω) data for high temperatures using this program and the results are shown in Fig. 14. The resolution of this peak is better and its variance with temperature appears more distinct than that seen in the dc-subtracted spectra in Fig. 12 for the 33 BisA sample. As in the subtracted spectra, the bimodal character of the Tg-related peak for the 33 BisA sample is revealed by the KK transformation where the splitting becomes more distinct with increased temperature. It is interesting that the twin peaks seen in Figs. 2 and 4 are not present beneath Tg and only overlapping above Tg in Fig. 14. The similar results that are seen for these two different computational approaches are encouraging with regard to the use of the KK transformation.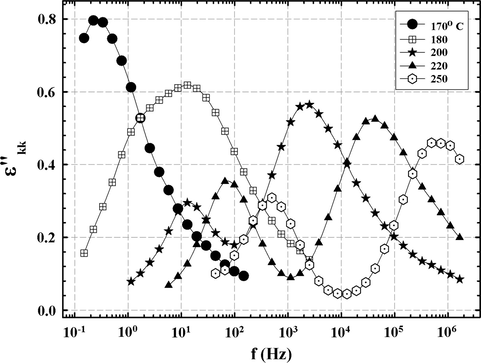
ɛ″kk vs. f at temperatures for which the α relaxation is visible for the 33 BisA-crosslinked sample.
Also, there is no signature of sample-electrode interfacial polarization relaxation on the loss spectra (i.e., downturn from high ɛ″ values in proceeding to the lowest frequencies) (Klein et al., 2006; Chen et al., 2011; Atorngitjawat and Runt, 2007).
ɛ″kk was also calculated in the same way for the 44 BisA sample at different temperatures and the results are shown in Fig. 15. The glass transition–related peak at high f shifts to the right with increase in temperature, as usual. However, the dominant feature is one that extends from low f into higher frequencies. The slight downward curvature of the graphs in proceeding to low f is tentatively assumed to be due to a superposition of high frequency wings of off-scale peaks arising from sample-electrode interfacial polarization relaxation (Klein et al., 2006; Chen et al., 2011; Atorngitjawat and Runt, 2007). This suggestion is supported by corresponding high ɛ′ values at low f (figure not shown). This feature monotonically shifts upward with increase in temperature which can be explained in terms of charges in the near-electrode regions attaining more mobility causing greater positive–negative charge separation especially since segmental mobility for T > Tg can facilitate charge hopping (Zhang and Runt, 2004). This feature is not seen in ɛ″kk spectra for the 33 BisA sample. While this difference is not understood, it may be due to differences in the nature of crosslinking topology.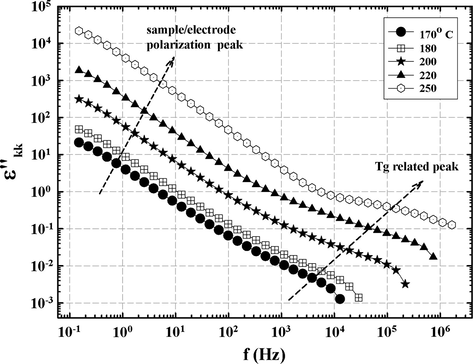
ɛ″kk vs. f at indicated temperatures for the 44 BisA sample. The dashed arrow to the right indicates the shift in the dynamic glass transition to higher f with increase in temperature.
It is important to note that the Kramers–Krönig transformation is model-independent, and, as such, is not linked to the dipole rotation mechanism as it is in the Debye model and its subsequent improvements and variations. In short, it does not require a molecular underpinning and does not impart a bias in data transformation.
3.3.4 Distribution of relaxation times (DRT) for Tg-related peaks
In the Havriliak–Negami equation the empirical parameters α and β determine the distribution of relaxation times, G(τ), such that α characterizes the breadth and β, by its deviation from unity, characterizes the degree of curve asymmetry (Havriliak and Negami, 1967). G(τ) is given by the following equation (Havriliak and Negami, 1967):
The angular quantity Θi has units of radians such that (0 ⩽ Θi ⩽ π).
G(τ) plots at 250 °C for the 33 BisA and 44 BisA samples are shown in Fig. 16. A bimodal curve is expected and is in fact observed for the 33 BisA sample while the 44 BisA sample has a broader DRT, perhaps reflecting a broad distribution of molecular weight between crosslinks. In considering ‘distribution’ it should be appreciated that the time scale is logarithmic so that time intervals are compressed in proceeding to the right on the axis. The 33 BisA sample would seem to have an inhomogeneous network structure, composed of two distinct regions, as discussed earlier.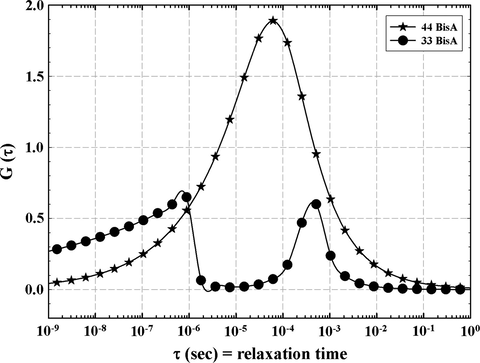
Distributions of relaxation times at 250 °C for resins formed from 44 BisA and 33 BisA crosslinkers.
4 Conclusions
Broadband dielectric spectroscopy, in conjunction with dynamic mechanical analysis, was used to probe macromolecular motions in epoxy networks formed from the diglycidyl ether of bisphenol A and 3,3′- and 4,4′-diaminodiphenyl sulfone isomer crosslinkers. The dynamics of secondary relaxations and the glass transition of fully cured networks were analyzed by fitting the Havriliak–Negami equation to the dielectric spectra.
A sub-Tg γ relaxation peak maximum shifts to higher frequencies with increasing temperature in Arrhenius fashion with essentially the same activation energies for the use of both crosslinkers suggesting the same mechanism in both cases, namely local motions consisting of phenyl ring flipping in the main DGEBA chain as facilitated by adjacent flexible ether linkages.
Analysis of an observed β relaxation suggests different distributions of local free volume within the network formed from 33 BisA as compared to 44 BisA; the former is proposed to have a greater crosslink density so that a higher number of hydroxyl groups are formed during the curing and there is decreased overall chain length compared to 44 BisA.
An α relaxation, associated with a glass transition, has a peak that is very broad for 44 BisA and occurs at a lower frequency than that for 33 BisA which indicates slower chain motions in the former. This result is in harmony with the DMA results in which Tg is almost 50 °C higher for samples cured with 44 BisA. The relaxation for the 33 BisA sample is bimodal while that of 44 BisA consists of a single broad peak. The bimodal character for the 33 BisA sample suggests two distinct material environments at least on the distance scale of long range segmental motions. The curvature, as opposed to linearity, of log relaxation time vs. inverse temperature plots indicated Vogel–Fulcher–Tammann–Hesse behavior for both networks, which suggests a glass-forming system which, in turn, reinforces that the observed α process is a glass transition. The higher Vogel temperature for the 3,3′- relative to the 4,4′-crosslinked system suggests lower free volume per mass, or more efficient packing of the local space surrounding the mobile dipolar segments in the former.
The Kramers–Krönig integral transformation was used to calculate dc-free ɛ″ vs. f relaxation peaks from experimental ɛ′ vs. f data. This mathematical procedure eliminates the need to directly subtract a dc conductivity contribution from experimental ɛ″ vs. f curves as with the H–N equation. The K–K-transformation resulted in well-resolved α relaxation peaks for the 33 BisA crosslinked samples.
Distribution-of-relaxation-times curves were bi-modal for the 3,3′-diaminodiphenyl sulfone based resin, which, again, suggests microstructural heterogeneity in the form of two distinct regions, possibly in terms of different crosslink densities. On the other hand, the DRT curve for 4,4′- was mono-modal and broad.
It is a general conclusion that broadband dielectric spectroscopy is a useful tool to interrogate long and short ranged motions and thermal transitions over a range of temperatures in crosslinked polymers. Knowledge of the time and distance scales of these motions, in turn, can provide information useful in understanding the thermal, mechanical, dielectric and permeation properties of this important class of materials.
Acknowledgments
The authors would like to acknowledge the support of the U.S. Office of Naval Research, Award N00014-07-1-1057 and fellowship support from the Department of Education Graduate Assistance in Areas of National Need Award P200A090066. MKH would like to acknowledge the Qatar University's financial support through the Center for Advanced Materials' Start-Up grant.
References
- Macromolecules. 2007;40:991-996.
- Eur. Polym. J.. 2011;47:1936-1948.
- J. Adhes.. 1985;18:73-90.
- Faraday Discuss. Chem. Soc.. 1979;68:26-45.
- J. Macromol. Sci. Part B Phys.. 1976;12:1-11.
- J. Am. Ceram. Soc.. 1923;8:339.
- J. Polym. Sci. Polym. Symp.. 1966;14:99.
- Polymer. 1967;8:161.
- Polymer Chemistry (second ed.). Boca Raton, FL: CRC Press; 2007. p. 404
- Polymer. 2011;52:4528-4535.
- J. Appl. Polym. Sci.. 1979;24:2375-2387.
- J. Chem. Phys.. 2006;124:144903.
- Broadband Dielectric Spectroscopy. Berlin: Springer; 2003. p. 225
- Mangion, M.B.M., 1990. PhD Thesis. McMaster University.
- J. Polym. Sci. Part B Polym. Phys.. 1990;28:71-83.
- Macromolecules. 1989;22:4483.
- Macromolecules. 1990;23:1380.
- Polymer. 1987;28:2023-2031.
- J. Colloid Interface Sci.. 1982;90:117.
- J. Polym. Sci. Part B Polym. Phys.. 1982;20:689-699.
- J. Polym. Sci. Part B Polym. Phys.. 1986;24:1271-1282.
- J. Polym. Sci. Part B Polym. Phys.. 1986;24:2185-2195.
- J. Polym. Sci. Part B Polym. Phys.. 1987;25:1817-1827.
- Epoxy–aromatic amine networks in the glassy state: structure and properties. In: Dušek K., ed. Advances in Polymer Science: Epoxy Resins and Composites IV. Vol vol. 80. Verlag Berlin Heidelberg: Springer; 1986. p. :49-99.
- [Google Scholar]
- Macromolecules. 2007;40:3886-3890.
- J. Power Sources. 2007;172:72-77.
- J. Coat. Tech.. 1996;68(861):97-106.
- Dielectric analysis of thermoset cure. In: Dušek K., ed. Advances in Polymer Science: Epoxy Resins and Composites IV. Vol vol. 80. Verlag Berlin Heidelberg: Springer; 1986. p. :1-47.
- [Google Scholar]
- J. Polym. Sci. Part B Polym. Phys.. 1984;22:1461-1470.
- Colloid Polym. Sci.. 1997;275:106-115.
- Z. Anorg. Allgem. Chem.. 1926;156:245.
- Tu, J., Tucker, S.J., Sayed, A.R., Jarrett, W.L., Wiggins, J.S., 2011. In: Proceedings of the International Symposium of the Society for the Advancement of Material and Process Engineering, Fort Worth, TX, October 2011.
- Tucker, S.J., 2010. PhD Thesis. The University of Southern Mississippi.
- Composites Part A Appl. Sci. Manuf.. 2010;41(10):1441-1446.
- Phys. Z.. 1921;22:645.
- Polymer. 2006;47:1960-1969.
- J. Non-Cryst. Solids. 2002;305:40-49.
- J. Phys. Chem. B. 2004;108:6295-6302.


