

Polyurethane glycolysate from industrial waste recycling to develop low dielectric constant, thermally stable materials suitable for the electronics
⁎Corresponding author at: International and Interuniversity Centre for Nanoscience and Nanotechnology, Mahatma Gandhi University, P.D. Hills P.O., Kottayam, India. sabuthomas@mgu.ac.in (Sabu Thomas) arunimarenjith02@gmail.com (Sabu Thomas)
-
Received: ,
Accepted: ,
This article was originally published by Elsevier and was migrated to Scientific Scholar after the change of Publisher.
Peer review under responsibility of King Saud University.
Abstract
We are utilizing a new method to improve the dielectric properties of a conventional polymer using a recycled polymer product. The polyurethane foams are recycled by glycolysis process and the derived material was applied to improve the dielectric properties of the brittle DGEBA epoxy resin. Two main parameters that determine the applicability of the material as a dielectric (the dielectric constant and dielectric loss), were studied at room temperature for all the blends. The properties like dielectric constant and modulus were found to be very low by the inclusion of the different compositions of recycled polyurethane. 20 phr blend was selected for optimum properties and it shows a lower dissipation factor of 1.5 × 10⁻². The blends are advised as good candidates for the use in microelectronics as insulations, encapsulation and or circuit boards. We presented here an easy to process material with all the good properties require for a dielectric material. The thermal and dielectric data showed improvement than the neat polymers. The dielectric data was supported by the low water uptake of 0.5% by 20 phr blend and slightly increased contact angle from 63° to 77°.
Keywords
Recycled product
Glycolysis
Dielectric properties
IPN structure

1 Introduction
Epoxy resins are an important class of thermosets and the innumerable applications of them continues to expand. They are ordinarily utilized in industry as adhesives, coatings and as matrices for composite materials. They find application in the flooring to aerospace because of their high thermal stability, chemical resistance, high dimensional stability and good engineering properties like high modulus, low creep, etc. The brittle nature of the epoxies by the presence of crosslinks can be changed by the addition of a second phase, normally elastomers, thermoplastics and fillers. Tremendous work is being done to toughen epoxies using these second phase materials. Rubber or elastomer toughening is the easiest method to improve the mechanical properties because of the better dispersion of elastomeric particles in the epoxy matrix (Yan et al., 2012; Ozturk et al., 2001; Mathew et al., 2014; Qi et al., 2011; Jansen et al., 1999). One major downside of the rubber toughened systems is that they possess low modulus. A better result is obtained for block co polymer toughened epoxy systems (Martin-Gallego et al., 2015; Francis et al., 2006; Jyotishkumar et al., 2009). The particular structure of the blocks will contribute towards the enhancement of the mechanical as well as thermal properties of the matrix.
Epoxy resins are used in the microelectronic industry as a protective coating, electronic material packaging etc (Akbaş et al., 2009). Epoxy composites are being used in the high voltage industry (Gonon et al., 2005). They are used as insulating materials because of their excellent moisture, solvent and chemical resistance. To complete the requirements of electronic packaging, novel epoxies with improved electrical insulating properties and enhanced thermal properties have to be developed. The favorable properties of a material to use as a dielectric material in electronic industry are low dielectric constant and dielectric loss. This criteria is not satisfied simultaneously by the added fillers all the time. Normally silicates and clay are added into the epoxy matrix to obtain the low values of dielectric constants. In addition the system must possess low moisture uptake and should have high thermal stability. The dielectric properties and the water absorption of epoxies was studied by Maxwell and Pethrick (1983). They suggested that the absorbed water can affect the values of dielectric parameters since the polarity is induced by the presence of water molecules. Dielectric spectroscopy was used to study the ageing behavior of rubber filled epoxies by Ivanova et al. (2000). It can be used as a tool to study the cure kinetics and curing reaction of epoxy blends and composite (Saad et al., 2015; Levita et al., 1996; Alig and Jenninger, 1998). Lower dielectric constants can be obtained by epoxy-POSS composites at conditions of low temperature, high frequency and high concentration of POSS (Huang et al., 2014). The low dielectric constant substances can also be derived from silica based and carbon based fillers. Some organic polymers are also used for this purpose. But the compromise in damping is unavoidable in these cases (Maex et al., 2013) Here polyurethanes are employed as modifier for DGEBA epoxy resin. They are composed of long and flexible soft and highly polar hard segment respectively from the glycol and isocyanate part of the precursors. Polyurethanes found its place in the industry because of its wide use in furniture, manufacturer of flexible, high-resilience foam seating, rigid foam insulation panels, elastomeric wheels and tires, electrical potting compounds, high performance adhesives etc. Polyurethanes are selected to reinforce the epoxy matrix because of the possibility of interactions and network formation. When segmented polyurethanes are incorporated into the epoxy matrix, the hard segments will contribute to improved toughness whereas the soft segment adds towards the modulus. Polyurethanes have high elongation and tensile strength. Hence polyurethanes are one of the excellent materials by which one can improve the properties of epoxy matrix without compromising the desired properties. Polyurethane bears a major advantage of recyclability. PU and PET are mainly recyclable polymers. Polyurethane recycling is a topic in which a number of research teams are dealing with. The leading techniques adopted for the PU recycling are glycolysis, ammonolysis, hydrolysis and pyrolysis. Industrial recycling largely involves ammonolysis. Glycolysis is among the simplest and effective methods of polyurethane recycling (García et al., 2013; Borda et al., 2000; Datta, 2012). During this process the waste polyurethane foams are crushed and reacted with a glycol at ambient conditions of temperatures to produce a new type of recycled polyol. These are further separated to react with isocyanate to produce new polyurethanes. The newly obtained polyurethane possesses almost all the properties of the previous one and can be thus used for all its applications.
Here we tried to enhance the properties of the DGEBA epoxy resin by the addition of the recycled product from waste polyurethane foam. The attempt is known to be first of its kind. The resultant product is being suggested for microelectronic industry. In order to assure the applicability of the material in the electronic industry, the dielectric analysis was carried at room temperature for a wide range of frequency from 40 Hz to 110 MHz. From the results it was observed that the dielectric constant was found to be decreasing for all the blends, especially for higher content of the recycled PU which will promote the conception of more amount of recycled PU. The dielectric properties are affected by the moisture uptake and thermal properties. A material will be suitable for insulation purposes in the microelectronic industry only if it has a low dielectric constant, high thermal stability and low moisture absorption. In this work, we have prepared epoxy–recycled polyurethane blends and characterized them using thermo gravimetric analysis to determine the stability of the blends. Contact angle measurements were done to understand about the surface absorption of water molecules by the blends. Tests were also carried out to check the change in water absorption by the addition of modifier in the epoxy network.
2 Materials and methods
Epoxy resin used was diglycidyl ether of bisphenol-A (DGEBA) (Lapox L-12, Atul Ltd., India.) The epoxy content in Lapox L-12 varies between 5.25 and 5.40 equiv/kg. Lapox L-12 has a density of about 1.15–1.2 g/cm3. The hardener, 4, 4′-diaminodiphenylsulfone (DDS) (Lapox K-10, Atul Ltd., India), a white powder with a melting point of 178 °C, has a pot life of approximately 75–115 min at 25 °C.
For the synthesis of PU elastomer, 4,4′-methyldiphenyl diisocyanate (MDI) was purchased from Borsodchem, Hungary. Second reagent was the polyol mixture consists of glycolysate and commercial polyol with the same parts (50:50 by % of mass). Glycolysate component was a glycolysis product of PU foam decomposition. Commercial polyol – oligo(ethylene-butylene) adipate under the name POLES 55/20 having molecular mass 2000, LOH = 56.1 mg KOH/g, η50 °C = 1242 Pa·s was manufactured by Organika – Zachem S.A. Poland. During reaction MDI with polyol mixture prepolymer with —NCO terminated groups was obtained. Phosphoric (V) acid from POCH, Poland was applied as side reactions inhibitor. Butanediol (BDO) used as a chain extender of prepolymer was supplied by BASF, Germany. Prepared elastomer samples were conditioned in laboratory oven at 100 °C for 24 h.
2.1 Recycling of polyurethane
Glycolysate polyol used in the polyol mixture in the preparation of the elastomer samples was obtained from elastic foam as industrial waste during decomposition process with hexamethylene glycol (HDO). Potassium acetate (KAc) was used as a catalyst. The process was performed at temperature a little below of boiling point of HDO. The decomposition was carried out under atmospheric pressure for 60 min. The mass ratio of the elastic foam to glycol HDO was 10:1. Details of method and glycolysate characteristics are described at paper of authors (Datta et al., 2008; Datta, 2008; Œrodki and Ce, 2007).
2.2 Structures of the materials used
2.2.1 Characterization techniques
The dielectric measurements were made by Agilent 4294A Precision Impedance Analyzer equipment with Agilent 16451B Test Fixture. The frequency range was from 40 Hz to 110 MHz The thickness of the samples was in 2–3 mm range. The samples were of the dimensions 2.5 × 2.5 cm2.
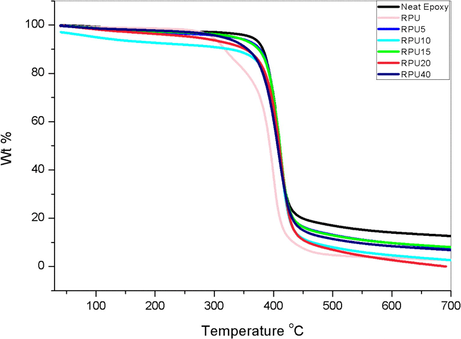
Thermo gravimetric analysis was done using a Perkin Elmer Diamond TG/DTA (see Fig. 1). The studies were carried out from room temperature to 700 °C at a heating rate of 10 °C/min. under N2 atmosphere.
- Structures of the matrix and hardener used.
The samples for water sorption studies were cut from the sheets of blends in circular shape. The samples have a thickness nearly 2–3 mm. The samples were weighed and placed in a definite amount of water, say 50 ml. The weight change was measured by taking the samples out of the water at regular intervals. The samples are wiped to remove excess water and then weighed. The samples were then replaced with water. The process is continued till a constant value which indicates equilibrium, is reached.
Contact angle measurements were carried out in SEO Phoenix Contact Angle Analyzer 300 contact angle telescope-goniometer. Measurements were carried out with water (triply distilled) on samples of size 1 × 1 × 2 cm at room temperature. The volume of the sessile drop was maintained as 5 µl in all cases using a micro syringe. The contact angle was measured within 45–60 s of the addition of the liquid drop with an accuracy of ±1°. Measurements were repeated five times with different test pieces of the same sample to check the accuracy. Also contact angles were measured with definite time intervals for a single drop and the measurements were recorded.
2.3 Results and discussion
2.3.1 Dielectric measurements
The important terms to be discussed while doing a dielectric measurement are the dielectric permittivity, dielectric loss, modulus, conductivity, etc.
Relative permittivity can be express in complex form as in Eq. (1) below:
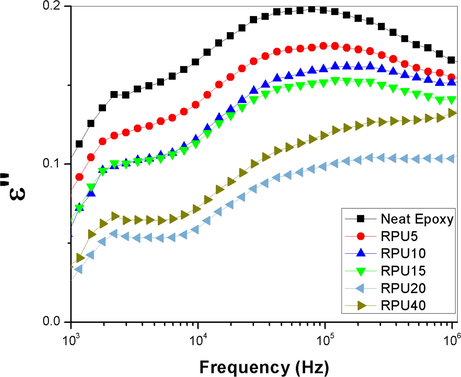
It consists of the real part which is dielectric constant and the imaginary part which is the dielectric loss (see Fig. 2).
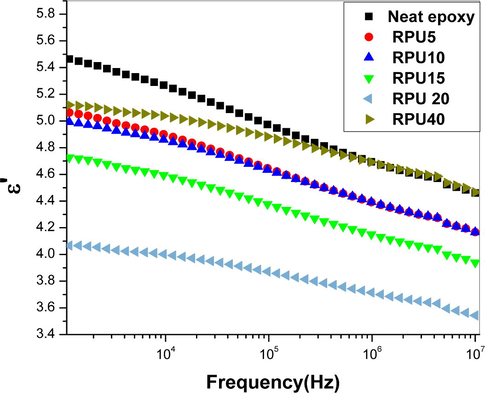
- Plot of variation in dielectric constant as a function of frequency.
For epoxies it is well known that they have very good dielectric properties. Any attempt to make them tough will alter some of their electrical characteristics, especially when modified with nanoparticles and elastomers. The nature of the filler affects the dielectric properties of the epoxy matrix. Here a new reinforcing agent was introduced, which improved the dielectric properties of the brittle epoxy without changing any of its good properties. The dielectric constant, dielectric loss, modulus, etc. was plotted as a function of frequency. The measurement was done for a wide range of frequency and for convenience selected range was used for explanation. The permittivity values depend on different polarization phenomena which come into action when imperiled to an electric field. And the permittivity values increases with increase in degree of polarization. The Fig. 2 shows the changes produced by the incorporation of recycled polyurethane in the dielectric constant of the epoxy blends. It is graspable that the dielectric constant of the blends is showing a decreasing trend, 20 phr among them is showing the least. Normally the permittivity values of polymeric systems are frequency dependent. Like the usual style, the dielectric constant at low frequencies is slightly higher as the polymer chains have more time to relax also the high values of dielectric constant at initial stages can be ascribed to the interfacial polarization effects. In the case of epoxies, when cured with amine hardeners, the value of permittivity will be affected by the number of orientable dipoles in the system and their ability to orient in the applied electric field (Singha and Thomas, 2008; Nelson and Hu, 2005). As the frequency increases, lesser time is available for the polymer chains to relax and orient. Hence the permittivity values are decreasing with increase in frequency. All the systems show higher dielectric constant at a frequency 1000 Hz. From the plot of permittivity, it is interesting to note that even the lowest concentration of RPU (5 phr) can decrease the permittivity values. In the whole frequency range, all the blends possess low permittivity than the neat epoxies as shown in Fig. 2. Increasing the concentration of the RPU result in the simultaneous reduction in the dielectric constant (ε′). Adding RPU above 20 phr reverses the trend and increases the value of ε′, but still lower than neat epoxy and it is noted that above a frequency of 105 Hz, the value becomes almost same as that of neat epoxy. Our previous studies showed that the recycled polyurethane and epoxy forms ordered network like structure after 20 phr addition of RPU (Reghunadhan et al., 2017). At this stage, for the RPU 40 sample, some amount RPU is dissolved in epoxy and some part phase separate into nanoscopic domains. The RPU forming network will not be available for polarization under external field. But the free RPU dissolved in epoxy resin, still may have a tendency to align along the field, because of the presence of polar moieties. This may lead to an increase in the permittivity values and they become close to the neat epoxy.
Another important consideration of the materials is the dielectric breakdown strength. Substances with high dielectric constants will undergo break down easily under intense electric fields, but materials with low dielectric constants resist the breakdown even at high electric fields. From the previous experiments done by us with the epoxy recycled polyurethane blend system shows that the two polymers can form networks very effectively. This network formation decreases the tendency of the charged particles to be polarized in the electric field. The rigid nature of the added polymer and the high level of molecular packing prevent the polarization or polarized relaxation very effectively. This prevention leads to a lowered value for the dielectric constants. Also, we assume that the polyurethane is dispersed as nanometer scale particles in the epoxy matrix. This will contribute to the low dielectric constant of the blends.
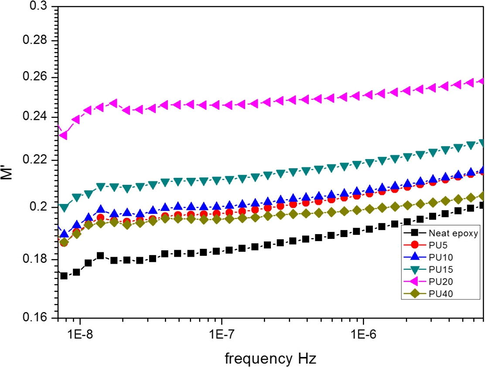
In the case of two phase systems, the relaxation processes may be better resolved in the complex dielectric modulus plot. So, the molecular chain relaxations can also be understood from the modulus spectra. The complex dielectric modulus is an important parameter for dielectric materials. It is the reciprocal of dielectric permittivity,
The electric modulus represents the dynamic properties of a material. In the present system, the real and imaginary part of the modulus is plotted as a function of frequency. In Fig. 3, the values of real part of modulus are increasing with increasing concentration of polyurethane and also with increase in frequency. Frequency response of PU40 does not behave this trend and is shifted toward lower values. And the imaginary part is showing a decrease with increase in PU concentration and increase with increase in frequency (see Fig. 4).
- Plot of variation in real part of dielectric modulus as a function of frequency.
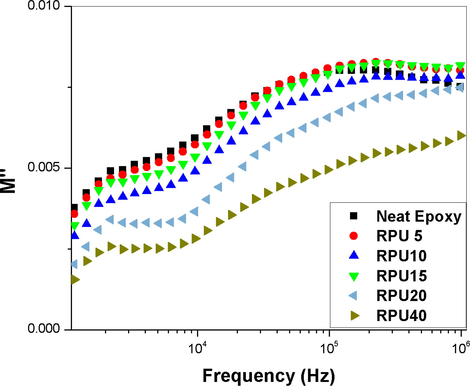
- Plot of variation in imaginary part of dielectric modulus as a function of frequency.
Frequency spectrum of the imaginary part of the dielectric module reveals two relaxation processes. Low frequency relaxation peak has a falling tendency with increasing RPU, it is apparent decrease in its significance in the overall process of relaxation of the material. The high-process relaxation shows a tendency to a wider distribution of relaxation times. Relaxation processes occurring in low frequencies can be assigned to the matrix processes and at high frequency can however be attributed to dispersed phase (RPU).
A small hump at lower frequencies is observed for all the systems. It can be ascribed to the relaxation of the aromatic system present. Both epoxy and RPU is having aromatic rings in their main chain. The conformational changes in the epoxy system, especially the diglycydyl moiety is unavoidable by the application of a vibrating frequency. These changes are more clear at lower frequencies. Among the blends, the blend with 20 phr is showing the highest value for electric modulus at all frequencies. The dielectric modulus results are showing the reverse of dielectric constant which confirms that the sample-electrode polarization is absent for the blends (Wan et al., 2008). The variation of the dielectric modulus values with frequency is not much and it seems that the values are not much dependent on the frequency. Even then every small changes are recorded. The variation of the imaginary part of the modulus shows a similar behavior to that of the dielectric loss. So it can be stated that the sample-electrode interface polarization is very less or absent.
Fig. 6 shows the deviation in the loss modulus of the neat epoxy and its blend with the recycled polyurethane. Here also the blends are showing very lower value of dielectric loss. The dielectric loss is showing a lower value at lower frequency regions, but with increasing frequency, the modulus peaks up and then decreases. The blend with 20 phr of recycled PU is showing the smallest of loss over the range of frequency. Frequency response of the blend with 40 phr of RPU is shifted towards higher values. From frequency courses of complex permittivity it can be concluded that in the test samples there is one non-Debye relaxation process, shifted toward higher frequencies with volume of recycled PU. Dielectric loss is the inability of the polarization process in a molecule to follow the rate of change of the applied oscillating electric field. The dielectric loss is related to the dielectric relaxation time. It is the time taken for the dipoles to return to their original position after the application of the electric field. Here in this study, the recycled polyurethane forms IPN with the epoxy. Polyurethanes normally undergo the three types of polarizations- interfacial, dipolar and ionic. So the ε’values for polyurethane will be higher at lower frequency. But here, even though there are polar bonds like N—H, C⚌O etc. and CH2 (which can produce crank shaft motion), present in the polyurethane chains, the network structure formed between epoxy and PU prevents the motion of the dipoles and the polarization get arrested. It is obvious that such polar groups are directly affected by the electric stimulus. A schematic representation of the polyurethane chains with polarizable groups is represented below in Fig. 5.
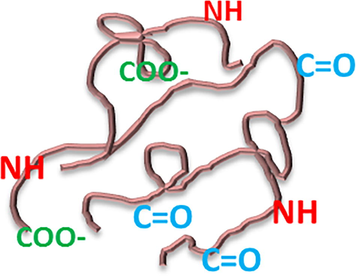
- Polarizable groups in the polyurethane chain.
- Plot of variation in dielectric loss as a function of frequency.
As the concentration of the recycled polyurethane increases, the effectiveness in the network is also increased. When it reaches the optimum concentration of 20 phr, the formed networks are strong enough to successfully shield the electric field from polarizing the polyurethane chains. Also as the network formation is progressing there will be a reduction in the number of polarizable functionalities. Here we assume that the polyurethane chains can be grafted on to the epoxy backbone. If it happens so, then there will be change in the double bonds and also the cyano groups. The results obtained so far supports effective dispersion of the recycled polyurethane in the epoxy matrix, and the formation of a network like structure within the blends. The optical clarity of the blends suggests the improved miscibility and reduction the size of the dispersed particle in the epoxy matrix. The network formation effectively retains the dielectric properties of the blends.
Tan δ is an important parameter when the material is considered for electrical and engineering applications. The loss tangent is theoretically the ratio of the loss to storage modulus and is a gauge of system’s lethargy towards polarization i.e.,
It is an important way to determine the miscibility of the polymer blend system. For miscible blend systems, there will be a single tan δ peak. These are similar to the DMA technique. Depending on the sensitivity of the instrument, the miscibility between two polymers with nearby glass transition can be understood unambiguously. The small glass transition like transition in the tan δ curves arise due to the vibrations relaxations of the aromatic moiety in the epoxy system, which is retained in the blends, since the polyurethane skeleton also contains aromatic rings. Zhang et al. (2002) reported the problems in the applicability of single glass transition for the study of miscibility of polymer blends. The IPN formations and nanometer scale interactions between two polymers also propose the existence of single glass transition. Here in this study we propose that the improvement in the dielectric properties of the epoxy resin is a result of the effective crosslinking and the effective network formation between the epoxy and polyurethane. Polyurethane has a normal tendency to form IPN like structures with most of the polymers. More clear evidence on the miscibility and the existence of single phase can only be received from the temperature controlled measurements. The dielectric dissipation factor is represented as a function of frequency in Fig. 7. Like the trend followed by loss and permittivity, the 20 phr blend shows a lower dissipation factor of 1.5 × 10⁻², favoring its applicability in the electronic industry. The tan δ values are lower in the low frequency range. As the frequency increases to the order of 106, the tan δ peaks are gradually increasing to a peak value and then slightly decreases. A sharp variation is not visible in the graphs. The blends with higher PU content are showing the least values over the whole range of frequency. In the case of the neat polymer and also the blends, the permittivity, loss and the damping factor is frequency dependent. The values show a clear variation with the frequency (see Figs. 8 and 9).
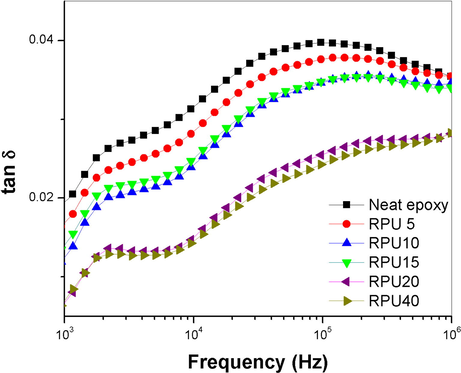
- Plot of variation in tan δ as a function of frequency.
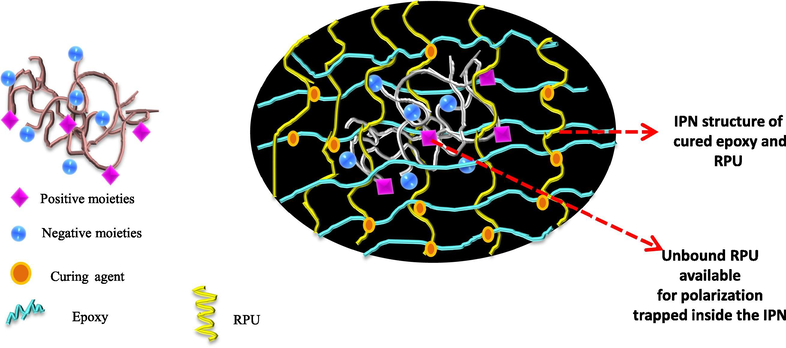
- Schematic representation of the effectiveness of network structure in shielding the polar groups of RPU. The schematic of the RPU with polarizable moieties (left) and polar groups that lie deep inside the network so that they will be shielded by the network formed around them (right).
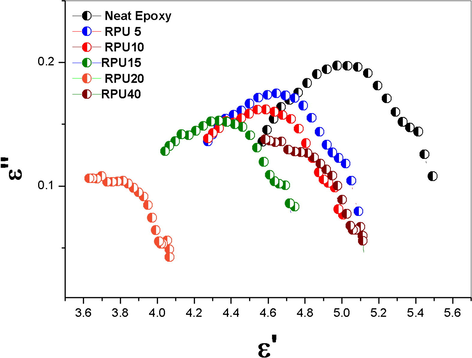
- Cole-Cole plot of neat epoxy and the blends with different concentration of RPU.
As mentioned previously, polyurethane is generally considered as a polar molecule. It contains many groups that tend to orient in the presence of an applied electric field and also the chain flexibility permit this orientation. Thus normally PU incorporated materials produce high dielectric constant. But the dielectric properties of polyurethane are frequency and temperature dependent. Here blending polyurethane with epoxy resin reduces the dielectric constant, which is attributed to the effective network formation between the two polymers. The crosslink formed between the epoxy and PU effectively shields the polar groups on the surface of PU, preventing their orientation with electric field. Here suggest that the two polymers are miscible in the nanometer scale and the formation of a strong network and as a result of IPN or grafting, improves the properties.
Cole-Cole diagram was constructed to understand the relaxation in the blend system. From the plots it was observed that the dielectric relaxation phenomena is not Debye single type relaxation and the plot is not centered in the ε′ axis. For all the samples the maximum appears at certain frequency. The maximum is varying with the addition of the recycled polyurethane and the higher composition of the RPU gives a shift towards lower values of the ε′. The amplitude decreases with increase in concentration of the RPU up to 20 phr and the sample RPU 40 shows a higher amplitude. Neat epoxy curve is at higher ε′ values. Similar non-Debye relaxation systems were explained using the Cole-Cole plot (Wang et al., 2016; Hill and Dissado, 2000; Cole, 1955). The Debye single time relaxations are normally observed in the rigid systems where the relaxations of all the samples will be relaxing at same relaxation time. In the case of non-rigid systems, the Debye relaxation is not possible because of the change in the local environments. Each relaxing unit may produce a range of relaxation time. This normally produces a tail in the relaxation function and exponential signals resulting in broadening .Normally non-Debye relaxations are a dominant observation in the materials used as insulators and semi-conductors thermal stability of the samples was examined using TGA and the results are shown in the Fig. 10. The thermo gravimetric analysis of the samples clearly indicates that there is no reduction in the thermal stability of the epoxy resin by the introduction of the recycled polyurethane phase into it. The neat epoxy polymer as well as the blends are following a one step degradation process (Denq et al., 1999). The recycled polyurethane is showing the usual trend of polyurethanes with two step degradation (see Figs. 11 and 12).
- TGA curves for the neat polymers and blends.
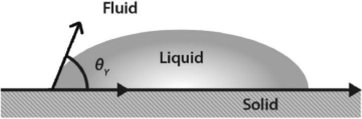
- Schematic representation of formation of contact angle.
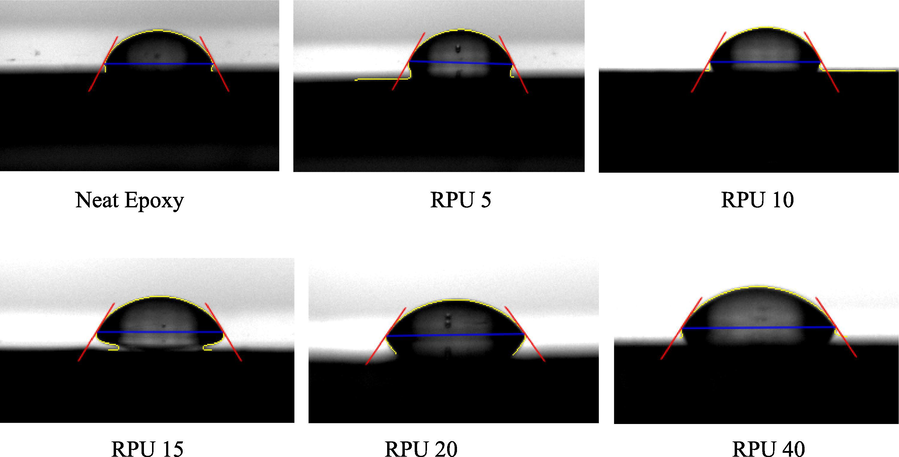
- Contact angle images recorded for the neat epoxy and blends with different amount of recycled polyurethane.
The values of 10% weight loss are given in the Table 1. From the table, it is noted that the values of neat epoxy is high compared to that of the blends. The 10% degradation values for the lower concentration of RPU are closer to the value of neat epoxy and much higher than the neat RPU. The reduction in these values may be due to the flexibilisation of the chains of the epoxy by the addition of the recycled polyurethane, which reduces the crosslinks between the polymer chains (Hoang et al., 2012). The penetrated networks helps in improving the dielectric properties. There is a mutual enhancement of properties between the two polymers. Here the thermal stability of the recycled polyurethane is improved on addition to the epoxy matrix. The two step degradation is suppressed in the case of the blends.
| Sample | Neat epoxy | RPU | RPU 5 | RPU 10 | RPU 15 | RPU 20 | RPU40 |
|---|---|---|---|---|---|---|---|
| T10% | 381.8 | 317.8 | 377.8 | 330.5 | 374.4 | 353.3 | 356.86 |
2.3.2 Contact angle studies
The contact angle is the angle formed between a solid and a liquid when they come in contact. More specifically, the contact angle is defined as the angle formed by the intersection of the liquid-solid interface and the liquid-vapor interface (geometrically acquired by applying a tangent line from the contact point along the liquid-vapor interface in the droplet profile).
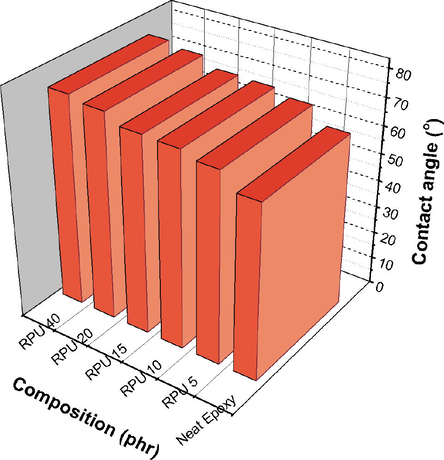
Measurement of contact angles and surface/interfacial tensions provides a better understanding of material compatibility. A negligible variation in all the results among the blends was observed. The contact angle obtained for different blend compositions with water are given below.
The contact angle values show that the blends are hydrophilic in nature. The hydrophilicity may be due to the presence of polar-polar interaction between water molecules and the polyurethane residue. There are a number of polar groups like C⚌O, COO— etc. in polyurethane, this will have a tendency to interact with the water. Even though the interactions are less due to the overlapped epoxy chains, the small deviations in the contact angle values are unavoidable. The contact angle values are given in the Table 2 and there is a small increase in the values with an increase in the amount of the added filler. When the amount of the filler reaches 20 phr, the value of contact angle improved from 63° to 77°. That is it tends to approach the hydrophobic values. This increase of about 23% is attributed to the interactions between epoxy and RPU rather than the water molecules and RPU. The polarity of the RPU chains is masked by the IPN formed by epoxy and RPU at higher concentrations. The network is so effective that the penetration of the water molecules becomes difficult. As explained in the case of dielectric values, at lower concentrations of RPU there is enough space for the polar moieties in the RPU chains to mobilize. They do so and it is in the presence of the epoxy chains bound to the RPU chains. This will slow down the possible interactions between polar points of RPU and water molecules.
| Sample | Neat epoxy | RPU 5 | RPU 10 | RPU 15 | RPU 20 | RPU 40 |
|---|---|---|---|---|---|---|
| Contact angle value (°) | 63.5 | 69.3 | 71.4 | 71.9 | 75.3 | 77.0 |
Clear support of the retardation of the polarization effect is obtained from the contact angle values. The plot of contact values as a function of the blend composition is given in Fig. 13. All the blends have a higher value of contact angle than the neat epoxy. The surface roughness also has an influence on the contact angle values (see Fig. 14).
- Comparison of contact angle values for the epoxy-RPU blends.
- Water absorption of selected blends as a function of time.
2.3.3 Water absorption
Water is having a high dielectric constant. So the presence of any trace of water trapped or absorbed will change the desired properties of dielectric materials (Blanco et al., 2006).
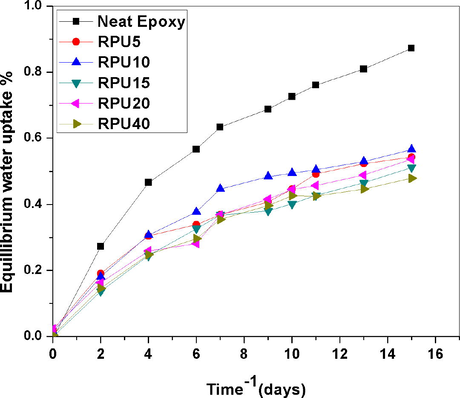
Hence it is necessary to determine the percentage of water absorbed by the samples. Water sorption, (expressed as weight %) was calculated as the difference between the dry mass of the resin disk before water sorption and after each immersion time until reaching a plateau (i.e. maximal water sorption). The percentage water uptake was plotted against time in days. Selected compositions of blends were used for the water sorption studies. From the plot it was found that the water absorption by the neat as well as blends was very low. It may be attributed to the high degree of crosslinking of epoxy resin. In normal case the water sorption and moisture uptake of epoxy resins are very slow. From the experimental values, it can be stated that the network formation slows down the penetration of water droplets through the blend. This assumption is represented schematically in Fig. 15. As the time increases, the amount of water diffusing into the epoxy matrix increases very slightly and goes on increasing to reach an equilibrium value. The graphs showed a Fickian like behavior. Fickian behavior can be confirmed from the observations that the graph is initially linear and the graph tends to bent. The curves become concave to the abscissa. In the case of epoxy resins, since the process is utterly slow, the normal shape of the curve is not observed (see Fig. 16).
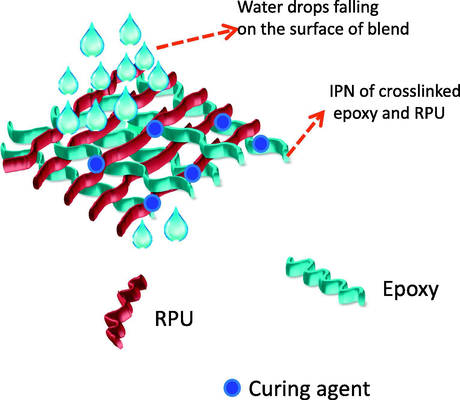
- Assumption of limited water penetration through the IPN formed between epoxy and PU.
- Variation in the amount of water absorption of blends.
From the graph, we can clearly conclude that even after 16 days the curves are not attaining the exact equilibrium, this is due to the very slow absorption of water by epoxy network. The end portion of the graph is not leveling off, which indicates that the water sorption for epoxy system is a long process.
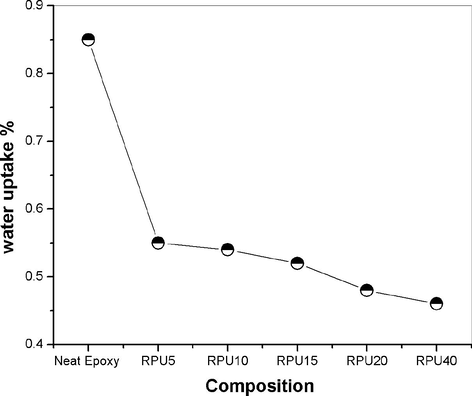
From the plots it is also understandable that the percentage water uptake is comparatively low for blends. For the neat epoxy resin the percentage water uptake is about 0.85% and it is reduced to a very low value of 0.45% for the 40 phr blends. The 20 phr blends also show a low value of about 0.5%. The consumption of higher amount of RPU can bring down the percentage absorption values. The water uptake values are halved by the addition of 40 phr recycled polyurethane. The explanation may be given as; the polyurethane is composed of both soft and hard segments. The segmented polyurethane when mixed with epoxy matrix form interpenetrating networks, which increase the hydrophobicity of the blends. It will be difficult for the water molecules to penetrate into the resin matrix. The decrease in the diffusivity of the water molecule into the formed IPNs decrease the water absorption percentage.
3 Conclusions
Recycled polyurethane obtained by the glycolysis of waste PU foam was found successful in the improvement of dielectric properties and they showed a frequency dependent behavior. All the blends exhibit lower dielectric constant and low dielectric loss. The properties of the blends favor its applications in the microelectronic industry. Especially the 20 phr blend has a very low value. The improved dielectric properties are the result of the nanoscopic phase separation of the RPU molecules in the epoxy matrix and also due to the formation of a network. The network is so efficient that it will shield the polarization effect of the polyurethane chains. The slight change in the degradation temperature is due to the presence of the flexible polyurethane elastomer. The dielectric properties of the blends are supported by the contact angle values and the water absorption values. The presence of the polar groups in the RPU couldn’t alter the nature of water absorption of the epoxy resins and it showed a decreased absorption in the presence of the polyurethane. For the neat epoxy resin the percentage water uptake is about 0.85% and it is reduced to a very low value of 0.45% for the 40 phr blends. The results show that as the content of the recycled polyurethane increases, the interaction between epoxy and RPU is increased and the interaction with the water molecules is decreased. The results suggest that the blends obtained by the addition of the recycled polyurethane can be considered as such or with slight modification in the microelectronic industry as circuit boards, dielectric coating, or encapsulating material etc.
Acknowledgement
One of the authors, Arunima Reghunadhan is thankful to University Grants Commission, New Delhi, for funding under JRF scheme.
References
- Dielectric properties of cured epoxy with teta. Ozean J. Appl. Sci.. 2009;2:443-449.
- [Google Scholar]
- Curing kinetics of phase separating epoxy thermosets studied by dielectric and calorimetric investigations: a simple model for the complex dielectric permittivity. J. Polym. Sci. Part B: Polym. Phys. 1998:2461-2470.
- [Google Scholar]
- Development of an epoxy system characterized by low water absorption and high thermomechanical performances. J. Appl. Polym. Sci.. 2006;100:4880-4887.
- [CrossRef] [Google Scholar]
- Glycolysis of polyurethane foams and elastomers. Polym. Degrad. Stab.. 2000;68:419-422.
- [CrossRef] [Google Scholar]
- On the analysis of dielectric relaxation measurements. J. Chem. Phys.. 1955;23:493.
- [CrossRef] [Google Scholar]
- Effect of glycols used as glycolysis agents on chemical structure and thermal stability of the produced glycolysates. J. Therm. Anal. Calorim.. 2012;109:517-520.
- [CrossRef] [Google Scholar]
- Datta, J., Pniewska, K., Zbadano, S., 2008. Synteza i w3aœciwoœci poliuretanów otrzymanych z glikolizatów uzyskiwanych z odpadowej pianki polieterouretanowej, pp. 0–5.
- Datta, J., 2008. Budowa, stabilnoœæ termiczna i w3aœciwoœci mechaniczne poliuretanów na podstawie glikolizatu odpadowej pianki poliuretanowej uzyskanego przy u ¿ yciu 1, 6-heksanodiolu jako glikolu.
- The curing reaction and physical properties of DGEBA/DETA epoxy resin blended with propyl ester phosphazene. J. Appl. Polym. Sci.. 1999;74:229-237.
- [CrossRef] [Google Scholar]
- Poly(ether ether ketone) with pendent methyl groups as a toughening agent for amine cured DGEBA epoxy resin. J. Mater. Sci.. 2006;41:5467-5479.
- [CrossRef] [Google Scholar]
- Glycolysis of flexible polyurethane wastes using stannous octoate as the catalyst: study on the influence of reaction. Polym. Degrad. Stab.. 2013;98:144-149.
- [CrossRef] [Google Scholar]
- Influence of high levels of water absorption on the resistivity and dielectric permittivity of epoxy composites. Polym. Test.. 2005;24:799-804.
- [CrossRef] [Google Scholar]
- Hill,R.M., Dissado L.A., 2000. Debye and non-Debye relaxation. J. Phys. C Solid State Phys. 18, 3829–3836. http://doi.org/10.1088/0022-3719/18/19/021.
- Reactive & functional polymers improvements in thermal, mechanical, and dielectric properties of epoxy resin by chemical modification with a novel amino-terminated liquid-crystalline copoly (ester amide) React. Funct. Polym.. 2012;72:542-548.
- [CrossRef] [Google Scholar]
- Electrical properties of epoxy/POSS composites with homogeneous nanostructure. IEEE Trans. Dielectr. Electr. Insul.. 2014;21:1516-1528.
- [CrossRef] [Google Scholar]
- Investigation of hydrothermal ageing of a filled rubber toughened epoxy resin using dynamic mechanical thermal analysis and dielectric spectroscopy. Polymer (Guildf). 2000;41:6787-6796.
- [CrossRef] [Google Scholar]
- Preparation of thermoset rubbery epoxy particles as novel toughening modifiers for glassy epoxy resins. Polymer. 1999;40:5601-5607.
- [Google Scholar]
- Jyotishkumar, P., Koetz, J., Tiersch, B., Strehmel, V., Özdilek, C., Moldenaers, P., Hässler, R., Thomas, S., 2009. Complex phase separation in poly (acrylonitrile – butadiene – styrene) – modified epoxy/4, 4′-diaminodiphenyl sulfone blends: generation of new micro- and nanosubstructures, 5418–5430.
- Levita, G., Liv, Z.A., Rolla, P.A., Culicchi, C., 1996. Dielectric monitoring of epoxy cure. J. Polym. Sci. Part B Polym. Phys. 34, 2731–2737. http://doi.org/10.1002/(SICI)1099-0488(19961130)34:16<2731::AID-POLB6>3.0.CO;2-Sd.
- Maex, K., Baklanov, M.R., Shamiryan, D., Brongersma, S.H., 2013. Low dielectric constant materials for microelectronics APPLIED PHYSICS REVIEWS – FOCUSED REVIEW Low dielectric constant materials for microelectronics. J. Appl. Phys. 8793. http://doi.org/10.1063/1.1567460.
- Morphology and mechanical properties of nanostructured thermoset/block copolymer blends with carbon nanoparticles. Compos. Part A Appl. Sci. Manuf.. 2015;71:136-143.
- [CrossRef] [Google Scholar]
- Epoxidized natural rubber/epoxy blends: phase morphology and thermomechanical properties. J. Appl. Polym. Sci.. 2014;131:1-9.
- [CrossRef] [Google Scholar]
- Dielectric studies of water in epoxy resins. J. Appl. Polym. Sci.. 1983;28:2363-2379.
- [CrossRef] [Google Scholar]
- Nanocomposite dielectrics—properties and implications. J. Phys. D. Appl. Phys.. 2005;38:213-222.
- [CrossRef] [Google Scholar]
- Glikoliza odpadów poliuretanowych 2007
- Effects of liquid rubber modification on the behavior of epoxy resin. Eur. Polym. J.. 2001;37:2353-2363.
- [CrossRef] [Google Scholar]
- Guicun Qi, Xiaohong Zhang, Binghai Li, Zhihai Song, Jinliang Qi, 2011. The study of rubber-modified plastics with higher heat resistance and higher toughness and its application, Polym. Chem., 1271–1274. http://doi.org/10.1039/c0py00413h.
- Development of nanoscale morphology and role of viscoelastic phase separation on the properties of epoxy/recycled polyurethane blends. Polymer (United Kingdom). 2017;117:96-106.
- [CrossRef] [Google Scholar]
- Cure kinetics, thermal stability, and dielectric properties of epoxy/barium ferrite/polyaniline composites. Thermochim. Acta. 2015;599:84-94.
- [CrossRef] [Google Scholar]
- Dielectric properties of epoxy nanocomposites. IEEE Trans. Dielectr. Electr. Insul.. 2008;15:12-23.
- [CrossRef] [Google Scholar]
- Simultaneously improved toughness and dielectric properties of epoxy / core-shell particle blends. J. Appl. Polym. Sci.. 2008;107:1020-1028.
- [CrossRef] [Google Scholar]
- Dielectric spectroscopy characterization of relaxation process in Ni/epoxy composites. J. Alloys Compd.. 2016;682:738-745.
- [CrossRef] [Google Scholar]
- Interface molecular engineering of single-walled carbon nanotube/epoxy composites. J. Mater. Chem.. 2012;22:1928.
- [CrossRef] [Google Scholar]
- Dynamics of polymer blends with intermolecular hydrogen bonding: broad-band dielectric study of blends of poly(4-vinyl phenol) with poly(vinyl acetate) and EVA70. Macromolecules. 2002;35:8478-8487.
- [CrossRef] [Google Scholar]


