

Translate this page into:
Precise analysis of thyroxine enantiomers in pharmaceutical formulation by mobility difference based on cyclodextrin
⁎Corresponding authors. wangweimin1@nbu.edu.cn (Weimin Wang), wufangling@nbu.edu.cn (Fangling Wu), fymaiyifeng@nbu.edu.cn (Yifeng Mai)
-
Received: ,
Accepted: ,
This article was originally published by Elsevier and was migrated to Scientific Scholar after the change of Publisher.
Peer review under responsibility of King Saud University.
Abstract
Identification and determination of chiral pharmaceutical residues is still a challenging analytical puzzle. In this work, a simple, rapid, and effective method for chiral D/L-tetraiodothyronine (T4) separation and quantitative was developed based on host–guest recognition using ion mobility spectrometry-mass spectrometry (IMS-MS). The D/L-T4 enantiomers were mobility separated by their diastereomeric complexes through mixing with cyclodextrin (CD) and metal ions. D/L-T4 was first separated by complexing with host molecule (α-, β-, γ-CD), observing weak peak-to-peak resolution (Rp-p) by the formed binary complex [CD + D/L-T4-H]+, and the Rp-p decreased with the CD size increasing. However, the separation effect of D/L-T4 was much improved with the addition of divalent metal ions (G2+) by the formed ternary complex [CD + D/L-T4 + G]2+. In comparison, α-CD related complexes can possess the best separation effect for D/L-T4 in most cases. Considering the high selectivity, non-toxic, and chemically stable of β-CD, [β-CD + D/L-T4 + Ca]2+ was selected for D/L-T4 analysis (RP-P = 0.764). Whereafter, chemical theoretical conformations for [β-CD + D/L-T4 + H]+ and [β-CD + D/L-T4 + Ca]2+ were optimized, discovering similar micro-interaction modes between [β-CD + D-T4 + H]+ and [β-CD + L-T4 + H]+; while with the addition of Ca2+, significantly different interaction modes were observed between [β-CD + D-T4 + Ca]2+ and [β-CD + L-T4 + Ca]2+. And theoretical collision cross section (CCS) trends for the complexes were consistent with that of the experimental results. Additionally, calibration curves were linear within 1.00 to 104 ng mL−1 with coefficient (R2 > 0.99), gaining the limit of detection (LODs) calculation of 0.11 ng mL−1, and the detection range between D-T4 and L-T4 of 45.6:1 to 1:59.8. Finally, the method was applied for D/L-T4 detection in Levothyroxine tablets, the detection content has good consistency on drug labeling. Because the proposed method exhibited good analytical performance in terms of speed, selectivity, sensitivity, and reproducibility of the measurements, that can be a promising strategy for effective D/L-T4 detection in pharmaceutical industries or other practical samples.
Keywords
D/L-tetraiodothyronine
Separation
Ion mobility
Chemical theoretical calculations
Diastereomer complex
Drug tablet

1 Introduction
Chiral pharmaceuticals are widely used in different areas of human life, that they may exist in different ecosystems, but the identification and determination of chiral pharmaceutical residues is still a problem and challenge (Dogan et al., 2020). Thyroid hormones (THs) are produced and secreted by the thyroid gland to regulate its metabolism by promoting the physical development, which the THs mainly include triiodothyronine (T3) and tetraiodothyronine (T4) (Luongo et al., 2019). Both excess and deficiency of thyroid hormones can lead to related diseases such as hyperthyroidism, hypothyroidism, thyroid inflammation, goiter, and thyroid cancer (Razvi et al., 2018). T4 has two enantiomeric structures of D-T4 and L-T4, these two enantiomers show different biological and pharmacological activities, among which L-T4 is a synthetic thyroid hormone for the treatment of Hypothyroidism; D-T4 activity is lower than L-T4, generally not used for the treatment of hypothyroidism, besides D-T4 has side effects on the heart that is prohibited for patients with hyperlipidemia (Mourouzis et al., 2011; Cerit et al., 2017). However, many related drugs are used for the treatment of thus diseases, such as Thyroid tablets, levothyroxine sodium, liothyronine. Therefore, accurate identification of D-T4 and L-T4 enantiomers in drug synthesis is the premise to ensure the safety use of drugs.
In recently, several methods for T4 enantiomers separation have been reported, such as electro chemiluminescent immunoassay (ECLIA) (Bowerbank et al., 2019), liquid chromatography coupled to a mass spectrometer (Jin et al., 2008; An et al., 2022), electrophoresis (CE) (Woo et al., 2017), and capillary electrochromatography (CEC) (liu et al., 2017). Those methods have their advantages, but also disadvantages were existed. For example, ELISA shows limited sensitivity for THs and these limitations have led to several studies into alternative analytical techniques. As for HPLC, CE, or CEC based method, chiral stationary phase column (CSP) or a chiral mobile phase has the most studies for T4 enantiomer separation, but which also have the drawbacks such as complex chemical derivations, limited and expensive chiral columns, or long-time chromatographic separation.
Mass spectrometry (MS) has attracted increasing attentions for the analysis of THs in recent years, mainly because MS provides mass accuracy, high sensitivity, and has the advantages of fast and simple (Griffiths et al., 2018; Taira et al., 2022; Wu et al., 2022). However, direct analysis of chiral enantiomers by MS is difficult due to the same mass charge ratio. And some works for chiral enantiomers separation by tandem mass spectrum (MS/MS) have been reported, which obtained by comparing the relative intensity difference of their fragment ions (Han et al., 2020; Yu et al., 2017). Undoubtedly, D- and L- pure samples were required, and chemical derivatization with the special chiral selector was also needed in most case.
Ion mobility spectrometry (IMS) is a powerful analytical technique that allows rapid separation of isomeric ions based on differences in mobilities or ion collision cross sections (CCS) in the electric field (Dodds et al., 2019; Putri et al., 2020; Cumeras et al., 2015). The coupling of IMS and MS (IMS-MS) can be an effective technique for isomer separation, as ion mobility adds an extra dimension to the primary MS instrument for separation (Fouque et al., 2019; Wu et al., 2021); Meanwhile, IMS-MS method can overcome the limitation that a single MS cannot separate the ions with the same m/z; Otherwise, it enhances the sensitivity of IMS and has m/z selective analysis characteristics. Trapped ion mobility spectrometry (TIMS), an IMS technique developed by Fernandez-Lima et al. in 2011, uses a N2 stream to bring ions into a drift cell and separate them based on size, charge, and shape difference (Fernandez-Lima et al., 2011). And because advantages of simple, quick, high accuracy, the D/L-T4 separation by TIMS-MS based methods are worth studying.
However, it’s difficult to achieve the mobility separation of isomers with small structural differences by a single TIMS-MS, especially for chiral enantiomers. However, converting molecules with small structural differences into their diastereomeric complexes with large structural difference, and then realizing their enantiomer separation is effective. Cyclodextrins (CDs) are cyclic oligosaccharide structures formed by the connection of glucose units through (1–4) glycosidic bonds, among which three kinds of CD (α-, β-, γ-CD) are widely distributed and are used more frequently, and consists of 6, 7 and 8 glucose units, respectively (Ding et al., 2021; Wu et al., 2022). They have numerous and valuable applications in industrial fields such as chemistry, pharmaceutical sciences, food, cosmetics and textiles (Liu et al., 2022). Meanwhile, CDs are often acted as hosts to form complexes with small molecules due to their hydrophilic properties in the inner cavity and hydrophobicity in the outer cavity. Some excellent works about host–guest complexes based on CD have been reported, such as xiao et al. used mercapto-β-CD as the host to cap gold nanoclusters as fluorescent probes for succinct and sensitive determination of cholesterol (Xiao et al., 2022); Tang et al. using CD-based host–guest complexes loaded with regorafenib for colorectal cancer treatment (Bai et al., 2021).
In this work, a simple and quick method for D/L-T4 enantiomers separation was developed via complexing with CDs and detecting on TIMS-MS. Specifically, α-, β-, and γ-CD served as chiral selector to complex with T4 enantiomers, and the enantiomers were analyzed by their formed complexes via TIMS-MS systematically. Subsequently, different bivalent metal ions including Mg2+, Mn2+, Cu2+, Ca2+, Zn2+, Ni2+, Fe2+, Co2+, and Ba2+ were added as ligand to coordinate with T4 and the CDs, to increase the structural difference of the complexes. Meanwhile, chemical theoretical were calculated for the formed complexes to explain the micromolecular interaction and experimental results. Moreover, relative quantitation and absolute quantification for T4 enantiomers was also investigated to validate the stability and reliability of the method. Finally, the method was applied to D-T4 and L-T4 detection in the drugs.
2 Experimental section
2.1 Chemicals and samples
D-T4 (MW: 776.87, 98%), L-T4 (MW: 776.87, 98%), L-Triiodothyronine (L-T3, MW: 650.97, 98%), α-CD (MW: 972.84, 98.00%), β-CD (MW: 1134.98, 98.00%), and γ-CD (MW: 1297.12, 98.00%) were obtained from Aladdin Co., Ltd. (Shanghai, China). All inorganic metal salts reported in this work are analytical grade and bought by Shanghai Macklin Biochemical (Shanghai, P. R. China). Methanol (LC-MS grade) and acetonitrile (ACN, LC-MS grade) were acquired from Fisher Scientific Inc. (Pittsburgh, PA). The ESI-Low Concentration Tuning Mix was purchased from Agilent Technologies (Santa Clara, CA). Deionized water used in this work was freshly prepared using a Milli-Q water purification system (Bedford, MA).
2.2 Instrumentation and software
All ion mobility analysis for the complexes was performed on a TIMS-TOF instrument from Bruker Daltonik (Bremen, Germany) equipped with electrospray ionization (ESI) source. And the extensive experimental data analysis and processing is performed using the DataAnalysis 5.0 software. And the details are described in the Supporting Information section 2.
2.3 Peak-to-peak resolution
The peak-to-peak resolution (Rp-p) is used to quantify the degree of separation of the two neighboring peaks, which can be calculated by the following formula: (Wu et al., 2022) Rp-p = 2.35 × (A2 − A1) / (2 × WFWHM1 + 2 × WFWHM2) (3)
Where A1 and A2 represent the different 1/K0 of two adjacent peaks, and WFWHM1 and WFWHM2 is their corresponding full peak width at half-maximum.
2.4 Chemical calculation
Theoretical structures of the diastereomer complexes of [β-CD + D-/L-T4 + H]+ and [β-CD + D-/L-T4 + Ca]2+ were optimized using the Gaussian program (Weedbrook et al., 2012; Wu et al., 2022). The candidate structures for [β-CD + D-/L-T4 + H]+ were first proposed by AutoDock Vina program to get all molecules of interest (Eberhardt et al., 2021), and the preferred structures were further optimized using Gaussian 09 with M062X/LANL2DZ. Besides, the interest structures of [β-CD + D-/L-T4 + Ca]2+ were measured by AutoDock Vina program via mixing Ca2+ to the favored structure of [β-CD + D-/L-T4 + H]+. And the favored structures of [β-CD + D-/L-T4 + Ca]2+ were optimized using Gaussian 09 with M062X/LANL2DZ as well. Vibrational frequencies were calculated to guarantee that the optimized structures corresponded to a stable energy space, and zero-point energy corrections were applied to calculate the relative stability between the structures. Finally, theoretical CCSs for the favored diastereomer complexes were calculated using IMoS software v1.10 (Shrivastav et al., 2017).
2.5 Sample pretreatment for the tablet drug
The levothyroxine tablets were bought from the local drugstore in Ningbo (Zhejiang, China), and stored at 4 °C for detection. To extract the analytes, drugs are first removed from the thin film coating and ground to a uniform powder using an agate mortar and pestle. 1.0 g power was dissolved in deionized water (10.0 ml) and sonicated for 2 min. The extract was then filtered by a 0.22 μm drainage filter membrane as the stock solution and stored at 4 °C. The detection solution was obtained by taking 1.0 ml of stock solution and diluted 10-folds with ACN/deionized water (50%:50%, v/v).
2.6 Method validation
The proposed method, based on TIMS-MS for D-T4 and L-T4 chiral enantiomer quantitative analysis was validated, which measured by identifying the different molarities for the isomers (each having ten data points). Relative quantitative were constructed by measuring different isomer mixture ratios, which comprise the molality ratios measured for D-T4: L-T4 ratios range from 10:1 to 1:10 at the concentration level of 10-6 mol L-1. The mixture was then incubated for 15 min at room temperature to equilibrate before executing the TIMS-MS detection process. Here, the calibration curves of relative quantification for the isomer complexes were constructed by comparing their peak area intensity ratio (y) against their corresponding relative concentration (x). Moreover, absolute quantification for T4 were also measured by a series of concentrations ranged from 1.00 to 104 ng mL−1 containing 10.0 ng mL−1 of T3 as internal standard, and the calibration curves of absolute quantification was measured on the ratio of the intensities of the mass spectrum peaks (T4/T3). Furthermore, the accuracy of the method was tested by spiking with a known amount of D-T4 and L-T4, which encompassed three different concentrations of a low, medium, and high sensitivity, and was performed in duplicate to determine the average recovery.
3 Results and discussion
3.1 Mobility separation of T4 enantiomer in complexing with CDs
The MS and mobility analyses were first performed for the T4 enantiomers by complexing with CDs. As shown in Fig. 2, the m/z 777.00, 1750.02, 1912.08, and 2074.15 are contributed to the ions of [T4 + H]+, [α-CD + T4 + H]+, [β-CD + T4-H]+, and [γ-CD + T4-H]+, respectively. The results revealed that the T4 enantiomers can non-covalent interaction with CDs and form the corresponding binary complex of [TH + CD-H]+. And then their mobility analysis was studied. As shown in Fig. 1, the identical extraction ion mobilities (EIMs) were found for the complexes of [D-T4 + H]+ and [L-T4 + H]+, revealing that the D and L-T4 enantiomers cannot be mobility separated by their own protonated ions.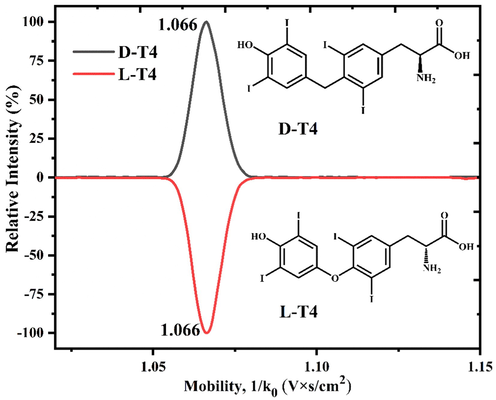
The extracted ion mobility spectra and structure for the D/L-T4 enantiomers.
Besides, TIMS analysis for the binary complexes of [CD + T4-H]+ were studied and shown in the right of Fig. 2. The EIMs between the [CD + D-T4-H]+ and [CD + L-T4 + H]+ have certain difference. Specifically, the mobility value for [α-CD + D-T4 + H]+ is 1.767 V·s·cm−2 and for [α-CD + D-T4 + H]+ is 1.774 V·s·cm−2, which the calculated RP-P is 0.411. Identical, the mobility value for [β-CD + D/L-T4 + H]+ and [γ-CD + D/L-T4 + H]+ are 1.754/1.758 and 1.847/1.849 V·s·cm−2, with the Rp-p for D/L-T4 separation are 0.235 and 0.118, respectively. The results reveal that the separation effect Rp-p for D/L-T4 enantiomer was decreased as the size of the inner cavity of the CD increasing, which probably because the large CD inner cavity allows more entry of the target analyte that resulting in less structural difference for the diastereomer complex.![Mass spectra for TH in complex with CDs and their corresponding EIM (a) [α-CD + T4 + H]+; (b) [β-CD + T4 + H]+; (c) [γ-CD + T4 + H]+.](/content/184/2023/16/6/img/10.1016_j.arabjc.2023.104718-fig2.png)
Mass spectra for TH in complex with CDs and their corresponding EIM (a) [α-CD + T4 + H]+; (b) [β-CD + T4 + H]+; (c) [γ-CD + T4 + H]+.
3.2 Mobility separation of T4 in complexing with CDs and metal ions
Through the D/L-T4 enantiomer can be mobility recognized by their formed binary complexes, but the resolution is not satisfactory when their enantiomeric complexes coexist. In this case, the center ligand of metal ions was added to study their separation effect. As shown in the left of Fig. 3, Ca2+ was served as an example to complex with the CDs and the D/L-T4, which m/z 894.83, 975.52, 1056.55 are attributed to the complex ions of [α-CD + T4 + Ca]2+, [β-CD + T4 + Ca]2+, and [γ-CD + T4 + Ca]2+, respectively. The MS results reveal that Ca2+ can as a ligand to coordinate with CD and T4, and the corresponding ternary complexes can be formed. For other MS peaks in the mass spectra, which are the complexes formed by the interaction of CD with other substances, because metal salts are only in analytical grade and the contaminants may be present in the mass spectrometer. And then the mobility study was measured for the ternary complexes. As shown in the right of Fig. 3, significantly different EIMs were observed for the D- and L-ternary complexes. For example, mobility values for [α-CD + D-T4 + Ca]2+ and [α-CD + L-T4 + Ca]2+ are 0.941 and 0.951 V·s·cm−2, with the calculated RP-P of 0.529. Similarly, mobility values for [β-CD + D/L-T4 + Ca]2+ and [γ-CD + D/L-T4 + Ca]2+ are 0.967/0.981 and 1.015/1.023 V·s·com−2, resulting in RP-P of 0.764 and 0.470, respectively.![Mass spectra for TH in complex with CDs and Ca2+ and their corresponding extracted ion mobility (a) [α-CD + T4 + Ca]2+; (b) [β-CD + T4 + Ca]2+; (c) [γ-CD + T4 + Ca]2+.](/content/184/2023/16/6/img/10.1016_j.arabjc.2023.104718-fig3.png)
Mass spectra for TH in complex with CDs and Ca2+ and their corresponding extracted ion mobility (a) [α-CD + T4 + Ca]2+; (b) [β-CD + T4 + Ca]2+; (c) [γ-CD + T4 + Ca]2+.
In addition, other divalent metal ions of Mg2+, Mn2+, Fe2+, Co2+, and Ni2+ were also studied as ligand for D/L-T4 separation. As shown in Fig. 4, the studied metal ions all have different effect for D/L-T4 separation, which the RP-P can reach to 1.59 by the formed complex of [α-CD + D/L-T4 + Ni]2+. In comparison, α-CD related complex seems has the best separation effect for D/L-T4 enantiomers in most case. However, the separation resolution of the D/L-T4 may be reduced with the coordinated of the metal ions (Mn2+), which probably because Mn2+ was interact with the narrow rim of the CD, and majority of the D/L-T4 is in the CD chamber, that reduced their separation effect and have essentially the same separation resolution. But this is not the focus of this work just an empirical guess, and the specific results require further theoretical calculations. And the accuracy for the method was measured in quintuplicate in consecutive days, the calculated RSD% was in a range of 0.22 to 0.50 %, reveling the method has good repeatability and stability. Moreover, considering D/L-T4 can be baseline separation by complexing with β-CD and Ca2+ (Rp-p = 0.764) (Fig. 3b-2), and the advantages of high selectivity, non-toxic, chemically stable of β-CD, that [β-CD + D/L-T4 + Ca]2+ was selected for further studying.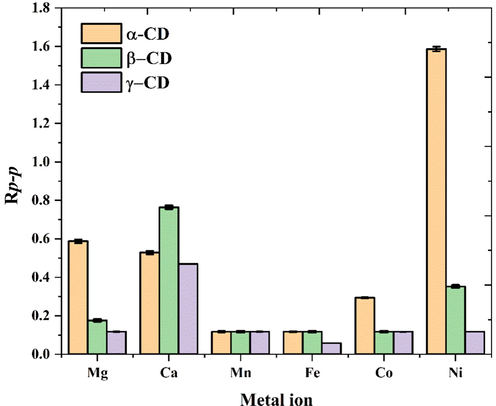
Separation effect Rp-p for the D/L-T4 by complex with different metal ions and CDs.
3.3 Parameter optimization for detection
Detection parameters such as solvent, molar ratio among CD, metal salts and T4, and ionization voltage all can affect the formation of the complexes. In this case, the formation of [β-CD + D/L-T4 + Ca]2+ was studied. As shown in Fig. 5a and Fig. 5b, methanol and ACN as solvent were investigated, revealing ACN was more benefited for the formation of [β-CD + D/L-T4 + Ca]2+ than methanol. Besides, the relative intensity of the complex was increased when ACN content was increased from 30% to 50%, and when ACN content continued to increase, its intensity decreased. Moreover, the molar ratio among the β-CD, T4 and Ca2+ was studied, with the molar ratio of Ca2+ to T4 increased from 0.4 to 0.8, the relative intensity of [β-CD + D/L-T4 + Ca]2+ was increasing, but its intensity of the complexes was decreased as the molar concentration of the salt was continued to increase (Fig. 5c). Similarly, the molar ratio of β-CD to T4 was also studied, a molar ratio of 1.0:0.8:0.8 for T4: β-CD: Ca2+ was best (Fig. 5d). The flow rate was further optimized, it was shown that the strength of the complex decreases with the increase of the flow rate (Fig. 5e). Finally, the ionization voltage was optimized in Fig. 5f, as the ionization voltage increase, the detection efficiency of the target decreases instead, revealing that 3000 V is the favored ionization efficiency in this case. Thus, the favored detection parameters were as follows, the molar ratio of T4: β-CD: Ca2+ was 1.0:1.2:0.8, solvent was 50% ACN /water, detection flow rate was 2 ul min−1, and the ionization voltage was 3000 V.![Parameter optimization for the detection of complex [β-CD + T4 + Ca]2+ (a) Methanol content in the solvent; (b) ACN content in the solvent; (c) Molar ratio of Ca2+ to T4; (d) Molar ratio of β-CD to T4; (e) flow rate of detection; (f) ionization voltage;](/content/184/2023/16/6/img/10.1016_j.arabjc.2023.104718-fig5.png)
Parameter optimization for the detection of complex [β-CD + T4 + Ca]2+ (a) Methanol content in the solvent; (b) ACN content in the solvent; (c) Molar ratio of Ca2+ to T4; (d) Molar ratio of β-CD to T4; (e) flow rate of detection; (f) ionization voltage;
3.4 Chemical theoretical calculation
The mobility differences of the diastereomeric complexes revealed D/L-T4 have different interaction effects with the CDs. The favored conformation for the complexes were optimized to match and explain their micro-interactions (Campuzano, et al., 2012; Shrivastav, et al., 2017). The possible structures for each complex were first optimized by AutoDock software, and the structures with low energy were selected and further optimized to obtain the final structure by Gaussian. Herein, the favored conformations of D/L-T4 in complexing with β-CD and Ca2+ were optimized as examples for interpretation by chemical theoretical calculations using M062X/LANL2DZ (Detailed in the Supporting Information), and the energy for the complexes are shown in Table S1 and Table S2. As showed in Fig. 6a and Fig. 6b, similar modes of interaction were observed for [β-CD + D-T4 + H]+ and [β-CD + L-T4 + H]+. The CCS values between experimental and chemical theoretical for the complexes were displayed in Table 1, theoretical CCSs for [β-CD + D-T4 + H]+ and [β-CD + L-T4 + H]+ are 387.63 and 383.56 Å2, which have good consistent trend with the experimental values. Meanwhile, the structural difference for the complexes was expanded with the addition of Ca2+. As shown in Fig. 6c and Fig. 6d, Ca2+ interacts with β-CD and D/L-T4 at different locations, where Ca2+ wrapped inside D-T4 and β-CD, while Ca2+ was interact with T4 on the small orifice surface of β-CD. Accordingly, the theoretical CCSs for [β-CD + D-T4 + Ca]2+ and [β-CD + L-T4 + Ca]2+ are 440.03 and 431.65 Å2, compared with their experimental CCSs values of 399.0 and 392.0 Å2 (Table 1), similar trend of the CCS value changes (RSD ≤ 13.87%) were obtained.![Structure for the complexes of (a) [β-CD + D-T4 + H]+; (b) [β-CD + L-T4 + H]+; (c) [β-CD + D-T4 + Ca]2+; (d) [β-CD + L-T4 + Ca]2+.](/content/184/2023/16/6/img/10.1016_j.arabjc.2023.104718-fig6.png)
Structure for the complexes of (a) [β-CD + D-T4 + H]+; (b) [β-CD + L-T4 + H]+; (c) [β-CD + D-T4 + Ca]2+; (d) [β-CD + L-T4 + Ca]2+.
Complex
TIMS (CCS Å2)
DFT (CCS Å2)
RSD (%)
[β-CD + D-T4 + H]+
340.4
387.63
13.87
[β-CD + L-T4 + H]+
338.3
383.56
13.38
[β-CD + D-T4 + Ca]2+
399.0
440.03
10.28
[β-CD + L-T4 + Ca]2+
392.0
431.65
10.11
Indeed, CCS value errors between the experimental and theoretical were between 10.11 and 13.87%, which were caused by the structural form difference between the calibrated tuning mixture and the diastereomer complexes, the trajectory method for CCS calculation, and the parameter setting of the IMoS program. However, the CCS trends are consistent between experiment and theory (Olajide et al., 2021), the conformation difference for D-/L-T4 was increased by interaction with β-CD and Ca2+ and resulted in different effects on the mobility separation.
3.5 Quantitative analysis for the D/L-T4 enantiomers
As the D/L-T4 can be separated by the proposed method, that their quantitative analysis of absolute and relative quantification was evaluated. Herein, the absolute quantitative was measured with L-T3 as the internal standard, keeping L-T3 in a fixed concentration (10.00 ng mL−1), and changing the concentration of D/L-T4 from 1.00 to 104 ng mL−1 in seven points. As shown in Fig. 7a, MS spectra of mixtures of L-T3 (10.00 ng mL−1), D/L-T4 (1:1, 50.0 ng mL−1), and Na+ (100.0 ng mL−1) were studied, the ions were present as the form of Na+ coordination, such as the ions of [T4/T3 + Na]+, [T4/T3 + 2Na-H]+, [T4/T3 + 3Na-2H]+. In this case, the absolute quantitative was measured by the intention of [T4 + H]+, [T4 + Na]+, [T4 + 2Na-H]+, [T4 + 3Na-2H]+ to the intensity of [L-T3 + H]+, [L-T3 + Na]+, [L-T3 + 2Na-H]+, [L-T3 + 3Na-2H]+. The results are shown in Fig. 7b, yielding good linear (R2 = 0.9904) with an RSD slop of 1.26% (n = 5); the limit of detection (LODs) and limit of quantitation (LOQ) calculation for the T4 by the signal-to-noise ratio (S/N = 3) and (S/N = 10) were 0.11 ng mL−1 and 0.49 ng mL−1, respectively.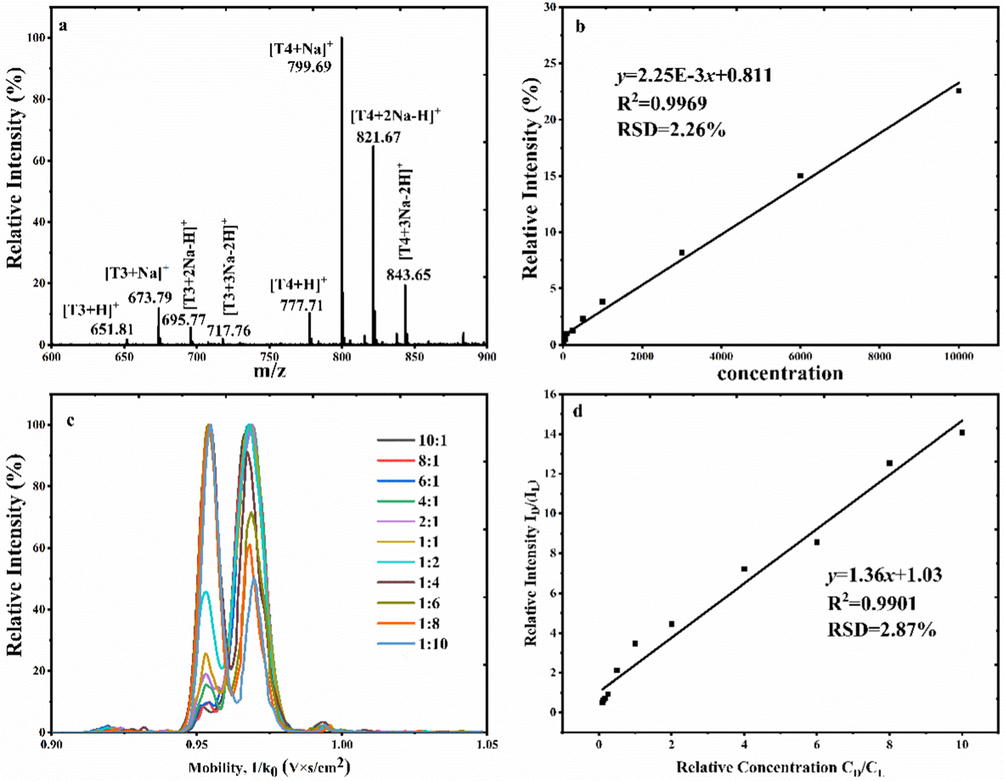
Absolute quantification using the T3 as the interior label (a) Mass spectra for the mixture TT (100.0 ng/mL) T4 (5000 ng/mL); (b) standard curve; Relative quantification for the D/L-T4 enantiomers (c) extracted ion mobility D: L = 10:1–1:10; (d) standard curve.
Besides, a series of different molar ratios of D-T4 and L-T4 changed from 10:1 to 1:10 in complexing with β-CD and Ca2+ were measured. EIMs for the diastereomer complexes [β-CD + T4 + Ca]2+ obtained by the mixtures are shown in Fig. 7c, the mobility intensity for the ions was increased with its ratios increasing. And the calibration curve for D/L-T4 relative quantification was assessed by plotting the mobility peak area intensity of D-T4/L-T4 versus the relative concentration of D-T4/L-T4. As displayed in Fig. 7d, good linear relationship between the relative intensity and the relative concentration with a R2 value of 0.9901, and RSD (n = 5) of 2.78% were obtained. Moreover, the detection scope of the method was also measured, which in the range of 45.6:1 to 1:59.8 by the proposed method.
Moreover, accuracy of quantitative analysis by the method was further measured by quality control (QC) in three different concentrations and back-calculation using the calibration curves. For the accuracy of absolute quantification, QC in three concentrations of low (3.0 ng mL−1), medium (500.0 ng mL−1) and high (9000.0 ng mL−1), and three molar ratios for relative quantification were low (10:3), medium (10:9), and high (1:9) were measured. The detection results are shown in Table 2, accept accuracy with RSD ≦5.67%. And a simple comparison of the proposed method with the prior methods was measured in Table S3, this method has the advantages of high sensitivity, short time and simple operation. Thus, the relative quantification results revealed that the proposed method based on complexing with β-CD and Ca2+ and detected on TIMS-MS, can be a promising approach for D/L-T4 enantiomer detection.
Absolute quantification
High (ng mL−1)
Medium (ng mL−1)
Low (ng mL−1)
Spiked
9000.0
500.0
3.0
Detected
9000.0 ± 300.59
500.0 ± 10.27
3.0 ± 0.11
RSD%
3.33%
2.05%
3.67%
Relative quantification
High (molar ratio)
Medium (molar ratio)
Low (molar ratio)
Spiked
10:3
10:9
1:9
Detected
10 ± 0.66:3 ± 0.20
10 ± 0.75:9 ± 0.64
1 ± 0.11:9 ± 0.77
RSD%
5.67%
5.61%
4.67%
3.6 Detection of D/L-T4 enantiomers in practical samples
The proposed method for D/L-T4 detection in practical sample of drug tablets as example for method validation. Firstly, the total T4 content (including D-T4 and L-T4) was detected by using L-T3 as the internal standard. And the content of the T4 was back calculated by the absolute quantitative standard curve in Fig. 7b via their mass peak intensity. Accordingly, T4 detected in the tablets was 45.3–52.6 ug with the RSD ≤ 4.65%, which was basically the same as the amount descripted in the manual. Moreover, the sample was further mobility separating to determine whether L-T4 contains D-T4 in the tablets. The TIMS-MS results was shown that the D-T4 was basically undetectable in the drug tablets, revealed this drug tablets with better purity.
Additional, 5.0 ug D-T4 was added in the tablet, and TIMS-MS detected by complexing with β-CD and Ca2+ in a diluted concentration of 10-6 mol L -1. The detected molar ratios of D-T4 and L-T4 were back calculated by the measured relative quantitative standard curves, the detected molar concentration ratio was 1.0 ± 0.32:10.0 ± 0.54 for the D-T4: L-T4. These results reveal that the proposed method can be applied to D/L-T4 enantiomer analysis and take the fake test in practical samples.
4 Conclusion
In this work, chiral enantiomer of D/L-T4 was separated and quantified by TIMS-MS through simply mixing with CD and metal ions. By simply mixing with CDs, a certain degree of separation of D/L-T4 was obtained by the form binary diastereomeric complexes, which the separation effect for D/L-T4 in a following of α-CD (Rp-p = 0.411)>β-CD (Rp-p = 0.235)>γ-CD (Rp-p = 0.118). With the addition of divalent metal ions, the related bivalent ternary diastereomer complexes can be formed, and the separation effect was improved to 1.59 (RP-P) for D/L-T4 enantiomers by [α-CD + D/L-T4 + Ni]2+. Considering the D/L-TH can be satisfactory separated by [β-CD + D/L-T4 + Ca]2+ (Rp-p = 0.764), and the high selectivity, non-toxic, chemically stable of β-CD, [β-CD + D/L-T4 + Ca]2+ was selected for further D/L-T4 analysis. Moreover, chemical theoretical conformations for [β-CD + D/L-T4 + H]+ and [β-CD + D/L-T4 + Ca]2+ were optimized, discovering similar micro-interaction modes between [β-CD + D-T4 + H] + and [β-CD + L-T4 + H]+; and with the addition of Ca2+, significantly different interaction modes were observed between [β-CD + D-T4 + Ca]2+ and [β-CD + L-T4 + Ca]2+. And theoretical collision cross section (CCS) trends for the complexes were consistent with that of the experimental results. Additionally, quantitative analysis for D/L-T4 enantiomers was measured by [β-CD + D/L-T4 + Ca]2+. Good linear of R2 higher than 0.99 and high accuracy RSD≦2.87% were obtained, with LOD for T4 analysis was 0.11 ng mL−1, and detection scope for D/L-T4 was in the scop range of 45.6:1 to 1:59.8. Finally, the method was successfully applied to the D/L-T4 analysis in drug tablet, revealing the proposed method possesses the advantages of simplicity, selectivity, speed (<5 min), and lack of chemical derivation or chromatographic separation, that can be an effective approach for D/L-T4 analysis or even other thyroxine isomers in practical samples.
Acknowledgment
This work was supported by Zhejiang Natural Science Foundation (LY22B050006), National Natural Science Foundation of China (22004074 and 21927805), and the Science and Technique Plans of Ningbo City (2019C50080).
Conflict of interest
All the authors declare no conflict of interest.
References
- Validation of Sennae Folium specification grade classification based on UPLC-Q-TOF/MS spectrum-effect relationship. Arab. J. Chem.. 2022;15(11):104223
- [Google Scholar]
- Cyclodextrin-based host-guest complexes loaded with regorafenib for colorectal cancer treatment. Nat. Commun.. 2021;12:1-18.
- [Google Scholar]
- A direct comparison of liquid chromatography-mass spectrometry with clinical routine testing immunoassay methods for the detection and quantification of thyroid hormones in blood serum. Anal. Bioanal. Chem.. 2019;411:2839-2853.
- [Google Scholar]
- Structural characterization of drug-like compounds by ion mobility mass spectrometry: comparison of theoretical and experimentally derived nitrogen collision cross sections. Anal. Chem.. 2012;84(2):1026-1033.
- [Google Scholar]
- Epicardial Adipose Tissue, Carotid Intima-Media Thickness, and Thyroid Disorders. Iran. J Pediatr.. 2017;27
- [Google Scholar]
- Review on ion mobility spectrometry. Part 1: current instrumentation. Analyst. 2015;140(5):1376-1390.
- [Google Scholar]
- Preparation of inclusion complex of praziquantel with 2-hydroxypropyl-β-cyclodextrin and pharmacokinetic property improvement. Arab. J. Chem.. 2021;14(9):103307
- [Google Scholar]
- Ion mobility spectrometry: fundamental concepts, instrumentation, applications, and the road ahead. J. Am. Soc. Mass. Spectrom.. 2019;30:2185-2195.
- [Google Scholar]
- Detection, identification and determination of chiral pharmaceutical residues in wastewater: Problems and challenges. TrAC Trend Anal. Chem.. 2020;122:115710
- [Google Scholar]
- AutoDock Vina 1.2. 0: New docking methods, expanded force field, and python bindings. J Chem. Inf. Model.. 2021;61(8):3891-3898.
- [Google Scholar]
- Note: Integration of trapped ion mobility spectrometry with mass spectrometry. Rev. Sci. Instrum.. 2011;82:126106
- [Google Scholar]
- Recent advances in biological separations using trapped ion mobility spectrometry–mass spectrometry. TrAC-Trend Anal. Chem.. 2019;116:308-315.
- [Google Scholar]
- Determination of thyroxine enantiomers in pharmaceutical formulation by high-performance liquid chromatography–mass spectrometry with precolumn derivatization. Microchem. J.. 2008;88:62-66.
- [Google Scholar]
- Application of cyclodextrin in food industry. Crit Rev Food Sci Nutr. 2022;62:2627-2640.
- [Google Scholar]
- Capillary electrochromatography immunoassay for alpha-fetoprotein based on poly (guanidinium ionic liquid) monolithic material. Anal. Biochem.. 2017;530:50-56.
- [Google Scholar]
- Simultaneous chirality separation of amino acids and their derivative by natamycin based on mobility measurements. Anal. Chim. Acta. 2022;1227:340298
- [Google Scholar]
- Deiodinases and their intricate role in thyroid hormone homeostasis. Nat. Rev. Endocrinol.. 2019;15:479-488.
- [Google Scholar]
- Thyroid hormone and cardiac disease: from basic concepts to clinical application. J Thyroid. Res.. 2011;958626:13.
- [Google Scholar]
- Systematic optimization of ambient ionization ion mobility mass spectrometry for rapid separation of isomers. J Am. Soc. Mass Spectr.. 2021;33(1):160-171.
- [Google Scholar]
- Development of a methodology based on headspace-gas chromatography-ion mobility spectrometry for the rapid detection and determination of patin fish oil adulterated with palm oil. Arab. J. Chem.. 2020;13(10):7524-7532.
- [Google Scholar]
- Thyroid hormones and cardiovascular function and diseases.. 2018;71:1781-1796.
- Benchmark comparison for a multi-processing ion mobility calculator in the free molecular regime. J Am. Soc. Mass Spectr.. 2017;28:1540-1551.
- [Google Scholar]
- Analysis of hair components by nanoparticle-assisted laser desorption/ionization mass spectrometry imaging. Arab. J. Chem.. 2022;15(11):104205
- [Google Scholar]
- Multi-immunoreaction-based dual-color capillary electrophoresis for enhanced diagnostic reliability of thyroid gland disease. J. Chromatogr. A.. 2017;1509:153-162.
- [Google Scholar]
- Discrimination and characterization of the volatile organic compounds of Acori tatarinowii rhizoma based on headspace-gas chromatography-ion mobility spectrometry and headspace solid phase microextraction-gas chromatography-mass spectrometry. Arab. J. Chem.. 2022;15(11):104231
- [Google Scholar]
- A simple strategy for dl malic acid recognition and quantification using trapped ion mobility spectrometry. Microchem. J.. 2021;16:106301
- [Google Scholar]
- Simultaneous Differentiation of C═ C Position Isomerism in Fatty Acids through Ion Mobility and Theoretical Calculations. Anal. Chem.. 2022;94:12213-12220.
- [Google Scholar]
- A Cyclodextrin-Based Reagent for Cis/Trans-Geometrical Isomers Separation by Mobility Measurements and Chemical Calculations. Food Chem.. 2022;135027
- [Google Scholar]
- Sensitive cholesterol determination by β-cyclodextrin recognition based on fluorescence enhancement of gold nanoclusters. Microchem. J.. 2022;175:107125
- [Google Scholar]
- Chiral recognition and determination of enantiomeric excess by mass spectrometry: A review. Anal. Chim. Acta. 2017;968:1-20.
- [Google Scholar]
Appendix A
Supplementary data
Supplementary data to this article can be found online at https://doi.org/10.1016/j.arabjc.2023.104718.
Appendix A
Supplementary data
The following are the Supplementary data to this article:Supplementary data 1
Supplementary data 1


