

Translate this page into:
Prediction of breakthrough curves for multicomponent adsorption in a fixed-bed column using logistic and Gompertz functions
⁎Corresponding author at: The United Front Work Department, Chengdu University of Technology, Chengdu 610059, China. xuli@cdut.edu.cn (Li Xu)
-
Received: ,
Accepted: ,
This article was originally published by Elsevier and was migrated to Scientific Scholar after the change of Publisher.
Peer review under responsibility of King Saud University.
Abstract
In order to facilely predict the multicomponent breakthrough curves and avoid the complicated numerical solution, this work proposes two empirical models based on the logistic and Gompertz functions. The S-shaped and bell-like curves correspond to the adsorption and displacement processes respectively. The equilibrium loading of each component can be calculated by integration of the measured breakthrough curves. The effects of the model parameters on the breakthrough curves are investigated. The applicability of the two empirical models is validated by three binary and four ternary adsorption systems, including the gas–solid and liquid–solid adsorption. The residual plot and coefficient of determination (R2) are used to evaluate their fitting quality. The results indicate that the fitting curves agree well with the experimental data and all of the residuals are distributed randomly. The five model parameters (k, τ, k*, τ* and c) are easily obtained by the nonlinear regression. For example, the fitting results are k = 1.37 × 10⁻² min−1, τ = 292 min, k* = 1.25 × 10⁻² min−1, τ* = 453 min and c = 85.3 for adsorption of n-butyl acetate and p-xylene on granular activated carbon. On the whole, the Gompertz model is superior to the logistic model in terms of the fitting accuracy. The significance of this work is to provide a simple and practical method for prediction of the multicomponent breakthrough curves.
Keywords
Multicomponent adsorption
Logistic function
Gompertz function
Breakthrough curves
Equilibrium loading

1 Introduction
Adsorption is considered as an effective technique for removal of the various pollutants due to its high removal efficiency, good selectivity, ease of operation, and environmental compatibility (Dolatyari et al., 2017; Dolatyari et al., 2018). The batch reactor and fixed-bed column are widely applied to the engineered adsorption processes. But the latter is usually preferred in the practical application due to its two important advantages: The whole process has a high driving force, and the adsorbates can be totally removed until the breakthrough occurs (Hu et al., 2020; Worch, 2012). In such a system, the removal of the adsorbates is a time- and distance-dependent process. The dynamic adsorption behaviors of the adsorbates can be described by the effluent concentration–time profile, i.e. the breakthrough curve (Hu et al., 2019). The most effective adsorption can be obtained when the shape of the breakthrough curve is as sharp as possible (Chu, 2004). The accurate prediction of the breakthrough curves under the different experimental conditions contributes to understanding dynamic adsorption behaviors, determining the equilibrium loading, and designing a fixed-bed column with the reasonable size.
The Bohart–Adams (Bohart and Adams, 1920), Thomas (Thomas, 1948), Yoon–Nelson (Yoon and Nelson, 1984), Clark (Clark, 1987) and modified dose–response (Yan et al., 2001) models are favored by many researchers because of their simple mathematical forms and good fitting qualities. However, these models are not appropriate for the multicomponent adsorption, which are greatly limited in the practical application. In general, a breakthrough model that considers the axial dispersion, external mass transfer, intraparticle diffusion, and nonlinear isotherm can adequately describe the dynamic adsorption behaviors in a multicomponent system (Tefera et al., 2014). Then, the prediction of the breakthrough curves requires the simultaneous solution of a set of the coupled partial differential equations under the different initial and boundary conditions. One can readily see that the calculation process is tedious and time-consuming. Therefore, it is desirable to develop a simpler empirical model to satisfactorily predict the breakthrough curves for the multicomponent adsorption.
To describe the breakthrough curves of the multicomponent adsorption with the high accuracy, the use of the simpler and more tractable models to avoid the complicated numerical solution appears more suitable and logical (Chu, 2004). According to our previous work, the breakthrough curve of the single-component adsorption is divided into the symmetric and asymmetric S-shaped curves (Hu et al., 2019). Inspired by this, this work uses the logistic (symmetric) and Gompertz (asymmetric) functions to establish the empirical multicomponent breakthrough models. The basic idea is to treat the breakthrough curves of the weak components as the superposition of the S-shaped and bell-like curves. In a multicomponent system, the two curves correspond to the adsorption and displacement processes respectively. The applicability of the two empirical models proposed in this work is validated by three binary and four ternary adsorption systems. The Engauge Digitizer 11.1 software is used to extract the experimental data in the literature. The estimation of the model parameters is conducted by Origin 9 software using the Levenberg–Marquardt method.
2 Theories and methods
2.1 Multicomponent breakthrough curves
In a multicomponent system, respective mass-transfer zones travel with different velocities for all components. The weak component is the first to reach the adsorbent layer and is adsorbed as a single component in this layer. Later, a new binary equilibrium state is established when the strong component reaches the same layer, which is related to the partial displacement of the previously adsorbed component. In fact, all other components will be subject to the displacement process except for the strongest component. The occurrence of the displacement process often leads to the distinctly different breakthrough behaviors (Worch, 2012). The basic characteristics of the breakthrough curves are shown in Fig. 1. The S-shaped curve appears for the strongest component. In contrast, the concentration overshoot occurs for the weaker components, which depends on the strength of the displacement process.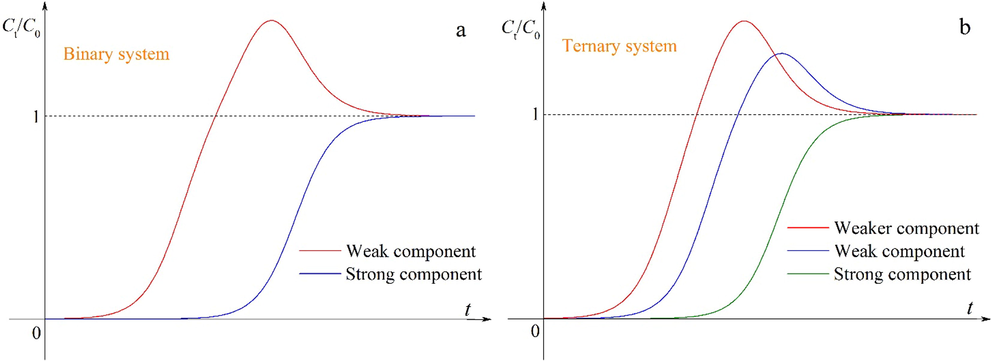
Schematic diagrams of the breakthrough curves in (a) binary and (b) ternary adsorption systems.
The weaker components are simultaneously subject to the adsorption and displacement processes in a fixed-bed column. As a result, their breakthrough curves may be divided into the two segments regarding the horizontal line Ct/C0 = 1 as a boundary. The S-shaped and bell-like curves may express the adsorption and displacement processes respectively according to the curve characteristics of the weaker components. As shown in Fig. 2, the superposition of the two curves is consistent to the breakthrough curves of the weaker components. Next, the main objective of this work is to find suitable mathematical functions to describe the S-shaped and bell-like curves.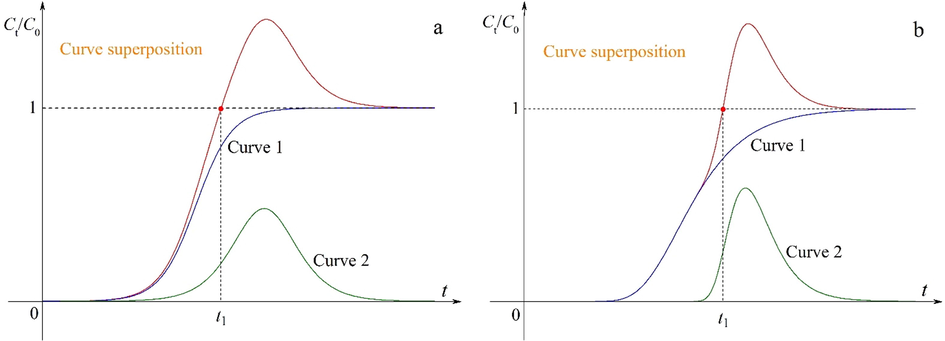
Schematic diagrams of the superposition of the two curves: (a) symmetric and (b) asymmetric.
2.2 Model development
In general, the empirical models should have the simple mathematical forms, good fitting quality and less number of the undetermined parameters (Hu et al., 2021). To obtain a good fit, the distribution of the experimental data must approximate the shape of the function curves (Harter, 1984). More parameters do not necessarily lead to higher fitting quality because the goodness of fit is limited by the data scatter resulted from the unavoidable experimental errors (Worch, 2012). Based on the above experience, the logistic and Gompertz functions are adopted to establish the empirical multicomponent breakthrough models, which represent the symmetric and asymmetric S-shaped curves respectively. The two parameters k and τ are selected to reduce the complexity of the curve fitting. The introduction of the adjustable parameters to the two functions can effectively regulate the curvature and position of the function curves. To facilely understand the role of the parameters k and τ, the logistic and Gompertz functions are written as.
A crucial characteristic of Eqs. (1) and (2) is that the parameter k influences the degree of curvature alone and the parameter τ only affects the position of the function curves. It is well known that the first-order derivatives of the logistic and Gompertz functions are the symmetric and asymmetric bell-like curves respectively, which are expressed as.
It is important to note that.
One can readily see that the two integral values are identically equal to unity and they are not related to the parameters k and τ. Thus, the first-order derivatives of the logistic and Gompertz functions can reflect the strength of the displacement process in a multicomponent system. To simultaneously describe the adsorption and displacement processes for the weaker components, let y + dy/dx = Ct/C0, x = t, then the empirical multicomponent breakthrough models are expressed as.
The empirical multicomponent breakthrough models established by the logistic and Gompertz functions only contain five parameters, and their values are easily obtained by the nonlinear regression. On the other hand, Eqs. (7) and (8) can be also used to predict the breakthrough curve of the strongest component when the parameters k*, τ* and c are equal to zero.
2.3 Equilibrium loading
The accurate estimation of the equilibrium loading is the basis for calculating other process parameters such as the contaminant removal efficiency and length of mass-transfer zone (Gupta and Garg, 2019). The equilibrium loading of each component is obtained by integration of the measured breakthrough curves. As shown in Fig. 3, the equilibrium loading of component 1 is proportional to the area A minus the overshoot area OS, while that of component 2 is proportional to the area A1 plus the area A2. The equilibrium loadings of component 1 and component 2 are given as (Worch, 2012).
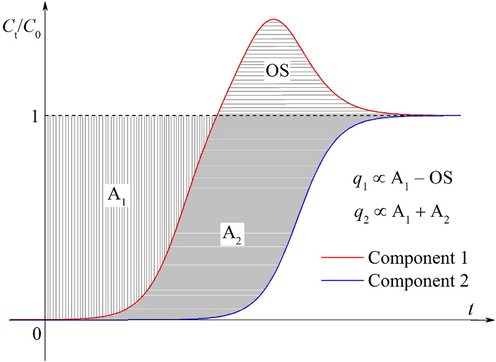
Graphical representation of the adsorbed amounts in a binary system.
According to algorithm of the definite integral, Eq. (9) and (10) are reorganized to.
Substitution of Eqs. (7) into (11) leads to.
Substitution of Eqs. (8) into (11) leads to.
The undetermined coefficients ki, τi, ki*, τi* and ci can be obtained by the nonlinear regression method according to Eqs. (7) and (8). The respective equilibrium loading of the mixtures is then determined under the specific operating conditions (v, C0 and m) according to Eqs. (12) and (13). Although the definite integral is not integrable in the time range [0, ttotal] since the function y = exp(−exp(−x)) has no corresponding primitive function, the integral value can be easily obtained by int command of MATLAB software without complex program code.
3 Results and discussion
3.1 Curve characteristics
It can be clearly seen from Fig. 4a and c that the S-shaped curves for different k values are depicted by Eqs. (1) and (2) respectively, while the bell-like curves are depicted by Eqs. (3) and (4) respectively. To concisely report this work, the effects of other parameters τ, k*, τ* and c on the multicomponent breakthrough curves refer to Supplementary material (Figs. S2–S5). The logistic function (Eq. (1)) gives the symmetric S-shaped curves that pass through one fixed point (τ, 0.5). In contrast, the Gompertz function (Eq. (2)) provides the asymmetric S-shaped curves that pass through one fixed point (τ, e−1). These curves become steeper with the increase in k values, implying more favorable adsorption. The position of the fixed points will rise after superposition. The change in the adjustable parameters k, τ, k*, τ* and c can provide different types of the breakthrough curves, which may describe the different multicomponent adsorption systems.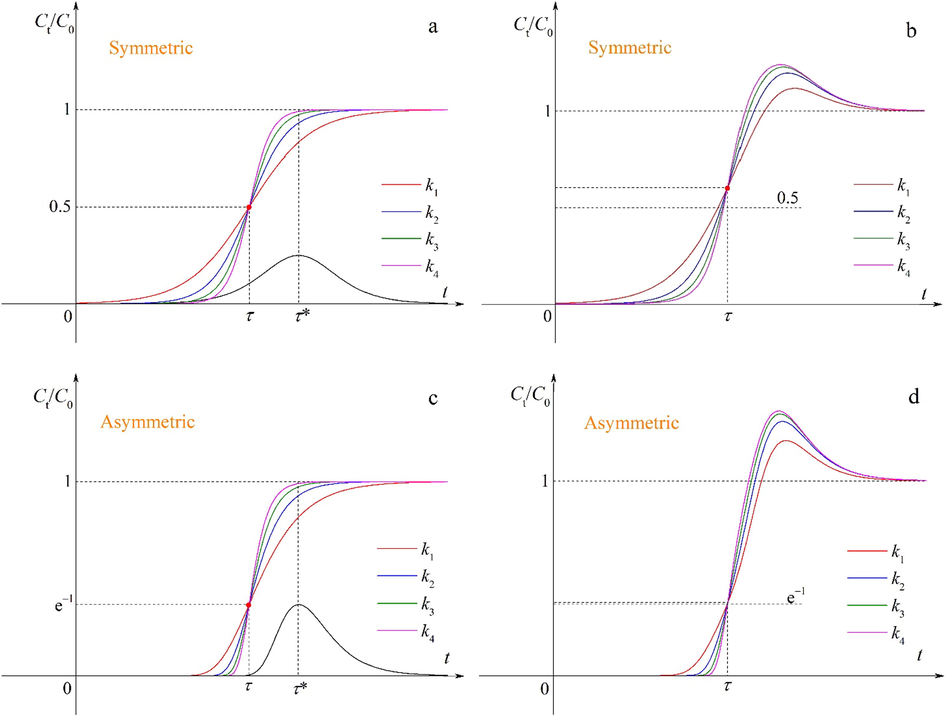
Effects of the parameter k on breakthrough curves before and after superposition (k1 < k2 < k3 < k4).
3.2 Modeling of multicomponent adsorption
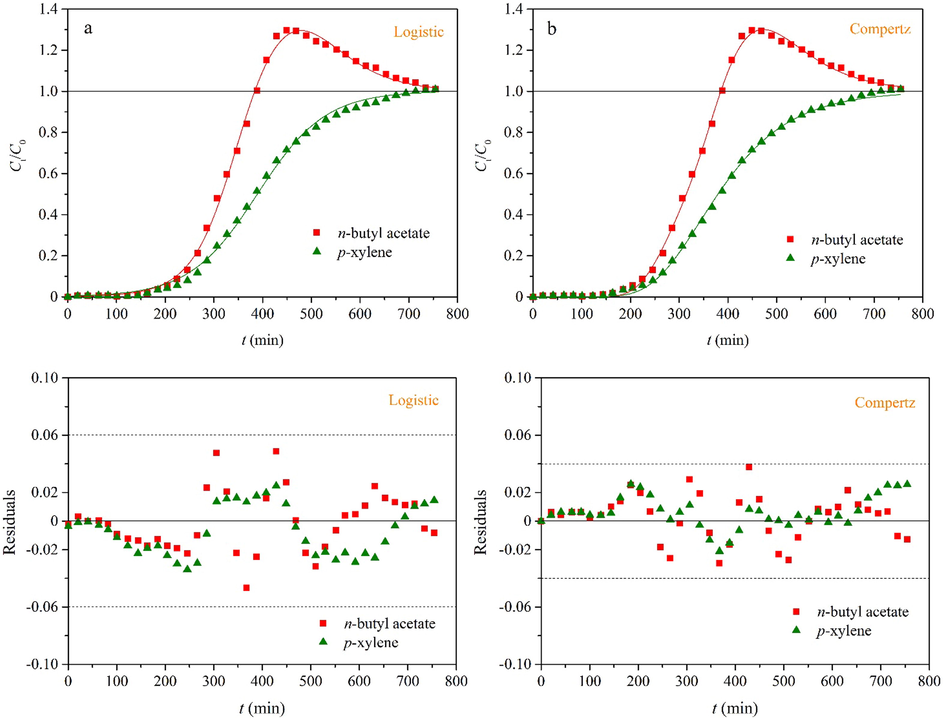
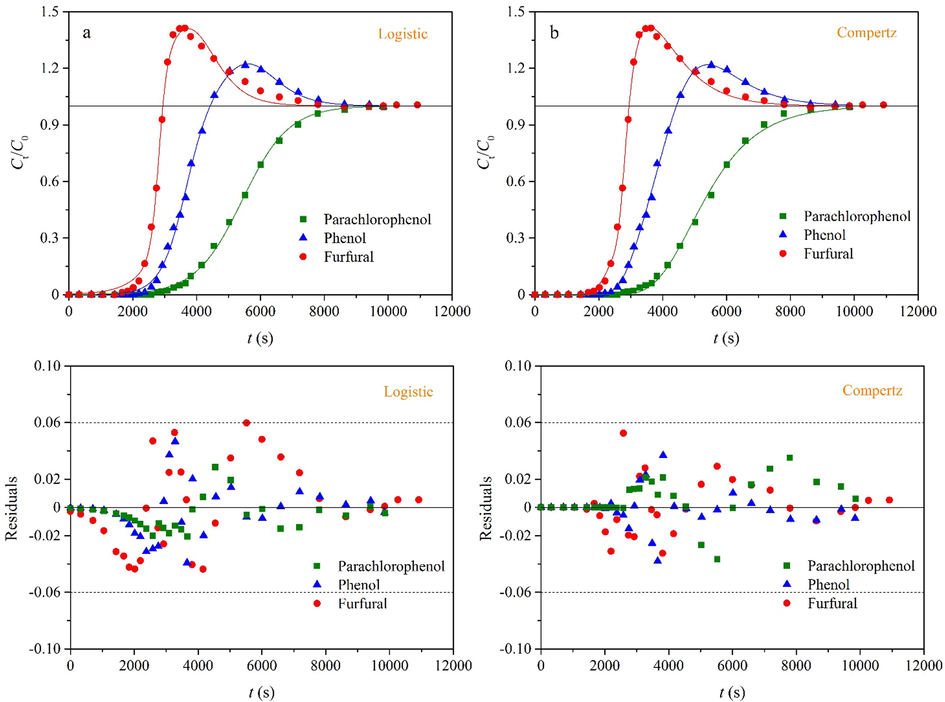
In this work, three binary and four ternary adsorption systems are employed to adequately validate the applicability of the two empirical multicomponent breakthrough models (Eqs. (7) and (8)). To concisely report this work, we mainly discusses adsorption of n-butyl acetate and p-xylene on granular activated carbon in a binary system (Sui et al., 2019) and adsorption of parachlorophenol, phenol and furfural on activated carbon in a ternary system (Sulaymon and Ahmed, 2008). It is observed from Figs. 5 and 6 that the fitting curves agree well with the experimental data. The residual plot is an important tool for the regression diagnostics and can provide a visual representation of the fitting quality (Hu et al., 2020). It is evident that all of the residuals are distributed randomly and fall in a narrow horizontal band for the two systems. As shown in Table 1, the coefficients of determination (R2) are more than 0.997 in the two cases. Hence, Eqs. (7) and (8) provide a good description for the two multicomponent adsorption systems. According to Supplementary material (Figs. S6–S13), the fitting curves pass through the experimental data with few deviations. It is proved that Eqs. (7) and (8) can describe different types of the multicomponent adsorption systems with the high fitting accuracy, including the gas–solid and liquid–solid adsorption. On the whole, the fitting curves provided by Eq. (8) can more accurately describe the experimental data, and all of the residuals fall in a narrower horizontal band. Thus, Eq. (8) has better fitting performance than Eq. (7). This phenomenon suggests that the breakthrough curves are usually asymmetric for adsorption of each component in a multicomponent system. This asymmetric breakthrough curve is mainly attributed to the three aspects (Hu et al., 2021): (i) The adsorbent consists of two or more constituents of unequal reactivity; (ii) the breakthrough curve corresponds to the two different adsorption mechanisms; and (iii) the intraparticle diffusion is the rate-controlling step.
Models
Adsorbate
k (min−1)
τ (min)
k* (min−1)
τ* (min−1)
c
R2
Logistic
n-butyl acetate
2.38 × 10⁻²
341
1.45 × 10⁻²
455
94.5
0.999
p-xylene
1.43 × 10⁻²
389
0
0
0
0.998
Gompertz
n-butyl acetate
1.37 × 10⁻²
292
1.25 × 10⁻²
453
85.3
0.999
p-xylene
1.00 × 10⁻²
343
0
0
0
0.999
Models
Adsorbate
k (s−1)
τ (s)
k* (s−1)
τ* (s−1)
c
R2
Logistic
Parachlorophenol
7.93 × 10⁻³
2817
1.71 × 10⁻³
3727
962
0.997
Phenol
2.59 × 10⁻³
3640
1.56 × 10⁻³
5547
591
0.999
Furfural
1.37 × 10⁻³
5425
0
0
0
0.999
Gompertz
Parachlorophenol
4.97 × 10⁻³
2806
1.13 × 10⁻³
3379
1090
0.999
Phenol
1.46 × 10⁻³
3357
1.05 × 10⁻³
5151
715
0.999
Furfural
8.81 × 10⁻⁴
4888
0
0
0
0.998
3.3 Comparison and novelty
As mentioned above, the empirical breakthrough models proposed in this work have the ability to describe various multicomponent adsorption systems, showing smaller R2 values and randomly distributed residuals. Compared with the fitting results in the original literature, this work provides either smaller R2 values or better fitting curves. That is, Eqs. (7) and (8) provide comparable or better fitting performance for the multicomponent adsorption. The model parameters (k, τ, k*, τ* and c) may be regarded as the lumped parameters that embed some physical processes and operating features. In principle, the coupled partial differential equations require the use of the numerical simulation to solve the breakthrough curves under different initial and boundary conditions. Many experimental parameters need to be collected such as the column parameters, initial operating conditions, bed voidage and adsorbent density. The experimental workload is large and calculation process is very complicated. This simulation method is greatly limited in the practical application. The two empirical breakthrough models have the simple mathematical forms, limited number of the model parameters and good fitting quality. Eqs. (7) and (8) are established by the superposition of the logistic and Gompertz functions and their first-order derivatives respectively. The primitive function and its first-order derivative reveal the adsorption and displacement processes respectively. The model parameters ki, τi, ki*, τi* and ci are directly obtained by the nonlinear regression rather than the complicated numerical solution. The equilibrium loading is easily calculated when the five model parameters are known. Compared with the coupled partial differential equations, the experimental and calculated workload will decrease largely. The two empirical models are successfully applied to the gas–solid and liquid–solid adsorption by adjusting the model parameters.
4 Conclusions
This work establishes the two empirical multicomponent breakthrough models based on the logistic and Gompertz functions. They have the simple mathematical forms, limited number of the model parameters and good fitting performance. The two empirical models provide smaller R2 values and randomly distributed residuals for description of three binary and four ternary adsorption systems, including the gas–solid and liquid–solid adsorption. The model parameters ki, τi, ki*, τi* and ci are regarded as the lumped parameters that embed some physical processes and operating features. Eqs. (12) and (13) give the quantitative calculation of the equilibrium loading for each component in a multicomponent system. The model parameters and equilibrium loading are easily obtained by Origin and MATLAB software. This work may be expected to provide an alternative method for prediction of the multicomponent breakthrough curves.
Acknowledgements
The authors gratefully acknowledge the financial support from the State Environmental Protection Key Laboratory of Synergetic Control and Joint Remediation for Soil & Water Pollution Open Funding (No. GHBK-2021-008).
Declaration of Competing Interest
The authors declare that they have no known competing financial interests or personal relationships that could have appeared to influence the work reported in this paper.
References
- Fixed-bed column dynamic studies and breakthrough curve analysis of Eu(III) ion adsorption onto chemically modified SBA-15 silica materials. Sep. Sci. Technol.. 2017;52:393-403.
- [Google Scholar]
- Adsorption of Th(IV) and U(VI) on functionalized SBA-15 mesoporous silica materials using fixed bed column method; breakthrough curves prediction and modeling. Sep. Sci. Technol.. 2018;53:1282-1294.
- [Google Scholar]
- Phosphate recovery with granular acid-activated neutralized red mud: Fixed-bed column performance and breakthrough curve modelling. J. Environ. Sci.. 2020;90:78-86.
- [Google Scholar]
- Adsorption Technology in Water Treatment: Fundamentals, Processes, and Modeling. Berlin/Boston: Walter de Gruyter; 2012.
- Prediction of breakthrough behaviors using logistic, hyperbolic tangent and double exponential models in the fixed-bed column. Sep. Purif. Technol.. 2019;212:572-579.
- [Google Scholar]
- Some aspects of the behavior of charcoal with respect to chlorine. J. Am. Chem. Soc.. 1920;42:523-544.
- [Google Scholar]
- Application of gas adsorption kinetics I. A theoretical model for respirator cartridge service life. Am. Ind. Hyg. Assoc. J.. 1984;45:509-516.
- [Google Scholar]
- Evaluating the cost and performance of field-scale granular activated carbon systems. Environ. Sci. Technol.. 1987;21:573-580.
- [Google Scholar]
- A new model for heavy metal removal in a biosorption column. Adsorpt. Sci. Technol.. 2001;19:25-43.
- [Google Scholar]
- Modeling competitive adsorption of mixtures of volatile organic compounds in a fixed-bed of beaded activated carbon. Environ. Sci. Technol.. 2014;48:5108-5117.
- [Google Scholar]
- Modification of breakthrough models in a continuous-flow fixed-bed column: Mathematical characteristics of breakthrough curves and rate profiles. Sep. Purif. Technol.. 2019;116399
- [Google Scholar]
- Prediction of breakthrough curves in a fixed-bed column based on normalized Gudermannian and error functions. J. Mol. Liq.. 2021;323:115061.
- [Google Scholar]
- Curve-fit errors in Langmuir adsorption maxima. Soil Sci. Soc. Am. J.. 1984;48:749-752.
- [Google Scholar]
- Adsorption and oxidation of ciprofloxacin in a fixed bed column using activated sludge derived activated carbon. J. Environ. Manage.. 2019;250:109474.
- [Google Scholar]
- Binary adsorption equilibrium and breakthrough of n-butyl acetate and p-xylene on granular activated carbon. Ind. Eng. Chem. Res.. 2019;58:8279-8289.
- [Google Scholar]
- Competitive adsorption of furfural and phenolic compounds onto activated carbon in fixed bed column, Environm. Sci. Technol.. 2008;42:392-397.
- [Google Scholar]
- Nitrate removal from aqueous solution using polyaniline modified activated carbon: Optimization and characterization. J. Mol. Liq.. 2020;309:113057.
- [Google Scholar]
- Deeper insights into the Bohart-Adams model in a fixed-bed column. J. Phys. Chem. B. 2021;125:8494-8501.
- [Google Scholar]
Appendix A
Supplementary material
Supplementary data to this article can be found online at https://doi.org/10.1016/j.arabjc.2022.104034.
Appendix A
Supplementary material
The following are the Supplementary data to this article:Supplementary data 1
Supplementary data 1


