

Translate this page into:
Prediction of crystallization of a colloid-protein complex by controlled complex self-assembly at the solution surface
⁎Corresponding author at: College of Ocean and Earth Sciences, State Key Laboratory of Marine Environmental Science, Xiamen University, Xiamen 361005, China liuxy@xmu.edu.cn (Xiangyang Liu)
-
Received: ,
Accepted: ,
This article was originally published by Elsevier and was migrated to Scientific Scholar after the change of Publisher.
Abstract
A solution mixed with colloidal particles and protein is applied in the fabrication of photonic crystals. In this study, the interaction between colloidal particles and protein molecules was investigated, and a structural model was proposed to describe how they combined. The crystallization conditions of the complex were estimated without the actual formation of the crystal but by using the kinetics of two-dimensional self-assembly. The kinetics included three processes: diffusion, penetration, and rearrangement. The characteristics of each step were acquired by measuring the surface tension. The coefficient of crystallization was then proposed after calculation, and this offered a creditable and efficient criterion for predicting the complex crystallization in solution containing protein and PS particles.
Keywords
Colloidal particle-protein complex
Crystallization
Aggregation
Prediction
Self-assembly

1 Introduction
Colloidal crystallization represents a major process adopted to create 2-D and 3-D periodic structures that can be applied in photonic devices (Vlasov et al., 2001; Cheng et al., 2006), biological/chemical sensors (Holtz and Asher, 1997), or tunable laser fields (Lawrence et al., 2006) (Fig. 1). Under most circumstances, defect-free crystals of high quality are needed, so the regulation of crystallization processes is of vital importance (Zhang and Liu, 2014). Fortunately; the colloidal particles within the solutions are similar to large “atoms” (Poon, 2004; Frenkel, 2002) and their phase behaviors are analogous to those of the molecular or atomic system (Anderson and Lekkerkerker, 2002). The colloidal particles are enormous in size relative to the atoms; hence, they can be observed directly under the light microscope. A method for direct visualization of the position of nanoscale colloidal particles at air–water interfaces is presented (Vogel et al., 2014). Moreover, they can be tracked at the level of a single particle in real-time because they move slowly. Further, the interactions among the colloidal particles are transformed by regulating the solution pH (Vogel et al., 2011b); ionic strength, frequency, or strength of the applied field (Diao and Liu, 2012). As a result, in the process of colloidal crystallization, it is feasible to control the thermodynamic driving force accurately. In addition, it is possible to control the process of colloidal crystallization and produce it with high quality and on large scale.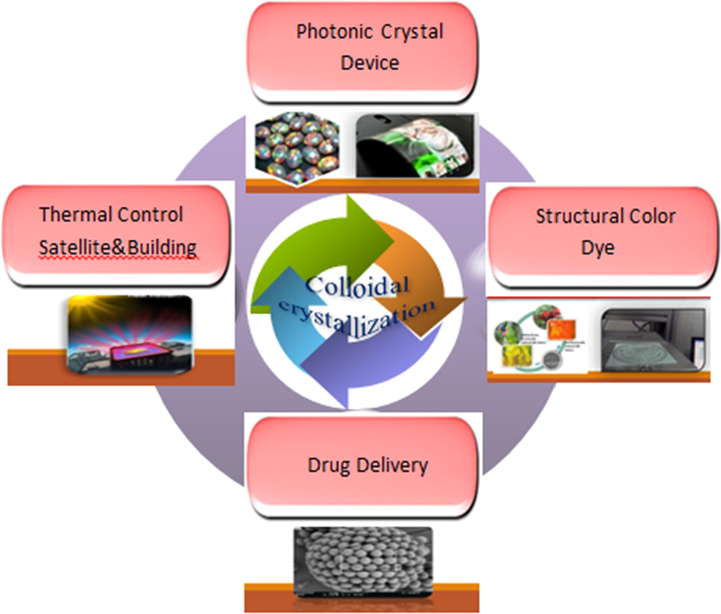
Applications of colloidal crystallization such as photonic crystal device (Kim et al., 2010), thermal control satellite (Bo et al., 2016), structural color dye (Diao and Liu, 2012), and drug delivery (Zhang and Liu, 2014) etc.
PS (polystyrene) colloidal particles are generally used in the fabrication of photonic crystals (Johnson et al., 2001; Wijnhoven and Vos, 1998; Edrington et al., 2001; Baba, 2008; Kivshar and Agrawal, 2003) due to their perfectly spherical shape, smooth surface, and uniform particle size. Based on our previous research (Chen et al., 2016), particles of different sizes show different effects when combined with protein. This difference may be ascribed to the fact that smaller particles have a greater surface-to-volume ratio. However, when their surface area was adjusted to the same by controlling concentration of particles, they will have nearly close influence, further confirming the surface area of colloidal particles may play an important role when combined with protein. Moreover, in addition to systems composed on particles of a single size, binary mixtures of particles in both crystalline and amorphous phases are of primary interest for practical applications (Valeria et al., 2016; Lotito et al., 2018; Lotito and Zambelli, 2019).
The typical system for the formation of artificial photonic crystals is a binary one based on colloidal particles with air, and also with surfactants (Vogel et al., 2011a) or polymers. The main mechanisms underlying their formation and the mathematical tools commonly used to analyze their final morphology were extensively discussed (Lotito and Zambelli, 2017). However, sometimes these systems will easily have cracks and thus destroy the appearance and properties of the photonic crystals. Hence, in this paper, proteins such as silk fibroin (SF) (acquired from silkworm silk (Park et al., 2014) and keratin (acquired from wool fiber (Huang et al., 2016) were used to form complex with the PS particles. Compared with air, protein has better elasticity and moisture, so this may reduce the cracks inside the photonic crystals.
Protein self-assembly on the surface of water solution has previously been reported to exhibit identical structure to that of the crystal structure (Jia and Liu, 2005). This 2-D assembly may act as a self-template for the 3-D crystallization of proteins. Additionally, some authors utilized the kinetics of 2-D assembly to investigate the protein crystallization kinetics (Jia and Liu, 2006). In this paper, we examined whether this theory could be applicable for the complex of protein and PS spheres by monitoring the assembly of the complex at the interface between air and water. We also determined the association between the crystallization conditions and the complex surface assembly.
The investigation aimed to: (1) demonstrate interactions between the protein molecule and colloidal particles; (2) investigate the surface assembly kinetics within the complex system model and adapt the 2-D assembly kinetics on 3-D crystallization kinetics to shed more light on the association of kinetics with crystallization conditions; (3) put forward a novel criterion to predict colloidal crystallization in the presence of the bimolecular effect; and (4) develop new laboratory facilities to efficiently control the colloidal assembly to realize high quality, large area, and controllable colloidal crystallization.
2 Experiments
Materials: Wool fibers and Bombys mori silkworm cocoons were provided by Tongxiang dushi woolen material Co., Ltd and Guangxi Sericulture Technology Co., Ltd, respectively. Polystyrene (PS) particles (350 nm) were purchased from Thermo Fisher Scientific Particle Technology (Fremont, USA). Acetone, ethyl alcohol, urea, sodium sulfide, Sodium dodecyl sulfonate, sodium bicarbonate, lithium bromide, were purchased from Aladdin (Shanghai, China). High purity deionized water (18.2 MΩ) produced by a Millipore Milli-Q system (0.22 um) was used for preparing buffers, which were used as solvents for mixed solution. The pH was adjusted by the corresponding acid and hydroxide within the accuracy of ± 0.1. The stock solutions of proteins were prepared and refrigerated at 4 °C for further use.
Preparation of keratin solution: Wool keratin solution extracted from fibers was prepared by a reductive method. Wool fibers were cleaned in acetone and ethyl alcohol successively for 2 h to remove grease and purities. Keratin solution was obtained by immersing scoured wool fibers (5 g) in 100 ml of aqueous solution containing 7 M urea, 0.08 M Na2S and 0.8 g of SDS and stirring at 50℃ for 8 h, then filtered and dialyzed against deionized water, using cellulose tubing (molecular weight cutoff of 3500D) for 3 days.
Preparation of Aqueous Silk Fibroin Solutions: Silkworm silks were reeled from Bombyx mori cocoons and degummed in boiling aqueous solution of 0.5 % (w/w) NaHCO3 for 30 min twice with frequent stir. After that, the degummed silk fibers were washed with warm deionized water for 5 times. The regenerated SF was obtained by dissolving the degummed silks into 9.3 M LiBr solution for 4 h at 60 °C, and then extracting LiBr from SF solution via a dialysis cassette (Solarbio, molecular weight cut-off 3500) for 2 days with frequent change of DI water.
Preparation of PS-protein mixed Solutions: 10 ml solutions mixed with protein (SF and keratin) and particles by ratio of 1:1 were prepared right before the measurement. The crystallization kinetics of a solution mixed with 0.006 mg/mL SF and 0.00875 mg/mL PS were studied, and also the solution mixed with 0.005 mg/mL Keratin and 0.00875 mg/mL PS. The pH value was constantly controlled and regulated by the automatic addition of the reagent: 1 mol/dm3 HNO3 to lower the pH or 0.5 mol/dm3 NaOH to raise the pH. The pH test was performed with TiroLine 7000 automatic titrator from SI Analytics.
Scanning Electron Microscopy: 200 μl of 1% (w/v) suspension of 350 nm PS particles were centrifuged at 2500 rpm for 5 min and the PS particles were then dispersed in 1 ml of 5 mg/ml silk fibroin solution. After 30 mins incubation, the suspension was centrifuged at 3000 rpm to remove the dissociative SF, respectively. The pellets were re-dispersed in 1 ml DI water. And then 20 μl of the suspension was applied to a silica slide and dried under ambient conditions. The morphology of the PS particles interacted with SF was characterized by SEM (Hitachi SU-70) after coating with platinum.
Confocal Laser Scanning Microscopy: FITC-labeled SF was synthesized based on the covalent conjugation of isothiocyanate group pf FITC and the amino group of SF. Briefly, 1 ml Na2CO3 (0.5 mM) solution was added to 10 ml of 70 mg/ml SF solution, and then 7 mg FITC in 1.4 ml DMSO was gently added in to as-prepared SF solution. And the mixture was slowly stirred for 2 h in the dark at room temperature. Finally, the FITC labeled SF solution was obtained by dialysis in the dark for 6 h to remove unconjugated FITC. Afterwards, 200 μl of 1% (w/v) 350 nm PS particles suspension were centrifuged at 2500 rpm and the PS particles were then re-dispersed in 1 ml of 5 mg/ml FITC-labeled SF solution in the dark. After 30 min incubation, the suspension was centrifuged at 3000 rpm to obtain SF incubated PS particles. The pellets were re-dispersed in 1 ml DI water. And then 20 μl of the suspension was applied to a glass slide and dried under ambient conditions. The fluorescence images of FITC-labeled SF incubated PS were obtained with Leica TCS SP8 confocal Laser Scanning microscope.
The adsorption kinetics of complex: The interfacial adsorption kinetics of the PS-protein complex was investigated through dataphysics (DCAT11) tensiometer. In brief, the tensiometer trough was placed in the circulating water bath at a constant temperature of 23 0.5 °C. Thereafter, the sample chamber was saturated with pure water vapor for maintaining a humidified environment. Chromic acid was used to clean each container utilized in the present experiment to eliminate possible organic pollution. The change in the interfacial tension was recorded at intervals of 25 s. Moreover, the testing process stopped automatically if the deviation of the last 50 points was<0.01 mN/m.
3 Theory
3.1 Interaction between PS spheres and protein molecules
In this experiment, solutions of PS spheres and silk fibroin were combined to form a complex (Fig. 2 (a)). The PS spheres were grafted using the carboxyl group from acrylic acid. SF is a protein which contains the amino and carboxyl groups. Strong hydrogen bonds form between the carboxyl group on the PS spheres and the amino groups on the SF. This gives strength for combining the two molecules. Due to the carboxyl group on the surface, PS spheres are hydrophilic. However, SF possesses both hydrophilic and hydrophobic groups and is amphiphilic. Therefore, the hydrophilic groups of SF connect with PS, and the hydrophobic ends coil inwards during the first stage. Later, the hydrophobic ends try to escape from the water and stretch to the solution-air interface to make the system more stable by decreasing the free energy (Fig. 2(b)). Simultaneously, the whole complex gets pulled together at the interface. Finally, the hydrophobic parts of SF spread out of the surface, and the hydrophilic parts accompanying the PS spheres assemble at the interface, as seen in Fig. 2(c). Thus, the hydrophilic parts of the SF molecule form a glue-like material among the PS spheres.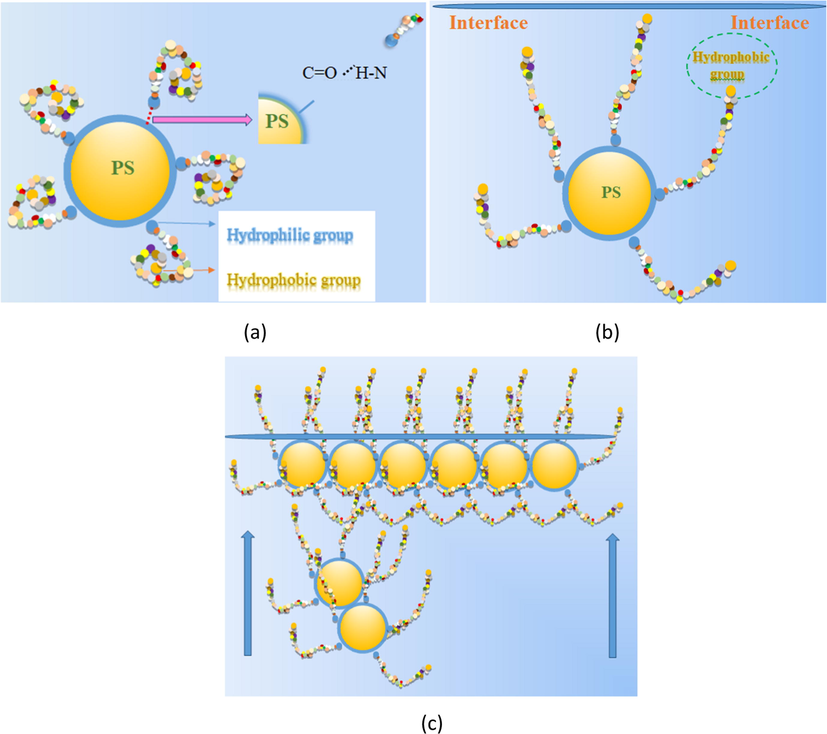
(a) PS spheres and silk fibroin were combined as a complex by hydrogen bond. (b) The hydrophobic ends pull the whole complex up to interface. (c) Finally, the hydrophobic part of complex will spread out of surface, and the hydrophilic parts company with PS spheres will assembly at the interface.
For better validation of the combination of SF solution and PS sphere, confocal laser scanning microscopy (Fig. 3(a)) and SEM (Fig. 3(b)) were employed and the SF grafting was traced on the PS surfaces. As previously reported (Wang et al., 2007); fluorescein isothiocyanate (FITC) showed covalent bonding with the SF proteins and labeled specific molecules. After incubating the PS particles within the FITC-labeled SF solution for 30 min, they were harvested through centrifugation. The detectable SF molecules labeled by green fluorescence were found to aggregate in areas surrounding the microspheres after incubation. Besides, according to the SEM images regarding PS subjected to incubation within SF solutions, SF molecules accumulated around the PS particles, and connected them like glue.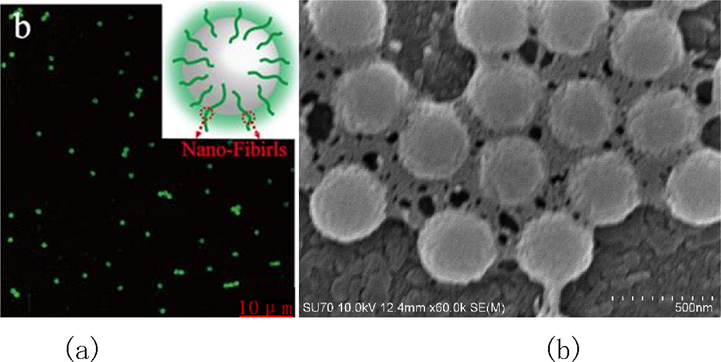
(a) Confocal laser scanning microscopy image of PS particles which were incubated in FTIC labeled SF solution for 30 min. (b) SEM images of PS particles incubated in SF solutions for 30 min.
3.2 Complex 3-D crystallization kinetics
The SF molecule-grafted PS sphere complexes attempted to escape from the solution to the interface; they were then combined in the kink sites of the protein (surface kinetics, Fig. 4). Such a result suggests that the entire kinetics of crystallization mostly depends on two processes, namely volume transport and surface integration. In addition, specific orientation and conformation are needed by the complex macromolecules at specific sites due to 3-D symmetry.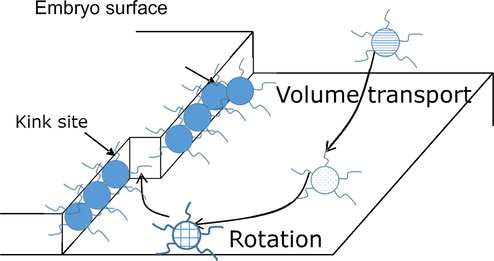
The complex of PS spheres grafted with SF molecules are trying to escape from solution to the interface, and incorporated into kink sites (surface kinetics).
According to our previous work, amorphous aggregation in protein crystallization with markedly more rapid volume transport than surface integration was more favorable than crystallization from the kinetics perspective (Zhang and Liu, 2003). Such a conclusion can be applied to complex molecules as well (Fig. 5(a) and (b)). For rapid surface integration, there is sufficient time for the adsorbed molecules to realign before other molecules reach. The complex molecules aggregate to form an orderly compact structure and finally grow into a crystal. In contrast, for the rapid transport of the growth unit to the surface, there is insufficient time for the initially coming molecule to seek out the most appropriate conformation and orientation before the arrival of the next molecule. Therefore, it is kinetically more favorable to form the amorphous phase than the orderly 3-D crystalline phase. Thus, these adsorbed molecules aggregate without the formation of an orderly structure and eventually lead to amorphous aggregation.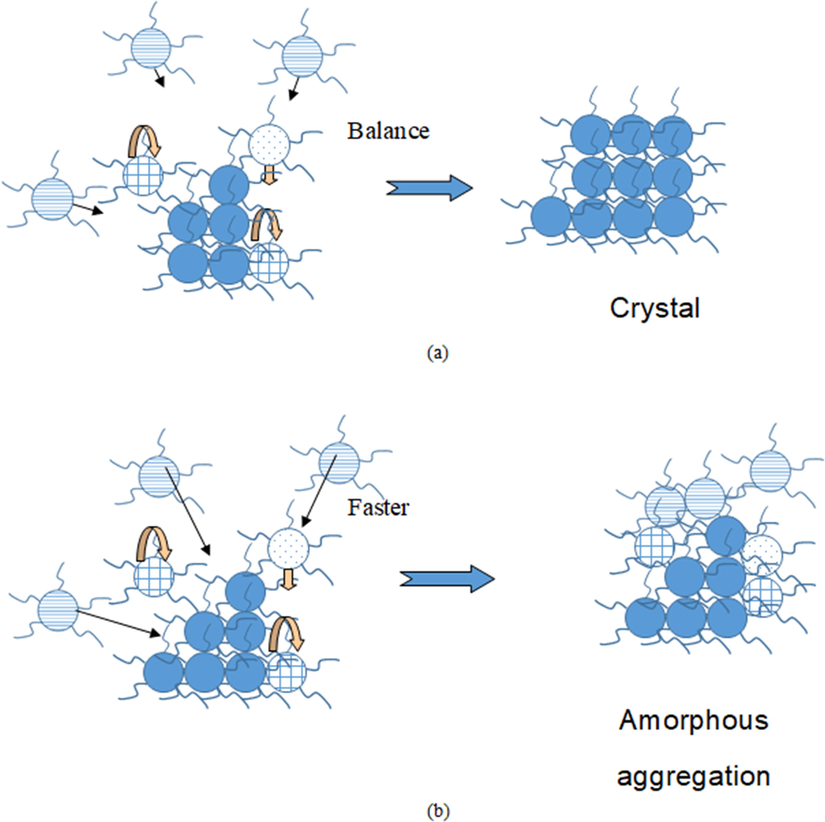
Kinetics of complex crystallization and amorphous aggregation. (a) Formation of a crystal when the rate constant of the molecular volume transport is comparable with that of a molecular rearrangement. (b) Formation of amorphous aggregation when the volume transport is much faster than the molecular rearrangement.
3.3 Complex 2-D interface assembly kinetics
As suggested by our prior work, protein self-assembly at water solution surface displayed an identical structure to that of crystal structure(Jia and Liu, 2005). Such 2-D self-assembly plays the role of the self-template to carry out 3-D protein crystallization. Besides, this is a novel and facile approach to study the complex crystallization kinetics at the interface between PS and protein.
The interfacial 2-D self-assembly kinetics of complex molecules involves three successive or simultaneous processes: (a)complex molecules diffuse onto the interface; (b)complex molecules penetrate the film at the interface between the substrate and the surface; (c)the molecules absorbed into the film are rearranged at the molecular level(Magdassi, 1996). In comparison, the initial process in 3-D complex crystallization kinetics is associated with volume transport; the remaining two processes are similar to surface integration. In each process, the complex molecules must surmount a definite energy barrier (Liu, 2001; Chernov, 1984), as illustrated in Fig. 6.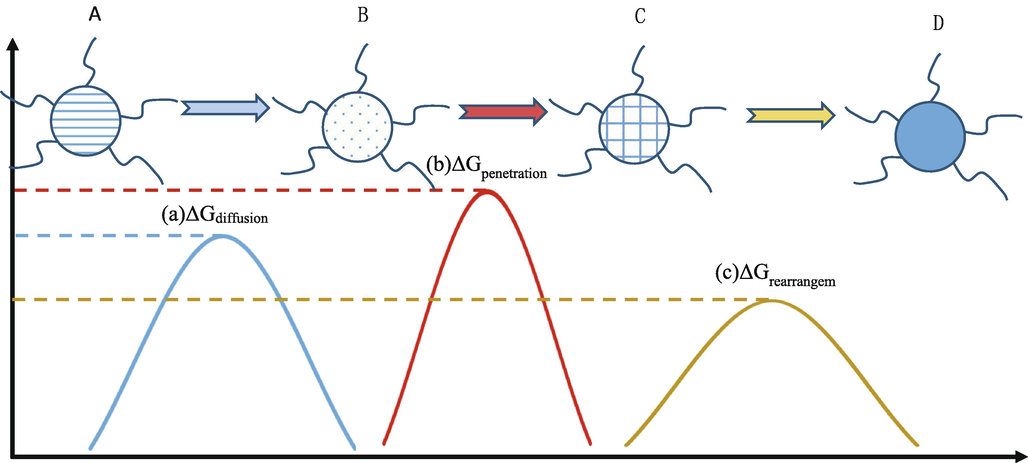
The kinetics of 2D self-assembly of complex molecules at the interface includes three processes, and during each process, complex molecules have to overcome specific energy barrier. (a) a diffusion of complex molecules to the interface; (b) the penetration of complex molecules through the interface film from subsurface to surface; and (c) molecular rearrangements of adsorbed molecules in the film.
The complex at the initial stage in the solution is defined as A. Due to the presence of hydrophobic groups in the protein, it rises toward the surface. It transforms into B when the ΔGdif is overcome, while B is at the subsurface of liquid–air. This is defined as
It follows that the relaxation time for such a transformation is where VA indicates the thermal vibration frequency for A units, kB represents the Boltzmann’s constant, and T indicates the temperature.
Thereafter, the B unit must surmount ΔGpen and diffuse into the subsurface to coat the surface before it is transformed into C.
In this transformation, the relaxation time is calculated by the following formula: where VB represents the thermal vibration frequency of B units.
After complete coverage of the surface, the C units must remodel their conformations and orientations to make room for the incoming molecules. Further, they overcome ΔGrea and are transformed into D.
In such a transformation, the relaxation time can be calculated by where VC stands for the thermal vibration frequency of C units.
Based on the above analyses, both τp and τr are associated with surface kinetics. Typically, this relaxation time can be determined to be the surface integration time, τk = τp + τr. Besides, τd, the time required for the volume transport of one fluid molecule to the subsurface shows a negative correlation with the complex self-diffusion coefficient.
In nature, the formation of crystallization or amorphous aggregation is favorable from the kinetic perspective as well as the energy perspective according to the following equation:
where ΔG represents the energy barrier kinetics from one state to another during the process of complex crystallization. The reduced relaxation time τ or increased relaxation is associated with a reduced energy barrier. When diffusion is more rapid than surface integration, it is associated with a reduced energy barrier compared to kink integration. As a result, diffusion is favored over surface integration. Consequently, as a semi-stable state, amorphous aggregation occurs before the occurrence of any orderly crystal structure. For predicting the possibility of the growth of complex molecules to the amorphous aggregate or the crystal, the coefficient of crystallization
is introduced. It refers to the ratio of diffusion rate to surface integration rate according to the following equation:
Nonetheless, it is difficult to measure τk and τd in an experiment directly. Therefore, other approaches are necessary to predict their values.
Proteins are amphiphilic and subjected to self-assembly at the interface between air and solution. Therefore, the entire complex is pulled to the interface. According to Gibbs surface excess equation (Liu, 2002);
According to the Gibbs surface excess equation (2), surface tension decreases when complex molecules are absorbed onto the surface. The surface tension kinetics represents the interfacial 2-D self-assembly kinetics of the complex.
According to Fig. 7, during the initial surface assembly period, diffusion serves as a rate-determining factor (Fig. 7(a)) (Ward and Tordai, 1946). Typically, surface tension can be calculated by the following formula:
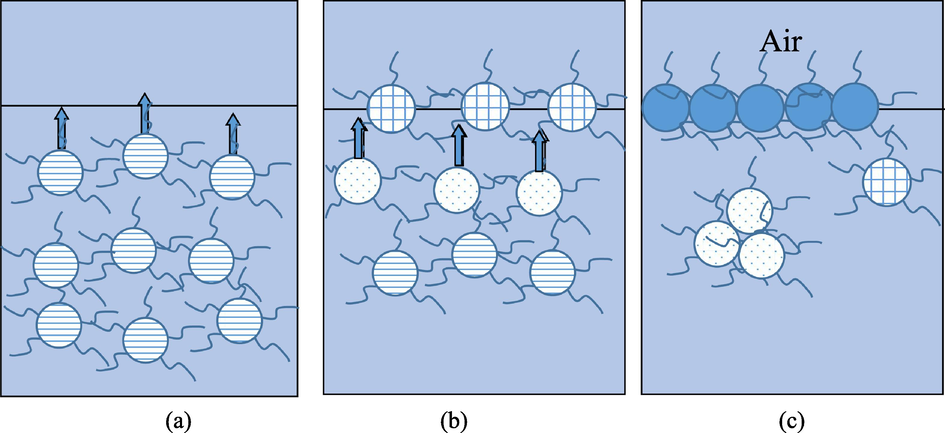
Complex molecules 2D interface assembly kinetics. (a) Molecules diffuse to the air/solution interface immediately after combined as complex. (b) When more molecules cover the surface, the subsequently impinging molecules need to penetrate subsurface to be adsorbed at the surface. (c) When the surface is almost fully covered, the molecules at the surface need to rearrange their orientations and conformations to make space for the arriving molecules.
where γ(t) stands for the surface tension at the t time point, γ0 represents the surface tension of the solvent, Cp indicates the bulk concentration of the complex, and D indicates the complex diffusion coefficient. The plot considering γ as a function of t1/2 is linear in this process (Tornberg, 1978; Graham and Phillips, 1979) and occurs only at the beginning of the surface assembly.
When the surface is covered to a greater extent, the molecules have to overcome the energy barriers to penetrate the surface. Notably, penetration becomes the rate-determining factor during this process (Fig. 7(b)). After achieving complete coverage of the surface, the reduced surface tension mainly depends on the rearrangement of molecules within the film (Fig. 7(c)). In the case of the assembly energy barrier, Eq. (3) transforms as follows (Park et al., 2014; Huang et al., 2016; Jia and Liu, 2005):
In the case of complex molecules penetrating the interface, the surface free energy is affected. This is because of the effect of the predominant first layer on determining Π in the process of polymer adsorption. Any alteration of Π makes it convenient to monitor surface penetration and configuration realignment for the absorbed complex molecules. The first-order equation can be used to analyze the process rates (Graham and Phillips, 1979; Subirade et al., 1992) according to
For determining the limits of the three steps during interfacial adsorption, the plot of ln(dΠ/dt) as a function of Π was divided into consecutive linear parts according to regression analysis; here, each step corresponded to one kinetic step. The limits of these three steps were modified to conform to those discovered from the plot of ln(1-Π/Πe) vs. t. The resultant diffusion step equaled to the respective step acquired based on the plot of γ as a function of t(1/2). These limits were further modified to achieve the maximum fitting coefficients in each linear regression fitting.
4 Results and discussions
As observed from Fig. 8(a), surface tension showed a decreasing trend as the pH of the mixed solution (PS colloid blended with SF protein) increased. The surface tension became nearly unchanged at pH = 12. This pH value was regarded as the critical assembly pH (CAP) or aggregation pH value. It was possibly associated with the presence of an electrical double layer surrounding the protein molecules (Liu, 2002; Hunter, 2001). The addition of sodium hydroxide into the mixed solution reduced the effective size of the complex molecule and thus resulted in a more compact complex packing at the surface. Fig. 8(b) presents the results of another mixed solution (PS colloid blended with keratin) where CAP is also present.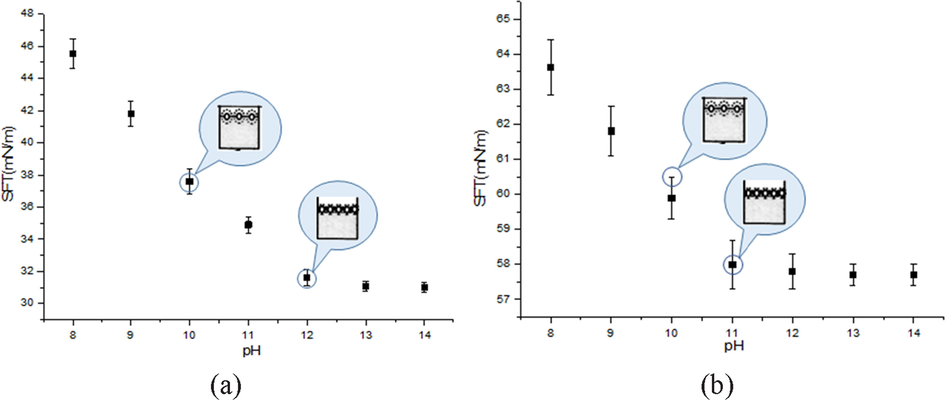
Dependence of average surface tension as a function of pH value in solutions mixed with PS colloidal and (a) SF protein and (b) keratin protein.
Strikingly, this study discovered that CAP was influenced by the crystallization conditions. CAP represents the critical point that marks the beginning of the complex assembly or aggregation within the bulk solution; in this regard, no complex will be further dissolved above the CAP. Therefore, CAP is determined by the complex solution concentration. As shown in Fig. 9(a) and (b), CAP increases with a decrease of both the concentration of PS and protein.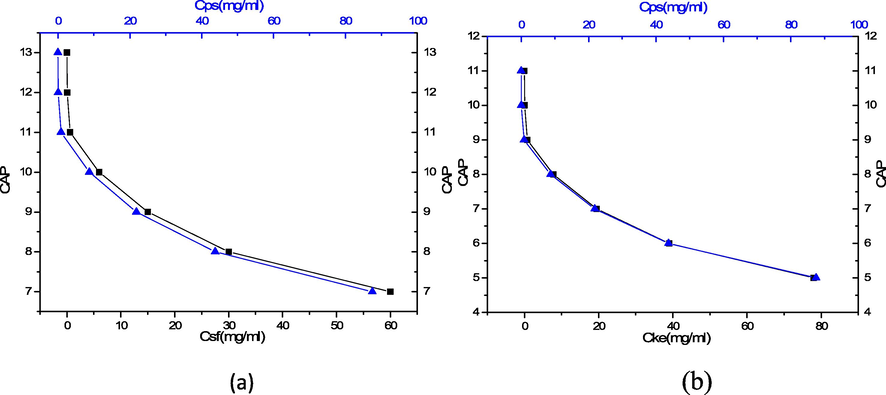
Dependence of CAP with concentration of PS colloidal and (a) silk fibroin (b) keratin protein.
The crystallization kinetics of a mixed solution of PS particles and protein were studied by evaluating the dynamics of surface tension. Fig. 10 displays the alterations of the solution surface tension at diverse pH values. Clearly, the increase in the pH value led to a reduction in the time (te) required for reaching the steady-state and the equilibrium surface pressure. As observed, te declined from 8000 s in the pure solution to 4000 s at pH = 13. This was associated with an increased complex molecule diffusion rate within the alkaline solutions (Fig. 11). It was possibly caused by the conformational change of proteins with regulation of pH, while the surface integration rate is greatly affected by the conformation of proteins.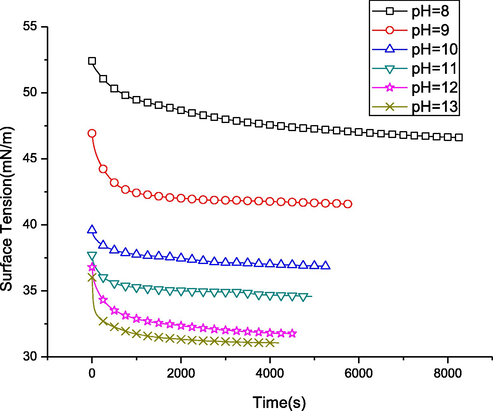
Time dependence of surface tension at the air/water interface for 0.006 mg/mL silk fibroin and 0.00875 mg/mL PS spheres with different pH values.
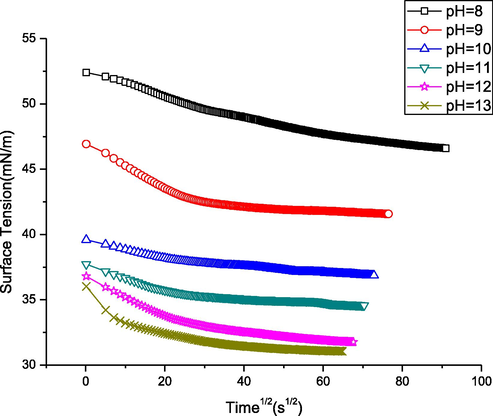
Surface tension as a function of the square root of time. The linear part shows the limit of the diffusion controlled step in the three-step process of the complex assembly at the aqueous solution surface.
Surface tension dynamics can be classified into three successive processes, namely diffusion, penetration, and rearrangement. According to Tornberg (1978) and Graham and Phillips (1979); in the common plot of γ(t) = f(t(1/2))(Fig. 11) (Eq. (3)), the linear part represents the determined limit of diffusion process.
Whereas ln dΠ/dt = f(Π) in Fig. 12) (Eq. (4)) shows obvious three stages with different slopes, which indicates the three interface assembly processes for each sample.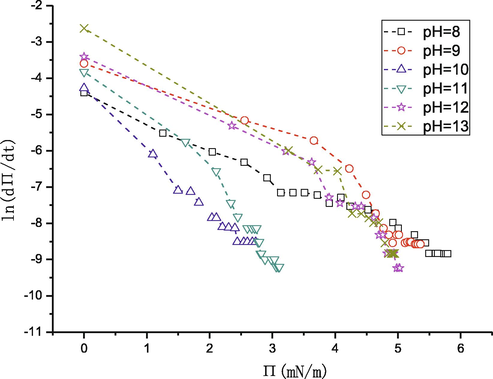
ln(dΠ/dt) as a function of Π, which shows the three adsorption steps by the linear regression.
In the curve ln(1 - Π/Πe) = f(t), the resultant slope presents the rate constant of each process (Fig. 13) (refer to Eq. (5)). We performed a piecewise fitting to the curves in Fig. 13 and got the slope of each piece, which represents rate constants of diffusion, namely kd, rate constants of penetration, namely kp, and rate constants of rearrangement, namely kr. The linear fit result to curve of pH = 8 is shown in Fig. 13 as a typical example.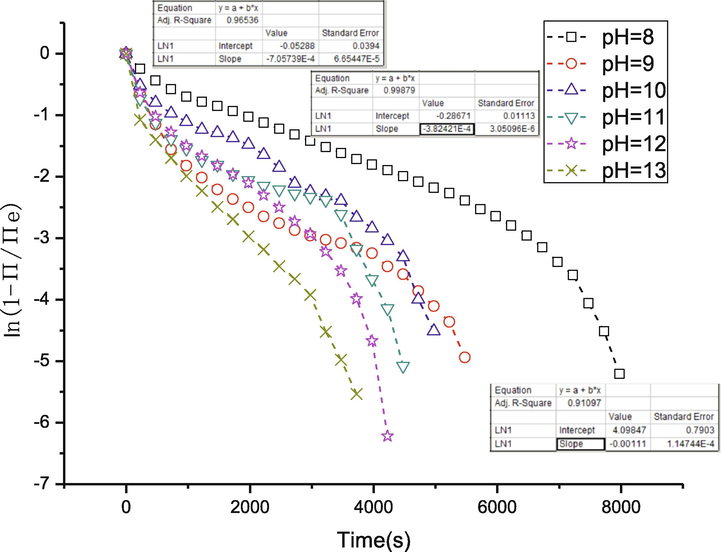
ln(1 - Π/Πe) as a function of time. The rate constants for different steps can be obtained from the slope of the linear regression parts.
Fig. 14 displays the association of the pH value with three rate constants. Obviously, the rate constant for each step was determined by the pH value. The diffusion rate increased significantly as the pH value increased. In contrast, the rate constants for rearrangement and penetration showed less obvious changes even though the slightly increased kp value was acquired at an increased pH value. Such changes were interpreted according to the electrical double layer theory.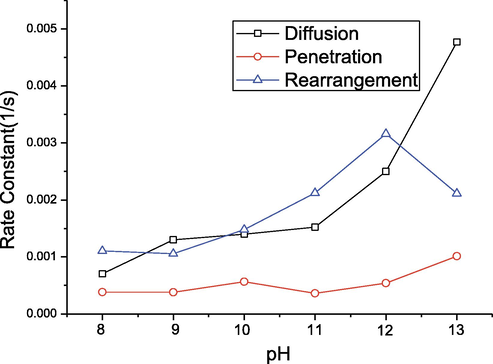
Rate constants of diffusion, kd, penetration, kp, and rearrangement, kr, as a function of pH values.
The PS sphere and SF protein were combined to form a complex whose core was formed by the PS sphere and the surroundings by the SF protein. The isoelectric point of silk fibroin is about 3.5, so the SF protein is negatively charged in an alkaline solution. The electric double layer of the complex molecule is thick and exerts a strong influence. The mobility of the complex molecule is low as it moves because it has to drag the double layer surrounding it. In the presence of sodium hydroxide, the surface charges of the protein molecule are screened by the counterions in the solution. This decreases the thickness of the double layer around the complex (Hunter, 2001; Adamson, 1997). Therefore, the effective size of the complex molecule decreases, resulting in increased molecular mobility. The presence of sodium hydroxide increases the volume transport rate of the complex molecules in bulk to the surface. However, the surface integration, including penetration and rearrangement, is greatly influenced by the intrinsic properties of molecules, such as their conformations.
Fig. 15 presents the changes in the coefficient of crystallization
related to amorphous aggregation and crystallization conditions for the complex under diverse pH values. As found from the batch crystallization experiments, favorable single crystals were acquired at 8.5 < pH < 12.5. At pH > 12.5, amorphous aggregation took place immediately in the case of supersaturation.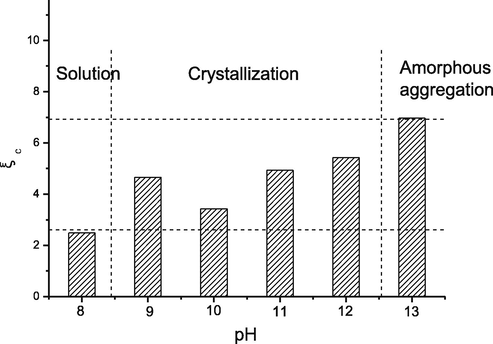
Crystallization coefficient,
, of PS-SF in a sodium hydroxide solution with different pH values. A kinetic crystallization window is determined by comparison with the crystallization results.
According to the discussion in Section 3.3, indicates the possibility of a protein getting crystallized under specific conditions. A favorable single crystal is formed within a suitable range with comparable diffusion and surface integration rates. The high value is associated with the significantly reduced surface kinetics of protein crystallization compared with that of volume diffusion. The formation of amorphous aggregation is quite probable in this solution.
Fig. 16 presents the crystallization results of complex with different pH values. Apparently to the naked eye, when pH < 9, no crystallization appeared, when pH value is between 9 and 12, there existed crystallization more or less, and when pH > 13, obvious aggregation has appeared. Researchers (Lotito and Zambelli, 2020) have reported a methodical and extensive description of real-space image analysis tools to extract morphological information on particle arrangement and order which can describe systems quantitatively.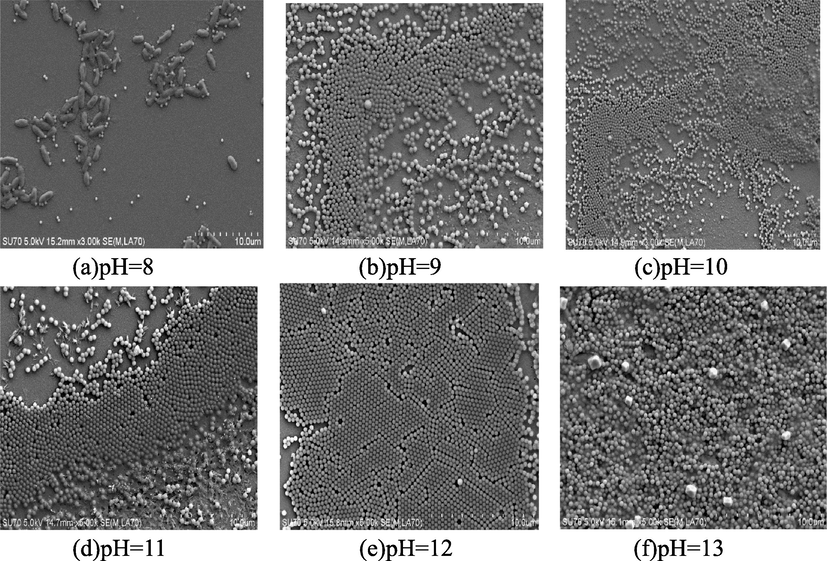
SEM of interface of liquid–air with different pH values. (a) No crystallization and aggregation appears, still solution. (b)–(e) Crystallization has formed more or less. (f) Obvious aggregation has appeared.
When crystallization conditions are compared with the coefficient of crystallization, it was found that was within the range of 3 < < 6.5 for crystallization. The protein solution was within the steady-state at < 3, where both amorphous aggregation and crystallization did not occur. This was due to the low volume diffusion compared with the surface integration rate. Typically, the markedly slow diffusion made it difficult for a molecular collision. Nonetheless, at > 6.5, the volume diffusion rate increased by nearly an order of magnitude compared with the surface integration rate. As a result, the molecules aggregated rapidly to grow and surmount the ΔG before the best conformation and orientation were identified. Therefore, this process favored amorphous aggregation more than crystallization. The surface integration rate was comparable to the diffusion rate when crystallization occurred. Here, 3< < 6.5 is referred to as the “kinetic crystallization window.”
For better testing of the possibility of applying such kinetic criterion in predicting complex crystallization, we utilized the conditions acquired based on the PS/SF complex for other solutions, including PS blended with keratin. Table 1 shows the results. Clearly, the criterion was valid for both cases. The coefficient of crystallization,
, was within the range of the kinetic crystallization window in the case of crystallization occurrence. However, it was beyond the window in the presence of a still solution or amorphous aggregation.
Solution
pH
Crystallization results
Surface tension prediction
PS + SF
8
2.48
solution
solution
PS + SF
9
4.65
crystallization
crystallization
PS + SF
10
3.42
crystallization
crystallization
PS + SF
11
4.92
crystallization
crystallization
PS + SF
12
5.42
crystallization
crystallization
PS + SF
13
6.96
aggregation
aggregation
PS + Keratin
8
1.56
solution
solution
PS + Keratin
9
2.33
solution
solution
PS + Keratin
10
3.89
crystallization
crystallization
PS + Keratin
11
4.74
crystallization
crystallization
PS + Keratin
12
5.93
crystallization
crystallization
PS + Keratin
13
8.02
aggregation
aggregation
5 Conclusions
The interaction between protein molecules and colloidal particles in a mixed solution was demonstrated, and they combined as a complex. Thereafter, a novel criterion was put forward to predict colloidal crystallization in the presence of bimolecular effect by investigating the interfacial 3-D crystallization kinetics for the mixed solution containing protein and colloidal particles, as well as the 2-D self-assembly using surface-tension measurements. As suggested by our findings, complex crystallization represents the kinetic step that involves molecular volume transport as well as surface integration. Typically, the competition between these two processes decides the favorable outcome from the perspective of kinetics (namely, amorphous aggregation or crystallization). The amorphous aggregation tendency is indicated by the coefficient of crystallization, , which represents the ratio of the volume diffusion rate to surface integration rate. According to the analysis on the interfacial 2-D assembly of the mixed solution, we determined the kinetic crystallization window. Based on this conclusion, we hope to develop new laboratory facilities to control the colloidal assembly efficiently in order to realize high quality, large area, and controllable colloidal crystallization.
Acknowledgments
This work was supported by the National Natural Science Foundation of China (Grant No. 51403078) and the National Natural Science Foundation of Zhejiang Province of China (Grant No.LY20E030009). Thanks to Dr. Zhaohui Meng for his assistance with the SEM analyses and Mr. Wenhao Luo with the synthesis of the raw materials.
Declaration of Competing Interest
The authors declare that they have no known competing financial interests or personal relationships that could have appeared to influence the work reported in this paper.
References
- Adamson, A., 1997. Gast.; AP Physical chemistry of surfaces. Wiley, New York.
- Insights into phase transition kinetics from colloid science. Nature. 2002;416(6883):811-815.
- [Google Scholar]
- Assembly and phase transitions of colloidal crystals. Nat. Rev. Mater.. 2016;1(2):15011.
- [Google Scholar]
- Programing performance of silk fibroin materials by controlled nucleation. Adv. Funct. Mater.. 2016;26(48):8978-8990.
- [Google Scholar]
- Observation and tuning of hypersonic bandgaps in colloidal crystals. Nature Mater.. 2006;5(10):830-836.
- [Google Scholar]
- Chernov, A.A., 1984. Modern Crystallography: Crystal Growth, vol. 3. Springer.
- Controlled colloidal assembly: experimental modeling of general crystallization and biomimicking of structural color. Adv. Funct. Mater.. 2012;22(7):1354-1375.
- [Google Scholar]
- Proteins at liquid interfaces: I. Kinetics of adsorption and surface denaturation. J. Colloid Interface Sci.. 1979;70(3):403-414.
- [Google Scholar]
- Polymerized colloidal crystal hydrogel films as intelligent chemical sensing materials. Nature. 1997;389(6653):829-832.
- [Google Scholar]
- Programing Performance of Wool Keratin and Silk Fibroin Composite Materials by Mesoscopic Molecular Network Reconstruction. Adv. Funct. Mater.. 2016;26(48):9032-9043.
- [Google Scholar]
- Hunter, R.J., 2001. Foundations of Colloid Science. Oxford University Press.
- Self-assembly of protein at aqueous solution surface in correlation to protein crystallization. Appl. Phys. Lett.. 2005;86(2):023903
- [Google Scholar]
- From surface self-assembly to crystallization: prediction of protein crystallization conditions. J. Phys. Chem. B. 2006;110(13):6949-6955.
- [Google Scholar]
- Synthesis and optical properties of opal and inverse opal photonic crystals. Synth. Met.. 2001;116(1-3):469-473.
- [Google Scholar]
- Photonic Crystals: Integration of Colloidal Photonic Crystals toward Miniaturized Spectrometers. Adv. Mater.. 2010;22(9):946-950.
- [Google Scholar]
- Kivshar, Y.S., Agrawal, G., 2003. Optical Solitons: From Fibers to Photonic Crystals. Academic Press.
- Dynamic tuning of organic lasers with colloidal crystals. Adv. Mater.. 2006;18(3):300-303.
- [Google Scholar]
- Molecular modeling for nonideal mixing of amphiphilic molecules and applications to ionic surfactant/salt solutions. Langmuir. 2002;18(1):14-25.
- [Google Scholar]
- Liu, X., 2001. Interfacial effect of molecules on nucleation kinetics. J. Phys. Chem. B 105(47), 11550–11558.
- Lotito, Valeria, Zambelli, et al., 2018. Pattern formation in binary colloidal assemblies: hidden symmetries in a kaleidoscope of structures. Langmuir 34(26), 7827–7843.
- Approaches to self-assembly of colloidal monolayers: a guide for nanotechnologists. Adv. Colloid Interface Sci.. 2017;246:217-274.
- [Google Scholar]
- A journey through the landscapes of small particles in binary colloidal assemblies: unveiling structural transitions from isolated particles to clusters upon variation in composition. Nanomaterials. 2019;9(7):921.
- [Google Scholar]
- Pattern detection in colloidal assembly: a mosaic of analysis techniques. Adv. Colloid Interface Sci.. 2020;284:102252
- [Google Scholar]
- Magdassi, S., 1996. Surface Activity of Proteins: Chemical and Physicochemical Modifications. CRC Press.
- Effect of surfactants on sol–gel transition of silk fibroin. J. Sol-Gel Sci. Technol.. 2014;71(2):364-371.
- [Google Scholar]
- Effect of dissociation and conformational changes on the surface behavior of pea legumin. J. Colloid Interface Sci.. 1992;152(2):442-454.
- [Google Scholar]
- The application of the drop volume technique to measurements of the adsorption of proteins at interfaces. J. Colloid Interface Sci.. 1978;64(3):391-402.
- [Google Scholar]
- Valeria, Lotito, Tomaso, et al., 2016. Self-assembly of single-sized and binary colloidal particles at air/water interface by surface confinement and water discharge. Langmuir 32(37), 9582–9590.
- On-chip natural assembly of silicon photonic bandgap crystals. Nature. 2001;414(6861):289-293.
- [Google Scholar]
- Vogel, Nicolas, Goerres, Sebastian, Land fester, Katharina, Weiss, Clemens K., 2011. A convenient method to produce close‐and non-close-packed monolayers using direct assembly at the air–water interface and subsequent plasma‐induced size reduction. Macromol. Chem. Phys. 212(16), 1719–1734.
- Wafer-scale fabrication of ordered binary colloidal monolayers with adjustable stoichiometries. Adv. Funct. Mater.. 2011;21(16):3064-3073.
- [Google Scholar]
- Direct visualization of the interfacial position of colloidal particles and their assemblies. Nanoscale. 2014;6(12):6879-6885.
- [Google Scholar]
- Silk microspheres for encapsulation and controlled release. J. Control. Release. 2007;117(3):360-370.
- [Google Scholar]
- Time-dependence of boundary tensions of solutions I. The role of diffusion in time-effects. J. Chem. Phys.. 1946;14(7):453-461.
- [Google Scholar]
- Preparation of photonic crystals made of air spheres in titania. Science. 1998;281(5378):802-804.
- [Google Scholar]
- Effect of protein-protein interactions on protein aggregation kinetics. J. Chem. Phys.. 2003;119(20):10972-10976.
- [Google Scholar]
- Experimental modelling of single-particle dynamic processes in crystallization by controlled colloidal assembly. Chem. Soc. Rev.. 2014;43(7):2324-2347.
- [Google Scholar]


