

Prediction of solid-liquid-vapor phase equilibria of noble gases in nitrogen
⁎Corresponding author. s.almuhtaseb@qu.edu.qa (Shaheen A. Al-Muhtaseb)
-
Received: ,
Accepted: ,
This article was originally published by Elsevier and was migrated to Scientific Scholar after the change of Publisher.
Peer review under responsibility of King Saud University.
Abstract
The primary objective of this study is to develop an empirical correlation model that is able to predict the solid–liquid-vapour phase equilibria (SLVE) for the ternary system of N2-Kr-Xe at pressures ranging from 1 to 45 bar and temperatures ranging from 80 to 180 K. The model was based on Peng-Robinson equation of state. To optimize the interaction parameters that are needed in the model, it was first used to correlate the experimental SLVE data found in the literature for the N2-Kr, and N2-Xe and Kr-Xe binary systems. When the corresponding interaction parameters were optimized, the model was then expanded to predict the SLVE and construct the phase envelope of the ternary system of N2 -Kr-Xe.
Keywords
Multiphase equilibria
Solid phase formation
Noble gases
Solid-liquid-vapour equilibrium
Freezing prediction
Cryogenic processes

1 Introduction
The cryogenic separation technologies have recently gained much attention by the industries and scientific communities. This is due to the advantages they offer. For example, they have a lower environmental footprint (Font-Palma et al., 2021) and an absence of solvents in the process; which results in lower corrosion potential (Maqsood et al., 2014), higher energy efficiency (Théveneau et al., 2020) and the ability of the process to produce high purity products (Ghasem, 2020). Cryogenic separations depend on phase transitions to separate different components; that is by separating component(s) from the mixture by the partial liquefaction or solidification of the mixture (Berstad et al., 2013). Cryogenic distillation has been used in the air separation industry for many decades, where gaseous oxygen and nitrogen are produced in large quantities (Pacheco et al., 2014). Cryogenic distillation is also commonly used in natural gas processing for separating sour gases (CO2 and H2S) from methane (Mokhatab et al., 2019).
Krypton and xenon are noble gases that are found naturally in air (Chen et al., 2016). They can also be found as byproducts of fission nuclear reactions (Burchell, 1999), and radioactive isotopes of krypton and xenon are found in off-gas streams from nuclear power plants with light water reactors or from fuel reprocessing plants (Teller and Knapp, 1984). They were also found in the xenon dark matter project, which uses xenon in a dual-phase time projection chamber (TPC) for the direct detection of weakly interacting massive particle (WIMP). However, 85Kr (which can be naturally present with xenon) has to be separated in order to maintain the performance of their detector (Aprile et al., 2017). Therefore, it is important to develop techniques to separate these two components from their mixtures, and one of these techniques is cryogenic separation.
In the cryogenic processes mentioned-above, several components might be in the solid phase. Therefore, experimental solid–liquid-vapor equilibrium (SLVE) data are required in order to design, optimize and operate units and equipment of the cryogenic processes. However, the absence of SLVE experimental data for systems involving krypton (Kr), xenon (Xe) and nitrogen (N2) make the prediction of the behaviors of such systems under cryogenic conditions difficult. Therefore, developing accurate and suitable thermodynamic models to predict the SLVE loci of these mixtures will aid in the design and development of the cryogenic separation of these components.
Indeed, the experimental data for the SLVE of the ternary system Kr-Xe-N2 are very limited in the literature. Nonetheless, Teller and Knapp (Teller and Knapp, 1984) studied the solubility of solid Kr and Xe in liquid nitrogen. For the binary system of Kr-N2, the SLVE locus was obtained in the temperature range of (71.81–115.77 K) (Teller and Knapp, 1984), while for the Xe-N2 binary system, it was tested at two temperature ranges (from 91.04 to 127.29 K and from 153.6 to 161.36 K) (Teller and Knapp, 1984). Moreover, they obtained the SLVE locus and the phase compositions for the ternary system Kr-Xe-N2 at a pressure of 6 bar and over a limited temperature range (from 98.48 to 104.9 K) (Teller and Knapp, 1984). Experimental solid–liquid equilibrium (SLE) data could be found for the binary systems of Kr-Xe (Heastie, 1961) and Kr-N2 (Mastera, 1977). Additionally experimental SLVE data for the binary system of Kr-Xe could be found in (Mastera, 1977).
On the other hand, modeling efforts were done to compensate for the shortage of experimental SLVE data of systems involving such noble gases. Campestrini et al. (Campestrini et al., 2014) predicted the SLVE data of the mixtures Ar–Kr, Ar–CH4, CH4–Kr, N2–O2, N2–Ar, and Ar–Xe using the Lennard-Jones solid–liquid-vapor equation of state (LJ-SLV-EoS). However, this study has not covered the binary system combinations of interest in this work (i.e., the binary systems of Kr-N2, Xe-N2 and Kr-Xe), nor the ternary system of Kr-Xe-N2. Ababneh and Al-Muhtaseb (Ababneh and Al-Muhtaseb, 2021) have previously developed an empirical model to predict the SLVE locus of the CO2-H2S-CH4 ternary system by utilizing interaction parameters that are optimized to correlate the SLVE of the constituent binary systems (i.e., CO2– CH4, CO2-H2S and H2S-CH4). Their model proved to be successful in predicting the solidification of this ternary system when compared to the experimental data.
This study is an attempt to utilize a similar approach to that of Ababneh and Al-Muhtaseb (Ababneh and Al-Muhtaseb, 2021) to model the SLVE of the ternary system Kr-Xe-N2. The main aim of this work is to develop a thermodynamic model that can describe the solid–liquid-vapor (SLV) phase equilibria for the ternary system of Kr-Xe-N2 over specific ranges of pressures and temperatures (1–45 bar and 80–180 K, respectively). The results of the thermodynamic mathematical model developed in this work will be tested in comparison to the experimental data available in the literature. Additionally, a three–phase SLV separation unit is studied based on this model as described in our previous work (Ababneh and Al-Muhtaseb, 2021). The modeling of this separation unit was used to determine the phase envelope of the ternary system (Kr-Xe-N2) at a sample overall composition. Developing this model successfully will provide the researchers and the industry with a useful tool to predict the SLV phase equilibrium behavior for the ternary system Kr-Xe-N2 and evaluate the performances of the corresponding three-phase SLV separation equipment without the need to conduct expensive and time-costly experimental measurements.
2 Methodology
2.1 Empirical correlation model
At the phase equilibrium condition of a multicomponent system, the chemical potential of each component in each coexisting phases (including solid (S), vapour (V) and liquid (L) phases) at the same temperature (T) and pressure (P) becomes equal, i.e.,
In order to use Eqs. (2)–(4) for SLVE calculations, an appropriate equation of state (EoS) is selected alongside an equilibrium equation, which estimates the saturation/sublimation pressure of the solid forming component at the given temperature. It is to be noted that solid phase of any of the components discussed in this article is considered incompressible. In this work, the Peng-Robinson equation of state (PR EoS) (Peng and Robinson, 1929) is used to estimate the fugacity coefficients of the component i in the vapor and liquid phases (i.e.,
2.2 Modelling the binary system of Krypton-Nitrogen (Kr-N2)
Correlating the SLVE phase equilibrium of the Kr-N2 system depends on estimating the fugacities of these two components in each phase. To do so, we employ the PR EoS along with the following fugacity equations.
| Temperature range (K) | −a (K) | b |
|---|---|---|
| 115.0–107.0 | 1332.30 | 17.8184 |
| 107.0–98.4 | 1334.63 | 17.8413 |
| 98.4–90.2 | 1346.76 | 17.9656 |
| 90.2–73.8 | 1330.73 | 17.7765 |
| 73.8–54.7 | 1399.08 | 18.5731 |
The fugacities of N2 can be obtained from:
At the SLVE pressure–temperature (PT) locus, where the solid phase is assumed to consist of pure Kr, the phase equilibrium equations for Kr are given by Eqs. (11) and (12).
2.3 Modelling the binary system of Xenon-Nitrogen (Xe-N2)
The triple point temperatures of xenon (161.1 K) is higher than the critical temperature of nitrogen (126.1 K). Thus, unlike the Kr-N2 system, the SLVE locus line of the Xe-N2 system is discontinued when it reaches near the critical point of nitrogen. Teller and Knapp (Teller and Knapp, 1984) studied the composition of the liquid phase in equilibrium with the solid and the vapor phases as a function of temperature for two temperature ranges (namely, from 91.04 to 127.29 K and from 153.6 to 161.4 K). However, although they did not study the composition of the solid phase, it could be expected that nitrogen does not dissolve much, if any, in solid xenon; and that a eutectic point exists close to the triple point of nitrogen. As a result, the solid phase can be assumed to consist of pure Xe. In the modeling of this system, the overall temperature range will be divided into two sub-ranges in accordance to the available experimental data (Teller and Knapp, 1984) to be used for optimizing the corresponding interaction parameter.
The SLVE pressure–temperature (PT) locus curve of the Xe-N2 system depends on estimating the fugacities of these two components in each phase. To do so, we employ the PR EoS to estimate their fugacity coefficients in the vapour and liquid phases, along with the fugacity equations (Eqs. (14)–(16)) as shown below.
| Temperature range (K) | -c (K) | d |
|---|---|---|
| 162.0–150.2 | 1856.41 | 17.9236 |
| 150.2–139.0 | 1857.02 | 17.9276 |
| 139.0–127.0 | 1860.70 | 17.9513 |
| 127.0–104.0 | 1836.37 | 17.7526 |
| 104.0–76.2 | 1960.37 | 18.9607 |
The fugacities of N2 can be obtained from Eqs. (9) and (10).
At the SLVE locus, where the solid phase is assumed to consist of pure Xe. Hence, the phase equilibrium equations for Xe are given by Eqs. (18) and (19).
2.4 Modelling the binary system of Krypton-Xenon (Kr-Xe)
In the modelling of the binary system of Kr-Xe, the SLVE temperature range would start from a point slightly beyond the triple point of Kr. In the specified temperature range, only Xe will solidify. Therefore, the solid phase will consist of only Xe. Mastera (Mastera, 1977) has measured the SLVE locus for the Kr-Xe binary system accordingly.
On the other hand, the empirical model developed in this work can be used to predict the SLVE behaviour of this system. The fugacities of Kr in different phases can be calculated via Eqs. (5)–(6), whereas those of Xe can be calculated by Eqs. (14)–(16). Furthermore, at the SLVE locus for this binary system, the phase equilibrium conditions for Kr and Xe can be described by Eq. (11) and Eqs. (18)–(19), respectively. As explained previously, it is assumed that the solid phase consists of pure Xe within the specified range of temperature.
2.5 Modelling the ternary system of Krypton-Xenon-Nitrogen (Kr-Xe-N2)
In the modelling of this ternary system, it was assumed that only Kr and Xe can solidify since the tested temperature is well above the triple point of N2. However, it was assumed that the solid phase for each component is pure consisting only of this component. Therefore, when both Kr and Xe solidify, they are assumed to form two distinct solid phases. The solid Kr phase will be denoted as S2 while the solid Xe phase will be denoted as S3. Therefore, the fugacities of Kr can be obtained from Eqs. (5) through (7), those of Xe can be obtained from Eqs. (14) through (16), and those of N2 can be obtained from Eqs. (9) and (10). At the SLVE locus for this ternary system, Eqs. (11) and (12) describe the phase equilibrium conditions for Kr, Eqs. (18) and (19) describe the phase equilibrium conditions for Xe, and Eq. (13) describes the phase equilibrium condition for N2.
3 Results and discussion
3.1 Correlating the binary system of Krypton-Nitrogen (Kr-N2)
The interaction parameter (kij) for the binary system Kr-N2 was optimized to the equilibrium equations described in Section 2.2 as described elsewhere (Ababneh and Al-Muhtaseb, 2021). Fig. 1 shows a comparison between the model estimations and experimental data available in the literature (Teller and Knapp, 1984) at different kij values in terms of the SLVE PT locus (Fig. 1a) and the mole fraction of Kr in the liquid phase (Fig. 1b) as a function of temperature. Table 3 shows the effect of tested kij values on the deviations between the model predictions and the experimental data in terms of pressure and Kr composition.The optimization of the interaction parameter was based on minimizing error as defined in Eq. (20); and the deviations between model predictions and experimental data were indicated through the mean average deviation (MAD) and mean relative deviation (MRD) as defined by Eqs. (21) and (22), respectively.
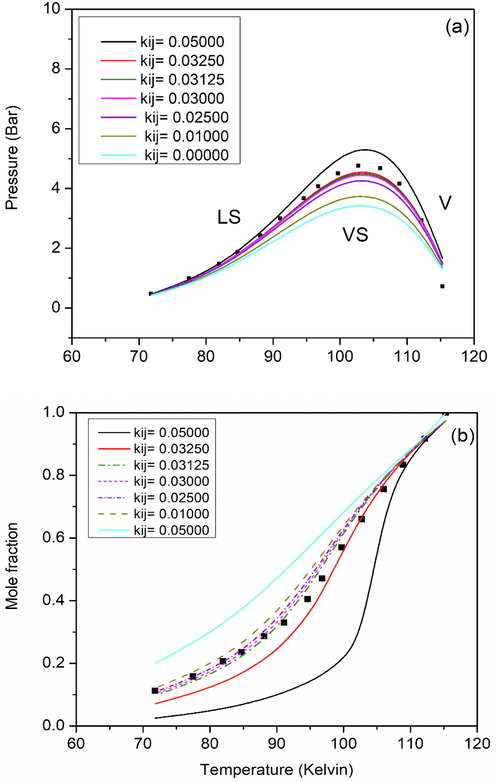
- Comparison of model predictions (lines) with different kij values to experimental data (symbols) for the binary system Kr-N2 (Teller and Knapp, 1984). Subfigures show the effect of temperature on SLVE (a) pressure and (b) composition of Kr in liquid phase.
| kij | Error in Pressure | MAD in Pressure (Bar) | MRD in Pressure % | Error in xKr | MAD in xKr | MRD in xKr % |
|
|---|---|---|---|---|---|---|---|
| 0.05000 | 1.767 | 0.339 | 16.73 | 0.587 | 0.037 | 14.662 | 2.354 |
| 0.03250 | 1.190 | 0.153 | 11.454 | 0.140 | 0.031 | 7.705 | 1.330 |
| 0.03125 | 1.167 | 0.172 | 11.879 | 0.148 | 0.033 | 7.941 | 1.315 |
| 0.03000 | 1.147 | 0.191 | 12.306 | 0.162 | 0.036 | 8.695 | 1.309 (min) |
| 0.02500 | 1.089 | 0.277 | 14.454 | 0.281 | 0.047 | 12.257 | 1.370 |
| 0.01000 | 1.107 | 0.539 | 21.323 | 1.290 | 0.081 | 25.070 | 2.396 |
| 0.00000 | 1.256 | 0.704 | 25.837 | 2.517 | 0.103 | 34.344 | 3.773 |
Overall, it could be concluded that the PR EoS produces best results (with minimum
3.2 Correlating the binary system of Xenon-Nitrogen (Xe-N2)
The interaction parameter (kij) for the binary system Xe-N2 was optimized as described in Section 2.3. Fig. 2 shows a comparison between the model predictions and the experimental SLVE PT locus data (Fig. 2a and 2b) and mole fraction of Xe in the liquid phase (Fig. 2c and 2d) available in the literature as a function of temperature for both temperature sub-ranges of the available experimental data (Teller and Knapp, 1984). Table 4 shows the error, MAD and MRD values between model predictions and the experimental data in terms of pressure and Xe composition at the tested kij values. From Table 4 and Fig. 2, and based on the least sum of error values (minimum
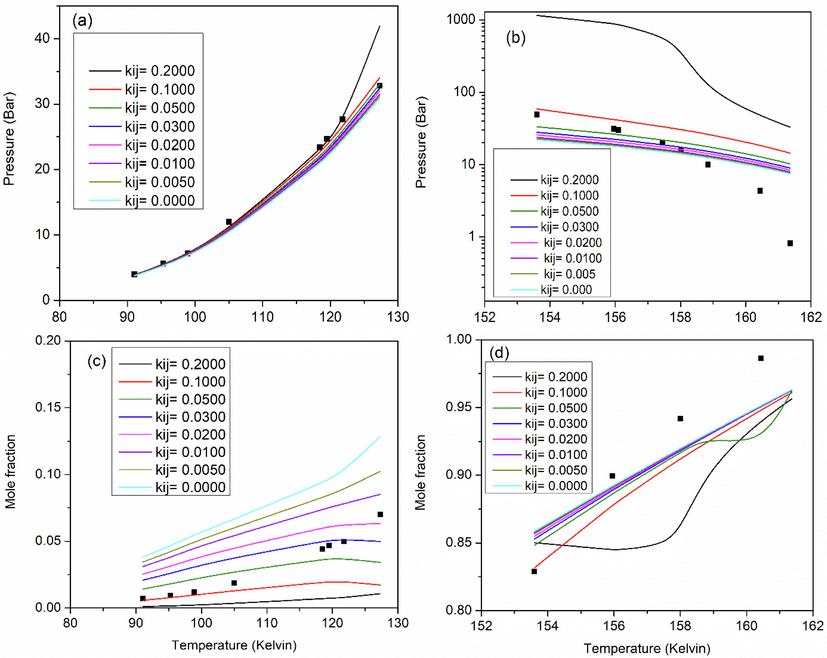
- Comparison of model predictions (lines) and experimental data (symbols) of the binary system Xe-N2 (Teller and Knapp, 1984) for the effect of temperature on SLVE (a,b) pressure and (c,d) composition of Xe in liquid phase. The effect of temperature is considered in the ranges of 91.04–127.29 K (a and c) and 153.6–161.36 K (b and d).
| kij | Error in Pressure | MAD in Pressure (Bar) | MRD in Pressure % | Error in xKr | MAD in xKr | MRD in xKr % |
|
|---|---|---|---|---|---|---|---|
| Temperature range 1 (91.04–127.29 K) | |||||||
| 0.000 | 0.080 | 1.705 | 9.412 | 58.668 | 0.046 | 232.431 | 58.748 |
| 0.005 | 0.071 | 1.569 | 8.775 | 44.018 | 0.036 | 195.363 | 44.088 |
| 0.010 | 0.063 | 1.450 | 8.214 | 33.152 | 0.028 | 164.453 | 33.215 |
| 0.020 | 0.052 | 1.252 | 7.264 | 18.782 | 0.018 | 117.842 | 18.834 |
| 0.030 | 0.043 | 1.090 | 6.485 | 10.502 | 0.012 | 85.310 | 10.545 |
| 0.050 | 0.032 | 0.893 | 5.439 | 3.149 | 0.0126 | 54.563 | 3.181 |
| 0.100 | 0.021 | 0.746 | 4.337 | 1.789 | 0.0183 | 42.093 | 1.809 (min) |
| 0.200 | 0.089 | 1.490 | 6.113 | 5.615 | 0.027 | 83.770 | 5.705 |
| Temperature range 2 (153.6–161.36 K) | |||||||
| 0.000 | 68.074 | 11.121 | 140.827 | 0.003 | 0.023 | 2.547 | 68.077 (min) |
| 0.005 | 72.913 | 8.916 | 144.313 | 0.003 | 0.021 | 2.545 | 72.916 |
| 0.010 | 78.133 | 8.615 | 147.924 | 0.003 | 0.023 | 2.544 | 78.136 |
| 0.020 | 89.843 | 8.078 | 156.275 | 0.003 | 0.023 | 2.540 | 89.846 |
| 0.030 | 103.495 | 7.659 | 166.400 | 0.0029 | 0.0234 | 2.5358 | 103.498 |
| 0.050 | 138.080 | 7.114 | 191.459 | 0.006 | 0.031 | 3.253 | 138.085 |
| 0.100 | 294.079 | 12.975 | 302.090 | 0.003 | 0.023 | 2.431 | 294.082 |
| 0.200 | 5172.607 | 489.364 | 2363.424 | 0.014 | 0.051 | 5.482 | 5172.621 |
3.3 Correlating the binary system of Krypton-Xenon (Kr-Xe)
As described in Section 2.4, the SLV locus for this binary system was estimated, and the model predictions were compared to the experimental data reported by Mastera (Mastera, 1977). The results are show in Table 5. By manipulating the interaction parameter in the PR EoS, it was found that the optimum kij value for this system is 0.0400 as noted in Table 5. Fig. 3a shows a comparison between the model estimations and experimental data available in the literature (Mastera, 1977) for the SLVE pressure–temperature locus, while Fig. 3b illustrates the mole fraction of Kr in the liquid phase as a function of temperature. It can be noted from Fig. 3a that the experimental SLVE locus of this binary system reaches a maximum value at pressure of 1.6 bar. The model predictions were compared to the experimental data as seen from Fig. 3a, where the model calculations provided a good description of the laboratory data when the interaction parameter value in the EoS was 0.0400, confirming the suitability of our model for representing such systems. Fig. 3b shows that increasing the temperature would decrease the mole fraction of Kr (i.e., increase the mole fraction of Xe) in the liquid phase. This could be attributed to the fact that raising the temperature would decrease the amount of the solid phase that is formed; and since the solid phase consists of pure Xe; larger amounts of Xe will be present in the liquid phase at higher temperatures. Similar to the PT diagram, the model predictions at kij = 0.0400 described well the composition of the liquid phase as seen in Fig. 3b, however, increasing kij would cause the results to deviate significantly (such as in the case of kij = 0.1000).
| kij | Error in Pressure | MAD in Pressure (Bar) | MRD in Pressure % | Error in xKr | MAD in xKr | MRD in xKr % |
|
|---|---|---|---|---|---|---|---|
| 0.0000 | 0.275 | 0.282 | 19.530 | 0.216 | 0.059 | 20.557 | 0.492 |
| 0.0200 | 0.110 | 0.183 | 13.125 | 0.159 | 0.047 | 17.522 | 0.268 |
| 0.0250 | 0.088 | 0.169 | 12.329 | 0.145 | 0.043 | 16.654 | 0.232 |
| 0.0300 | 0.076 | 0.155 | 11.518 | 0.131 | 0.039 | 15.733 | 0.207 |
| 0.0400 | 0.087 | 0.140 | 10.712 | 0.107 | 0.031 | 13.702 | 0.194 (min) |
| 0.0425 | 0.099 | 0.151 | 11.353 | 0.101 | 0.028 | 13.150 | 0.200 |
| 0.0450 | 0.114 | 0.173 | 12.585 | 0.096 | 0.026 | 12.577 | 0.210 |
| 0.0500 | 0.156 | 0.219 | 15.155 | 0.088 | 0.021 | 11.366 | 0.244 |
| 0.1000 | 1.921 | 0.897 | 58.397 | 0.250 | 0.072 | 18.776 | 2.171 |

- Comparison of model predictions with different kij values (lines) to experimental data (symbols) for the binary system Kr-Xe (Mastera, 1977). Subfigures show the effect of temperature on the SLVE (a) pressure and (b) composition of Kr in liquid phase.
3.4 Correlating the ternary system Krypton-Xenon-Nitrogen (Kr-Xe-N2)
Table 6 shows the experimental SLVE data obtained by Teller and Knapp (Teller and Knapp, 1984) for the Ternary system Kr-Xe-N2. These data indicate the composition of the liquid phase in equilibrium with the solid and vapor phases in a Xe-Kr-N2 mixture as a function of temperature for the temperature range of 98.48–105.05 K (Teller and Knapp, 1984). It was noticed that there are apparent errors in these published data, where in several rows, the summations of mole fractions do not add up to unity! In some rows, it seems that the decimal point for
| Pressure (Bar) | Temperature (K) |
|
|
|
Corrected
|
|---|---|---|---|---|---|
| 6 | 104.9 | 0.4519 | 0.4284 | 0.1192 | 0.1197 |
| 5.99 | 104.61 | 0.4743 | 0.414 | 0.1117 | 0.1117 |
| 5.97 | 104.58 | 0.4731 | 0.4132 | 0.1137 | 0.1137 |
| 6.02 | 105.05 | 0.4438 | 0.4334 | 0.1128 | 0.1228 |
| 6.02 | 105.05 | 0.4592 | 0.4216 | 0.1192 | 0.1192 |
| 6.01 | 102.96 | 0.6446 | 0.2944 | 0.61 | 0.0610 |
| 6.01 | 102.96 | 0.6479 | 0.2922 | 0.599 | 0.0599 |
| 6 | 102.7 | 0.645 | 0.2945 | 0.605 | 0.0605 |
| 6.01 | 100.6 | 0.6619 | 0.2854 | 0.527 | 0.0527 |
| 6.01 | 100.6 | 0.6651 | 0.2828 | 0.52 | 0.0521 |
| 6 | 100.13 | 0.7186 | 0.2385 | 0.429 | 0.0429 |
| 5.99 | 98.55 | 0.8735 | 0.1033 | 0.0232 | 0.0232 |
| 5.99 | 98.6 | 0.8682 | 0.1071 | 0.0247 | 0.0247 |
| 5.99 | 98.6 | 0.8742 | 0.1027 | 0.0231 | 0.0231 |
| 6 | 98.48 | 0.8772 | 0.0994 | 0.0234 | 0.0234 |
To correlate this ternary system as described in Section 2.5, interaction parameters for the constituting binary systems (Kr-N2, Xe- N2 and Kr-Xe) are needed. The interaction parameter chosen for the Kr-N2 binary system is 0.0300, which is the optimum value found in Section 3.1. Furthermore, since the range of the tested temperature is within the first temperature range for the Xe-N2 binary system described in Section 3.2, the optimum interaction parameter was set to the value of 0.100. Also, the optimum interaction parameter for the Kr-Xe binary system chosen to be 0.040 as found in Section 3.3.
As seen in Table 6, few experimental points for the ternary system were collected at the same temperature and pressure, with almost equal values of the corresponding compositions. For these points, the average value of the composition was considered and compared with the model predictions. Fig. 4 compares the results of the model predictions of liquid phase compositions to the experimental data presented in Table 6 at the optimum values of the interaction parameters.
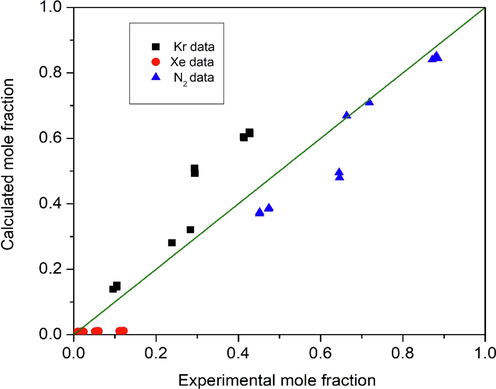
- Comparing predicted liquid phase compositions to experimental data for the ternary system Kr-Xe-N2 at the optimum interaction parameters (Teller and Knapp, 1984).
In the absence of extensive and reliable experimental SLVE data for the ternary system Kr-Xe-N2, its phase envelopes are not clear. So, in this section, we attempt to determine the phase envelope for this system on the basis of a single equilibrium separation stage unit as described elsewhere (Ababneh and Al-Muhtaseb, 2021). A feed mixture (consisting of 50 mol% N2; 30 mol% Kr and 20 mol% Xe) was tested as an example. Fig. 5 shows the pressure–temperature SLVE phase envelopes for tested feed mixture, where the solid phases are assumed to consist of either pure Kr (denoted as S2), pure Xe (denoted as S3) or a mixture of Kr and Xe (denoted as S2S3). It could be noticed that there is a gap in the ternary system SLVE phase envelope. This gap extends from the point (T = 119.96 K, P = 19.12 Bar) to the point (T = 177.5 K, P = 45 Bar), where these points are close to the critical points of N2 and Xe, respectively; which is similar to the case seen previously in the Xe-N2 binary system. Moreover, it is clear from Fig. 5 that the envelope of VS2S3 phases is relatively small, with a maximum point standing at about 2 bar. Therefore, it seems that the presence of Xe in the system has a significant impact on the solidification behavior of Kr. Although the model has proved to be able to predict the phase envelopes, there is no possible way to confirm its results due to the lack of literature data. Thus, it is recommend that more experimental data or model predictions should be conducted for this system to be compared to the results of this model.
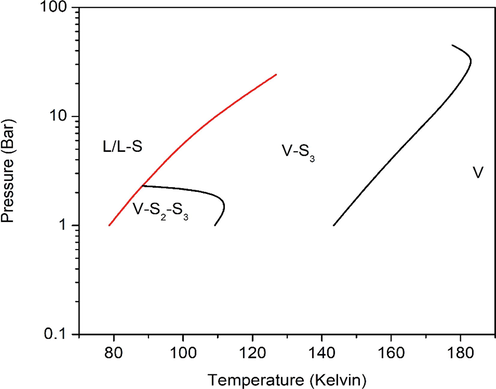
- SLVE phase envelopes of the ternary system Kr-Xe-N2 for the tested feed mixture.
4 Conclusions
With the advantages that the cryogenic separation technologies offer, it makes sense to expand their capabilities into new and different applications. Among the new applications is the separation of noble gases (such as krypton and xenon) from nitrogen, where noble gases could be mixed with nitrogen as byproduct of nuclear fission reactions. Experimental or predicted solid–liquid-vapor equilibria (SLVE) data for mixtures consisting of these components are very limited in the literature, which stresses on the need of developing models for their prediction.
For the first time, an empirical correlation model was developed in this study to predict the SLVE for the ternary system of nitrogen-krypton-xenon (N2-Kr-Xe) over wide ranges of pressure (1–45 bars) and temperature (80 to 180 K); and a phase envelope for this system was determined.
To test the model accuracy and performance, it is first used to predict the SLVE locus of the binary systems Kr-N2 and Xe-N2 and Kr-Xe. The results were compared to the experimental data available in the literature, and the model proved successful in predicting the SLVE locus when the corresponding interaction parameters were optimized. Afterwards, the model was used for describing the SLVE behavior of the ternary system N2-Kr-Xe with optimized interaction parameters. The predicted SLVE locus results of this ternary system were compared to a limited set of experimental data that is available in the literature.
Furthermore, an equilibrium stage separation unit model was utilized to construct the phase envelope of this ternary system at a sample overall composition. However, in the absence of reliable data, the there was no method to confirm the accuracy of the constructed phase envelope.
5 Availability of data and material
All data generated or analyzed during this study are included in this article.
Acknowledgements
Open Access funding provided by the Qatar National Library.
Funding
Not applicable.
Statement of novelty
Although the scientific literature has extensively covered the thermodynamics of air components and air separation; there are little studies that cover the solid-fluid phase equilibria of nitrogen-noble gas mixture systems for their separation, despite their importance and presence in several industries. In this study, and for the first time, we attempt to model the solid-liquid-vapor equilibria (SLVE) of the ternary system Kr-Xe-N2 and its binary constituent systems (Kr-Xe, Xe-N2, and Kr-N2) using an empirical-correlation based model. Additionally, a three–phase solid-liquid-vapor (SLV) separation unit is developed to study and describe the SLVE phase envelope of the ternary system Kr-Xe-N2. Developing this model successfully will provide a useful tool to predict the SLV phase equilibrium behavior for the ternary system Kr-Xe-N2 and evaluate the performances of the corresponding three-phase SLV separation equipment without the need to conduct expensive and time-costly experiments. Furthermore, the model could be further developed and extended to different systems and gases mixtures.
Declaration of Competing Interest
The authors declare that they have no known competing financial interests or personal relationships that could have appeared to influence the work reported in this paper.
References
- An empirical correlation-based model to predict solid-fluid phase equilibria and phase separation of the ternary system CH4-CO2-H2S. J. Nat. Gas Sci. Eng.. 2021;94
- [CrossRef] [Google Scholar]
- Removing krypton from xenon by cryogenic distillation to the ppq level. Eur. Phys. J. C. 2017;77(5)
- [CrossRef] [Google Scholar]
- Low-temperature CO2 capture technologies - Applications and potential. Int. J. Refrig.. 2013;36(5):1403-1416.
- [CrossRef] [Google Scholar]
- Burchell, T.D. 1999. CHAPTER 13 - Fission Reactor Applications of Carbon. In: T. D. B. T.-C. M. for A. T. Burchell, (Ed.), Elsevier Science Ltd, Oxford, pp. 429–484. https://doi.org/10.1016/B978-008042683-9/50015-7.
- Solid-liquid equilibrium prediction for binary mixtures of Ar, O2, N2, Kr, Xe, and CH4 using the LJ-SLV-EoS. Fluid Phase Equilib.. 2014;379:139-147.
- [CrossRef] [Google Scholar]
- Determination of Atmospheric Krypton and Xenon by Gas Chromatography-Mass Spectrometry in Direct Injection Mode. Chinese J. Anal. Chem.. 2016;44(3):468-473.
- [CrossRef] [Google Scholar]
- Font-Palma, C., Cann, D., Udemu, C. 2021. Review of Cryogenic Carbon Capture Innovations and Their Potential Applications. C , vol. 7, no. 3. 2021. https://doi.org/10.3390/c7030058.
- Ghasem, N. 2020. Chapter 21 - CO2 removal from natural gas. In: Rahimpour, M.R., Farsi, M., M. A. B. T.-A. in Makarem, C.C., (Eds.), Woodhead Publishing, 2020, pp. 479–501. https://doi.org/10.1016/B978-0-12-819657-1.00021-9.
- Condensed solutions of the rare gases. Pure Appl. Chem.. 1961;2(1–2):325-328.
- [CrossRef] [Google Scholar]
- Sublimation Pressures of Solid Ar, Kr, and Xe. Phys. Rev. B. Oct. 1970;2(8):3323-3330.
- [CrossRef] [Google Scholar]
- Cryogenic carbon dioxide separation from natural gas: A review based on conventional and novel emerging technologies. Rev. Chem. Eng.. 2014;30(5):453-477.
- [CrossRef] [Google Scholar]
- Mastera. 1977. Vapour-Liquid Equilibrium Data from gasmixtures of Ar-N2 ; Kr-Ar, Kr-N2 and Xe-Kr and the Liquidus-lines of solid Xenon and of solid Krypton in Liquid air-component-mixtures. Berichte der Kernforschungsanlage Jülich.
- Mokhatab, S., Poe, W.A., Mak, J.Y. 2019. Chapter 7 - Natural Gas Treating. In: Mokhatab, S., Poe, W.A., J. Y. B. T.-H. of N. G. T. and P. Fourth E. Mak, Eds. Gulf Professional Publishing, 2019, pp. 231–269. https://doi.org/10.1016/B978-0-12-815817-3.00007-1.
- Equation-of-State Modeling of Solid-Liquid-Gas Equilibrium of CO2 Binary Mixtures. Ind. Eng. Chem. Res.. 2016;55(21):6213-6226.
- [CrossRef] [Google Scholar]
- Pacheco, K.A., Li, Y., Wang, M. 2014. Study of Integration of Cryogenic Air Energy Storage and Coal Oxy-fuel Combustion through Modelling and Simulation. In: Klemeš, J.J., Varbanov, P.S., P. Y. B. T.-C. A. C. E. Liew, (Eds.), 24 European Symposium on Computer Aided Process Engineering, vol. 33, Elsevier, 2014, pp. 1537–1542. https://doi.org/10.1016/B978-0-444-63455-9.50091-X.
- Measurements of solubilities of solid krypton and xenon in liquid nitrogen. Cryogenics (Guildf). 1984;24(9):471-476.
- [CrossRef] [Google Scholar]
- Measurement and modelling of solid apparition temperature for the CO2 – H2S – CH4 ternary system. Fluid Phase Equilib.. 2020;509
- [CrossRef] [Google Scholar]
- Vera, J.H. 1999. Book Review: Molecular thermodynamics of fluid-phase equilibria by John M. Prausnitz, Rüdiger N. Lichtenthaler and Edmundo Comes de Azevedo, third edition, Can. J. Chem. Eng., vol. 78, no. 2, pp. 429–430, Apr. 2000, https://doi.org/10.1002/cjce.5450780222.
Appendix A
Supplementary material
Supplementary data to this article can be found online at https://doi.org/10.1016/j.arabjc.2022.103866.
Appendix A
Supplementary material
The following are the Supplementary data to this article:


