

Translate this page into:
Preparation of magnetic composite adsorbents from laterite nickel ore for organic amine removal
⁎Corresponding author. liuy@smm.neu.edu.cn (Yan Liu)
-
Received: ,
Accepted: ,
This article was originally published by Elsevier and was migrated to Scientific Scholar after the change of Publisher.
Abstract
Magnetic composite adsorbent (MCA) was prepared successfully using laterite nickel ore. The effectiveness of MCA as an adsorbent was evaluated for removal trimethylamine from aqueous environment. In this technological route, the utilization of solid wastes, wastewater treatment and adsorbent recovery were considered comprehensively. The MCA was characterized by techniques, including XRD, SEM, TEM, EDS, VSM and adsorption-desorption of nitrogen at 77 K. The adsorption processes were best described by pseudo-second-order kinetic model and controlled by intraparticle and surface diffusion processes. Langmuir and Freundlich isotherm models were used to match the adsorption equilibrium data. Freundlich isotherm was the best fitting curve for the sorption equilibrium data. The adsorption mechanism was further interpreted by Gibbs free energy, entropy and enthalpy calculated by thermodynamic equation. The negative values of Gibbs free energy changes (ΔG) manifest that the adsorbing process is spontaneous. The results show that laterite nickel ore can be made into MCA for organic amine removal from polluted water.
Keywords
Laterite nickel ore
Adsorption
Organic amine
Industrial waste

1 Introduction
With the development of society, we have to face the double pressures from increasingly severe discharge of wastewater and industrial waste. It will be a solution to the problem if we can utilize solid wastes to treat wastewater (Pandey et al., 2020).
Nickel is an essential metal for modern industry and modern life. With the depletion of sulfides and the increase of demand for nickel, laterite nickel ores, which is a low grade oxidized nickel mineral, has become an inevitable choice for nickel production (Butt and Cluzel, 2013). By calculation, taking pyrometallurgy of nickel as an example, 110 tons of waste slag will be obtained for each ton of nickel produced from laterite nickel ore (calculated by the ore grade of 1.2% Ni). Stockpiling the large amount of metallurgical waste leads to many environmental problems, such as occupying land, polluting water source and generating dust. The treatment of metallurgical waste has become a worldwide problem (Zhu et al., 2020).
Over the last decade, meanwhile, the levels of contaminants are increasing in natural water bodies. The water pollution can't be ignored because the toxic contaminants are very serious risk to health.
Amines are a common class of organic compounds and functional groups that usually contain a basic N atom and a lone pair of electrons. In medical and commercial applications, including aliphatic and aromatic amines, generated from both biogenic amines and synthesized amines by diverse industrial, hundreds of important amine compounds are used. Organic amines are considered as the more dangerous class of water pollutants not only because of their toxic and carcinogenic nature, but their volatility that make them become hazardous air pollutants. (He et al., 2016; Poste et al., 2014; Wang et al., 2016) EU standards prohibit amines in concentrations over 30 ppm (Toor et al., 2019). Thus, the amines in nature water system have to be removed, even at extreme low level.
Numerous physico-chemical methods including air stripping (He et al., 2016), oxidation (He et al., 2014; Malakootian et al., 2020), Fenton oxidation (Karthikeyan et al., 2012; Zou et al., 2019), chemical precipitation (Zhang et al., 2010), ion exchange (Meng et al., 2010), distillation (Chang et al., 2010), photocatalytic degradation ((Sahoo and Patra, 2020; Wang et al., 2019), electrochemical technique (Su et al., 2014), biodegradation (Na-Phatthalung et al., 2019) and adsorption (Yang et al., 2011) are feasible for removing organic amines from water. However, some techniques are unfavorable to be used in large scale due to complex equipment, high operating cost or large amount of toxic by-product as sludge (Toor et al., 2019). To date, adsorption is the most widely method for contaminants removal because of simple, highly efficient, and easy to operate (Yu et al., 2014). Various adsorbents have been exploited. For the conventional adsorbents, such as activated carbon (Karthikeyan et al., 2012), carbon nanotubes (Yu et al., 2014), oxides (Yang et al., 2011), Zeolites (Guo et al., 2017), microporous polymers (Wang et al., 2016), a hard-solving problem is how to separate the used adsorbent from the treated water, especially from large volume water system. Sedimentation, filtration or centrifugation that usually be used in solid-liquid processes are unrealistic to be applied at large scale due to long time duration and technical limitations. It could lead to the secondary pollution if the used adsorbents were left in the treated water. To solve the separation problem, magnetic separation can be easily applied to separate magnetic adsorbents by applying an external magnetic field (Chen et al., 2019).
Trimethylamine (TMA) is small and volatile aliphatic organic amine. As pollutant, it is better to be removed before volatilizing to the air.
In this study, MCA which silica incorporates on magnetic particles is to design and prepare using laterite nickel ore as raw materials for amine removal. Si, a main element in the laterite ore residue, was prepared into amorphous silica to achieve adsorbing to pollutants. The Ni and Fe in the ore were prepared into magnetic particles to help the recycle of the MCA under an external magnetic field. The advantages of the MCA are that reducing the metallurgical solid waste by preparing products using the main components in the waste, achieving the goal of treating waste by waste and easily recycling the used adsorbents preventing second pollution. The composites adsorbent was characterized, followed by a series of batch adsorption studies to comprehensively examine the adsorption behaviors of the adsorbent as a function of contact time, initial trimethylamine concentration and temperature. The adsorption properties were also analyzed by evaluating adsorption kinetics, diffusions, isotherms, and thermodynamic parameters.
2 Materials and methods
2.1 Materials
The nickel laterite ore was collected from Indonesia. The chemical compositions of raw ore are presented in Table 1.
SiO2
TFe
MgO
Al2O3
Ni
Raw ore
29.42
19.74
14.71
5.32
1.56
All the other reagents, including trimethylamine, hydrochloric acid, sodium silicate, ferrous sulfate, sodium sulfite, sodium hydrate, ethylene glycol, sodium citrate and ethanol, were of A.R. grade. They are used as received. Deionized water was used in all experiments.
2.2 Preparation
The scheme of preparation of MCA using laterite nickel ore is shown in Fig. 1. The synthesis process is divided into four parts.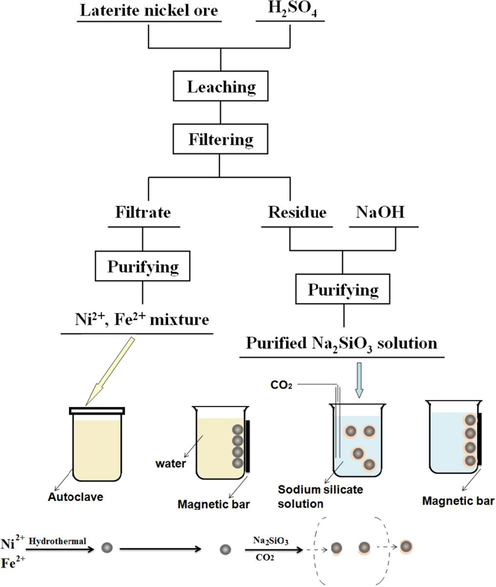
The scheme of preparation of MCA from laterite nickel ore.
i. Treatment of Laterite nickel ore. 20 g laterite nickel ore was mixed with 100 mL of 5 M sulfuric acid in a 3-necks flask. The leachate and leaching residue was obtained.
ii. Preparation of magnetic particles. The sodium sulfite solution was added into the above leachate for reduction of ferric ions to ferrous ions. Al was precipitated and removed by adjusting pH up to 4 using sodium hydroxide solution, followed by co-precipitating nickel ions and ferrous ions at pH of 7.
The co-precipitation was dissolved in the dilute hydrochloric acid. After adjusting the total volume of the solution with deionized water to 373.4 mL, 80 mL of 1 M NaOH, N2H4·H2O (28.6 mL) and (HOCH2)2 (4 mL) were added into it in sequence with magnetic stirring for 2 h under N2. The mixed solution was transferred to an autoclave. The sealed autoclave was heated in a preheating furnace at 393 K for 2 h. The product was separated by magnetic separation at room temperature, and then washed several times with deionized water.
iii. Preparation of sodium silicate solution. In a typical procedure, nickel residue and sodium hydroxide were mixed thoroughly and roasted in muffle furnace. Sodium silicate solution was obtained by dissolving the roasted products.
The sodium silicate solution was purified by carbonation decomposition using CO2 at the pH of 11. The purified solution was obtained by filtration.
iv. Synthesis of MCA. The magnetic particles as-synthesized was dispersed into the purified sodium silicate solution. After heating the suspension to 353 K in a water bath, CO2 was purged into it until the pH of 9. After washing with deionized water and ethanol alternately, the product was separated by magnetic field and dried at 393 K.
2.3 Characterization
SSX-550 made by Japan was used for SEM testing,and the element contents were measured through an energy dispersive spectroscopy (EDS).TEM was performed onG20(made by FEICo., USA). The structures of nanoparticles were identified by X-ray diffraction. PANalytical X’Pert Pro made in Netherland was used to record powder diffraction patternsusing Cu Kα radiation. The date wascollected ranged from 10° to 90° at 4.25° per minute. The Lakeshore Model 7407 Vibrating Sample Magnetometer (VSM)was used for magnetization measurement at room temperature. The pore size distribution and Brunauer-Emmett-Teller (BET) surface area of the nanoparticles were measured by N2 adsorption/desorption on Autosorb-iQ-C (Quantachrome, USA). The concentration of organic amine was using gas chromatograph–mass spectrometer (GC–MS) model 7890B-7000C manufactured by AAgilent Technologies in the USA.
2.4 Adsorption
In a series of vials containing 20 mL of the designed concentration of TMA solution, a fixed amount of adsorbent was used for batch adsorption experiments. Typically, 0.02 g of the CMA was put into 20 mL of TMA solution (200 mg/L), and then it was vibrated at 1000 rpm for 24 h at room temperature. Magnetic bar was used to separate the magnetic adsorbent from the solution. Gas chromatograph–mass spectrometer (GC–MS) was used to measure the concentration of TMA in the adsorbed liquid.
The adsorption capacity (qe) was calculated as follows (Fu et al., 2018):
In the kinetic experiment, 0.02 g of the adsorbents were added to the 20 mL TMA solution with the specified initial concentrations of 100, 200 and 300 g/L respectively. The samples were oscillated at 1000 rpm, and the concentration of TMA was analyzed within the designed time interval.
3 Result and discussion
3.1 Characterization
3.1.1 Chemical analysis
All materials for synthesizing the MCA were obtained from the raw ore. Silica which plays an important role in adsorbing was prepared using the sulfuric acid leaching residue (obtained via 2.2 i). For the leaching residue, it can be found that SiO2 are upgraded in the residue from original 29.42% up to 69.56% (seen in Table 2). It proved that silicon compounds are main components in the solid waste.
Si
Fe
Mg
Al
Ni
Residue (mass/%)
69.56 (SiO2)
9.02 (TFe)
6.94 (MgO)
2.1 (Al2O3)
0.37
Ni2+ and Fe2+ solution (g/L)
31.7
10.5
2.3
2.8
In Na2SiO3 solution (g/L)
24.4
0.036
0.006
0.48
<0.001
Sodium silicate solution (F1, F2), purified silicate solution (F3-F5) and silica (F6) which incorporate on the magnetic particles and work on adsorbing in the MCA were obtained by formula (F1) to (F6).
From chemical composition of the purified silicate solution in Table 2, we can find that heavy metal ions impurities almost were removed by carbonation decomposition method.
Magnetic particles which play an important role in recycling were prepared via 2.2 ii. From chemical composition of the Ni2+ and Fe2+ solution in Table 2, we can find that the roatio of ferrous ions in the Ni2+ and Fe2+ solution are higher. According to our previous work (Liu et al., 2014), the magnetic particles are mixture of alloy and nickel ferrite, with more NiFe oxides.
3.1.2 Morphology and structure
The compositions of Ni and Fe in the as-synthesized NiFe particles are 1:16. As our previous work (Liu et al., 2014), when the feeding ratio of Ni to Fe was < 60%, the hydrothermal products are inclined to Nickel ferrite.
XRD patterns of the magnetic particles and MCA are shown in Fig. 2. The XRD data belonging to magnetic particles showed six clear peaks. The peaks at 19.0° and 44.8° can correspond to (1 1 1) and (4 0 0) features of MgAl2O4. The peaks at 35.4° and 62.5ocan be indexed to (3 1 1) and (4 4 0) of spinel NiFe2O4. The peak at 40.9° was assigned to (1 1 3) planes of α-Fe2O3. The peak at 51.9° can be indexed to (2 0 0) plane feature of the NiFe alloy with face-centered cubic (fcc) structure (Hjiri et al., 2019).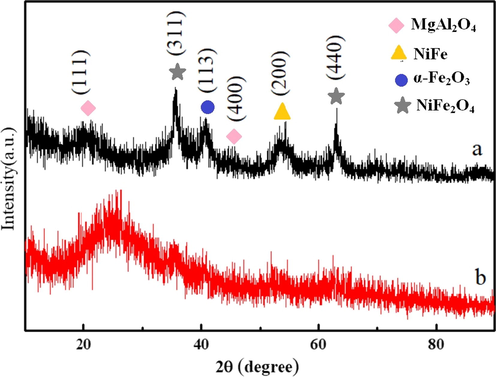
XRD patterns of magnetic particles and magnetic MCAs prepared from laterite nickel ore (a) magnetic particles (b) magnetic MCAs.
Based on our previous work (Liu et al., 2014), the hydrothermal products of nickel and iron ions mixture solution are effected by the feeding ratio of Ni to Fe. When Ni:Fe is higher than 3:1, the products are NiFe bimetallic alloy with Fcc structure; If the ratio of Fe ion increase, the products appear nickel ferrite with ferroferric oxide structure, even to pure ferroferric oxide. In this study, the feeding ratio of Ni to Fe was determined by nickel laterite ore, NiFe2O4 and NiFe phases found in the products are consistent with the previous work. Meanwhile, MgAl2O4 were seen in the hydrothermal products. Its existence is because there are Mg2+ and Al3+ in the Ni2+ and Fe2+ solution (seen Table 2). According to the experiment, the hydrothermal products were separated by magnetic bar, so MgAl2O4 were deduced that it was formed in the initial hydrothermal reaction stage and offered nucleation for NiFe2O4 or NiFe. For α-Fe2O3, it was derived from the oxidizing of ferroferric oxide in the sample drying process.
Compared with magnetic particles, the curve b shows a wide peak at the low diffraction angle (2θ < 30°), indicating the existence of amorphous phase in the magnetic MCA. Furthermore, the decrease and even disappear of the clear peaks is caused by the cover of amorphous phrase.
The representative sets of SEM and TEM images of magnetic particles and MCAs are shown in Fig. 3. It can be seen that both of the samples (Fig. 3(a, b)) are formed with agglomerations of non-uniform grains, but the particle size of the later is bigger. EDS analysis (Fig. 3(c)) illustrates that the elements of Ni, Fe, Al and Mg are present in the two samples, but Si only exists in the MCAs.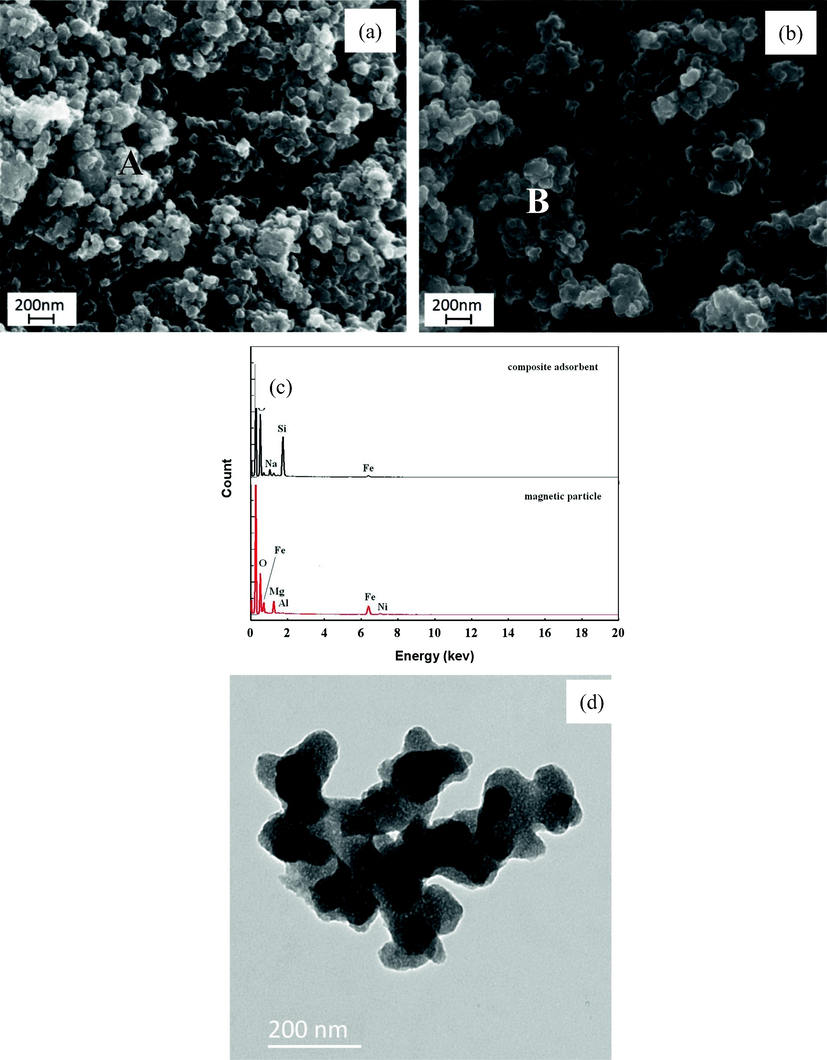
SEM image of magnetic particles (a) and MCAs (b), and EDS spectra (c) of “A” and “B” point and TEM image of MCA (d).
Based on XRD, SEM and EDS analysis, it should be believed that the MCAs are composed of magnetic particles and amorphous silicon compounds. Furthermore, TEM characterization of MCAs is shown in Fig. 3(d). It is different from our previous work (Liu and Shen, 2019), the products are not perfect core-shell structure. Silica small particles obtained by carbonation decomposition of silicate solution incorporated on the NiFe particles. The irregular silica particles link together and form larger clusters. In the composite structure, silica works on adsorbing and magnetic particles help recycling.
3.1.3 VSM
As shown in Fig. 4, the magnetic properties of the magnetic particles and MCAs were characterized via vibrating sample magnetometer at room temperature. For magnetic particles, the values of the saturation magnetization (Ms), remanence (Mr) and coercivity (Hc) are 6.364 emu/g, 1.186 emu/g and 86.19Oe respectively. For MCAs, the values of the parameters are 0.596 emu/g, 0.196 emu/g and 109.06Oe respectively. Compared to the magnetic particles, the Ms and Mr values of MCAs were lower due to the existence of amorphous silica. The low effective coupling of the magnetic dipole moment leads to an increase in Hc (Wang et al., 2005).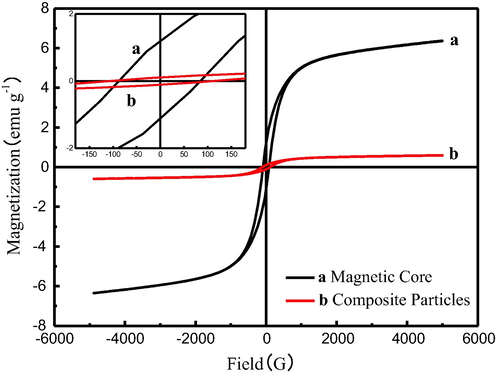
VSM magnetization curve of magnetic particles (a) and MCA (b) prepared from laterite nickel ore.
3.1.4 BET surface area analysis
Fig. 5 shows the N2 adsorption–desorption isotherms of the MCAs. It shows that the curves of MCAs have been classified to typical V curves.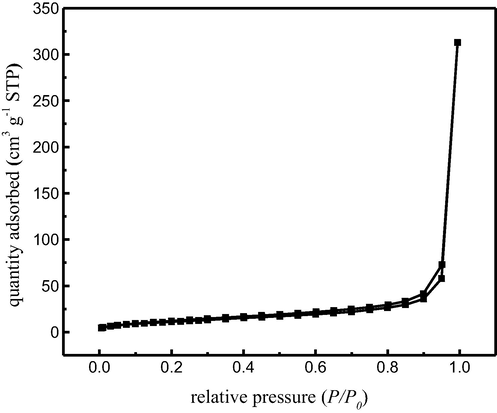
The N2 adsorption-desorption isotherms of MCA.
The N2 adsorption capacity of composite particles increased slowly at low pressure, and the adsorption mode of nitrogen molecules on the inner surface of the pore was monolayer to multilayer. When P/P0 ranges from 0.8 to 1.0, the adsorption capacity increases sharply, and the change of adsorption and desorption region was relatively narrow, which indicated that the pore size of MCAs was more uniform. The surface area as determined from the adsorption branch by the multipoint BET method was 42.167 m2/g. And the pore size distribution of the composite particles as test by the BJH method was 3.062 nm.
3.2 Adsorption
3.2.1 Effect of initial concentration
The initial concentration of pollutant is a key parameter for adsorption. It reflects the necessary driving force that can overcome the resistance between the liquid phase and the solid phase (Iram et al., 2010).
The effect of the contact time on the adsorption for TMA is shown in Fig. 6(a). The equilibrium adsorption capacity increased from 10.30 to 30.45 mg/g with the initial TMA concentration increasing from 100 to 300 mg/L. At the low initial TMA concentration, most of the adsorption active sites were unsaturated on the adsorbent surface. With the increase of the TMA concentration, the driving force derived from the concentration gradient would gradually be enhanced to provide greater impetus to adsorbate. It makes more TMA molecules to overcome the transfer resistance to land on the adsorbent surface and combine with valid adsorption sites on the surface of the adsorbent (Zhang et al., 2020).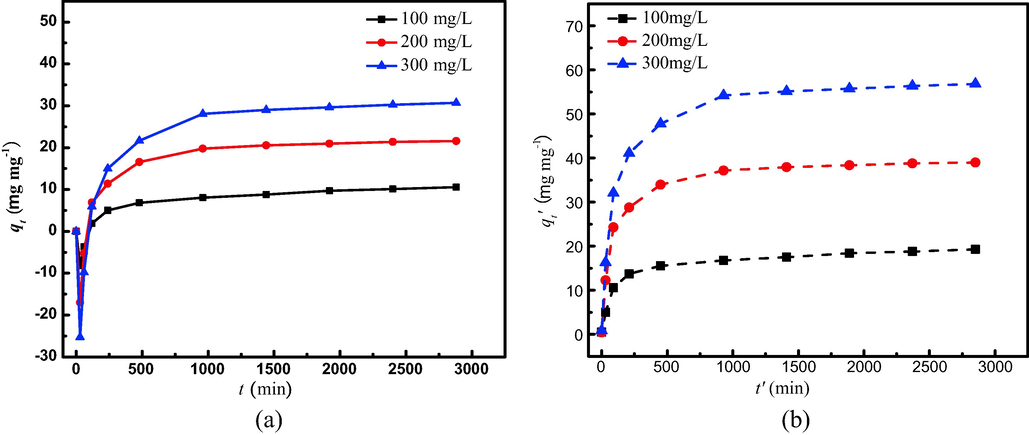
Effect of initial concentration on TMA removal by MCA (a) experimental data (b) re-calcualted data.
Here, an adsorption process different from other literatures was observed. As shown in Fig. 6(a), a negative qt can be obtained based on Eq. (1) at 30 min of adsorption and then began positive adsorption. The same trend was found for pure silica adsorbent (seen the supporting file). According to this phenomenon, it seems that the adsorbent do not adsorb TMA but release more to the solution within the first 30 min. Obviously, the interpretation is wrong because there is no TMA in the prepared adsorbent. The phenomenon of negative qt is originated from the different adsorbing speeds of the adsorbent to water molecules and TMA molecules. The prepared adsorbent was dried at 393 K, resulting in the losing of adsorbed water of the adsorbent. When the adsorbent was put into the solution containing TMA, TMA and water molecules were adsorbed onto the adsorbent simultaneously. But the adsorbing speeds were different, adsorbing to water was faster. It made the real concentration of TMA higher at this stage than the initial concentration. Hence, to calculate qt based on Eq. (1) at this stage, we got the negative values. With the adsorption, the adsorbing to water reached saturation. After that, the adsorption mainly exhibited the adsorbing to TMA. The zero of qt at 30 min can be considered that the adsorbent reach the saturated water adsorption. The volume of water absorption calculated was 1.6 mL. The qt′ was re-calculated on the basis of the real concentration using Eq. (1). The new adsorption equilibrium curve is shown in Fig. 6(b). There are two findings. First, adsorption of TMA onto MCA increased fast within the initial 240 min and then slowly down to equilibrium. It can be interpreted that the available actives sites on the adsorbent gradually decreased with the increase of adsorption capacity. Second, the qt′ increased with TMA concentrations. It can be explained that every active site on the adsorbent is surrounded by more TMA molecules and ultimately occupied more efficiently. The actual equilibrium adsorption capacities at three different concentrations were 19.28, 38.98 and 56.80 mg/g, respectively.
3.2.2 Adsorption isotherms
The adsorption isotherm curves (qe′ vs. Ce) of TMA onto the MCA are shown in Fig. 7, measured through the initial TMA concentrations from 100 to 500 mg/L at temperatures of 273, 293 and 313 K, respectively. It shows that the qe′ increase with initial concentrations and temperature. For example, qe′ increases from 6.77 to 32.41 mg/g when adsorbing temperature rises from 273 to 313 K under the initial TMA concentration of 100 mg/L. It demonstrates that high temperature is favorable to removal of TMA.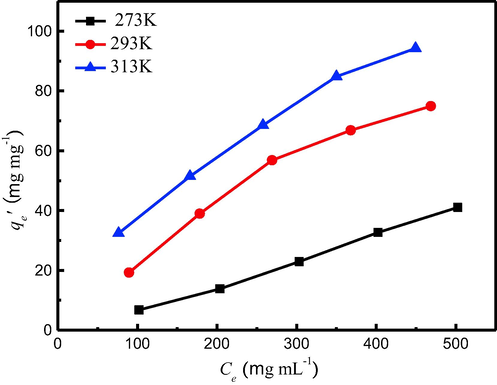
Adsorption isotherms data TMA onto MCA.
Formulate the date in Fig. 6(b) into Langmuir and Freundlich isotherm models, and then investigate the maximum adsorption capacity. In order to describe monolayer adsorption onto a surface, Langmuir isotherm has been widely used. The adsorption process will be identify at a site when a pollutant molecule occupies this site (Iram et al., 2010). Its linear form can be expressed as follows (Iram et al., 2010):
For Freundlich isotherm, it belongs to an empirical equation. Freundlich model is commonly used to illustrate multilayer adsorption process with interaction between pollutant molecules, which occurs on a heterogeneous surface with uniform energy distribution and reversible adsorption (Iram et al., 2010). Its linear form is represented as follows (Kumar et al., 2014):
The Langmuir and Freundlich models for removal of TMA are shown in Fig. 8. The constants of Langmuir and Freundlich were obtained through the corresponding slope and intercept of the linear curve of Ce/qe′ versus Ce and ln qe′ versus lnCe, respectively. The values of the correlation coefficients (R2) calculated based on the Langmuir model are 0.9252, 0.8437 and 0.9775, respectively, and are 0.999, 0.990 and 0.998 from Freundlich model, respectively. This result illustrated that Freundlich model are more appropriate than Langmuir model. The linear equations and characteristic parameters based on Freundlich model are listed in Table 3. The Freundlich isotherm belongs to non-ideal adsorption model performing on heterogeneous surfaces with a uniform energy distribution (Kumar et al., 2014). The heterogeneity is derived from the presence of different functional groups on the surface of the adsorbent, and also from various interactions of the adsorbent and the adsorbate (Guo et al., 2014). As shown in Table 3, the parameter if n represents heterogeneity factor and it has used to evaluate when the adsorption process is physical (n > 1), chemical (n < 1) or linear (n = 1) (Martins et al., 2015). For the adsorption at room temperature, n is greater than 1, the adsorption more inclined to physical adsorption and the more heterogeneous the surface exists.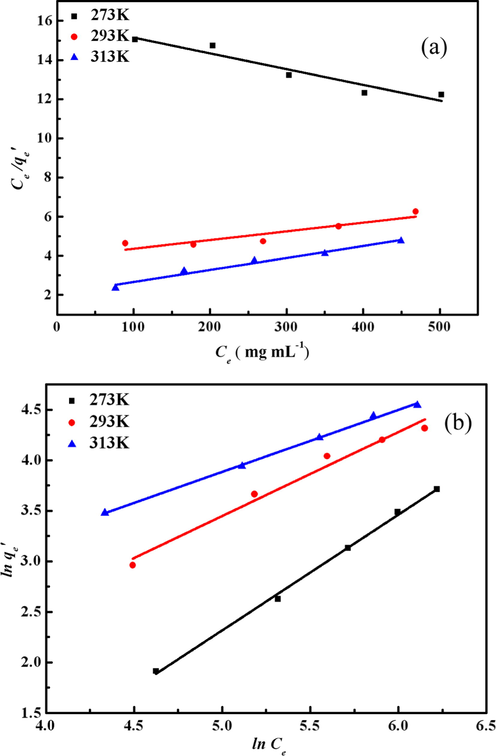
Langmuir adsorption isotherm fitting lines (a) and Freundlich adsorption isotherm fitting lines (b) of TMA onto MCA.
T/°C
Equation
R2
n
KF (mL/μg)
0
ln qe = −3.413 + 1.1459lnCe
0.999
0.873
0.0329
20
ln qe = −0.712 + 0.8320lnCe
0.990
1.202
0.491
40
ln qe = 0.812 + 0.6147ln Ce
0.998
1.627
2.252
3.2.3 Thermodynamics
Thermodynamics analysis of the adsorption process can estimate whether the process will happen spontaneously. For a practical process, energy and entropy attention have to be considered in any adsorption process. The values of log Kc can be described on the following equation (Oguz and Keskinler, 2005):
The Gibbs free energy changes (ΔG), the enthalpy change (ΔH) and entropy change (ΔS) were calculated based on the Eqs. (5) and (6):
In order to calculate the thermodynamic parametersof ΔH and ΔS, these parameters can be calculated from the slope and intercept of the linear curve of log Kc vs.1/T. The thermodynamic parameters are displayed in Table 4. A spontaneous adsorption of TMA onto MCAs can be demonstrated from negative values of ΔG. The ΔG calculated from three temperatures (0.380, −1.34 and −2.874 KJ mol−1) can confirm that the adsorption mechanism is dominated by physical adsorption (Allen et al., 2004). The positive ΔH declares that the adsorption reaction of TMA removal by MCA is endothermic (Feyzi and Norouzi, 2016).
T /K
ΔG/kJ mol−1
ΔH/kJ mol−1
ΔS/kJ mol−1
273
−0.380
16.551
0.062
293
−1.340
313
−2.874
3.2.4 Adsorption kinetics
The data were further fitted to get access to the adsorption kinetics information of the TMA onto MCA. Commonly, the pseudo-first-order model and pseudo-second-order model of Eqs. (7) and (8) were used to analyze them respectively.
The pseudo-first-order model can be described on the following linear form (Fu et al., 2018):
The pseudo-second-order model can be described on the following linear form (Fu et al., 2018):
As shown in the Fig. 9, it is obvious that Pseudo-second-order kinetic model exhibited a good linearity (R2 > 0.998). The kinetics parameters according to pseudo-second-order model are listed in Table 5.The result shows that the pseudo-second-order equation depending on the adsorbent and pollutant molecules can better reflect the adsorption process (Iram et al., 2010). The calculated qe* calculated from the pseudo-second-order model are very close to the experimental qe′. It suggests that pseudo-second-order kinetic model is more suitable. (Akar et al., 2008) Furthermore, it illustrates that the adsorption depends on the adsorbate and adsorbent (Ho and Kay, 1998). The kinetics of adsorption of many species onto various adsorbents was also found to be of second order in the literature (Moussavi and Mahmoudia, 2009). qe′(mg/g) is adsorption capacity, and qe* is adsorption capacity.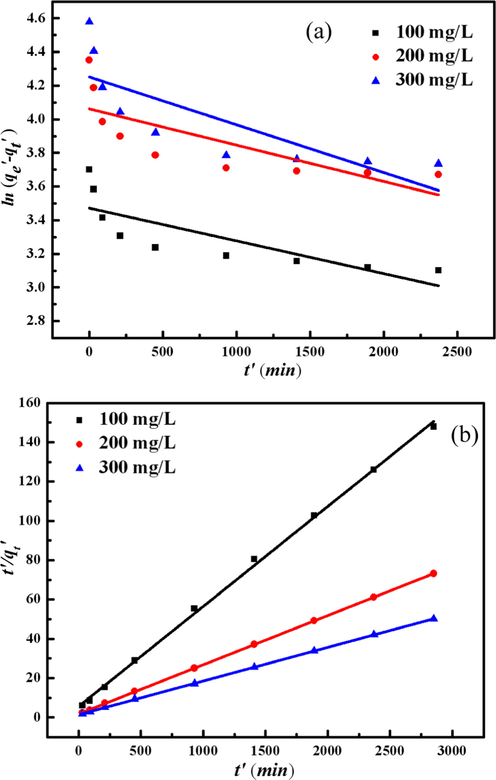
Adsorption kinetic plots of TMA onto the MCA Pseudo-first-order kinetic model (a) and Pseudo-second-order kinetic model (b).
Concentration (μg/mL)
Equation
qe′(mg/g)
qe*(mg/g)
k2
R2
100
t′/qt′ = 5.6765 + 0.05085 t′
19.28
19.67
0.000171
0.999
200
t′/qt′ = 1.7814 + 0.02506 t′
38.98
39.90
0.000164
1.000
300
t′/qt′ = 1.4175 + 0.01714 t′
56.80
58.34
0.000149
1.000
3.2.5 Adsorption rate-controlling mechanism
Assuming that the adsorption mechanism is that adsorbate molecules enter the pores of the adsorption material through diffusion. The intra-particle diffusion model explored by Weber and Morris was represented as follows (Brito et al., 2010):
The plots obtained for qt versus t1/2 are shown in Fig. 10 and the parameters are listed in Table 6. All plots are exhibited in two linear segments, indicating that the adsorption of TMA includes two stages (film diffusion stage and intraparticle diffusion stage). In Table 6, the value of kd1was higher than that of kd2, which was consistent with the observation in Fig. 6 that the slope of former stage was higher than the latter one. The high kd values of the first-stage indicates adsorption rate happened at external surface or instantaneous adsorption is high. kd values of the second-stage curve is smaller. The adsorption process is mainly governed by the intra-particle diffusion process.
Weber-Morris intraparticle diffusion plots for removal TMA using MACs.
Concentration (mg/L)
First-stage
kd1 (mg/g min−1) C1
Second-stage
kd2 (mg/g min−1) C2
100
0.64
3.11
0.12
13.16
200
1.28
8.55
0.14
31.90
300
1.91
10.13
0.25
44.53
Furthermore, at the initial stage, the adsorption sites on the MCA surface can bond with the TMA and get saturated instantly. Then at the intraparticle diffusion stage, TMA would transfer and combine with the valid interior adsorption sites inside the adsorbent pores, where the diffusion of TMA was slow down due to the lager mass transfer resistance. Thus, the rate constant of this stage was smaller than the former one. Moreover, the fitting lines didn’t pass through the origin point, meaning that the intraparticle diffusion step was not the only step limiting adsorption rate, the film diffusion stage also played a part in ruling the adsorption rate (Ghasemi et al., 2014).
4 Conclusion
In summary, the MCA using laterite nickel ore as raw material were successfully synthesized and characterized by using XRD, SEM, TEM, EDS, VSM and BET techniques. The magnetic MCA can effectively remove trimethylamine from aqueous solutions. The spontaneous adsorption process can be demonstrated by the negative values of ΔG calculated by the thermodynamics parameters. Freundlich isotherm model was the most consistent with the experiment data. The adsorption kinetics followed pseudo-second-order kinetic model and the adsorption process was governed by intra-particle diffusion processes. The results show that laterite nickel ore can be prepared into magnetic MCA for organic amine removal from polluted water.
Acknowledgements
This work was supported by the National Natural Science Foundation of China (NSFC, Grant No.51574084 and No.51774070).
Declaration of Competing Interest
We declare that we do not have any commercial or associative interest that represents a conflict of interest in connection with the work submitted.
References
- Biosorption of a textile dye (Acid Blue 40) by cone biomass of Thuja orientalis: estimation of equilibrium, thermodynamic and kinetic parameters. Bioresour. Technol.. 2008;99:3057-3065.
- [Google Scholar]
- Adsorption isotherm models for basic dye adsorption by peat in single and binary component systems. J. Colloid Interface Sci.. 2004;280:322-333.
- [Google Scholar]
- Brazil nut shells as a new biosorbent to remove methylene blue and indigo carmine from aqueous solutions. J. Hazard. Mater.. 2010;174:84-92.
- [Google Scholar]
- Study on recycling and reusing of industrial wastewater containing dimethylamine. Chin. J. Environ. Eng. 2010;4:35-38. (in Chinese)
- [Google Scholar]
- A magnetically recoverable CaTiO3/reduced graphene oxide/NiFe2O4 nanocomposite for the dye degradation under simulated sunlight irradiation. J. Ceram. Soc. Jpn.. 2019;127:221-231.
- [Google Scholar]
- Preparation and kinetic study of magnetic Ca/Fe 3 O 4@ SiO 2 nanocatalysts for biodiesel production. Renewable Energy. 2016;94:579-586.
- [Google Scholar]
- Fu, L., Liu, Y., Huang, P., Shen, X.Y., 2018. Synthesis, Characterization, and Application of a New Magnetic Silica Composite Nanoadsorbent with NiFe-Embedded Structure. Water Air and Soil Pollution 229.
- Equilibrium Study of Ni(II) sorption from Aqueous Solutions onto Peganum harmala-L. Int. J. Environ. Sci. Technol.. 2014;2014(11):1835-1844.
- [Google Scholar]
- Removal of methylene blue from aqueous solutions by chemically modified bamboo. Chemosphere. 2014;111:225-231.
- [Google Scholar]
- Adsorption of Low-Molecular-Weight Amines in Aqueous Solutions to Zeolites: An Approach to Impeding Low-Molecular-Weight Amines from Regenerating N-Nitrosamines. Ind. Eng. Chem. Res.. 2017;56:12024-12031.
- [Google Scholar]
- Supported-gas-membrane process for removal and recovery of aliphatic amines from aqueous streams. Chem. Eng. Sci.. 2016;141:330-341.
- [Google Scholar]
- Degradation kinetics and mechanism of beta-lactam antibiotics by the activation of H2O2 and Na2S2O8 under UV-254 nm irradiation. J. Hazard. Mater.. 2014;279:375-383.
- [Google Scholar]
- Preparation and photoluminescence of NiFe2O4 nanoparticles. J. Mater. Sci.-Mater. Electron.. 2019;30:15379-15387.
- [Google Scholar]
- A comparison of chemisorption kinetic models applied to pollutant removal on various sorbents. Process Saf. Environ. Protect.. 1998;76:332-340.
- [Google Scholar]
- Adsorption and magnetic removal of neutral red dye from aqueous solution using Fe3O4 hollow nanospheres. J. Hazard. Mater.. 2010;181:1039-1050.
- [Google Scholar]
- A new approach for the degradation of high concentration of aromatic amine by heterocatalytic Fenton oxidation: Kinetic and spectroscopic studies. J. Mol. Liq.. 2012;173:153-163.
- [Google Scholar]
- A New Electrode Reactor with in-built Recirculation Mode for the Enhancement of Methylene Blue Dye Removal from the Aqueous Solution: Comparison of Adsorption, electrolysis and Combined Effect. Korean J. Chem. Eng.. 2014;31:276-283.
- [Google Scholar]
- Characterization of magnetic NiFe nanoparticles with controlled bimetallic composition. J. Alloy. Compd.. 2014;587:260-266.
- [Google Scholar]
- Preparation and characterization of NiFe bimetallic micro-particles and its composite with silica shell. J. Saudi Chem. Soc.. 2019;23:1032-1040.
- [Google Scholar]
- Activation of ultrasound enhanced persulfate oxidation by biogenic nanosilvers for degradation of 4-nitroaniline. Desalin. Water Treat.. 2020;174:240-247.
- [Google Scholar]
- Removal of tetracycline by NaOH-activated carbon produced from macadamia nut shells: Kinetic and equilibrium studies. Chem. Eng. J.. 2015;260:291-299.
- [Google Scholar]
- Study on treatment of DMA containing wastewater with ion exchange resin. Environ. Pollut. Control. 2010;32:58-63. (in Chinese)
- [Google Scholar]
- Removal of azo and anthraquinone reactive dyes from industrial wastewaters using MgO nanoparticles. J. Hazard. Mater.. 2009;168:806-812.
- [Google Scholar]
- Degradation of N-nitrosodimethylamine and its amine precursors by cumene-induced Rhodococcus sp. strain L4. Biodegradation. 2019;30:375-388.
- [Google Scholar]
- Determination of adsorption capacity and thermodynamic parameters of the PAC used for bomaplex red CRL dye removal. Colloids Surf., A. 2005;268:124-130.
- [Google Scholar]
- Fast and highly efficient removal of dye from aqueous solution using natural locust bean gum based hydrogels as adsorbent. Int. J. Biol. Macromol.. 2020;143:60-75.
- [Google Scholar]
- Amines and amine-related compounds in surface waters: A review of sources, concentrations and aquatic toxicity. Sci. Total Environ.. 2014;481:274-279.
- [Google Scholar]
- A magnetically separable and recyclable g-C3N4/Fe3O4/porous ruthenium nanocatalyst for the photocatalytic degradation of water-soluble aromatic amines and azo dyes. RSC Adv.. 2020;10:6043-6051.
- [Google Scholar]
- Degradation of Aniline by Plate and Rod Electrode Fered-Fenton Reactors: Effects of Current Density, Fe 21, H2O2, and Aniline Concentrations. Environ. Prog. Sustainable Energy. 2014;33:410-418.
- [Google Scholar]
- Adsorptive interaction of 4-aminobiphenyl with mesoporous MCM-41. Phys. Chem. Liq.. 2019;57:720-732.
- [Google Scholar]
- One-pot synthesis of triptycene-based porous organic frameworks with tailored micropore environments for highly efficient and selective amine adsorption. Polym. J.. 2016;48:787-792.
- [Google Scholar]
- Monodispersed core-shell Fe3O4@Au nanoparticles. J. Phys. Chem. B. 2005;109:21593-21601.
- [Google Scholar]
- Photocatalytic Hydrodehalogenation for the Removal of Halogenated Aromatic Contaminants. ChemCatChem. 2019;11:258-268.
- [Google Scholar]
- Adsorption of dimethylamine from aqueous solution by manganese dioxide. Water Sci. Technol.. 2011;63:45-50.
- [Google Scholar]
- Aqueous adsorption and removal of organic contaminants by carbon nanotubes. Sci. Total Environ.. 2014;482:241-251.
- [Google Scholar]
- Removal of methyl orange dye using activated biochar derived from pomelo peel wastes: performance, isotherm, and kinetic studies. J. Dispersion Sci. Technol.. 2020;41(1):125-136.
- [Google Scholar]
- Zhang, Z., Zhou, Y.X., Wang, W.Z., 2010. Study of Organic Amine Wastewater by Chemical Precipitation Method. Environ. Sci. Manag 35, 63-65+92(in Chinese).
- Zhu, D.Q., Xu, J.W., Guo, Z.Q., Pan, J., Li, S.W., Pan, L.T., Yang, C.C., 2020. Synergetic utilization of copper slag and ferruginous manganese ore via co-reduction followed by magnetic separation process 250, 119462.
- Sono-advanced Fenton-like degradation of aromatic amines in textile dyeing sludge: efficiency and mechanisms. Environ. Sci. Pollut. Res.. 2019;26:7810-7820.
- [Google Scholar]
Appendix A
Supplementary material
Supplementary data to this article can be found online at https://doi.org/10.1016/j.arabjc.2020.102933.
Appendix A
Supplementary material
The following are the Supplementary data to this article:


