

Translate this page into:
Production of a water disinfectant by membrane electrolysis of brine solution and evaluation of its quality change during the storage time
⁎Corresponding author. tebadi@aut.ac.ir (Taghi Ebadi)
-
Received: ,
Accepted: ,
This article was originally published by Elsevier and was migrated to Scientific Scholar after the change of Publisher.
Abstract
Anolyte solution produced by membrane electrolysis of NaCl solution contains a high level of available chlorine content (ACC) and other oxidizing compounds, rendering this solution a strong disinfectant property. In this paper, some process parameters affecting the anolyte production efficiency, such as total inlet flow (240–320 L/h), saline solution concentration (1.65–3.50 g/L), and the type of membrane (cation exchange, anion exchange, and bipolar membranes) were investigated in an electrolysis cell. Changes in the quality of anolytes produced at three initial concentrations of very high (ACC1 = 816.5 mg/L), relatively high (ACC2 = 461.5 mg/L), and medium (ACC3 = 355.0 mg/L) during storage (from the production up to 20 weeks) were examined by adjusting the total inlet flow, saline concentrations, and membrane types. Changes in the ACC of the produced anolyte solution were generally affected by the type of membrane used in the electrolysis cell. The use of anion exchange membrane resulted in the lowest durability of anolyte quality (60–80% ACC reduction after 4 weeks of storage) and the cation exchange membrane had the highest durability (less than 40% decrease after 4 weeks of storage). In addition, changes in the pH and the oxidation–reduction potential of the anolyte were investigated during the storage period, which had a different trend depending on the type of applied membrane.
Keywords
Membrane electrolysis
Ion exchange membrane
Anolyte solution
Water disinfection
Available chlorine content
Storage time
Oxidation-reduction potential

1 Introduction
The use of anolyte produced by membrane electrolysis of water and NaCl solution for the disinfection of water and wastewater has a higher disinfection effect than chlorine, which is the most known disinfectant. Anolyte solution will also eliminate some chlorine-resistant pathogens due to the presence of a combination of different oxidants and active radicals (Diao et al., 2004; Huang et al., 2016). With the injection of anolyte into the water distribution network line, there will be more residual chlorine with longer durability in the water, which will reduce both the required injected chlorine concentration and the production of harmful disinfection byproducts. Acidic solution from saline water electrolysis in a membrane electrolysis cell, where the anode and cathode electrodes are separated by an ion exchange membrane, contains a certain amount of active chlorine and oxygen at a low pH (<3) and a high oxidation–reduction potential (ORP) (>1000 mV). Some studies have reported pH values below 2.7 and ORP levels above 1100 mV, with a free chlorine concentration of 10–80 mg/L. By applying direct current to the electrodes, electrochemical processes occur on the surface of the electrodes, and saline solution electrolysis on the anode electrode surface produces a solution rich in Cl and reactive oxygen radicals; the product of the anode chamber is called anolyte. Due to its disinfectant effects, the anolyte has been used for the control of microbial growth in various fields by many studies (Cloete et al., 2009; Liao et al., 2007; Rahman et al., 2016). In the anolyte solution, active chlorine is mainly present in the forms of Cl2, HOCl, and ClO−; the exact physicochemical properties of the produced anolyte depend on both the properties of the electrochemical cell and its operational parameters. Effective disinfection function of this disinfectant solution can result from two physical (pH and ORP levels) and chemical (presence of chlorine, reactive oxygen, and free radicals) factors. Additionally, most of studies have shown that active Cl is an important factor in disinfection, and hypochlorous acid (HOCl) produced by the electrochemical hydrolysis of Cl2 (g) is the most important active chlorine component in this solution (Huang et al., 2008; Kraft, 2008; Thorn et al., 2012). In the anolyte solution, there are low amounts of other oxidants, except chlorine, but have a significant chemical effect on the disinfection process. Preliminary studies identified this multi oxidant solution as the main disinfectant component, containing active chlorine (in the forms of Cl2, HOCl or OCl− with certain percentages of pH). In 1994, the first attempts were made to measure other disinfectants, assuming the presence of chlorine dioxide (ClO2), ozone (O3), and hydrogen peroxide (H2O2). The measurement complexity in the presence of high concentrations of Cl ions (about 300–400 mg/L) and the interference of existing ozone and Cl on the results of measuring methods for the concentration of these compounds were considered as the main problems in accurate measurements of oxidants in the anolyte solution. At the University of North Carolina, research by Daewoo indicated the presence of a small (a few mg/L), but a chemically significant level of ozone, and Enczel measured the presence of ClO2 at low but chemically significant concentrations (Enczel, 1997). In studies conducted by Bradford, ORP measurements of products generated by membrane electrolysis cells further confirmed the presence of disinfectants, other than chlorine, in the multi oxidant solution. Bradford found that the ORP measured in the anolyte solution was approx. 20–30 mV higher than that predicted theoretically, which supports the hypothesis that a combined potential is present between Cl and other disinfectants with higher ORPs (Li and Kim, 2015).
One of the limitations for the use of an anolyte solution is the reduction of its disinfection activity over time, caused by the loss of chlorine present therein, which can be investigated by examining the reduction of product activity during storage. Therefore, studies on the effect of storage period on changes in disinfectant quality of the anolyte solution have been of interest in recent years (Cui et al., 2009; Len et al., 2002). Storage conditions are among the important factors affecting the physicochemical properties and disinfection activity of the anolyte solution. The reduction of chlorine has been found to be due to the evaporation of dissolved Cl2 and then decomposition to HOCl. Several factors, such as the light and temperature of the storage environment, shaking the product storage container, and the type of packaging, can reduce the ACC by affecting its evaporation rate. The pH of the product can also affect the evaporation of chlorine because the Cl2/HOCl ratio in a solution is dependent on the pH (Len et al., 2002). The storage feasibility of anolyte produced by membrane electrolysis of a saturated solution of NaCl and water was also investigated by Nisola et al., who reported an initial ACC concentration of 173 mg/L in the produced solution. They measured changes in free chlorine, pH, and ORP levels over 30 days of storage (Nisola et al., 2011). Cui et al. observed that the pH, ORP, and electrical conductivity (EC) of the anolyte did not change significantly during a 30-day storage period, while total residual chlorine and dissolved oxygen concentrations decreased significantly; however, it should be noted that they used a membrane-free electrolysis cell (Cui et al., 2009). In a study by Len et al., the trend of changes in ACC, ORP, and pH levels of produced anolytes were investigated during a 66-day period of storage conditions in glass containers, as sealed or open lids, by shaking or being stable and exposed to light or in the dark (Len et al., 2002). Hsu and Kao examined changes in pH, ORP, and ACC levels in an anolyte solution stored in glass bottles for 12 days (the sample container was opened periodically) or 21 days (sample container was opened in the first and the last days for measurements) (Hsu and Kao, 2004). Robinson et al. were the first to study the effect of long-term storage (>12 months) on anolytes stored in glass and plastic containers at ambient temperature and cold conditions. They measured their disinfectant effects and physicochemical parameters over time (Robinson et al., 2013).
One of the components of a membrane electrolysis cell is the membrane that separates the anode and cathode electrodes to produce products with different properties on both sides of the anode and cathode chambers. Cation exchange membrane, anion exchange membrane, and bipolar membrane are some of the membranes that can be used in membrane electrolysis cells (Kargari and Mohammadi, 2015; Lalia et al., 2015; Mohammadi et al., 2015). The effect of storage period on the disinfectant quality of the anolyte solution produced from commercial cells was investigated in most studies, with no details of the membrane type. Scant studies focused on the effect of the type and quality of membranes on the produced anolyte solution and changes in its disinfectant quality during long-term storage (Cloete et al., 2009; Hsu, 2005; Hsu and Kao, 2004; Len et al., 2002; Nisola et al., 2011; Robinson et al., 2013). The quality and type of coating of the electrodes used in membrane electrolysis cells are also very effective parameters in the process efficiency and production of an anolyte solution with high disinfectant power (Jeong et al., 2009; Neodo et al., 2012). Robinson et al. produced electrochemically activated solutions by saline water electrolysis in a commercial electrochemical cell and claimed a wide-ranging antimicrobial activity and high environmental-friendly property. In their study, two separate products were produced from the anode and cathode chambers with different flow rates, but they did not mention the type of membrane in this cell (Robinson et al., 2013). In Li and Kim's research, the electrochemical cell consisted of an anode electrode made of titanium (with two different coatings of iridium oxide and ruthenium oxide) and a cathode made of titanium with an iridium oxide coating. They evaluated the effect of voltage (2.5–4.57 V) and inlet flow (6–30 L/h) of the saline solution on the process efficiency. The cell consisted of two cathode and anode electrode plates, detached by a separator, and no membrane was used therein. According to their results, the anode and cathode electrodes with iridium oxide coating produced a higher concentration of active free chlorine because iridium has more electro-catalytic activity than ruthenium. An increase in the applied voltage further elevated the oxidation reaction rate in the electrochemical cell and, consequently, the production of ACC (Li and Kim, 2015). Recently, Ming et al. have studied the effects of cation or anion exchange membrane type used in electrolysis cells, current density, and concentration of inlet saline water on ACC levels of the electrolysis oxidizing water (EOW), and found a relatively low (<200 mg/L) initial concentration range of the products (Ming et al., 2018). Composite cation exchange membranes were used to electrolyze NaCl for the production of sodium hydroxide and Cl2 by selective removal of sodium ions. In the studied electrolysis cell, the efficiency of different membranes and the effects of current density, salt concentration, and inlet flow were investigated on the process efficiency; the cathode and anode electrodes were made of stainless steel and platinum (Savari et al., 2008)
Zeng et al. focused on EOW, which is an excellent disinfection solution and has few negative effects on the environment and humans, but the production cost of anode electrodes made of platinum titanium used in the electrolysis cell limited the production and application of EOW in the field of water disinfection. They fabricated titanium anodes with RuO2, SnO2, and TiO2 coatings to replace platinum and compared the quality of the produced EOW (by measuring pH, ORP, and ACC); they used a membrane electrolysis cell but did not mention the membrane type (Zeng et al., 2012). Ming et al. examined the effect of cation or anion exchange of a membrane used in the electrolysis cell on the quality and efficiency of anolyte production in the process of electrolysis. They also studied the effects of current density and inlet saline water concentration on the ACC level in EO water produced for the electrolysis cell with different membranes (Ming et al., 2018). Deng et al. used TiO2 electrodes with TiO2-IrO2-Ta2O5 composite coating and an anionic membrane in the membrane electrolysis cell (Deng et al., 2019).
The aim of this study was to use different ion exchange membranes (two types of cation exchange membranes, an anion exchange membrane, and a bipolar membrane) by changing the operating parameters affecting the process (saline water concentrations and total inlet flow) to achieve optimal anolyte production conditions with high disinfectant power. Moreover, changes in the quality of produced anolytes with different initial ACC0 concentrations (very high, high, and medium) were examined under normal light conditions and ambient temperature during long-time storage (from the production up to 20 weeks).
2 Materials and methods
2.1 Preparation of a membrane electrolysis cell
Based on previous studies and available equipment, a membrane electrolysis cell was designed and fabricated in the laboratory. The cell consists of anode and cathode electrodes (metal plates coated with a compound metal oxide measuring 10 × 15 cm and 1 mm thick, placed 2 mm apart in the cell) and an ion exchange membrane with a thickness of 0.25 mm located at a distance of 1 mm between the anode and cathode electrodes. A certain flow of saline solution as the electrolyte flows from the anode chamber and ion-free demineralized water flows from the cathode chamber into the cell. The power supply is connected to both anode and cathode sides, and the electrolysis process starts by applying a direct current with 12 W of power. Due to the presence of a membrane within the cell, two separated products with completely different characteristics appear in the anode and cathode chambers. The catholyte produced on the cathode side is a highly alkaline solution (rich in NaOH) and the acidic anolyte solution (with a high chlorine concentration) is produced on the anode side. It is noteworthy that the saline solution entered the electrolysis system from both the anodic and cathode chambers in preliminary tests, but the results showed that the electrolyte (saline solution) should enter the cell from the anode and water from the cathode sides. As such, the membrane acts more effectively in the separation of the ions detached during electrolysis, and the produced anolyte has a higher quality (based on the ACC).
Membrane electrolysis cells are made of corrosion-resistant electrodes in such a way that different voltages are generated simultaneously in different parts for the electrolysis reactions. Hence, different reactions occur on both sides of the anode and cathode and produce a combination of different multi oxidants. In advanced processes of the chloralkali industry, the cathodes used in membrane cells are usually made of an alloy of steel or nickel, and the anodes are based on titanium (Ti) coated with a combination of various metal oxides (Torabiyan et al., 2014). According to the research background, our anode electrodes were made of Ti coated with a combination of metal oxides with different percentages to yield the highest chlorine production efficiency during the electrolysis process. The anode electrodes were coated by a combination of ruthenium (Ru), iridium (Ir), and tantalum (Ta) oxide, and the cathode electrodes were made of steel alloy where iron was the base metal and Cr had the highest percentage composition.
Membranes used in membrane electrolysis cells prevent the migration of electrolyzed chloride ions from the anode to the cathode, and the membrane must be well stable when exposed to acidic and alkaline environments of the anode and the cathode, respectively. The general information of the four membrane types used in this study (Table 1) is described below. 1) An anion exchange membrane (trademark AMI-7001 s) and a polystyrene/divinyl benzene polymer structure with ammonium functional group. 2) A cation exchange membrane (trademark CMI-7000 s), with a polystyrene/divinyl benzene polymer structure and sulfonic acid functional group. 3) A cation exchange membrane (trademark Fumapem-F-10120) reinforced with polytetrafluoroethylene (PTFE). 4) A bipolar membrane (trademark Fumasep-FBM) with sodium ion permeability through the cationic layer and Cl ion permeability through the anionic layer. PK, polyketone; CEM, cation exchange membrane; AEM, anion exchange membrane; PTFE, polytetrafluoroethylene.
Membrane type/symbol
Commercial membrane name
Reinforcement or functional group
Functionality and polymer structure
Counter ion
Thickness (mm)
Appearance/ color
Anion exchange
AMI-7001 s (Membrane international INC. USA)
Quaternary Ammonium
Gel polystyrene cross linked divinylbenzene
Sodium
0.450 ± 0.025
Light yellow
Bipolar
Fumasep ® FBM
PK
No data reported.
Sodium (CEM layer)/ Chloride (AEM layer)
0.145 ± 0.015
Transparent/ Brown
Cation exchange (CMI)
CMI-7000 s (Membrane international INC. USA)
Sulphonic acid
Gel polystyrene cross linked divinylbenzene
Chloride
0.450 ± 0.025
Brown
Cation exchange (PTFE)
Fumapem ® F-10120 PTFE
PTFE
No data reported.
Chloride
0.120 ± 0.010
White
A part of demineralized water with adjustable flow rate is added to the cathode chamber and another part to a concentrated 0.5 M saline water solution stored in the brine tank (iodine-free NaCl with a purity > 99.6%), and the saline solution with a determined concentration enters the cell from the anodic chamber. Total inlet flow to the system is the sum of the incoming water to the cathode and the incoming saline water to the anode. The operating conditions, i.e., total inlet flow (240–320 L/h) and saline solution concentrations (1.65–3.50 g/L) were changed for all four types of membranes to examine the anolyte produced from the anodic chamber with three initial ACC0 levels (ACC1 = 816.5, ACC2 = 461.5, and ACC3 = 355.0 mg/L). The quality of produced anolytes was evaluated and compared using the ACC criterion as the most important measurable parameter. These three concentrations were selected based on the operating conditions and the type of membrane, which can produce products with a different quality. As such, anolytes could be produced using all four types of membranes within the range of ACC1 (very high), ACC2 (high), and ACC3 (medium), which were also comparable to previous studies. Notably, it was also possible to produce an anolyte solution with concentrations lower and higher than this range by changing the operating conditions. The pH (1.48–3.80) and ORP (1031–1144 mV) levels of freshly produced anolytes were quickly measured and recorded in addition to ACC values. Anolyte solutions produced from the membrane electrolysis cell were named based on the membranes used therein, and the results of experiments were compared with each other. The ACC in the anolyte solution was measured by the iodometric titration method by adding a known volume of potassium iodide and acetic acid to the sample using 0.1 N sodium thiosulfate solution as a titrant according to a standard method mentioned in the literature (Rice et al., 2012). The pH and ORP levels of the samples were also measured by a pH/ORP meter (HANA equipment, model HI-2211). Fig. 1 shows the schematic of the system for membrane electrolysis of NaCl.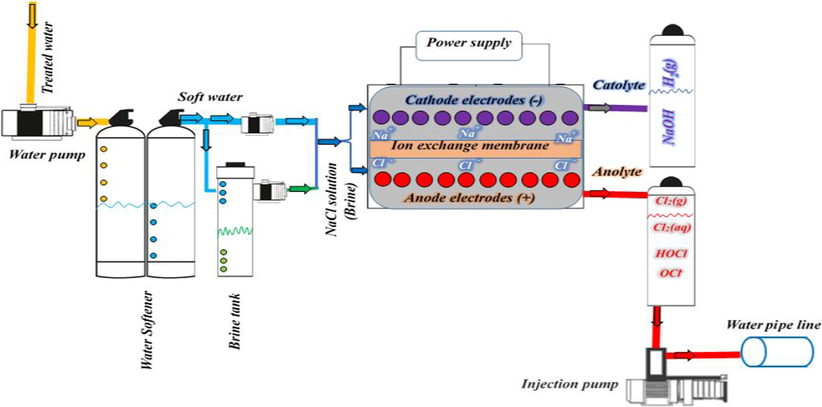
Schematic diagram of anolyte production from the membrane electrolysis system.
2.2 Storage conditions of the anolyte solution
Samples of anolyte were stored in 120 ml transparent plastic containers made of polyethylene terephthalate in ambient conditions at 20–25 °C, protected from sunlight to examine changes in pH, ORP, and ACC reduction trends with storage periods from the production up to 20 weeks. For sampling and testing the stored anolytes once every two weeks, the lid of the sample container was opened and some of the sample was taken for measurements under normal conditions of light and ambient temperature in the air, after which the container lid of the sample was closed and stored again.
3 Results and discussion
3.1 Operational parameters affecting the produced anolyte quality
The type of membrane used in the cell, total flow rate, and inlet saline water concentrations all influence the produced anolyte quality and the electrolysis process efficiency. In the electrolysis process, a current with a certain amount of amps is measured and recorded in the system due to the flow of negative and positive ions produced in the cell medium. This amount of amps is linked to Cl concentrations in the anolyte and with other conditions of the electrolysis process. In fact, the current density obtained from the ratio of recorded amps to the area of electrodes should be considered to be related to the ACC of anolytes as a dependent variable. From one viewpoint, membrane electrolysis cells can be compared by evaluating the ACC of anolytes produced according to the generated amps. For physicochemical analysis of anolytes, therefore, samples are taken online from the outlet of the anode chamber by recording the relevant amps. Measuring the ACC, pH, and ORP levels in anolytes according to the amount of recorded amps is a criterion for assessing product quality. The anolyte was produced by the membrane electrolysis process in four different cell sets with similar electrodes but different ion exchange membrane types by applying a constant electric current, with variable total inlet flow rate and saline water concentrations. The ACC, pH, and ORP levels of freshly produced anolytes were measured and recorded for each set. Electrolysis cells were tested with each of the four different types of ion exchange membranes at three total inlet flow rates (240, 288, and 320 L/h) and variable incoming salt contents (1.65–3.50 mg/L), and then samples were taken from the produced anolytes. The amount of amps produced in the system was also recorded in all cases. For each cell with different membranes, different current densities were obtained in the range of 2.67–12.67 kA/m2. The lowest recorded amps resulting in the lowest current density belonged to the anionic exchange membrane (2.67–4.67 kA/m2), and the highest amounts of produced amps, and consequently the highest current density, were recorded for the PTFE cationic exchange membrane (7.33–12.67 kA/m2). Table 2 shows the parameters studied for each of the four cells with different membrane types and the ACC of produced anolytes, which were selected with three specific concentrations (ACC1, ACC2, and ACC3) for each type of membrane to evaluate changes in the quality during the storage period.
ACC (mg/L)
Current density (kA/m2)
NaCl (g/L)
Q (L/h)
Membrane type
461.5
4.33
2.21
240
Anion exchange
816.5
4.67
2.63
532.5
4.33
3.50
390.5
4.00
1.84
288
461.5
4.00
2.92
390.5
3.33
2.33
390.5
3.67
1.65
320
355.0
2.67
2.10
426.0
3.00
2.63
461.5
7.67
2.21
240
Bipolar
532.5
9.33
3.50
461.5
8.67
2.63
355.0
7.67
1.84
288
390.5
8.00
2.33
532.5
9.67
2.92
745.5
5.67
2.10
320
816.5
7.33
2.63
355.5
5.33
1.65
355.0
6.33
2.21
240
Cation exchange (CMI)
461.5
7.00
2.63
532.5
7.67
3.50
497.0
7.00
2.92
288
745.5
6.00
1.84
461.5
6.67
2.33
710.0
6.67
1.65
320
816.5
7.33
2.63
781.0
7.00
2.10
816.5
10.33
2.21
240
Cation exchange (PTFE)
781.0
12.67
2.63
745.0
10.00
3.50
461.5
10.00
2.33
288
603.5
8.67
1.84
816.5
10.67
2.92
497.0
7.33
1.65
320
355.0
8.33
2.63
639.0
9.67
2.10
Structural differences of the applied membranes, including the quality and type of membranes, thickness, ion exchange capacity, current density tolerance threshold, polymer structure, and the functional group or the reinforcement used at the membrane surface, lead to different results in the membrane electrolysis process. Careful examination of these factors requires complete knowledge on structural details of the membrane, but usually limited information is reported in commercial membranes. The PTFE-reinforced cation exchange membrane with less thickness than the anion exchange membrane had higher output amps against the current intensity, and as a result, the current density was higher (up to 12.67 kA/m2) in this type of membrane.
One of the reasons for the generation of this amount of amps is related to the greater separation of salt in the electrolysis process. This type of membrane, however, needed a higher feed salt concentration to have an anolyte with the determined ACC. The lowest recorded current density for all three initial concentrations of the anolyte belonged to the anionic membrane with a lower amp tolerance range (up to 4.67 kA/m2). However, it should be noted that the goal of membrane electrolysis cells is to separate more chlorine and chlorine-based compounds in the anodic chamber. Therefore, a cation exchange membrane is commonly used in this system that holds Cl- in the anodic chamber and passes Na+, and the anion exchange membrane has the opposite function in this regard. However, the use of anionic exchange membranes also produced the same three specific concentrations of the anolyte in the system. Even so, the criteria for quality comparison were first ACC and then pH and ORP levels of the anolytes, but other oxidants in the anolyte and their percentage compositions should also be identified and measured for a more detailed examination.
To produce these three specific concentrations of anolytes, reduction of total inlet flow or the input salt concentration generally resulted in a lower salt electrolysis efficiency in the system and consequently in the production of an anolyte with lower ACC. In other words, to have a higher ACC in anolytes, it is necessary to establish an equilibrium ratio between the input salt levels and total inlet flow, and these two parameters should be adjusted to achieve the intended ACC. The adjustment level of these two parameters was different for each membrane and was obtained experimentally based on experiments performed within the current density tolerance range of individual membranes. No definite relationships could be extracted except for the CMI cation membrane, which led to the production of an anolyte with a higher ACC0 with simultaneous increases in total flow and input salt concentrations (Fig. 2c). For example, a total inlet flow rate of 240 L/h and an input salt concentration of 2.63 g/L were required to produce a high level of ACC1 from the electrolysis cell with the anion exchange membrane. A constant total flow was considered here to achieve an anolyte with a relatively high concentration (i.e., ACC2), but the input salt concentration was reduced to 2.21 g/L. Similarly, the total flow rate was increased to 320 L/h, and the input salt concentration was reduced to 2.10 g/L (Fig. 2a) for the production of an anolyte with an average concentration (ACC3). The relationships between total inlet flow, input salt concentration, and ACC0 produced for all the four membrane types are shown separately in Fig. 2.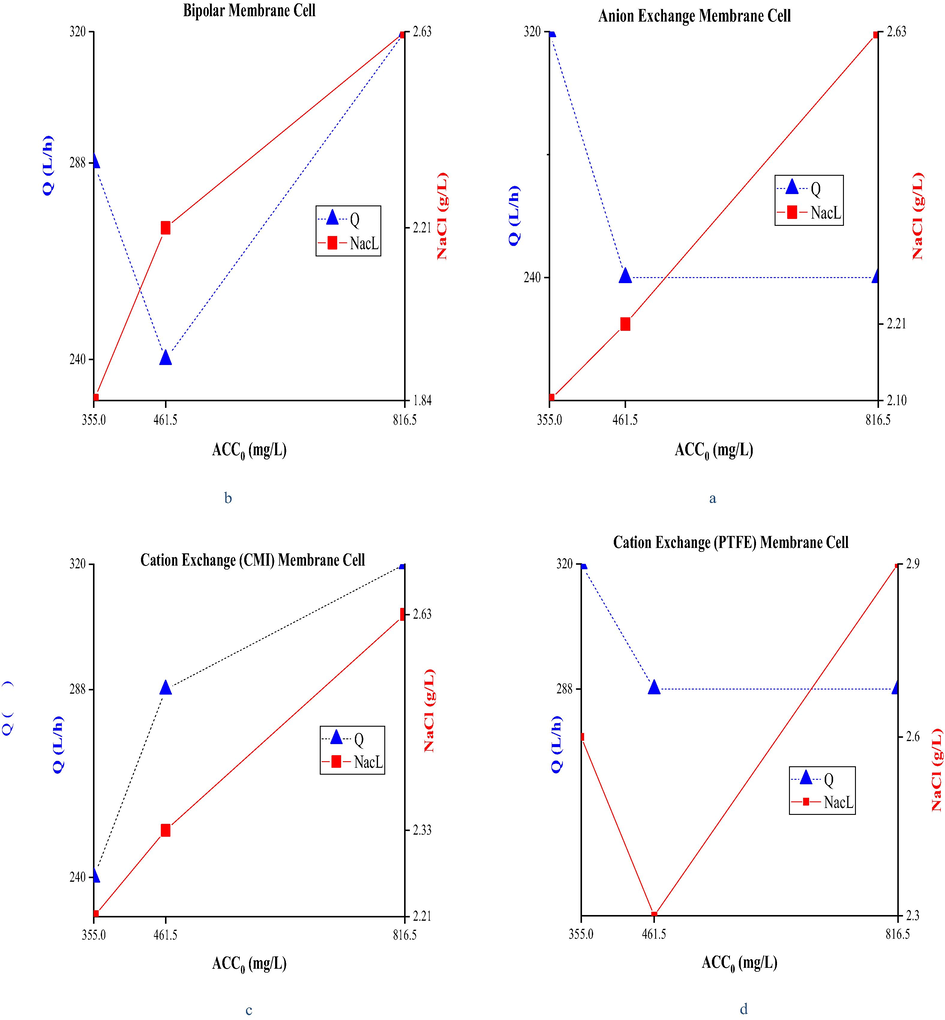
Relationship between Q (L/h) and NaCl concentration (g/L) for anolyte production with constant ACC0 using different membrane electrolysis cell.
Jalali et al. investigated the effect of operating parameters, such as current density and total flow, on the membrane electrolysis process efficiency using a commercial cation exchange membrane to produce Cl2(g). They found that the two parameters had the greatest effect on the cell voltage. However, the range of current density (1–4 kA/m2) in their study was very different from that of our experiments (2.67–12.67 kA/m2). The current density is affected by the electric current intensity (in amps) produced due to chemical reactions carried out at different cell voltages in the electrolysis medium, which can produce an anolyte solution with different properties. As mentioned earlier, the measured ACC of the anolyte can consist of chlorinated compounds in the forms of dissolved Cl2, HOCl, and OCl−. The higher the pH of the anolyte solution, the lower the presence of Cl as a soluble gas, and most of the anolyte ACC content will be in the forms of HOCl and OCl− ion. They reported that dissolved Cl2 content in the anolyte decreased with increasing the pH from 1 to 2.5, eventually reached zero, and, consequently, Cl2 content in the form of HOCl increased in the anolyte solution, and then this compound remained constant with further increase in pH (3–6). On the other hand, OCl− was present in solution only at a pH > 6, and then increased with rising pH (Jalali et al., 2009).
3.2 Changes in the quality of produced anolytes during the storage period
An advantage of the anolyte solution obtained from the membrane electrolysis cell to disinfection of drinking water is the feasibility of the storage. Therefore, the anolyte can be used in situations where on-site production is not possible for any reason. Thus, changes in the anolyte quality produced by the electrolysis cell were investigated with different operating conditions to suggest the best conditions for obtaining high-quality products and high durability during storage periods in the studied range. Total inlet flow rates and input salt concentrations were adjusted for all four sets (Table 2) to produce an anolyte from the anodic chamber with three identical ACC0 values (ACC1 = 816.5 mg/L, ACC2 = 461.5 mg/L, and ACC3 = 355.0 mg/L). The pH and ORP levels of freshly produced anolytes were measured and recorded for each set in all the three initial concentrations of the produced anolyte. A decrease in ACC and changes in the pH and ORP levels of the anolyte were examined over time during storage from the production up to 20 weeks (0, 2, 4, 6, 8, 10, 12, 14, 16, 18, and 20) for all the three initial concentrations of the anolyte (ACC1, ACC2, and ACC3) using all four types of membranes and the results were compared with each other. Total inlet flow rate, salt concentration, and current density required to produce the three concentrations of the target anolyte, as well as the storage period of the anolyte for each type of the membrane electrolysis cell, are summarized in Table 3.
Storage time (week)
Current density (kA/m2)
NaCl (g/L)
Q (L/h)
ACC0 (mg/L)
Membrane type
0-2-4-6-8-10-12-14-16
4.67
2.63
240
ACC1 = 816.5
Anion exchange
0-2-4-6-8-10-12-14-16
4.33
2.21
240
ACC2 = 461.5
0-2-4-6-8-10-12-14-16
2.67
2.10
320
ACC3 = 355.0
0-2-4-6-8-10-12-14
7.33
2.63
320
ACC1 = 816.5
Bipolar
0-2-4-6-8-10-12-14
7.67
2.21
240
ACC2 = 461.5
0-2-4-6-8-10-12-14
7.67
1.84
288
ACC3 = 355.0
0-2-4-6-8-10-12-14-16
7.33
2.63
320
ACC1 = 816.5
Cation exchange (CMI)
0-2-4-6-8-10-12-14-16
6.67
2.33
288
ACC2 = 461.5
0-2-4-6-8-10-12-14-16
6.33
2.21
240
ACC3 = 355.0
0-2-4-6-8-10-12-14-16-18-20
10.67
2.92
288
ACC1 = 816.5
Cation exchange (PTFE)
0-2-4-6-8-10-12-14-16-18-20
10.00
2.33
288
ACC2 = 461.5
0-2-4-6-8-10-12-14-16-18-20
8.33
2.63
320
ACC3 = 355.0
3.2.1 Reduction of anolyte ACC during the storage period
3.2.1.1 Membrane electrolysis cell with anion exchange membrane
ACC concentrations of the anolyte samples produced from the cell electrolysis with anion exchange membrane were measured immediately after the production, every 2 weeks, and up to 16 weeks of storage, along with measuring and recording the corresponding pH and ORP levels. The highest decrease in ACC of the anolyte produced from this cell belonged to ACC3, which decreased by 80% after 4 weeks and had the lowest durability during this storage period. Finally, the ACC of anolyte reached zero after 12 weeks. In this cell, the anolyte with ACC1 was associated with a decrease of 65.2% after 4 weeks, and ACC concentration reached 71.0 mg/L (equal to 91.3% reduction) after 12 weeks, and finally decreased to 100% after 16 weeks. A reduction of 61.5% occurred in ACC2 after 4 weeks, which reached ACC concentration of zero after 14 weeks (equal to 100% reduction). The reduction trend of ACC over time is shown in Fig. 3a. It can be argued that ACC generally had a lower decrease in the anolyte with very high concentration (ACC1) during the storage period. To explain this, in addition to the initial concentration of the anolyte, attention should be paid to the initial pH and ORP levels of the product, which somehow indicate the different composition of oxidant contents in the solution (Kim et al., 2000). Therefore, the trend of changes in pH and ORP levels was also examined here. The lower the ACC0 of the anolytes produced using the anion exchange membrane, the higher the measured pH value. In other words, ACC1 with the highest concentration had the lowest pH (with an initial pH of 2.65), and this more acidity in the initial solution resulted in a better quality during the storage period. As denoted in previous studies, a pH range of < 3 is ideal for the best performance of the anolyte, but anolytes with ACC2 and ACC3 had higher initial pHs (with initial pH values of 3.50 and 3.80, respectively); however, some studies reported the production of anolytes with a pH<4. Similarly, the initial ORP level of ACC1 anolyte was higher than the other ones, which was equal to 1096 mV, and values of 1048 and 1031 mV were measured for ACC2 and ACC3, respectively. In a review of the literature, an optimum range of ORP > 1000 mV in the anolyte is proposed for the best performance, and all ORP values were higher than this value in the present article (Jalali et al., 2009; Lim et al., 2019; Thorn et al., 2012). All the three ACC1, ACC2, and ACC3 anolytes produced from this cell had higher initial pHs and lower ORP levels than the other membrane electrolysis cells.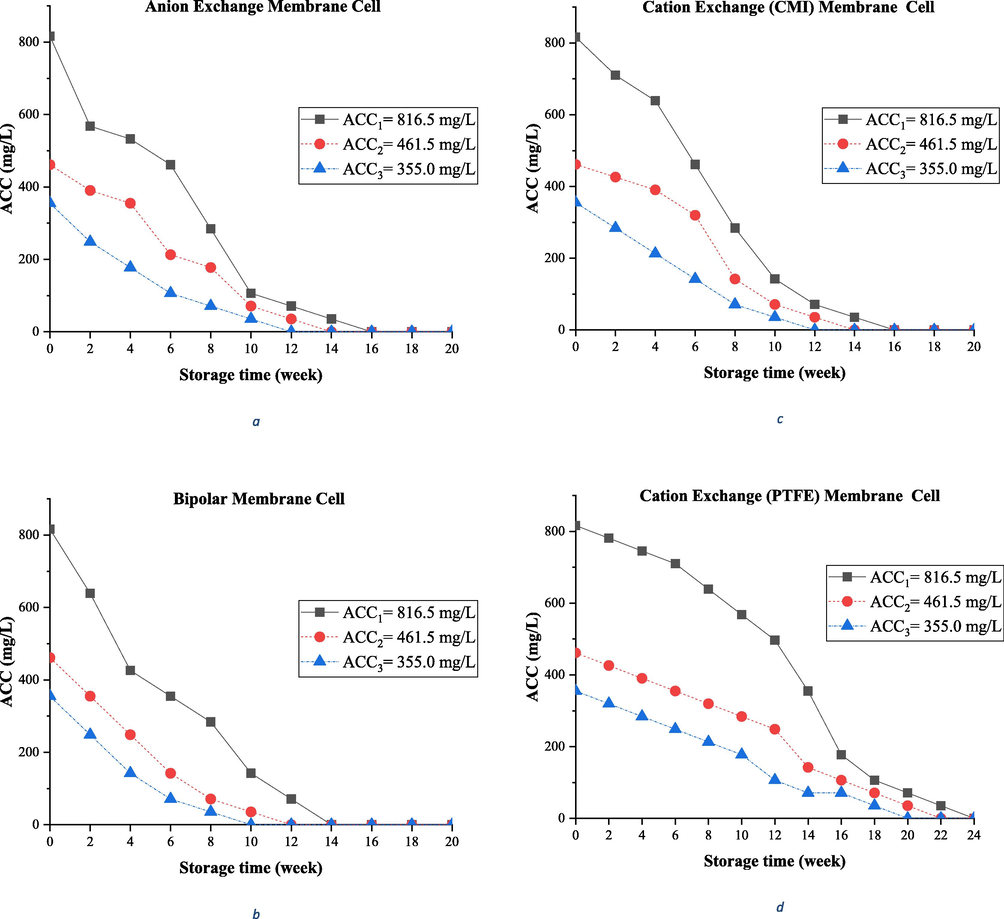
Changing ACC of Aanolyte during the storage time; Anolyets produced from different membrane electrolysis cells with constant ACC0.
3.2.1.2 Membrane electrolysis cell with cation exchange (CMI) membrane
Concentrations of ACC in the anolyte samples produced from the electrolysis cell with cation exchange (CMI) membrane were also measured immediately after the production and once every 2 weeks up to 16 weeks of storage, along with measuring and recording the corresponding pH and ORP levels. The greatest decrease in the ACC concentration of the anolyte produced from this cell was recorded in ACC3, which decreased by 40 and 90% after 4 and 10 weeks, respectively, and had the lowest durability during this storage period, so that the ACC concentration finally reached zero (100% reduction) after 12 weeks. In this cell, the anolyte with ACC1 was associated with a decrease of 21.7% after 4 weeks and reached ACC concentrations of 71.0 mg/L (equivalent to 91.3% reduction) and 0.0 mg/L after 12 and 16 weeks, respectively. ACC2 declined by 15.5 and 92.3% after 4 and 12 weeks, respectively, and then reached zero concentration after 14 weeks (equal to 100% reduction). The ACC reduction trend over time is shown in Fig. 3b. In this cell, ACC1 with the highest concentration had the least pH (with an initial pH of 2.52) and more acidity of the initial solution maintained a better quality during the storage period. On the other hand, anolytes with ACC2 and ACC3 had higher initial pHs (with initial pH values of 2.60 and 2.64, respectively). Subsequently, the initial ORP value (1107 mV) of ACC1 anolyte was higher than the other ones, and values of 1106 and 1103 mV were measured for ACC2 and ACC3, respectively.
3.2.1.3 Membrane electrolysis cell with bipolar membrane
ACC concentrations in anolyte samples produced from the electrolysis cell with bipolar membrane were also measured immediately after the production and every 2 weeks up to 14 weeks of storage, and the corresponding pH and ORP levels were measured and recorded simultaneously. The anolytes produced from this cell reached ACC0 after 14 weeks, and therefore the study of ACC reduction during the storage period was completed in less than 20 weeks. The ACC reduction trend over time is displayed in Fig. 3c. ACC3 showed maximum decrease in ACC of the anolyte produced from this cell, which decreased by 60 and 90% after 4 and 8 weeks, respectively, and had the lowest durability during this storage period, so that finally the ACC concentration reached zero (100% reduction) after 10 weeks. In this cell, the anolyte with ACC1 was associated with a decrease of 47.8% after 4 weeks and reached ACC concentrations of 35.5 mg/L (equal to 95.6% reduction) and 0.0 mg/L after 12 weeks and 14 months, respectively. ACC2 diminished by 46.2% after 4 weeks, and then reached zero after 12 weeks (equal to 100% reduction). All the three ACC1, ACC2, and ACC3 anolytes had greater pH and lower ORP values than the other membrane electrolysis cells. In this cell, ACC1 with the highest concentration had the least pH (with an initial pH of 3.03) and anolytes with ACC2 and ACC3 had higher initial pHs (with initial pH values of 3.16 and 3.32, respectively). The initial ORP value (1081 mV) of ACC1 anolyte was higher than the other ones, and values of 1106 and 1103 mV were measured for ACC2 and ACC3, respectively. An initial pH of > 3 in the anolytes caused a different trend of changes in pH and ORP values during the storage period, which is described in the next section.
3.2.1.4 Membrane electrolysis cell with cation exchange (PTFE) membrane
ACC concentrations in anolyte samples produced from the electrolysis cell with cation exchange (PTFE) membrane were also measured immediately after the production and once every 2 weeks up to 20 weeks of storage, along with measuring and recording the corresponding pH and ORP levels. The greatest decrease in ACC of the anolyte produced from this cell was observed in ACC3, which decreased by 20 and 70% after 4 and 12 weeks, respectively, and finally reached zero after 20 weeks (100% reduction). In this cell, the anolyte with ACC1 had the highest concentration durability and decreased only 8.7% and 39.1% after 4 and 12 weeks, respectively, reaching an ACC of 71.0 mg/L (equal to 91.3% reduction) after 20 weeks. The percentages of reduction in ACC2 were 15.4 and 46.2% after 4 and 12 weeks, respectively, which reached 35.5 mg/l (equal to 92.3% reduction) after 20 weeks. The ACC reduction trend over time is illustrated in Fig. 3d. All the three ACC1, ACC2, and ACC3 anolytes produced from this cell had lower initial pHs and higher ORP levels than the other membrane electrolysis cells. ACC1 had the lowest pH (with an initial pH of 1.48) and ACC2 and ACC3 anolytes had higher initial pH values (with initial pHs of 1.61 and 1.7, respectively); hence, their acidity was even lower than those mentioned in other studies (a pH range of 2–3). Similarly, the initial ORP value (1144 mV) of ACC1 anolyte was higher than the others, and measured values for ACC2 and ACC3 were equal to 1140 and 1138 mV, respectively. The very low initial pH of the anolytes caused a different trend of changes in pH and ORP levels during the storage period.
Recently, Deng et al. have investigated the effects of the type and composition of the electrode coating on the efficiency of the anolyte production process from a membrane electrolysis cell using an anion exchange membrane, and concluded that the ACC value was the most important factor in the disinfection activity of the anolyte solution. They used a current density (1 kA/m2) much lower than that of our study, and a 0.1% NaCl solution equal to 10 g/L wt% (a saline water concentration of 1.32–2.63 g/L was used here). Under these conditions, the ACC value of the produced anolytes was less than 200 mg/L (Deng et al., 2019). In the study by Savari et al., a composite cation exchange membrane was used to produce sodium hydroxide from the cathode chamber in the membrane electrolysis cell. They studied the effects of a very low current density (0.1–0.4 kA/m2) and a very high salt concentration (>10 times that of input salt in our study) on the process efficiency. Because their goal was to produce concentrated sodium hydroxide in the cathode side, the charged functional groups on the surface of the cation membrane allowed selective passage of sodium ions and reduced selective passage of Cl ions. Sodium ions passed through the membrane, flowed to the cathode, and produced NaOH by combining with hydroxyl ions; the main Cl production reaction occurred in the anode chamber, but no information was reported on the ACC amount of the produced anolyte (Savari et al., 2008). Ming et al. investigated the effect of cation or anion exchange membrane used in the electrolysis cell on the ACC level in the produced anolyte in a current density range (0.2–0.7 kA/m2) much lower than that of ours and a lower inlet saline water concentration (0.3–0.8 g/L). However, the initial ACC concentration range of the anolytes was relatively low (less than 200 mg/L). They believed that the material and type of electrodes were the most important factors in the production of anolytes, for which platinum, iridium, and ruthenium compounds were the best materials for the production of high-quality anolytes. They also believed that the type of applied membrane could further affect the pH, ORP, and ACC levels of produced anolytes. In their studies, the pH of the anolyte produced by the electrolysis cell with the anion membrane was always lower than the cation exchange membrane, with a higher ORP level as well. In the case of using a cation exchange membrane, the hydrogen ions produced in the anode side may pass through the membrane and move toward the cathode, leading to a slight increase in pH. The ACC of anolytes produced in the anode side is mainly in the form of HOCl, which cannot pass through the ion exchange membrane; therefore, the type of membrane has a slight effect on ACC of the anolyte (Ming et al., 2018). Nisola et al. examined the storage feasibility of an anolyte produced by membrane electrolysis of saturated water and NaCl solution with an initial ACC level of 173 mg/L, a pH of 2, and an ORP of 1217 mV. The concentration of saturated saline solution entering the cell was 6.15 mg/L, equivalent to 359 g/L, and no data were provided on the applied membrane type. They measured changes in ACC, pH, and ORP levels of the anolyte solution during 30 days of storage and attributed a decrease in ACC of the produced anolyte during the storage period to two mechanisms: evaporation of Cl2 and decomposition of hypochlorous acid (HOCl), with a higher rate of the former. Cl2 volatility is primarily affected by storage conditions. Therefore, the greatest reduction in ACC belongs to anolytes stored in open containers or those that are uncapped frequently during storage. A sharp decrease was observed in the ACC of anolytes stored in open containers and a 57% decrease was recorded in the ACC within 10 days. In the anolyte stored in closed containers, the reduction of ACC was 25% after 10 days (Nisola et al., 2011). Len et al. examined decreases in ACC, ORP, and pH levels of produced anolytes during storage periods. They used a commercial electrolysis cell and presented no data on the membrane type, a 0.1 wt% NaCl solution, a voltage of 7.4 V, and a current intensity of 14 amps. The pH, ORP, ACC levels of the anolyte were in the ranges of 2.5–2.6, 1020–1120 mV, and 53–56 mg/L, respectively. The value of ACC finally reached zero after 100 h of storage in open containers. With storage in closed containers in the presence of light, about 60% of ACC declined after 58 days, while it decreased by only 40% in the dark. Thus, the penetration of light into the sample storage container apparently leads to further decomposition of ACC. Changes in pH and ORP levels in the studied conditions were reported to be negligible and almost constant. The rate of decrease in ACC is highly dependent on the initial pH value, so that the rate of ACC decrease, in an initial pH range of 2.5–4, increased considerably with increasing pH. A higher pH means declined H+ concentrations, and an equilibrium reaction between Cl2 and HOCl proceeds to more production of HOCl, which is a non-volatile compound. Thus, the reduction of dissolved volatile Cl2 reduces its evaporation (Len et al., 2002). Our current study and the range of parameters studied here are very different from previous studies. The researchers studied for many purposes, and some information is not available on the full details of electrolysis cells, including the type of membrane, material, and coating of the electrodes. Therefore, to explain the results obtained and the observed trends, it could be better to consider all these differences.
3.2.2 Changes in pH and ORP levels of produced anolytes during the storage period
In addition to ACC, it is important to study changes in pH and ORP levels of the anolyte to examine changes in the quality of anolytes produced from the membrane electrolysis cell with different ion exchange membranes during the storage period. It is because the combination of these three parameters can be a good indicator of the percentage mixture of oxidants in an anolyte and the reason for its high disinfectant property, as important physicochemical factors of the anolyte solution (Cui et al., 2009; Deng et al., 2019; Rahman et al., 2016). The trend of changes in pH and ORP levels of the produced anolytes with ACC1, ACC2, and ACC3 using all four different membrane types is plotted in Figs. 4-7. According to the results, the electrolysis cells with anion and cation exchange (CMI) membranes had a similar trend of changes in pH and ORP levels (Fig. 4 and Fig. 5). For all the three ACC1, ACC2, and ACC3, the pH changed with a decreasing trend and, consequently, the ORP showed increasing changes during the storage period from the production up to 16 weeks when ACC concentration decreased about 100% in the anolytes; the lowest percentage of change was found in anolytes with very high initial concentrations (ACC1). Generally, the lower the pH of the anolyte, the higher the ORP value, which can have a higher disinfectant property depending on ACC levels. An increase in the pH and a decrease in ORP would be expected with the reduction of ACC in this period, as a decrease occurred in the disinfectant property of the anolyte with decreased ACC levels. This phenomenon is related to the presence of other oxidizing compounds in the anolyte solution and the type of membrane used in the electrolysis cell, which can separate different ions on both sides of anolyte and catholyte chambers. In previous studies, cation exchange membranes were generally proposed and used for better separation of Cl− in the anodic chamber side. Since anion exchange membranes work better in the separation of Na+ in the cathodic chamber side, they have not been considered in the production of anolytes with a high ACC. Under the operating conditions of this study, however, anolytes with all the three ACC1, ACC2, and ACC3 could be produced using anion exchange membranes, but they had the lowest durability compared with the use of the other membrane types. Accordingly, the use of these anolytes is more appropriate in the production site and will not have the necessary quality and effectiveness if stored for a long time.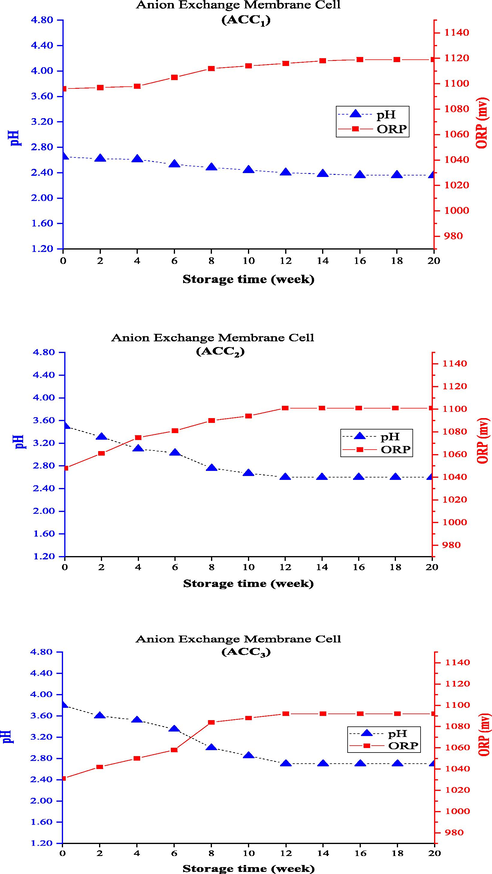
Changing pH and ORP of anolytes with constant ACC0 during the storage time (using anion exchange membrane electrolysis cell).
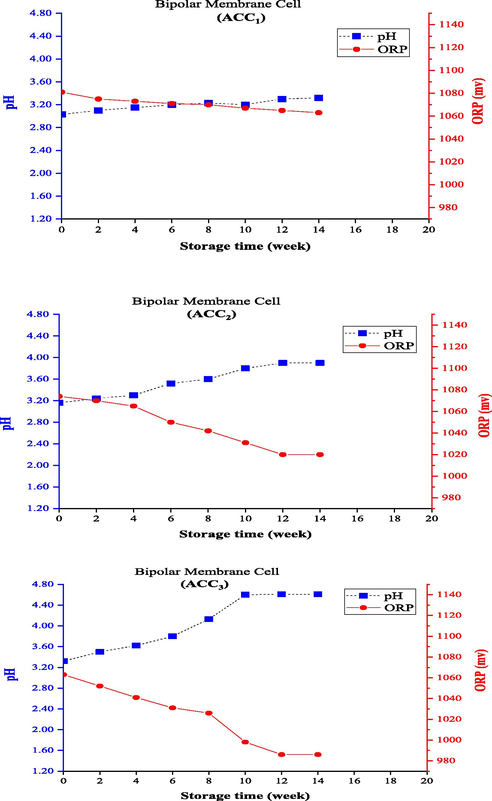
Changing pH and ORP of anolytes with constant ACC0 during the storage time (using bipolar membrane electrolysis cell).
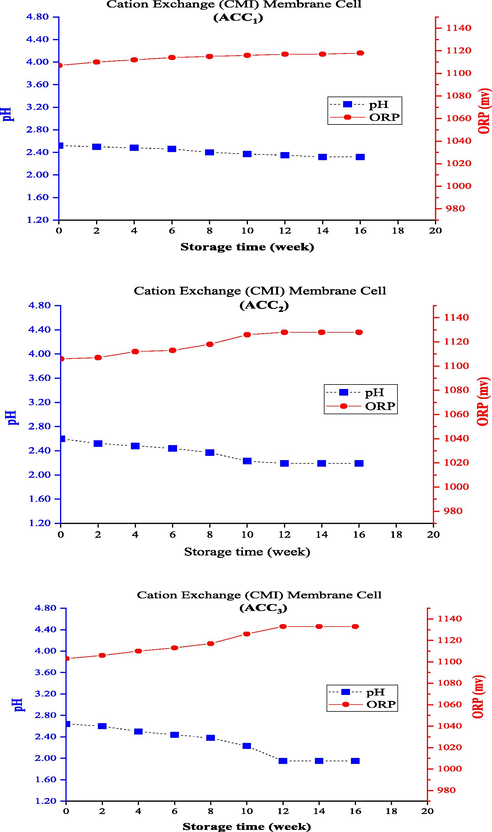
Changing pH and ORP of anolytes with constant ACC0 during the storage time (using cation exchange (CMI) membrane electrolysis cell).
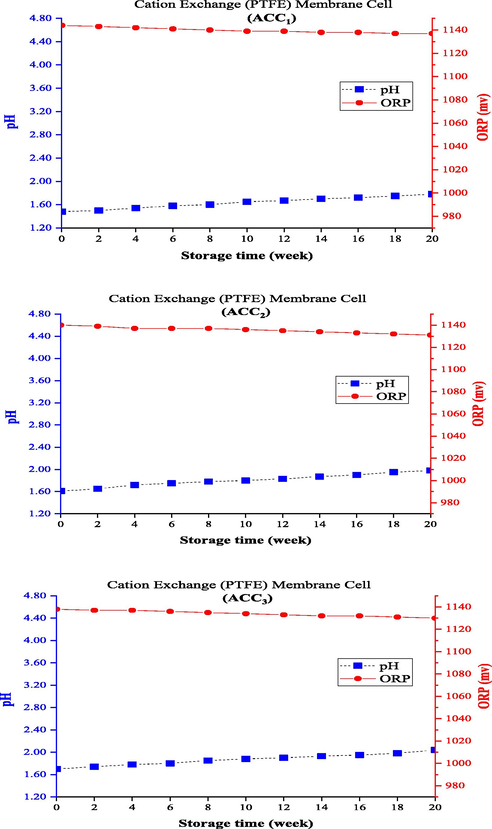
Changing pH and ORP of anolytes with constant ACC0 during the storage time (using cation exchange (PTFE) membrane electrolysis cell).
Figs. 6 and 7 depict the trend of changes in pH and ORP levels for the electrolysis cell using the bipolar and cation exchange (PTFE) membranes. An opposite trend of changes in the two electrolysis cells was reported earlier (electrolysis cells with anion exchange and cation exchange (CMI) membranes) so that the pH increased with decreasing AAC0 level and, subsequently, ORP decreased during storage. Since the three parameters of ACC, pH, and ORP are known and studied as the main indicators of anolyte quality, they have also been examined generally in other studies. The different formation processes should also be attributed to the type of membrane and the initial conditions of produced anolytes (i.e., pH and ORP of the freshly produced anolytes). The bipolar membrane consists of two layers of ion exchange membranes, one of which is permeable only to anions and the other to cations. To produce chlorine in the chlorine-alkali (chloralkali) industry, water penetrates the contact area of the bipolar membrane and separates into OH– and H+ ions; the produced positive and negative ions travel to the cathode and anode sides, respectively, through the cationic layer or the anionic layer of the bipolar membrane (Ghyselbrecht et al., 2014). The use of bipolar membranes in this system under similar operating conditions produced anolytes with a higher initial pH (>3) than the other ones, which had better durability (about 23% longer) than the anionic membrane in the first 4 weeks. However, the anolyte reached a concentration of about zero after 12 weeks (and following 14 weeks for the anionic membrane). The cation exchange (PTFE) membrane used in the membrane electrolysis cell prevents the migration of chloride ions from the anode to the cathode, which is reinforced with PTFE fibers to boost the mechanical strength of the membrane. This membrane should be completely stable due to exposure to Cl2 and NaOH solution in the anode and the cathode sides, respectively (Lalia et al., 2015). Membrane selectivity plays an important role in the permeability of positively charged ions (Na+) and impermeability of negatively charged ions (Cl-). Hence, a membrane with high permeability and selectivity should be used to have a high chlorine production capacity in the membrane electrolysis method (Tanaka, 2003). The use of cation exchange (PTFE) membrane produced anolytes with a lower initial pH (<2) than the others, had the longest durability during storage, and needed more than 20 weeks to reach the ACC0. This can also explain its high quality and a higher disinfectant property than the other membranes.
An anolyte with a pH of < 3 was produced by Nisola et al. and it was assumed that there was no OCl− in the anolyte. The measured ACC was equal to the sum of dissolved Cl2 and HOCl, and the ratio of these two depended on pH and Cl− ion. At a pH < 4.1, the value of Cl2 was predominant and HOCl became the main component above this pH value. A sharp decrease in the ACC of anolytes stored in open containers was associated with a high increase in pH and a decrease in ORP. The increased pH (from 2 to about 6) resulted from the conversion of HCl to Cl2. The volatile nature of Cl2 and the placement of anolyte in the open medium easily led to the release of Cl2 into the surrounding environment and an increase in pH. Both the decrease in ACC and the increase in pH (from 2.00 to 3.01) were lower in the anolytes stored in closed containers. In such a low pH, the decomposition of HOCl and the production of HCl lead to an increase in pH and a decrease in ORP, affected by a decrease in ACC because the acidity directly affects ORP levels (Nisola et al., 2011).
In a membrane electrolysis process of NaCl, Liao et al. investigated the Nernst equation and the relationships between ORP, HOCl, and Cl, and the pH of an anolyte produced using a commercial membrane electrolysis cell with cation membrane, a current density of about 4 kA/m2, and a salt concentration of about 0.2 wt%. The pH, ORP, and free Cl concentration were reported as 2.5, 1150 mV, and 60 mg/L, respectively, for the produced anolyte. HOCl is produced at the anode side by starting the electrolysis of the saline solution. According to the Nernst equation, ORP levels in the anolyte can be explained by the gradually increased level of dissolved ORP with increasing levels of the produced HOCl. As long as chlorine concentration is saturated in the solution, the concentration of HOCl reaches its maximum, leading to maximum ORP level. If HOCl is the predominant species relative to Cl, the ORP level decreases slightly, and when the concentration of HOCl reaches its maximum due to spontaneous decomposition, the ORP level remains unchanged. The ORP level gradually decreases when HOCl is unstable (easily ionized and degraded). However, it should be noted that changes in ORP and pH during storage were not examined in their study, but it was noted that decreased ORP levels of stored anolytes over time were reported in several studies (Liao et al., 2007).
4 Conclusion
This study aimed to use different ion exchange membranes (two types of cation exchange membranes, an anion exchange membrane, and a bipolar membrane) by changing the operational parameters affecting the process (saline water concentrations and total inlet flow) to achieve optimal production conditions of anolytes with high disinfectant power. Therefore, changes in the quality of produced anolytes were evaluated with different initial ACC0 (very high, high, and medium concentrations) during a long storage period (from the production up to 20 weeks) under storage in normal light conditions and ambient temperature. Anolytes were produced from the anodic chamber with determined ACC0 based on operating conditions and types of applied membranes by changing total inlet flow rate (240–320 L/h) and saline solution concentrations (1.65–3.50 g/L) for all four types of membranes. The ACC0 value was selected such that anolytes could be produced using all four types of membranes in the range of very high (ACC1), high (ACC2), and medium (ACC3) available chlorine content concentrations which is comparable to previous studies. The pH and ORP values of the freshly produced anolytes were 1.48–3.80 and 1031–1144 mV, respectively, in the whole experiments. Reductions in ACC values and the trend of changes in pH and ORP of the anolytes were examined during the storage period.
In general, the highest stability and durability of ACC in anolytes were observed for products of the cell with cation exchange (PTFE) membrane. After 4 weeks, ACC decreased by less than 20% in the anolytes with all three ACC0, and up to 20 weeks of storage period was required to reach about 90% reduction. The cation exchange (CMI) membrane was in the second place, in which all the three ACC0 decreased by < 40% and then about 90% after 4 and 12 weeks of storage, respectively. The bipolar membrane was in third place in terms of ACC durability in anolytes during storage, which decreased by about 60% in 4 weeks. The anion exchange membrane cell had the lowest ACC durability, which decreased by about 80% in the first 4 weeks of storage. Additionally, the trend of changes in pH and ORP of the anolytes during storage was different for each cell and depended on the initial pH and ORP values of the anolyte at the time of production, as well as the type of membrane used in the membrane electrolysis cell.
Acknowledgments
The authors would like to acknowledge financial support from the SorenAb Company of Iran (www.sorenab.com).
Declaration of Competing Interest
The authors declare that they have no known competing financial interests or personal relationships that could have appeared to influence the work reported in this paper.
References
- The antimicrobial mechanism of electrochemically activated water against Pseudomonas aeruginosa and Escherichia coli as determined by SDS-PAGE analysis. J. Appl. Microbiol.. 2009;107:379-384.
- [CrossRef] [Google Scholar]
- Physicochemical properties and bactericidal efficiency of neutral and acidic electrolyzed water under different storage conditions. J. Food Eng.. 2009;91:582-586.
- [CrossRef] [Google Scholar]
- Preparation of electrolyzed oxidizing water by TiO2 doped IrO2-Ta2O5 electrode with high selectivity and stability for chlorine evolution. J. Electroanal. Chem.. 2019;832:459-466.
- [CrossRef] [Google Scholar]
- Electron microscopic investigation of the bactericidal action of electrochemical disinfection in comparison with chlorination, ozonation and Fenton reaction. Process Biochem.. 2004;39:1421-1426.
- [CrossRef] [Google Scholar]
- Evaluation and Application of a Mixed Oxidant Disinfection System for Waterborne Disease Prevention. University of North Carolina; 1997.
- Desalination feasibility study of an industrial NaCl stream by bipolar membrane electrodialysis. J. Environ. Manage.. 2014;140:69-75.
- [CrossRef] [Google Scholar]
- Effects of storage conditions on chemical and physical properties of electrolyzed oxidizing water. J. Food Eng.. 2004;65:465-471.
- [CrossRef] [Google Scholar]
- Effects of flow rate, temperature and salt concentration on chemical and physical properties of electrolyzed oxidizing water. J. Food Eng.. 2005;66:171-176.
- [Google Scholar]
- Electrochemical disinfection of toilet wastewater using wastewater electrolysis cell. Water Res.. 2016;92:164-172.
- [CrossRef] [Google Scholar]
- Application of electrolyzed water in the food industry. Food Control 2008
- [CrossRef] [Google Scholar]
- Effects of process conditions on cell voltage, current efficiency and voltage balance of a chlor-alkali membrane cell. DES. 2009;237:126-139.
- [CrossRef] [Google Scholar]
- The effect of electrode material on the generation of oxidants and microbial inactivation in the electrochemical disinfection processes. Water Res.. 2009;43:895-901.
- [CrossRef] [Google Scholar]
- Evaluation of phenol removal from aqueous solutions by UV, RO, and UV/RO hybrid systems. Desalin. Water Treat.. 2015;54:1612-1620.
- [CrossRef] [Google Scholar]
- Roles of Oxidation–Reduction Potential in Electrolyzed Oxidizing and Chemically Modified Water for the Inactivation of Food-Related. Pathogens. 2000;63:19-24.
- [CrossRef] [Google Scholar]
- Electrochemical Water Disinfection : A Short Review. Platin. Met. Rev.. 2008;52:177-185.
- [CrossRef] [Google Scholar]
- Electrically conductive membranes based on carbon nanostructures for self-cleaning of biofouling. DES. 2015;360:8-12.
- [CrossRef] [Google Scholar]
- Effects of storage conditions and pH on chlorine loss in electrolyzed oxidizing (EO) water. J. Agric. Food Chem.. 2002;50:209-212.
- [CrossRef] [Google Scholar]
- Li, L., Kim, D., 2015. Efficient generation of mixed oxidant disinfectants : parametric study on electrode materials and operating conditions 1179–1186. https://doi.org/10.2166/ws.2015.076.
- The generation and inactivation mechanism of oxidation-reduction potential of electrolyzed oxidizing water. J. Food Eng.. 2007;78:1326-1332.
- [CrossRef] [Google Scholar]
- Lim, A., Kim, H. juhn, Henkensmeier, D., Jong Yoo, S., Young Kim, J., Young Lee, S., Sung, Y.E., Jang, J.H., Park, H.S., 2019. A study on electrode fabrication and operation variables affecting the performance of anion exchange membrane water electrolysis. J. Ind. Eng. Chem. 76, 410–418. https://doi.org/10.1016/j.jiec.2019.04.007.
- Effect of electrode material and electrolysis process on the preparation of electrolyzed oxidizing water. New J. Chem.. 2018;42:12143-12151.
- [CrossRef] [Google Scholar]
- Phenol removal from industrial wastewaters : a short review. Desalin. Water Treat.. 2015;53:2215-2234.
- [CrossRef] [Google Scholar]
- Electrochimica Acta On the electrolysis of dilute chloride solutions: Influence of the electrode material on Faradaic efficiency for active chlorine, chlorate and perchlorate. Electrochim. Acta. 2012;80:282-291.
- [CrossRef] [Google Scholar]
- Disinfection performances of stored acidic and neutral electrolyzed waters generated from brine solution. J. Environ. Sci. Heal. Part A. 2011;46:263-270.
- [CrossRef] [Google Scholar]
- Electrolyzed Water as a Novel Sanitizer in the Food Industry: Current Trends and Future Perspectives. Compr. Rev. Food Sci. Food Saf.. 2016;15:471-490.
- [CrossRef] [Google Scholar]
- Rice, E.W., Baird, R.B., Eaton, A.D., Clesceri, L., 2012. Standard Methods for the Examination of Water and Wastewater 22nd Edition, 4500-Cl CHLORINE (RESIDUAL), C. Iodometric Method II, APHA, AWWA, WEF.
- The effect of long-term storage on the physiochemical and bactericidal properties of electrochemically activated solutions. Int. J. Mol. Sci.. 2013;14:457-469.
- [CrossRef] [Google Scholar]
- Electrolysis of sodium chloride using composite poly (styrene-co-divinylbenzene) cation exchange membranes. J. Memb. Sci.. 2008;310:246-261.
- [CrossRef] [Google Scholar]
- Mass transport and energy consumption in ion-exchange membrane electrodialysis of seawater. J. Memb. Sci.. 2003;215:265-279.
- [CrossRef] [Google Scholar]
- Electrochemically activated solutions: evidence for antimicrobial efficacy and applications in healthcare environments. Eur J Clin Microbiol Infect Dis. 2012;641–653
- [CrossRef] [Google Scholar]
- Application of Nano-Electrode Platinum (Pt) and Nano-Wire Titanium (Ti) for Increasing Electrical Energy Generation in Microbial Fuel Cells of Synthetic Wastewater with Carbon Source (Acetate) Int. J. Environ. Res.. 2014;8:453-460.
- [CrossRef] [Google Scholar]
- Effects of Sn content on Ti /RuO2– SnO2– TiO2 anodes used in the generation of electrolyzed oxidizing water. J. Electroanal. Chem.. 2012;677–680:133-138.
- [CrossRef] [Google Scholar]


