

Translate this page into:
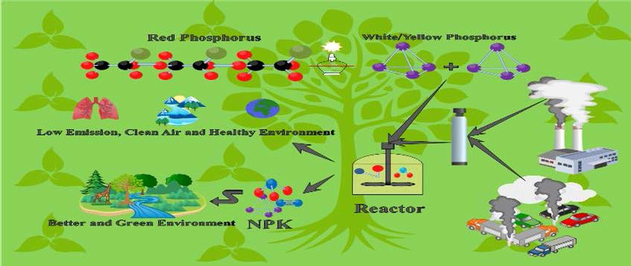
Production of the complete fertilizer with simultaneously removing sulfur oxides and nitrogen oxides using yellow phosphorus
⁎Address: College of Environmental Science and Engineering, DongHua University, Shanghai, China (M.A.M. Alzaky). montaserabduallah@hotmail.com (Montaser Abduallah Mohammed Alzaky),
-
Received: ,
Accepted: ,
This article was originally published by Elsevier and was migrated to Scientific Scholar after the change of Publisher.
Abstract
Abstract
Flue gases proved to have several human and environmental problems. Although they are many, SOX and NOX are the most famous, due to their direct human, animal, and plant effect. Thus, their removal represents one of the main concerns worldwide. Whereas there are several available techniques for this task, herein we applied a unique method through the white/yellow phosphorus (P4). Our target was to achieve the simultaneous removal together with obtaining the complete fertilizer Nitrogen, Phosphorus, Potassium (NPK). The removal efficiency investigated with and without the ozone, SOX and NOX removal reach 100% at a faster time with the ozone existence. Also, examining the optimal P4 weight that was 0.5 g, furthermore, the optimum stirring intensity proves to be 1083 rpm, additionally, the optimum temperature was 55 °C, finally, it was compared with the most famous absorbers. The system efficiency was tested in a special experiment, furthermore, the reaction mechanism was identified together with testing the solid precipitate using Raman spectroscopy and X-Ray Diffraction (XRD).
Keywords
NPK
SO2 Removal
NO Removal
Flue Gas
White/Yellow phosphorus

1 Introduction
Recently, fossil fuel combustion had increased severely in different aspects, which represent the main SOX and NOX emissions source, typically, the fossil fuel plants are responsible for 87% of the SOX emissions, and 67% of the NOX emissions. They are gaining increasing attention because they can be suspended in the atmosphere, therefore, causing several problems, such as acid rains, fog, photochemical smog, and several human respiratory problems (Hsu et al., 2007; Joseph Alcamo, 1987; Bernard, 2001).
Normally, SOX removed using Flue Gas Desulfurization (FGD) techniques, which apply limestone to neutralize SOX to sulfur compounds and produce gypsum as a byproduct. On the other hand, for NOX the FGD isn’t effective, rather the Selective Catalytic Reduction (SCR) is applied for it. Traditionally, the simultaneous removal for both of them, obtained through installing FGD and SCR units in series, but recently the research is directed toward one unit that does the simultaneous removal. As SO2 represents 95% to 98% of SOX and NO represents 90% to 95% of NOX, usually, SO2 and NO refer to SOX and NOX respectively. Generally, the fossil fuel burning is through the air as O2 carriers, but it also means 79% of the air which is N2 will emerge out as a byproduct, therefore, NOX always the biggest amount and the main burden. Moreover, the majority of the techniques are using water, consequently, solubility is an important factor. Herein, as SO2 is soluble, NO isn’t and needs to be oxidized then absorbed later. This can be achieved in several ways, such as oxidants (H2O2, O3, KMnO4, etc.), Iron Ⅱ chelates, or other oxidation methods. Although there are numerous techniques available for the simultaneous removal, the widest is the Wet Oxidation Absorption WOA, in which the NO is oxidized then absorbed at the same time with SO2 (Liu and Chang, 1991; Shuai Li, 2018).
Yellow phosphorus is one of the promising elements for SOX and NOX simultaneous removal, which has the ability to generate ozone that can oxidize NO, hence get rid of the oxidants and their cost. Moreover, it offers excellent SOX abatement (Hsu et al., 2007). While for all of the previous work it was difficult to obtained high NOX removal efficiency, as it's for SOX, thus, extra attention has been directed to NOX. Nonetheless, there are several applicable absorbers, meanwhile, they represent one of the main elements in the reactor, and will directly be derived in the final byproducts (Choi, 2014; Mumford et al., 2012; Wei et al., 2012). Herein we applied a potassium source absorber that was KCl. Practically, the potassium content measured as K2O and/or K content for that element, KCl is one of the highest among several candidates, such as MOP Potash, SOP Potash, KNO3, etc., where KCl has 60–62.5 K2O, and 49.8–51.9 K (GC Mgbeze, 2010; Hussain, 2015).
The whole previous work was only speaking about removing SOX and NOX, due to their harmful effects while spending a lot of money on it. We’ve put the cornerstone in opening a new direction of changing them into other useful products. Which were the complete fertilizer Nitrogen N Phosphorus P Potassium K (NPK), which was our main target to obtain from those toxic gases abatement. Furthermore, all the useful byproducts are sellable. While keep in mind using available and cheap equipment, to diminish the need for a giant fund to remove those gases, while getting benefits from the byproducts.
2 Material and methods
2.1 Materials
2.1.1 Chemical
Red phosphorus (purity of >99%), KCl (purity of >99%), deionize water, silica gel, cotton, H2SO3 (purity of >99%), SO2, and NO gases (purity of >99%).
2.1.2 Tools
2.1.2.1 Yellow Phosphorus preparation
Alcohol burner, ring stand, test tubes and caps, clamp, water heater, bucket.
2.1.2.2 Gas testing
Gas analyzer, model Seitron C600, designed by Seitron Co., Italy. pH meter, model PHS-3E, designed by Shanghai INESA Scientific Instrument Co., Ltd., China. Deionized water. Stirrer. Buchner flask, model, SHUNU, GG-17, 1000 Ml, designed by Hangzhou Beibang Technology Co., Ltd. Digital heater magnetic stirrer mixer, model DF-101S, designed by Shanghai Yingdi Instrument Equipment Co., Ltd. O3 generator. Two Ion Chromatography (I.C.) devices, model Thermo Scientific Dionex Aquion IC system and model Dionex DX-600, Designed by Thermo Fisher Scientific, USA, and Thermo Fisher Scientific, USA. X-ray diffractometer (XRD), model Rigaku, D / Max-2550 PC. Designed by, Rigaku, Tokyo Japan. RAMAN spectroscopy device. Modele inVia-Reflex, Designed by RENISHAW U.S.A.
2.2 Methods
2.2.1 White/Yellow phosphorus preparation method
Balance 1–5 g of the red phosphorus depending on the test tube specification, avoid the huge amount as the accumulated gas will increase the pressure and make it explodes, seal the test tube very good because white phosphorus will react with the oxygen, heat the test tube while it slides down in the horizontal axis (minus 10–30°), to force the gas to flow down and not to accumulate at the same place of the red phosphorus. At the same time cool down the gas side of the test tube with cooling water, avoid splashing the water on the hot side because it will make the test tube explode. After ensuring all the red phosphorus converted to white phosphorus, carefully heat all the test tube for a few seconds to liquefied all the white phosphorus (not important), transfer it to a hot water pool, and if necessary break the test tube. Cool down the water to solidify the White/Yellow phosphorus. Weigh the sample, typically the yield is 80–95%.
2.2.2 Gas removal process
The simultaneous removal of SOX and NOX was done for a bench-scale experiment. In the typical experiment we used 2900 ppm SO2, and 550 ppm NO, they were bubbled in a 1L Buchner flask contains 1L deionize water, 30 g KCl, and 0.5 g yellow phosphorus (P4). While the operating temperature was 55 °C, with vigorous stirring. The dust and moisture removal part contains cotton wools and silica gel respectively. Furthermore, the gas was measured continuously using the gas analyzer, while the pH and temperature were measured contentiously. A CFT-5G Ozone generator was used once for comparing the system efficiency with and without O3. Whereas the solid content has been filtered and tested using RAMAN spectroscopy and XRD. On the other hand, the liquid was tested for the anions using the Thermo Scientific Dionex Aquion Ion Chromatography system uses 30 mM NaOH eluent, and for the cation using Dionex DX-600 uses 5 mM Methane sulfonic acid as eluent.
Further attention was given to NOX, consequently, we also studied NOX removal in bench-scale using 1L Buchner flask, 1L deionize water, 550 ppm NO, 0.5 g yellow phosphorus (P4), and 30 g KCl, while stirring magnetically and heating to 55 °C. In the meantime, the exhaust gas was measured using the gas analyzer, while the pH meter and the thermometer were for measuring the pH and temperature respectively. Additionally, the final P4 ions and NO2–/NO3– were tested using a Dionex Aquion Ion Chromatography system.
Lastly, the reaction stoichiometry and effectiveness for NO and SO2 removal were tested in a closed system. Typically, 1L three necks round bottom flask have been evacuated. Firstly, filled with NO. Secondly, with NO and H2SO3 as SO2 carrier. Using 900 ml deionized water, 0.21 g P4, 2 g KCl, the reaction stirred magnetically and carried out at 55 °C. The reaction tested regularly for 5 h using Ion Chromatography (see Fig. 1).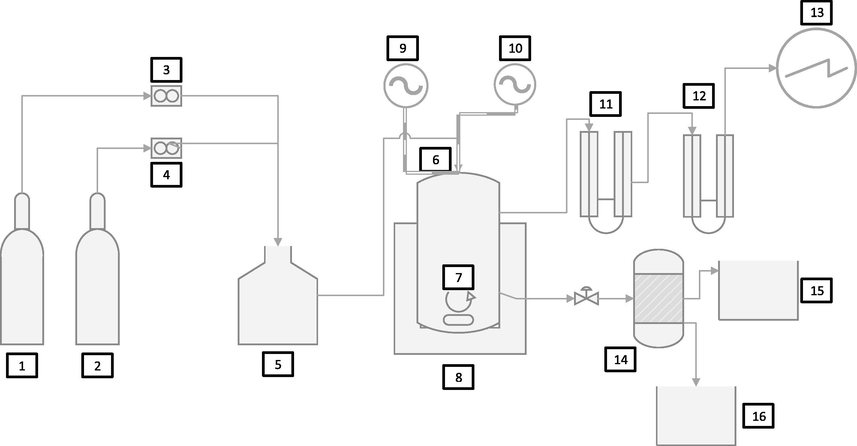
Detailed experimental sections were; 1. SO2, 2. NO, 3&4 Flowmeters, 5. Gas mixing tank, 6. Oxidation absorption reactor, 7. Stirrer, 8. Heating and stirring device, 9. pH meter, 10. Thermometer, 11. Silica gel in U tube, 12. Cotton in U tube, 13. Gas analyzer, 14. Separator, 15. Acids tank, 16. NPK elements.
The removal efficiency for each of SOX and NOX was calculated as
X = The process removal efficiency
X = The process removal efficiency (Cheng, 2018; Liu and Chang, 1991; Liu and Chang, 1990).
3 Results and discussions
3.1 SOX and NOX simultaneously removal with and without O3:
The simultaneous removal achieved using the conditions in Section 2.2.2 for the simultaneous removal, where the phosphorus slurry (P4) actively oxidizes NO into one of the soluble forms NXOY, which can be absorbed together with SO2. To do so we applied KCl as an absorber, whereas P4 has a low reaction rate with SO2 (Liu and Chang, 1991; Chang, 1992) the absorber can do so and neutralize it. Furthermore, the oxygen is an important factor for the removal, because it will be converted to ozone when reacts with the phosphorus emulsion as in Eqs. (5)–(7) below. Besides, it will oxidize NO into one of the more soluble forms such as NO2 or generally NXOY. Meanwhile, we’ve tested the ozone O3 effects on the removal process using an external ozone source, from Fig. 2 using the ozone we directly got 100% SOX removal, and after 2 h for NOX removal. Meantime, without the ozone existence, we can get it after 3 h. Thus, O3 didn’t have a huge difference, therefore, it will be an energy waste and will represent extra expenses (Liu and Chang, 1991).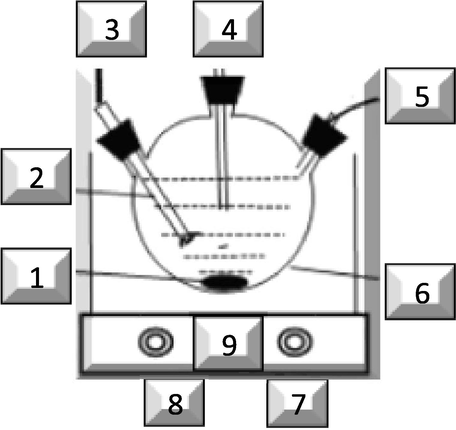
Detailed close system experimental sections were; 1. Stirrer, 2. Solution emulsion, 3. Sample taking tube, 4. pH meter, 5. Thermometer, 6. 1L three necks round bottom flask as a reactor, 7. Reaction Temperature Controller, 8. Reaction Stirring Controller, 9. Heating and stirring device.
In addition, a white fume formed, that depends on the oxygen content. It can damage the gas analyzer if didn't remove (Shuai Li, 2018). Thus we used the gas tail removing system for it, which contains silica gel and cotton wool. This fume resulted from the P4 incomplete oxidation, it will decrease as the oxygen, the pH decline, and/or the ozone O3 concentration increase, consistent with P4 conversion to P4O6 or the more oxidized state of P4O10, then absorb the moisture to form H2PO2, H2PO3, and H2PO4 (Li et al., 2018).
Finally, about the NPK production claims, as we already have NO2–/NO3– they will spontaneously convert to NH4+ as the pH goes down, the medium is phosphorus which contains all the required phosphorus ions, and KCl has high potassium content, and will appear in the final products, that is clearly proving the production. Furthermore, all the Nitrogen N, Phosphorus P, and potassium K elements (NPK) fertilizer have been proved through the specified tests, either for the liquid ions, or for the solid precipitate, nonetheless, also their amount was identified. On the other hand, SOX’s existence will end up as K2SO4, which is also a rich potassium source. Furthermore, the extra produced acids are separated in a different tank, and the final NPK elements are extracted alone as final products in a different container (Jason C. Willett, 2004; Production and Use of Potassium, 1998).
Usually, the sulfur’s emissions are treated either pre-combustion or by applying low sulfur emission compounds, which lead to minimizing the sulfur emissions, besides for SOX removal it’s easier to reach 100%, which makes the sulfur becomes a minor problem. On the other hand, for the Nitrogen Oxides NOX has low solubility and high availability, thus, further tests were done focusing on NOX removal investigation, and study the process feasibility under certain considerations.
3.2 Oxygen change with time:
For the previous P4 studies they applied an increasing O2 concentration of 4% to 20% that results in increasing NOX removal efficiency, meanwhile, the white fume becomes lighter with the increase as the phosphorus reach the complete oxidation (Shih-Ger Chang, 1992; ShihGer Chang, 1994; Shuai Li, 2018). But none of them studied the practical oxygen consumption within the removal efficiency. Fig. 3 shows the oxygen change as the reaction goes with time, it was clear the oxygen is consuming as the reaction continues. The main factors affecting the oxygen are, the temperature, stirring, P4 concentration, and the dispersion medium (Khoo, 2006). Whereas the oxygen consumed to produce the ozone (O3), consequently, those factors will also affect the amount of the produced ozone production. Furthermore, the oxygen O2 will be consumed to oxidize NO, and P4, therefore, reduce the oxygen amount in the reactors. Moreover, K reacts with O2 to produce potassium oxide K2O, which is the main potassium source as fertilizer. While comparing SO2 and NO simultaneous removal with only NO removal reveal that more oxygen is being consumed, resulting from the extra oxygen consumed to oxidize SO2 to SO32− and SO42− as in Eqs. (20) and (21) or assist in converting it to H2SO4 (Li et al., 2014; Li et al., 2018) (see Fig. 4).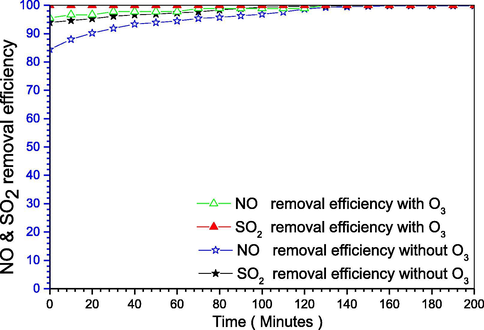
SOX and NOX simultaneous removal with and without ozone.
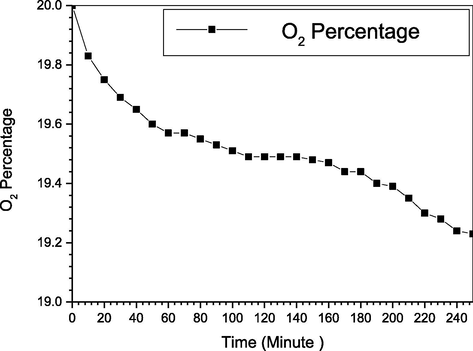
Oxygen change for NOX removal.
3.3 Yellow phosphorus weight change effects
Likewise, in the literature it was reported from 0.25%w up to 3.5%w (Liu and Chang, 1991; Shih-Ger Chang, 1992; ShihGer Chang, 1994), accordingly was for small scale, herein we did for higher concentration. In a typical experiment, we add 0.125 g, 0.250 g, and 0.5 g of yellow phosphorus and 550 ppm NO in Buchner flask, contains 1L deionized water and 30 g of KCl, at 55OC for 200 min, and 25 degrees at the stirring scale which is 1080 rpm (each scale is 43.33). After NO bubbled into the reactor a white mist formed, which is phosphoric acid that becomes denser as the stirring and temperature change. Additionally, it can be controlled by changing the pH and/or O2 content of the reactor, meanwhile, only 10% to 15% can instantly be absorbed by the emulsion, and the remaining can be absorb using 40% to 60% concentrated phosphoric acid (Chang, 1992; Shih-Ger Chang, 1992; ShihGer Chang, 1994). Whereas for the specified case P4 concentration consumed with time, thus NOX removal efficiency. Nonetheless, the P4 utilization rate is expressed using the P/N ratio as described below. From Fig. 5, it was clear as the P4 weight increase NOX removal efficiency will increase, this increase stated to the ozone generated due to the P4 weight increase, then more NO is oxidized to NO2 and become easier to absorb by the medium. Furthermore, increasing the P4 weight, not only will increase the O3 generation rate but will also guarantee a better mixing between P4 and the NOX, therefore, better removal efficiency (Liu and Chang, 1991; Pham & Chang, 1994).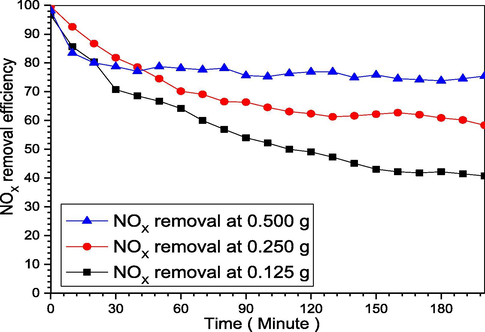
Yellow phosphorus weight change effects on NOX removal efficiency.
3.4 Changing the emulsion stirring intensity effects
It was reported for a low impeller speed of 100 to 500 rpm, where the removal efficiency increased with the stirring increase, furthermore, increasing NO concentration for the same stirring intensity increases NO removal efficiency from 500 to 800 ppm (Hsu et al., 2007; Chang, 1992; Shuai Li, 2018). Herein, as it was for smaller intensity, we used higher intensity. Typically, we used 15, 25, and 35 degrees on the scale of the device (each degree on the scale equal to 43.33 rpm) which is equal to 650, 1083, and 1517 rpm. With 1L deionized water, 30g KCl, 0.5 g P4, and 55 °C for 6.7 hrs. From Fig. 6, as the stirring intensity increase the removal efficiency increase, because, increasing the stirring intensity will raise the yellow phosphorus emulsion dispersion, additionally, it will increase the gas–liquid transfer rate, moreover, will increase the oxygen dispersion and holdup within the contact surface (Khoo, 2006). Meanwhile, the decrease stated to the increased interfacial area, thus, decreases the mass transfer resistance, besides the P4 consumption (Hsu et al., 2007; Chang, 1992; Shuai Li, 2018).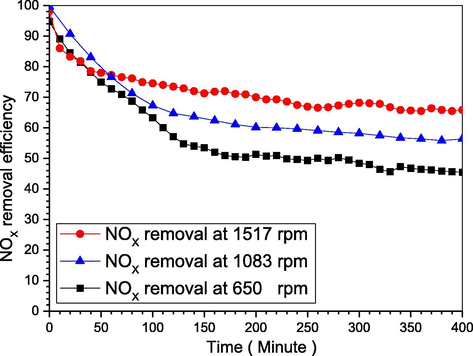
NOX removal efficiency as the stirring intensity change.
3.5 Emulsion temperatures differences
Most importantly the emulsion temperature, which is a critical factor for the removal efficiency, through controlling the O3, whereas increasing the temperature from 45OC to 65OC increases O3 concentration from 50 mg/m3 to 280 mg/m3, but have a reverse effect after this limit (Liu and Chang, 1991; Shuai Li, 2018). Although there are several studies, they were only for the maximum conditions, consequently, we investigated the changes in the removal efficiency when the temperature is constant during all the reactions. For this experiment, we used 1L deionized water, 0.5 g P4, 550 ppm NO, and 30 g KCl, for different temperatures of 45 °C, 55 °C, and 65 °C. We can see from Fig. 7, NOX removal efficiency depends on the emulsion temperature, as the temperature increases NOX removal efficiency increases (Li et al., 2018). The removal efficiency for those temperatures was interestingly different, where NOX removal efficiency decreased from the reaction beginning for the 45 °C, 55 °C, it was increasing for 65 °C, then sharply decreases due to the yellow phosphorus P4 rapid consumption, which attributed to the increase in P4 vapor concentration, then its shortage with the higher consumption rate. Meantime, the yellow phosphorus can spontaneously ignite at 85 °C or after it (Liu and Chang, 1990; Shuai Li, 2018), therefore, the main experiment was conducted at 55 °C for its stable removal efficiency. Furthermore, the elevated temperatures will consume the phosphorus content quickly and will make the ozone decompose and lost, besides, it will reduce NO gas solubility as it’s inversely proportional to the temperature, nonetheless, it will increase the temperature will increase P4 vapor concentration in the absorber (Wei et al., 2003; Wu et al., 2005).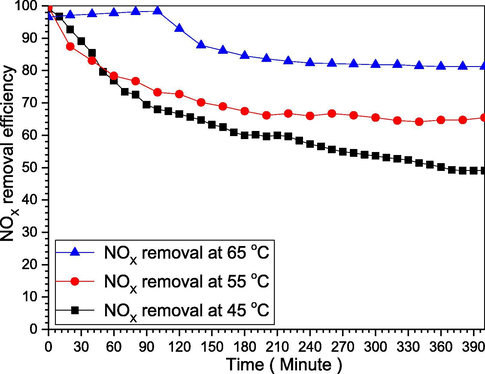
NOX removal efficiency as the emulsion temperature change.
3.6 The reaction pH effects
It was reported for 3, 7, and 9, where the removal was higher at low pH and continue, but after a longer time, it will reverse, where the higher will achieve lower removal efficiency (Liu and Chang, 1991; Liu and Chang, 1990; ShihGer Chang, 1994). Nevertheless, none have investigated the actual system, and pH change, herein we did for the actual experiment, using 1L deionized water, 550 ppm NO, 30 g KCl, 0.5 g P4, and 55 °C. For the pH change effects on NOX removal efficiency, it’s clear from Fig. 8 the pH change lead to different NOX removal efficiency. Where the pH change as the reaction goes with time, starting from the neutrality where the absorber has a higher ability for absorbing a higher amount of the acidic gases, thus has higher NOX removal efficiency, or SOX and NOX simultaneous removal efficiency. This removal decrease with time as it becomes more acidic, due to the formed acids, which decrease the removal efficiency of the reaction goes with time, in order to achieve constant or a higher removal efficiency, an alkali may be added to change the pH toward more alkali, and also the reaction time. The pH change was different for the two cases of, only NOX or the simultaneous SOX and NOX, due to the formation of sulfuric acid, together with the other acids in case of only NO including HCl, HNO3, HNO2, and H3PO4 (Nimmo, 2006; Song et al., 2003; Wei et al., 2003).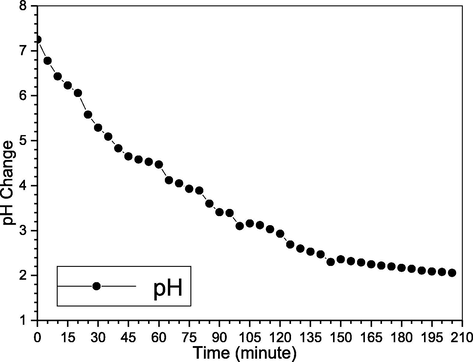
pH change for NOX removal.
3.7 Comparing NOX removal using KCl with CaCO3 and the phosphate rocks
We make a comparison for NOX removal using our newly reported KCl with the most famous absorbers for the P4 application, where were Calcium Carbonate and Phosphates Rocks (Wei et al., 2003; Wen, He, & Costello, 2002). Using 1L deionized water, 0.5 g yellow phosphorus, 55OC, 550 ppm NO, stirring for 1083 rpm, and 30g of KCl, 30g of phosphate rock, and 30g of CaCO3. From Fig. 9 as we can see, CaCO3 have stable NOX removal at around 95%, followed by the phosphate rocks that decline at the early stage and become stable at around 85%, lastly, our KCl is also declined at the beginning and quickly stable around 80%. Whereas the reaction of NO and P4 produces nitric acid and phosphoric acid, those acids react with the calcium carbonate to produce gypsum and other byproducts, which neutralize the medium and make it acceptable for more of the acidic gases NOX. Thus, they have higher removal efficiency (Caillahua, 2018; Clamp, 2008; Dallas Burtraw, 2010). While the phosphate rocks contain some of the appetites like fluorapatite Ca5(PO4)3F and hydroxyapatites Ca5(PO4)3OH or Ca5(PO4)6(OH)2, P2O5, Minerals, and Oxides, which can do the same for the acids, better neutralize the generated acids (Azhar Hussain, 2015; Cheng, 2018; Renmin Li, 2018; Xinglei Zhao, 2009). Meantime, comparing the KCl, to several absorbers, they are either having lower removal efficiency, or if it was higher, it will be unstable removal efficiency, and quickly drop down, besides, if both are okay then it will be expensive. Nonetheless, here we can see KCl has 80% removal efficiency, stable for 5.3 hrs., and also has a very cheap price. Accordingly, it makes our detected KCl a very strong alternative for both, as well as for other available absorbers (Hsu et al., 2007; Khoo, 2006; ShihGer Chang, 1994; Song et al., 2003).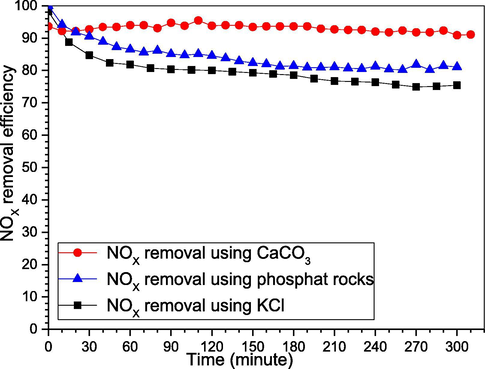
Comparing NOX removal using KCl with CaCO3 and phosphate rock.
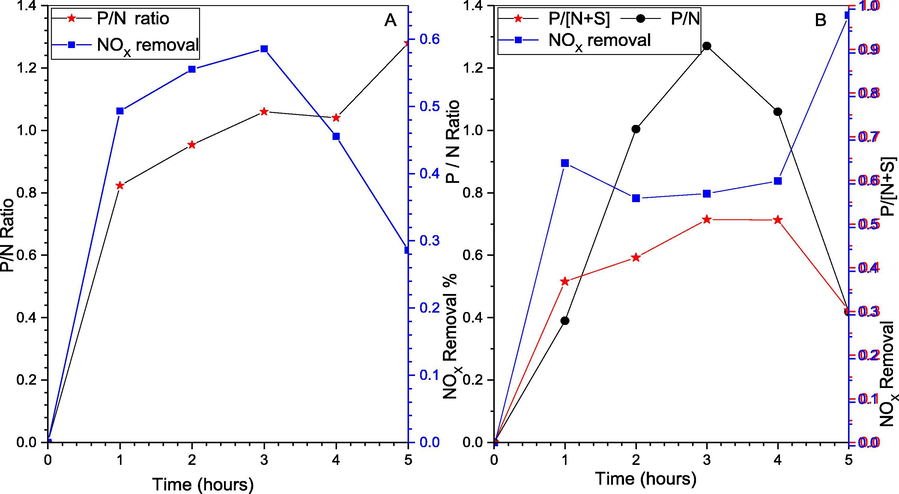
(A) P/N for NOX removal; (B) P/N + S for SOX and NOX removal, and NOX removal change with time.
3.8 Reaction stoichiometry for only NOX removal and SOX and NOX simultaneous removal
We investigate this process removal efficiency, and the P4 utilization rate, using a close system experiment. Where we used 1L 3 necks rounded bottom flask contains 900 ml of deionized water, 0.2 g of P4, 2.0 g of KCl, at 55OC, and 1083 rpm for 5 h, once with 500 ppm NO, and later using NO and 0.92 mM H2SO3 equal to 3000 ppm SO2. We have tested the samples each 1 hr., using two Ion Chromatography (I.C.) described in section 2.2.2, Testing the emulsion seeking all the ions inside the system, whereas NO exist mainly as NO2– and smaller amount as NO3–. Also, P4 exists as H2PO2−, H2PO3−, and commonly as H2PO4−. While the sulfur exists as SO32− and SO42−. Additionally, for KCl together with the potassium ions, Cl− ions were also clearly identified by the I.C., which reviled the separation of the two ions. Hence K is undergoing other reactions (Hsu et al., 2007; Shih-Ger Chang, 1992; Yunxiang Nie, 2018). Nevertheless, the other IC proved the K+ and the NH4+, and the results are in Figs. 11–14 below.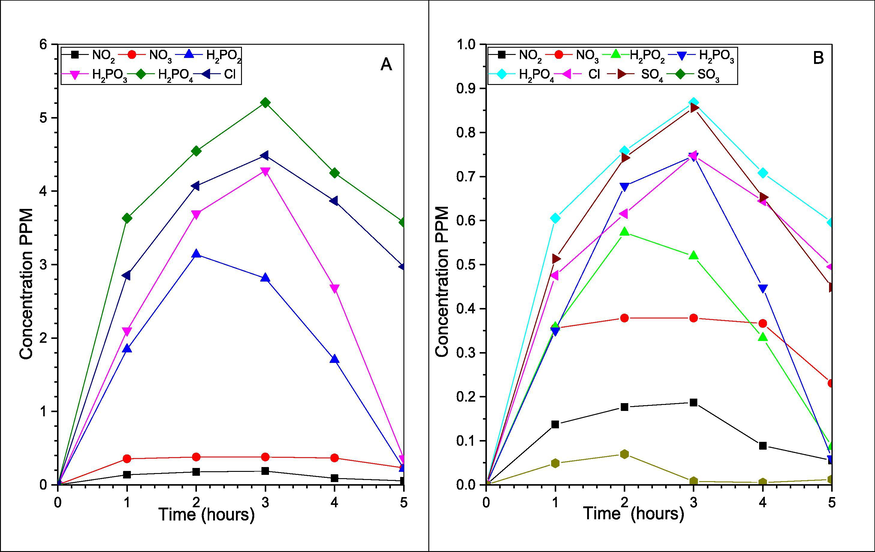
Anions for (A) NOX removal; and (B) SOX and NOX simultaneous removal.
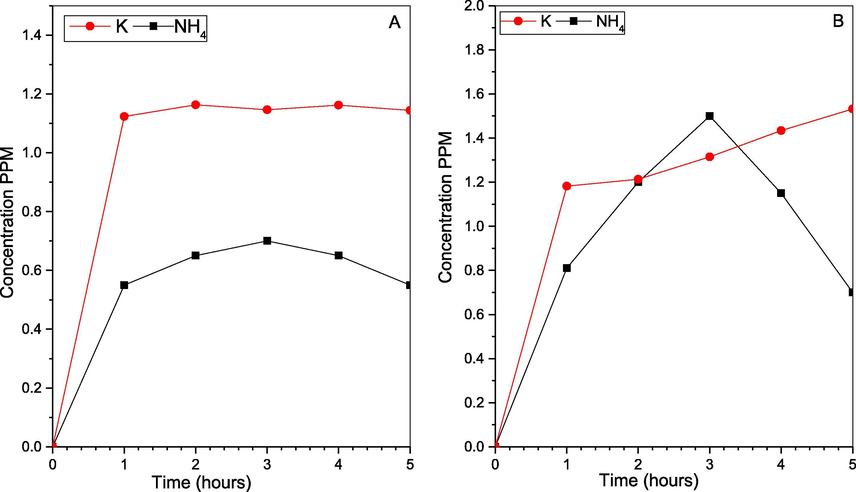
Cations change for (A) SOX and NOX simultaneous removal, and (B) NOX removal.
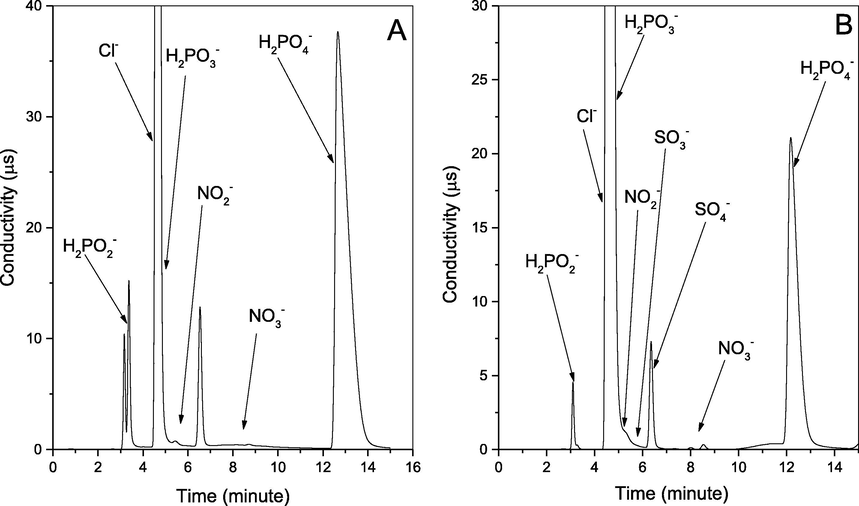
I.C graph for the Anions for (A) NOX removal; and (B) SOX and NOX simultaneous removal.
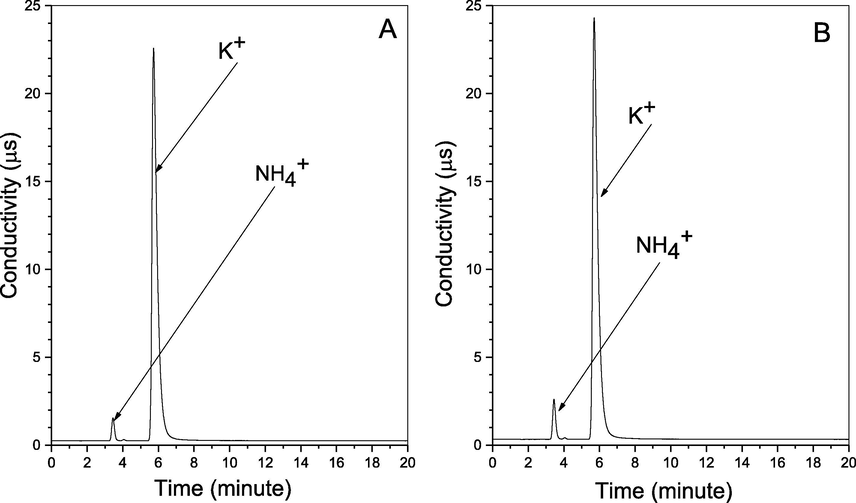
I.C graph for the Cations for (A) SOX and NOX simultaneous removal; and (B) NOX removal.
Meanwhile, the efficiency and P4 utilization investigated using P/N + S and P/N stoichiometric ratio, which represents the number of P mole required to remove 1 mol of N + S or only N. Which expressed by the;
The main data plotted in Fig. 10, where P/N and P/N + S are shown during the actual removal process. Meantime, comparing the system differences with and without the SO2 existence, reviled the P/N higher for NOX removal alone and it also continues to increase, while the simultaneous is increasing then decreasing. Moreover, the P/N stoichiometric ratio founded to be affected by the same factors affecting the NOX removal including O2, temperature, and P4 weight. For instance, the oxygen existence results in complete oxidation and utilization of P4, which will result in a lower P/N ratio. In addition, those temperatures, P4 content, and O2 concentration are affecting each other in opposite ways. Therefore, during the experiment, it's normally compromised between high NOX removal efficiency or low P/N ratio. Typically, during the real operation, it’s to obtaining higher NOX removal efficiency while keeping a lower P/N ratio (Andrews, 1988; Pham and Chang, 1994; Chang, 1992).
Whereas, the P4 amount will affect NO final products, when the P4 amount is greater than NO, the majority of the products are in form of NO3– (Liu and Chang, 1990; Chang, 1992; Shih-Ger Chang, 1992), while if the P4 amount is equal to or less than NO, the majority in form of NO2–. Meanwhile, the phosphorus ions are constant in the form of H2PO4− > H2PO3− > H2PO2− independent of P4 amount. Additionally, SO2 was presented in the form of SO42− and fewer amounts than SO32− (Chang, and Lin, 1982). Nevertheless, as we used P4 greater than NO, we’ve got more NO3– than NO2–, which can be seen in Fig. 11. Furthermore, the I.C. proves all those ions including H2PO2−, H2PO3−, H2PO4−, NO2–, NO3–, SO32−, and SO42−, as in Figs. 11–14 below.
In addition, for the simultaneous removal NOX recovered as NO2– and NO3– represents ∼50%, the rest are in form of several Nitrogen and Sulphur compounds (Liu and Chang, 1990; Chang, 1992; Shih-Ger Chang, 1992), with the majority in form of the Hydroxyimidodisulfate (HIDS) and imidodisulfate (IDS) at the slightly acidic environment, those HIDS and IDS compounds can be Hydrolyzed to NH4+ when the pH at around 2. The I.C. test for the cations in Figs. 12 and 14 has proved NH4+ existence, as it also proved the existence of potassium ions K+. Lastly, the cations investigation has proven the latest element of the NPK complete fertilizer to exist within the final products, while for the solids it proved to have P2O5 and PO4 that are part of P in the NPK fertilizer. As in the XRD and RAMAN spectroscopy describe below (Li, Loh, Matsushima, Nishioka, & Sadakata, 2002; Wen et al., 2002).
4 Solid precipitate investigation
4.1 Raman spectroscopy
Raman spectroscopy is a powerful technique for chemical structure identification, herein we investigated the solids precipitated crystals obtained from the reaction (using an inVia Raman microscope, designed by Renishaw in U.K.) as shown in Fig. 15, the main obvious peaks of the Raman bands were 360 cm−1, 460 cm−1, and 600 cm−1 that represent the majority and refer to the Phosphate PO4, while a smaller amount exists at 1230 cm−1 in form of P2O5 crystals. It also indicates as the P2O5 is an intermediate state for the phosphorus oxidation it will finally stable at PO4, thus represent the majority. However, both of them are rich phosphorus sources, while ammonia and potassium together with some other phosphorus are mainly in the liquid form (Lei Zhang, 2017; McManus 2012).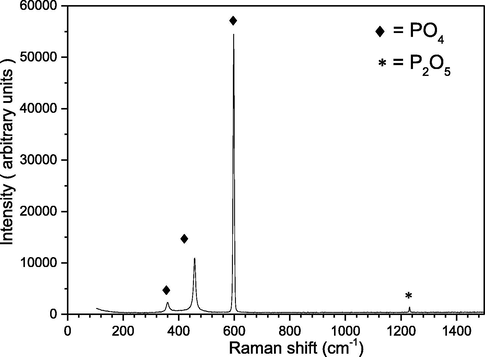
RAMAN test for the solid precipitate.
4.1.1 XRD test
The morphology and microstructure of the solid precipitated samples were also investigated using X-Ray Diffractometer XRD (Rigaku, D/Max-2550 PC Tokyo Japan). The XRD spectra are shown in Fig. 16, where the peak at 2ϴ = 21° the diffraction peak, represents the majority of the residue, which is assigned to the Phosphate PO4 crystals. Additionally, the remaining peaks are minor and they represent a mixture of the Phosphate PO4 and the Phosphorus pentoxide P2O5 and some amorphous, although several factors may affect the crystallinity, from all the experiments the precipitated crystals have almost the same size and white color. These results support that one of the Raman for the solid precipitates. Furthermore, it was compared with the XRD for the pure KCl that has shown beside it, where no peak was coexisting at the same peak (Kumar, 2007; Tea-Sung Kang, 2017).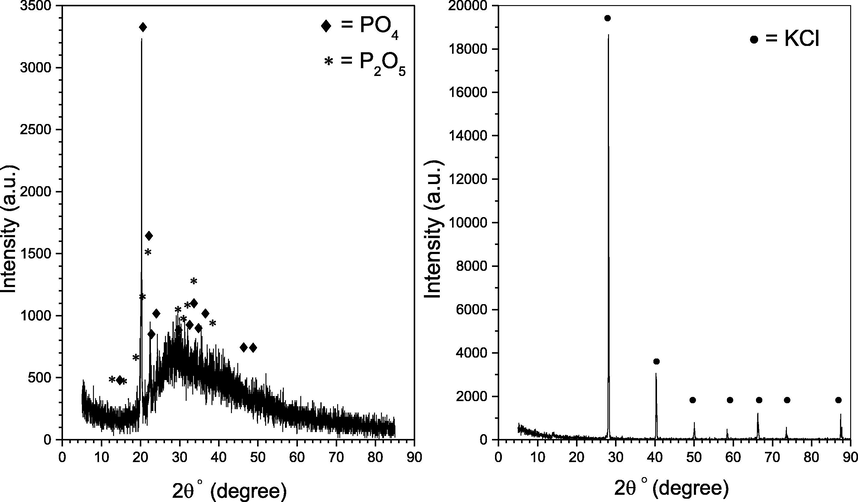
XRD test for the solid precipitate.
4.2 Reaction mechanism of the process
The reaction of P4 and O2 can take place in both the aqueous phase and the gas phase. Whereas the liquid one occurs on the surface of the P4 globule, hence will be affected by the reactor design, liquid/gas ratio, temperature, all the parameters that can change the dispersion of the melted phosphorus, and all the additives that may change the dielectric constant of the medium. On the other hand, the gas phase occurs between O2 and the liberated P4 from the emulsion at high temperatures (Bailar, 1973). The reaction between P4 and O2 produces O3 and O atoms with an almost equal reaction rate. Where O2 normally higher in the flue gas, thus O3 production representing the main reaction path (Qian, 1995), the inferred equations are as following.
M is another molecule that won’t change during the reaction.
The basic reactions between the ozone and NO to produce the more soluble NO2 will be affected by the oxidizing agent whether it was O or O3. The produced NO2 can react with NO to produce N2O3 or dimerize to N2O4.
M is another molecule that won’t change during the reaction.
The produced NO2 and the other intermediates will form nitrous and nitric acid, by the direct reaction with water.
If SOX is added as SO2, the reaction mechanism is as the following (Christopher H. Nelli, 1998; David Littlejohn, 1986; Jetawattana, Spring 2005; Anglada, 2019).
M is another molecule that won’t change during the reaction.
In fact, the majority is found to occur through the NO/SO2 producing HADS, which is generally expressed as Eq. (26):
Actually, the existence of SO3−/HSO3 in greater than 1 mM can derive reaction (26) to occur, which is typically happening as the following (David Littlejohn, 1986; Anglada, 2019).
Nevertheless, the HADS goes through sulfonation and/or hydrolysis to form N-S compounds, the overall reactions can be summarized as the following:
The removal process is mainly done by KCl, which will react with the final products from all of the above reaction, as follows:
Finally, the reaction of nitric acid and KCl will produce KNO3 if only NO was added or KNO3 and K2SO4 if the SO2 and NO were added together, KNO3 is a source of potassium for fertilizer which contain 44% K2O and 36.5% K. Meanwhile, if SO2 is presented then we will get H2SO4 and thus finally we will obtain K2SO4 which also contains 50–52 K2O and 41.5–43.2 K (Liu et al., 2001; Production and Use of Potassium, 1998; Wei et al., 2003; Wen et al., 2002).
5 Conclusion
In the present study, we investigated SOX and NOX simultaneous removal, and the possibility to obtain the complete fertilizer NPK, using the yellow phosphorus P4 and KCl.
After series of optimization experiments, the removal efficiency under the optimum conditions of a temperature of 55 °C, P4 weight of 0.5 g, stirring intensity of 1083 rpm, and varying O2 and pH, where the simultaneous removal for 550 ppm NOX and 2900 ppm of SOX reach 100% in 2 hrs. using O3, and after 3 hrs. without it. Nevertheless, comparing to the most famous two absorbers, revile it’s the best available alternative for both and the strongest competitor. Meantime, the IC proved all the claimed ions quantitatively and qualitatively, therefore, indicates all the NPK ions and confirms their existence. Besides, the inferred reaction mechanism. And finally, the solid investigation proves the precipitated crystals are rich in phosphorus ions.
Acknowledgment
Funding: This work was supported by the National Natural Science Foundation of China [U1660107].
Declaration of Competing Interest
The authors declare that they have no known competing financial interests or personal relationships that could have appeared to influence the work reported in this paper.
References:
- Matrix reactions of oxygen atoms with P4 Infrared spectra of P4O, P2O, PO and PO2. J. Am. Chem. Soc.. 1988;110(17):5605-5611.
- [Google Scholar]
- Comparative effectiveness of SOP and MOP for crop productivity in Pakistani soils. Int. J. Agron. Agric. Res. (IJAAR). 2015;6:256-267.
- [Google Scholar]
- Technical feasibility for use of FGD gypsum as an additive setting time retarder for Portland cement. J. Mater. Res. Technol.. 2018;7(2):190-197.
- [Google Scholar]
- Desulfurization and denitrification technologies of coal-fired flue gas. Polish J. Environ. Stud.. 2018;27(2):481-489.
- [CrossRef] [Google Scholar]
- Dry De-NOx process via gas Phase photochemical oxidation using an ultraviolet and aerosolized H2O/H2O2 Hybrid System. Energy Fuels. 2014;28(8):5270-5276.
- [CrossRef] [Google Scholar]
- Christopher H. Nelli, G. T. R. (1998). Simultaneous sulfur dioxide and nitrogen dioxide removal by calcium hydroxide and calcium silicate solids. J. Air Waste Manage. Assoc. 48(9), 819-828. doi:10.1080/10473289.1998.10463728.
- Clamp, F. (2008). Trials for the use of recycled gypsum in cement manufacture. Project code: PBD022-001, Jacobs Engineering UK Limited.
- Dallas Burtraw, S.J., Szambelan. (2010). US emissions trading markets for SO2 and NOx.: New York: Routledge.
- Liu, D.K., Chang, S.G., 1991. Removal of NOx and SO2 from flue gas using aqueous emulsions of yellow phosphorus and alkali. Environ. Sci. Technol. Res. 25(1), 55–60.
- Kinetics of the reaction of nitric oxide with sulfite and bisulfite ions in aqueous solution. Inorg. Chem.. 1986;25(18):3131-3135.
- [CrossRef] [Google Scholar]
- GC Mgbeze, Y.A., 2010. The effects of NPK and farm yard manure on the growth and development of the African yam bean (Sphenostylis stenocarpa Hochst ex. a rich). African Journal of Biotechnology., 9(37), 6085-6090
- H. Cordes, W.W., 1965. Einige aussagen zur oxydation des phosphors. Zeitschrift für Physikalische Chemie., 46(1-2), 35–48.
- Hsu, H.W., Chou, K.S., Lu, C.L., 2007. Performance characteristics of NOx removal by aqueous emulsions of yellow phosphorus. Chem. Eng. Commun. 177(1), 105–120. doi: 10.1080/00986440008912163.
- Hussain, A. A., Muhammad Ahmad, Hafiz Tanvir Nazir, Qudsia Mustafa, Ayesha Afzal, Ali Zeb, Hassan, 2015. Comparative effectiveness of SOP and MOP for crop productivity in Pakistani soils-A review. Int. J. Agron. Agric. Res. (IJAAR), 6(4), 256–267.
- Jason C. Willett, J.M.K., Linder Roberts, 2004. POTASH. POTASH, 11.
- Jetawattana, S., 2005. Sulfur dioxide, source of (bi)sulfite. The University of Iowa, Iowa City, IA 52242-1181, 77, 222, 11.
- John C. Bailar, A. F. T. D. (1973). Comprehensive inorganic chemistry. Oxford: Pergamon press; distributed by compendium publishers, Elmsford, N.Y.
- Josep M. Anglada, M. T. C. M.-C., Joseph S. Francisco and Manuel F. Ruiz-López. (2019). Triplet state promoted reaction of SO2 with H2O by competition between proton coupled electron transfer (pcet) and hydrogen atom transfer (hat) processes. Physical Chemistry Chemical Physics, 19, 9779-9784. doi:10.1039/C9CP01105F.
- Joseph Alcamo, M. A., Jean-Paul Hettelingh, Maria Holmberg, Leen Hordijk, Juha Kämäri, Lea Kauppi, Pekka Kauppi, Gabor Kornai, Annikki Mäkelä. . (1987). Acidification in Europe: a simulation model for evaluating control strategies. Jornal Ambio, 232-245.
- Environmental Impact Evaluation of Conventional Fossil Fuel Production (Oil and Natural Gas) and Enhanced Resource Recovery with Potential CO2 Sequestration. Energy Fuels. 2006;20(5):1914-1924.
- [CrossRef] [Google Scholar]
- Kumar, J. S. T. a. B. (2007). Water Durable Lithium Ion Conducting Composite Membranes from the Li2O - Al2O3 - TiO2 - P2O5 Glass-Ceramic. J. Electrochem. Soc, 154(4).
- Lei Zhang , L. C., Lai shi Zhao, Thomas J. Algeo, Zhong-Qiang Chen, Zhi hong Li, Zheng yi Lv, Xiang dong Wang. (1 August 2017). Raman spectral, elemental, crystallinity, and oxygen-isotope variations in conodont apatite during diagenesis. Geochimica et Cosmochimica Acta, 210, 184–207.
- A unified intermediate and mechanism for soot combustion on potassium-supported oxides. Sci. Rep.. 2014;4:4725.
- [CrossRef] [Google Scholar]
- Li, S. Y., Jiaqiang Wang, Chi Xie, Delong Luo, Yongming Li, Kai He, Dedong Mei, Yi. (2018). Removal of NOx from flue gas Using yellow phosphorus and phosphate slurry as adsorbent. Energy & Fuels, 32(4), 5279 -5288. doi:10.1021/acs.energyfuels.7b03964.
- Chain Reaction Mechanism by NOx in SO2 Removal Process. Energy Fuels. 2002;16(1):155-160.
- [CrossRef] [Google Scholar]
- Lindsay. L. McManus , F. B., George. A. Burke , Brian. J. Meenan , Adrian. R. Boyd and Hugh. J. Byrne (2012). Assessment of an Osteoblast-like Cell Line as a Model for Human Primary Osteoblasts Using Raman Spectroscopy. Dublin Institute of Technology DIT Biophotonics and Imaging, 137(7), 1559–1569.
- Drastic SOx Removal and Influences of Various Factors in O2/CO2 Pulverized Coal Combustion System. Energy Fuels. 2001;15(2):403-412.
- [CrossRef] [Google Scholar]
- Liu, D.K., Chang, S.G., 1990. Removal of nitrogen and sulpher oxides from waste gases using a phosphorus/alkali emulsion. Nature, 343, 151–153.
- Post-combustion Capture of CO2: Results from the Solvent Absorption Capture Plant at Hazelwood Power Station Using Potassium Carbonate Solvent. Energy Fuels. 2012;26(1):138-146.
- [CrossRef] [Google Scholar]
- Nimmo, W. P., A. A. Williams, P. T. (2006). Enhanced NOx Reduction with SO2 Capture under Air-Staged Conditions by Calcium Magnesium Acetate in an Oil-Fired Tunnel Furnace. Energy & Fuels, 20(5), 1879-1885. doi:10.1021/ef060011z.
- Removal of NO from flue gases by absorption to an iron(ii) thiochelate complex and subsequent reduction to ammonia. Nature. 1994;369(6476):139-141.
- [CrossRef] [Google Scholar]
- Production and Use of Potassium. (1998). Better Crops, 82, 6–8.
- High-resolution spectroscopic study of the oxidation of white phosphorus. J. Chem. Soc., Faraday Trans.. 1995;91(18):2993-2998.
- [CrossRef] [Google Scholar]
- Mechanism of novel K2SO4/KCl composite roasting additive for strengthening vanadium extraction from vanadium–titanium magnetite concentrate. Minerals.. 2018;8(426):11.
- [CrossRef] [Google Scholar]
- S. G. Chang, D. L., and N. H. Lin. (July 1, 1982). Kinetics of Reactions in a Wet Flue Gas Simultaneous Desulfurization and Denitrification System. Flue Gas Desulfurization, 188, 127–152.
- S. G. Chang, G. C. L. (1992). LBL PhoSNOX process for combined removal of SO2 and NO from flue gas. Environmental Progress., 11(1), 8.
- Shih-Ger Chang, E. C. D. K. L., San Pablo, both of Calif. (1992). U.A. Patent No. 5,106,601. U. S. Patents.
- ShihGer Chang, E. C., Calif. (1994). United States Patent No. 5,348,715. U. S. Patents.
- Shuai Li, J. Y., Chi Wang, Delong Xie, Yongming Luo, Kai Li, He, Dedong Mei, Yi. (2018). Removal of NOx from flue gas using yellow phosphorus and phosphate slurry as adsorbent. Energy & Fuels, 32(4), 5279-5288. doi:10.1021/acs.energyfuels.7b03964.
- Research on Homogeneous Oxidation of NO and SO2 in Flue Gas by Chain Reactions. Energy Fuels. 2003;17(6):1549-1553.
- [CrossRef] [Google Scholar]
- Susan M. Bernard, J. M. S., Anne Grambsch, Kristie L. Ebi., Isabelle Romieu. (2001). The potential impacts of climate variability and change on air pollution-related health effects in the United States. Journal Environmental health perspectives, 109(suppl 2), 199–209.
- Tea-Sung Kang, S.-J. L. (2017). Fabrication of Calcium Phosphate Glass Using Eggshell and its Crystallization Behavior. J. Korean Ceram. Soc., 54.
- Detailed Modeling of NOx and SOx Formation in Co-combustion of Coal and Biomass with Reduced Kinetics. Energy Fuels. 2012;26(6):3117-3124.
- [CrossRef] [Google Scholar]
- The Effect of HCl and SO2 on NOx Formation in Coal Flames. Energy Fuels. 2003;17(5):1392-1398.
- [CrossRef] [Google Scholar]
- Simultaneous Catalytic Removal of NOx, SOx, and CO from FCC Regenerator. Energy Fuels. 2002;16(5):1048-1053.
- [CrossRef] [Google Scholar]
- NOx Treatment by DC Corona Radical Shower with Different Geometric Nozzle Electrodes. Energy Fuels. 2005;19(6):2279-2286.
- [CrossRef] [Google Scholar]
- Study on the interaction between NOx and K2CO3 during CO2 absorption. Energy Fuels. 2009;23:6.
- [CrossRef] [Google Scholar]
- Efficient removal of SO2 from flue gas with phosphate rock slurry and Investigation of reaction mechanism. Ind. Eng. Chem. Res. 2018
- [Google Scholar]


