

Translate this page into:
Promotion of oxidative desulfurization performance of model fuel by 3DOM Ce-doped HPW/TiO2 material
⁎Corresponding authors. duyue@whut.edu.cn (Du Yue), 2187@whut.edu.cn (Jiaheng Lei)
-
Received: ,
Accepted: ,
This article was originally published by Elsevier and was migrated to Scientific Scholar after the change of Publisher.
Peer review under responsibility of King Saud University.
Abstract
Phosphotungstic acid (HPW) supported on Ce-doped three-dimensional ordered macroporous (3DOM) TiO2 catalysts are studied in catalytic oxidation desulfurization (ODS) of model oil. The structural and textural of as-synthesized catalysts are characterized by N2 adsorption, XRD, Raman spectroscopy, SEM-EDS, TEM, FT-IR, XPS, UV–Vis and ICP. These results upheld the existence of periodically arranged macroporous structure of catalyst, with Keggin-type of HPW dispersed homogeneously on TiO2 matrix. Among these 3DOM Ce-doped HPW/TiO2 materials, catalyst with 15 wt.% cerium dosage exhibits best ODS performance, which oxidized 99.8% of dibenzothiophene (DBT) into corresponding sulfone within 40 min. The excellent ODS performance of 3DOM Ce-doped HPW/TiO2 catalyst is related to the common influence of more oxygen vacancies produced by electron transformation between Ce3+ and Ce4+. The chemisorbed oxygen on the surface catalyst will facilitate the selective oxidation of sulfides to sulfones. Moreover, the 3DOM structure of catalyst will further promote the mass transfer of reactants and products on the pore channel. The as-prepared catalyst shows excellent reusability in the ODS system, no obviously decrease in catalytic activity even after 6 runs.
Keywords
Three-dimensional ordered macroporous catalyst
Ce doped
Heteropoly acid
Oxidative desulfurization

1 Introduction
The stringent regulation regarding sulfur content of fuel oil has motivated intensive research in desulfurization techniques to release the environmental pressure (Polikarpova et al., 2018; Lin et al., 2018). DBT and its alkyl derivatives, as the main sulfur-containing compounds after catalytic hydrodesulfurization (HDS), are hard to be removed during hydrogenation processes (Zhu et al., 2015; Lu et al., 2018). In order to achieve ultra-low sulfur in gasoline and diesel fuel, alternative technologies such as extraction (Mochizuki and Sugawara, 2008); adsorption (Fallah et al., 2015); biodesulfurization (Monticello, 2000), and oxidative desulfurization (ODS) (Du et al., 2018), have been investigated. Among them, ODS has been considered as one of the most promising and economical method because of its mild operation conditions (ambient pressure and relatively lower temperature) and cheap hydrogen consumption (Qin et al., 2018).
Therefore, various kinds of materials including V-HMS (Liu et al., 2018), MOF (Zhang et al., 2018); Liquid-Modified catalyst (Xiong et al., 2014), metallic oxide (Abdul-Kadhim et al., 2017; Kugai et al., 2006); TS-1 zeolite (Du et al., 2018) and supported polyoxometalates (POMs) catalyst (Du et al., 2018) have been applied in ODS process. Among them, POMs have attracted considerable interest because of its tunable catalytic property and pseudo-liquid phase behavior (Zhang et al., 2013; Choi et al., 2016; Choi et al., 2016). Whereas, its disadvantages including low surface area and high solubility in polar media limited accessibility of the active sites and made them hard to be recycled (Yan et al., 2013). Therefore, insoluble solid carriers such as TiO2 (Zuhra et al., 2017), SiO2 (Qiu et al., 2015), CeO2 (Zhang et al., 2013), Al2O3 (Garcia-Gutierrez and Fuentes, 2006) and carbon (Liu et al., 2014) have been developed to as POM carriers. In our previous study (Du et al., 2018; Yue et al., 2019; Du et al., 2018), several kinds of HPW based three-dimensional ordered macroporous material have been synthesized. It proves that the introduction of larger secondary pore channels on the porous carrier can provide more accessible inner surface area for the reactant molecules, make the active sites easier to approach, thus, enhance catalytic activity of refractory sulfur compounds in H2O2/POMs system.
CeO2, as a commonly used catalyst for the combustion of diesel soot (Zhang et al., 2010), has been widely studied in various catalytic processes because of its high oxygen storage capacity, redox properties and activation characteristics (Zhang et al., 2009). As reported by Zhang et al. (2013), HPW/CeO2 catalyst exhibits excellent ODS performance in extraction-oxidation desulfurization system. Xiao et al. (2015) discusses the adsorptive desulfurization behavior of Ti-Ce mixed metal oxides on thiophene compounds, it indicates that the reduced surface sites will lead to O-vacancy sites for O activation for oxidizing thiophenic species. Large number of oxygen vacancies will emerge by Ce doping on TiO2 support, originated from the electron transformation between Ce3+ and Ce4+. Thus, it provides more sites to activate adsorbed oxygen. However, larger ionic radius of Ce3+ (0.111 nm) and Ce4+ (0.101 nm) than Ti4+ (0.068 nm) will cause lattice contraction of TiO2 which further influence the crystallization process during calcination.
In this work, a series of Ce doped 3DOM HPW/TiO2 catalysts were synthesized by sol-gel method. The oxygen vacancies produced by the electron transformation between Ce3+ and Ce4+ will promote the formation of O-rich sites in the oxidation process, which is helpful to the selective oxidation of sulfides to corresponding sulfones. Moreover, the 3DOM structure of as-prepared catalyst will effective improves the mass transfer of reactants on the pore channel.
2 Experimental
2.1 Chemicals
Styrene (99.5%), potassium persulfate (K2S2O8, 99.5%), hydrogen peroxide (30 wt.%), tetrabutyl titanate, cerium nitrate hexahydrate (Ce(NO3)3 6H2O, 99.0%), concentrated hydrochloric acid (HCl, 37 wt.%), petroleum ether (90–120 °C) and acetic acid were purchased from China Pharmaceutical Group Chemical Reagent BT (99.0%), 4,6-DMDBT (97.0%), DBT (98.0%), and 12-phosphotungstic acid (H3P12W40·nH2O, 99.0%) are received from Sigma-Aldrich and not purified prior to use.
2.2 Catalyst preparation
The 350 nm polystyrene (PS) monoliths are prepared as our previous report (Du et al., 2018). Complete details are provided in the supporting information.
The 3DOM Ce-doped HPW/TiO2 material is prepared by colloidal crystal template method. Typically, 0.375 g distilled water, 0.25 g acetic acid, and 2.585 g hydrochloric acid (36 wt.%) are added to 4.6 g ethanol under vigorous stirring. Subsequently, Ce(NO3)3·6H2O and tetrabutyl titanate are dissolved in above solution with a certain proportion (the total mass of Ce and titanium oxide was 2.833 g). After 5 min of stirring at 25 °C, 0.167 g H3P12W40 nH2O is added and subjected to stirring for another 30 min to form a transparent sol-gel.
3 g of PS colloidal crystals are pre-dried in an oven overnight at 60 °C, and then placed in a Buchner funnel with back pressure. Afterwards, the obtained sol is slowly dripped onto PS monoliths till being almost completely wetted, then dried in oven at 40 °C for 30 min. This process is repeated for three times. Finally, the inorganic/organic composites are dried overnight and then annealed in air 400 °C for 10 h (at a ramp rate of 1 °C/min). The obtained 3DOM Ce-doped HPW/TiO2 composites are labeled as HPW/xCe-TiO2, where × stands for the weight percentage of Ce in the catalyst.
2.3 Characterization
Powder X-ray diffraction (XRD) is measured by Bruker D8 Advance-type target X-ray powder diffractometer (CuKa, λ = 1.5406 Å). Ultraviolet–visible diffuse reflectance spectroscopy (UV–Vis/DRS) is carried out on a PE Lambda 35 diffuse diffuse reflector. Infrared spectroscopy (FT-IR) is recorded on the Digilab-FTS 60 spectrometer using KBr method. The specific surface area and pore size distribution (PSD) of the samples are measured by Quantachrome Autosorb-1 adsorber. The pore size distribution of the mesopores is calculated from the adsorption branches data of the isotherms using the Barrett-Joyner-Halenda (BJH) method. The X-ray photoemission spectroscopy (XPS) is recorded by VG MultiLab 2000 system with a monochromatic Mg-Ka source operated at 20 kV. HPW content in sample is also done by using inductively coupled plasma (ICP, Perkin-Elmer 3300DV). The morphology of samples is observed with scanning electron microscope (SEM, Hitachi S-4800) images and transmission electron microscopy (TEM, JEOL JEM2100F) were obtained by on Digilab-FTS60 spectrometer. The sulfur compound of model oil is performed with a Waters Acquity TM Ultra Performance LC system equipped with an ACQUITY UPLC® HSS C18 column (100 mm × 2.1 mm, 1.7 µm).
2.4 Catalytic tests
DBT (M = 184.26 g/mol, 1.15 g), BT (M = 134.2 g/mol, 1.05 g), or 4,6-DMDBT (M = 212.31 g/mol, 1.66 g) is dissolved absolutely into 500 mL petroleum ether (90–120 °C) to prepare model oil 500 mg/L (S). The ODS process is carried out in a 25 mL flask equipped with a stirrer and reflux condenser. 10 mL of extraction solvent (acetonitrile) and 10 mL of model oil are added to the reaction vessel and heated to desire temperature. Then a certain amount of catalyst and H2O2 (30 wt.%) is added (the molar ratio of hydrogen peroxide to sulfide is marked O/S). The model fuel is withdrawn at a certain time and determined with high performance liquid chromatography (HPLC). HPLC chromatograph is Japanese Shimadzu LC-20A, equipped with LC-20AT pumps, SPD 20A UV detector and ODS-BP chromatographic columns (4.6 mm × 200 mm, 5 μm). Spend catalyst is filtered and washed with methanol for several times, dried in oven overnight, then subjected to next run.
3 Results and discussion
3.1 Characterization of the catalyst
The 3DOM morphology of HPW/15Ce-TiO2 is characterized by SEM. Highly ordering alignment of macropores can be clearly observed in Fig. 1A and B. Moreover, uniform interconnected window pore (71 nm) proves the orderliness of macroporous structure. The 3DOM structure is of several tens of micrometers in length (Fig. 1B). The shrinkage of macropore diameter (213 nm) compared with PS spheres is due to volume shrinkage of the PS microspheres and TiO2 framework during calcinations (Li et al., 2018). In addition, the element mappings of titanium, wolfram, and cerium reveal that metallic wolfram and cerium are distributed on the surface of titanium dioxide matrix (Fig. 1C–E).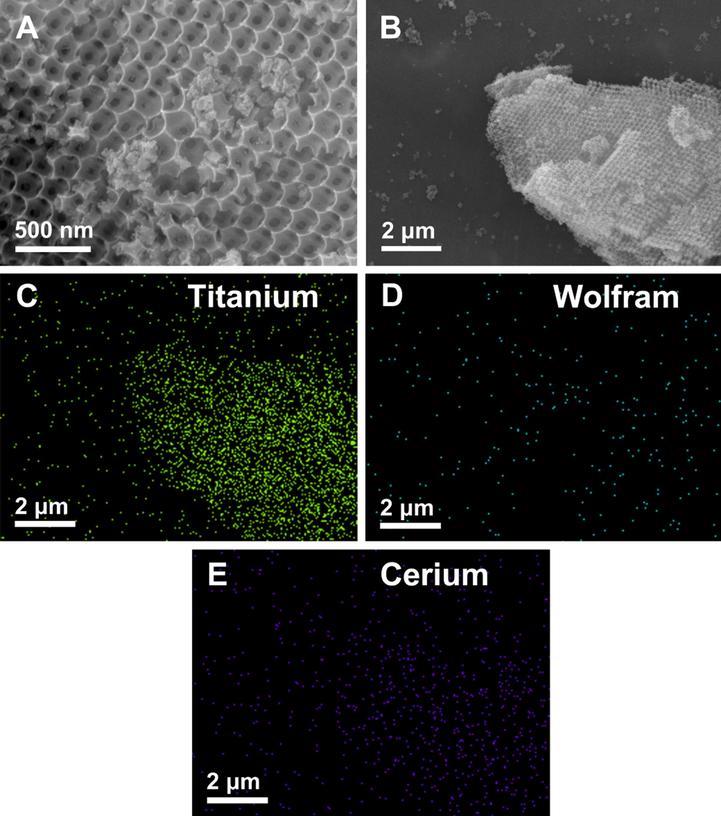
SEM (A and B) and (C) titanium; (D) wolfram; (E) cerium EDS spectra of HPW/15Ce-TiO2.
The HRTEM images of HPW/15Ce-TiO2 (Fig. 2) display periodic arrangements of macropores, the lighter areas are representative of the air void, in correspondence with SEM results. Besides, a large number of disordered mesopores exist between closely packed macroporous walls can be found in Fig. 2 B, originated from the aggregation of nanocrystals during calcination process (Wu et al., 2013).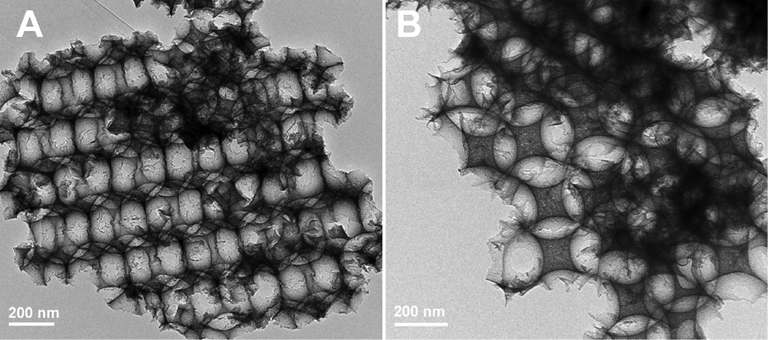
TEM images of HPW/15Ce-TiO2.
PS template can be removed on the thermolysis process; meanwhile, anatase nanocrystals will gradually form from the titania precursor (Jun et al., 2014). As shown in Fig. 3(a), well-resolved diffraction peaks at 2θ = 25.3°, 37.8°, 48.0°, 54.4°, and 62.7° can be clearly observed at HPW/TiO2, HPW/5Ce–TiO2, and HPW/15Ce–TiO2 samples, which is very well be indexed to anatase TiO2 (PDF#99-0008) (Liu et al., 2011). Additionally, no typical diffraction peaks of non-crystal HPW species exist in XRD spectra, which suggest that Keggin-type HPW uniformly distributed in TiO2 framework. With the increase content of Ce, intensity of {1 0 1} diffraction peak at 25.3° reduces gradually, indicating the destruction of crystal structures of anatase TiO2. The relatively larger ionic radius of Ce3+ (0.111 nm) and Ce4+ (0.101 nm) than Ti4+ (0.068 nm) will cause lattice contraction of TiO2 which further influence the crystallization process during calcination (Li et al., 2017). The slowdown trend of condensation and crystallization process of anatase TiO2 can be further confirmed by crystallite sizes of catalyst (Table 1). Moreover, amorphous peak between 15 and 40° appeared with significantly decreasing {1 0 1} peak of anatase TiO2, which should be associated with the inhabitation of cerium doping on the phase transition from titanium dioxide to anatase (Silva et al., 2009; Niltharach et al., 2012).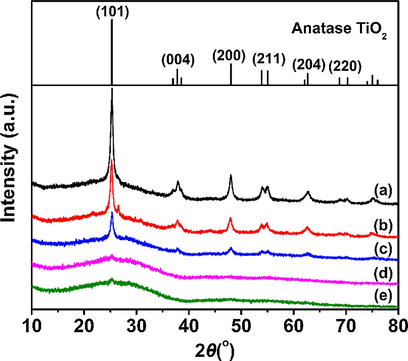
Powder XRD patterns of (a) HPW/TiO2, (b) HPW/5Ce–TiO2, (c) HPW/15Ce–TiO2, (d) HPW/25Ce–TiO2, and (e) HPW/30Ce–TiO2 catalysts.
Catalysts
HPW dosagea (%)
SBETb (m2/g)
Sc (nm)
Vtd (cm3/g)
Average pore sizee (nm)
Sulfur removalf (%)
HPW/TiO2
19.8
111.8
16.8
0.2741
9.8
88.4
HPW/5Ce–TiO2
19.7
58.00
15.8
0.1452
10.0
92.5
HPW/15Ce–TiO2
19.7
62.26
15.2
0.1693
10.9
99.8
HPW/25Ce–TiO2
19.6
100.5
–
0.3740
12.9
94.8
HPW/30Ce–TiO2
19.9
44.74
–
0.1279
11.4
80.4
The pore structure of catalysts is further examined by BET measurement (Fig. 4). All samples exhibit typical type-IV isotherm with a H3 type hysteresis loop, which suggests the existence of macroporous structure (Gregory et al., 2017; Li et al., 2016). In addition, small hysteresis observed at the medium-pressure range indicates the existence of mesopores in material (Bian et al., 2010).The BET surface area of HPW/TiO2 catalyst is 111.8 m2/g, which is much higher than Ce doped catalysts. Concluded from Table 1, the increasing content of Ce on HPW/xCe-TiO2 catalyst has a negative effect on the growth of titanium dioxide crystal (Li et al., 2017); which is consistent with XRD and Raman result.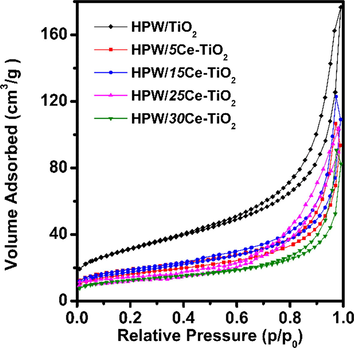
N2 adsorption-desorption isotherms and corresponding PSD for HPW/TiO2, HPW/5Ce–TiO2, HPW/15Ce–TiO2, HPW/25Ce–TiO2, HPW/30Ce–TiO2 catalysts.
The chemical composition of HPW/15Ce–TiO2 nanoparticles is determined by XPS. Peaks appeared at approximately 463.7 and 457.96 eV could be attributed to the binding energies of O 1s, Ti 2p1/2, and Ti 2p3/2, originated from lattice oxygen of TiO2 (Fig. 5A) (Camposeco et al., 2015). Theoretically, the electrode potential of Ce4+/Ce3+ is higher than Ti4+/Ti3+, therefore, electrons from Ti3+ cations will transfer to Ce4+ suggesting that the formation of Ce3+ will consume Ti3+ cations (Fan et al., 2016). The high resolution O1s spectrum shown in Fig. 5B could be deconvoluted into two component peaks identified as chemisorbed oxygen (531.3–531.9 eV) and lattice oxygen (529.0–530.0 eV) (Liu et al., 2014), which is caused by O—H and the overlap of oxygen in TiO2 and Ce—O—Ti compounds, respectively. Particularly, lattice oxygen and chemisorbed oxygen implies the existence of chemisorbed oxygen on the surface of HPW/15Ce–TiO2 nanoparticles, which will facilitate the selective oxidation of thiophene sulfides (Guo et al., 2012). The XPS spectra of Ce 3d are shown in Fig. 5C, Peaks at 903.9 and 885.5 eV confirm the coexistence of Ce3+ and Ce4+, indicating a large number of oxygen vacancies exist on the surface of HPW/15Ce-TiO2 sample, thus, providing more sites to activate adsorbed oxygen (Liu et al., 2014).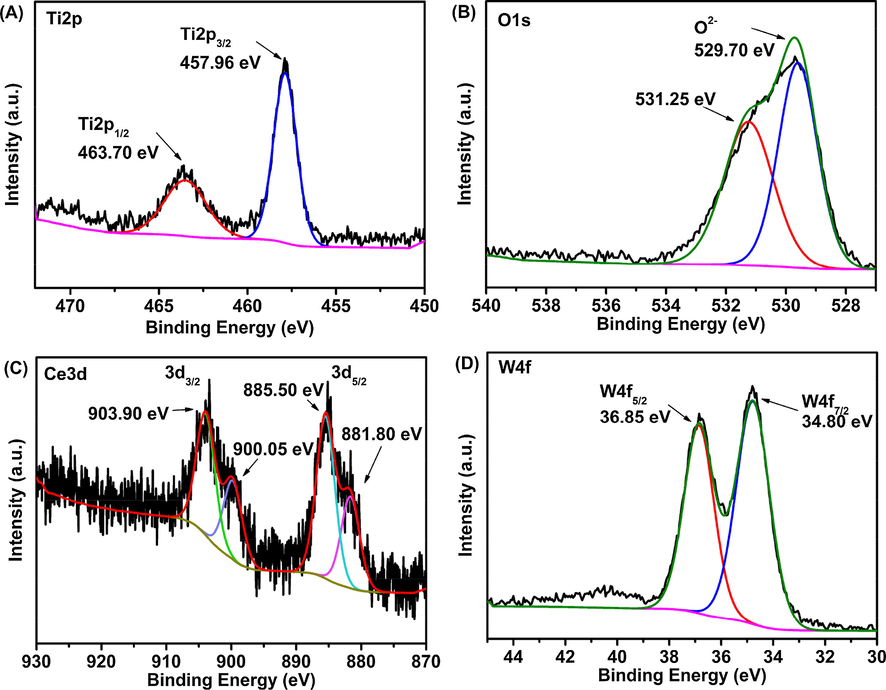
XPS spectra of the HPW/15Ce–TiO2 catalyst (A) Ti 2p; (B) O 1s; (C) Ce 3d; (D) W 4f.
According to result of XRD patterns, no CeO2 crystalline phase appears at HPW/xCe–TiO2 material. Hence, we can conclude that the Ce—O bond is mainly dispersed on the nanoparticles instead of aggregating to form certain ceria phase, which is consistent with XPS results. The W 4f peak can be best fit with two sub-sets of peaks at 36.85 eV and 34.80 eV, corresponded with the W 4f5/2 and W4f7/2 (Fig. 5D). Above result suggest that tungsten are at their highest oxidation state (WVI) in catalyst (Du et al., 2018).
Furthermore, Raman spectroscopy is used to investigate the structural properties of Ce-doped HPW/TiO2 material. As shown in Fig. 6A, the characteristic peaks at 144 (Eg), 197 (Eg), 396 (B1g), 514 (A1g), and 639 (Eg) cm−1 mainly corresponded to anatase TiO2 (Liu et al., 2014). Strong characteristic peak at 144 cm−1 and relatively weak characteristic peaks at 197 cm−1 are related to Eg caused by symmetrical stretching vibration of oxygen atoms in O—Ti—O bond. Additionally; Bg and A1g peaks appear around 400 and 650 cm−1 are caused by the symmetrical bending and antisymmetrical bending vibration of O—Ti—O bond (Arellano et al., 2014). However; no F2g peak of CeO2 at 465 cm−1 occurred, indicating that some Ce ions has entered on inter space of titanium dioxide (Liu et al., 2014); in accordance with the XPS result. Fig. 6B displays deviation of the Raman peaks between 140 and 160 cm−1, Eg peak of anatase TiO2 at 144 cm−1 shifts to high wavelength. The main reason can be ascribed to the larger ionic radius of Ce3+ and Ce4+ than Ti4+. As can be seen from XPS spectra, electron transformation between Ce3+ and Ce4+ can produce oxygen defects or vacancies, which will lead to lattice distortion of material (Xiao et al., 2015; Liu et al., 2014; Watanabe et al., 2009). More oxygen vacancies have formed with higher concentration of Ce3+ which caused by the shift of oxygen ions, thus, lead to deviation of the Raman peaks.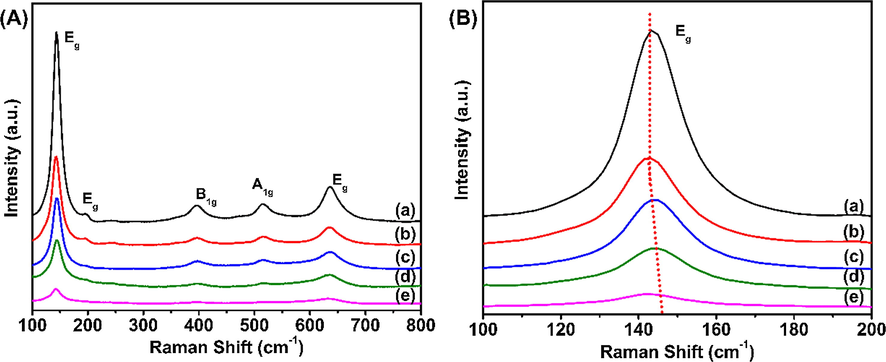
Raman spectra of HPW/TiO2, HPW/5Ce–TiO2, HPW/15Ce–TiO2, HPW/25Ce–TiO2, HPW/30Ce–TiO2 catalysts.
As shown in Fig. 7A, FT-IR spectra of Keggin-type HPW display four typical bands in 983 cm−1 vas (W⚌O) for exterior WO6 octahedron, 1079 cm−1 vas (P—O) for central PO4 tetrahedron, 889 cm−1 vas (W—Ob—W) for corner shared octahedron, and 805 cm−1 vas (W—Oc—W) for edge shared octahedron) (Duncan et al., 1995). However, 400 to 860 cm−1 infrared absorption band of TiO2 overlaps with vas (W—Oc—W) at 805 cm−1, several characteristic peaks of HPW still can be observed between 800 and 1100 cm−1 in all samples. Moreover, UV–vis spectrums of HPW/xCe–TiO2 catalysts also exhibit a trend of deviation with the increment of Ce content. The typical red shift can be attributed to the charge-transfer transition between f orbital electrons in cerium ion and TiO2 conduction or valence band (Kumaresan et al., 2011).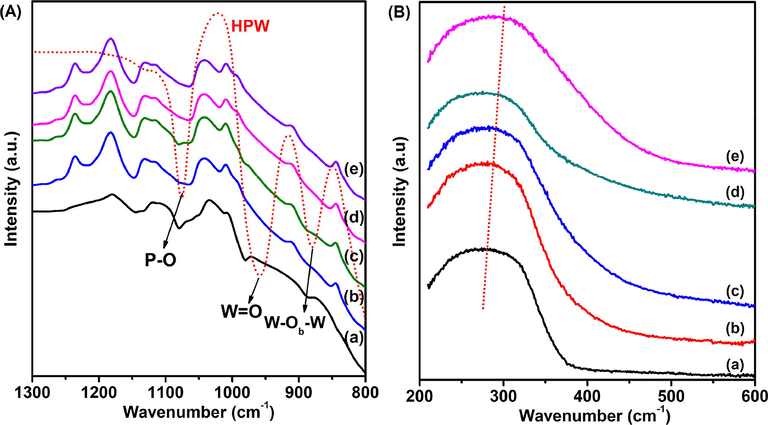
(A) FT-IR spectra and (B) UV–vis spectrums of (a) HPW/TiO2, (b) HPW/5Ce–TiO2, (c) HPW/15Ce–TiO2, (d) HPW/25Ce–TiO2, (e) HPW/30Ce–TiO2 catalysts.
3.2 Oxidative desulfurization performance
The effect of oxygen vacancies on the ODS performance of HPW/xCe–TiO2 catalyst has been examined in ODS system. As can be seen in Fig. 8, HPW/15Ce–TiO2 has the highest catalytic activity among as-prepared catalysts; the DBT removal reaches 99.8% within 40 min. This is related to the increasing Ce3+ or Ce4+ ions on catalyst, leading to more oxygen vacancies on the surface of anatase TiO2, thus resulting in more O-rich sites in the oxidation process (Yan et al., 2012). Moreover, the interconnected 3DOM structure of HPW/15Ce–TiO2 catalyst also plays an important role in the mass transfer process which provides fast transfer channel for DBT to enter the inner surface. The improvement of oxygen vacancies on the surface of 3DOM anatase TiO2 leads to better ODS performance than previously reported catalysts in POM/H2O2 systems (Table S1). However, a downward trend appears with the increasing Ce content, it may be due to the gradually decrease in the crystallization degree.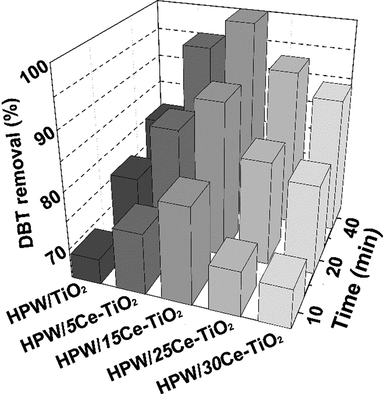
The DBT removal of HPW/TiO2, HPW/5Ce–TiO2, HPW/15Ce–TiO2, HPW/25Ce–TiO2, and HPW/30Ce–TiO2 catalysts; Reaction conditions: catalyst dosage = 0.03 g, T = 60 °C, O/S = 4.
Furthermore, catalytic effects such as catalyst usage, reaction temperature, different thiophene-type sulfide substance, and quantity of oxidant on the ODS performance of HPW/15Ce–TiO2 catalyst are evaluated. As shown in Fig. 9A, significant upward trend can be observed with the increasing catalyst amounts. The curve of DBT removal is close to saturation when the catalyst usage ups to 0.03 g, it suggests that HPW/15Ce–TiO2 catalyst has provided enough amounts of active sites to the ODS process. The conversions of DBT at different temperatures are displayed in Fig. 9B. At relatively low temperature (40, 50, or 60 °C), kinetic limitation act as key factor at sulfide oxidation process (Zhang et al., 2014), the reaction activity of catalyst improves with temperature. Nevertheless, high temperature such as 70 °C is prone to accelerate the thermal decomposition of H2O2, which explains the decreasing-upward trend of DBT removal at 70 °C.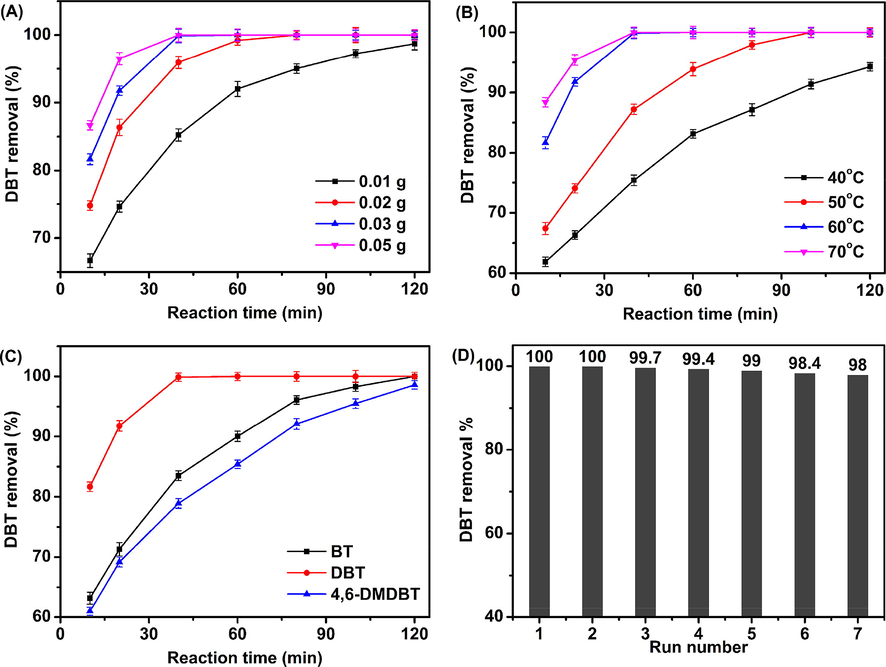
Effects of (A) catalyst dosage, (B) reaction temperature, (C) different substrates, and (D) the recycles on the sulfur removal of HPW/15Ce–TiO2 catalyst; Reaction conditions: catalyst dosage = 0.03 g, T = 60 °C, O/S = 4.
Fig. 9C exhibits the sulfur removal of typical different substrates including DBT, BT, and 4,6-DMDBT. Complete conversion of DBT and BT can be achieved within 2 h, and the sulfur removal efficiency is consistent with the order of DBT > BT > 4, 6-DMDBT (Du et al., 2018). The better catalytic activity for DBT is related to the higher electron densities on the sulfur atoms of DBT (5.758) than BT (5.739) (Otsuki et al., 2000). However, the highest electron density of sulfur atomic on 4, 6-DMDBT (5.760) shows lower sulfur removal rate than DBT and BT, this result should be attributed to the common effects of electron density on the sulfur atoms and steric hindrance of methyl groups of 4,6-DMDBT. HPW/15Ce–TiO2 catalyst is recycled for several times to investigate the reusing potential and stability. As can be seen in Fig. 9D, no observable loss of catalytic activity appeared even after 7 runs. At the same time, the residual content of HPW in spent catalyst is tested by ICP and 18.5% of HPW left after 6 runs and the FTIR spectra of spent catalyst has been tested as well (Fig S1), which suggests that the HPW/15Ce–TiO2 catalyst has excellent regenerability under operating conditions.
Subsequently, the effect of O/S molar ratio on oxidative desulfurization of HPW/15Ce–TiO2 is studied. At stoichiometric ratio (O/S = 2), 15.0% of DBT remains after 2 h, indicating that partial of hydrogen peroxide is decomposed under present reaction conditions. However, a significant downward trend of DBT removal is observed when O/S molar ratio up to 12 or 20. This result is due to the occupation of active sites on the catalyst surface by water, which originates from excessive hydrogen peroxide (Rivoira et al., 2017). In order to investigate the water effect on the ODS performance of catalyst, parallel experiments are carried out by adding certain amount of H2O in hydrogen peroxide (Fig. 10B). The desulfurization efficiency of catalyst decrease with the growth of water content in the model oil, which confirms the result of the reduction of ODS performance at higher mole ratio of O/S.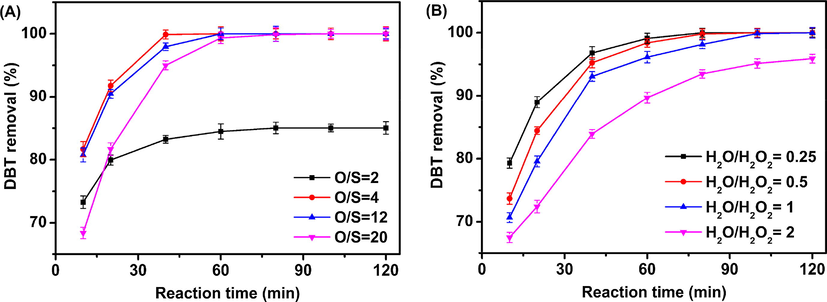
(A) Effects of O/S on the DBT removal of HPW/15Ce–TiO2 catalyst, reaction conditions: catalyst dosage = 0.03 g, T = 60 °C; (B) Effects of water contents on the DBT removal of HPW/15Ce–TiO2 catalyst, reaction conditions: catalyst dosage = 0.03 g, T = 60 °C, O/S = 4.
Reaction kinetics is great important parameters to explain the reactivity of catalyst (Qiu et al., 2015). Hence, reaction kinetics of DBT oxidation reaction has been calculated using concentration determination method (Wu et al., 2016; Yao et al., 2018). The apparent rate constant k under different temperatures are calculated and listed in Table 2. The plot of -In k versus time is displayed in Fig. 11(a), and the R2 value is 0.9524. Hence, it can be concluded that the reaction of oxidation of DBT follows pseudo-first-order kinetics (Xun et al., 2016). According to the Arrhenius equation, apparent activation energy of HPW/15Ce–TiO2 is determined to be 51.79 kJ/mol, which is much higher than our previous work (58.51 kJ/mol) (Du et al., 2018).
Reaction temperature (°C)
Rate constants k (min−1)
Correlation factor R2
40
0.0172
0.9963
50
0.0391
0.9849
60
0.0801
0.9998
70
0.0925
0.9999
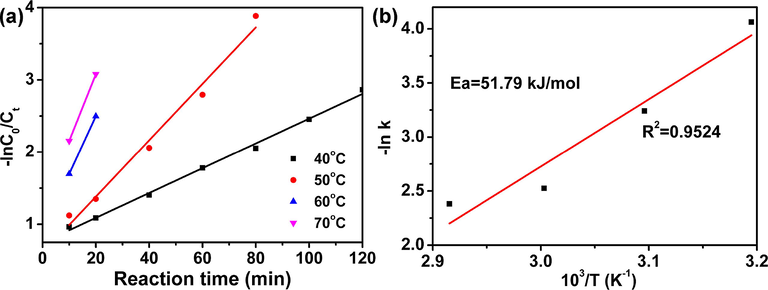
(a) Pseudo-first-order rate constants for oxidation of DBT reaction at different temperature; (b) The apparent activation energy for DBT oxidation.
HPLC-MS analysis is applied to detect the final products of the oxidation of DBT (Fig. S2). The model fuel is withdrawn at 80 min. Nor DBT or sulfoxide can be detected in model oil, only sulfone (DBTO2) is found. Hence, it can be concluded that DBTO2 was the only oxidation product in the oxidation reaction of DBT.
Scheme 1 has revealed the ODS process of 3DOM HPW/xCe-TiO2 catalyst. The oxygen vacancy on the surface of the catalyst plays an important role in the adsorption process of DBT and hydrogen peroxide. As reported by Iwaszuk A et al, the formation of oxygen vacancy on the surface of titanium oxide is related to the electron conversion between Ce3+ and Ce4+ (Iwaszuk and Nolan, 2011). Guo et al. (2012) proved that the introduction of Ce will increase the exposure ratio of {0 0 1} plane of anatase TiO2 and improve the adsorption energy of thiophene. It can be concluded that the 3DOM HPW/xCe-TiO2 catalyst can selectively adsorb the oxidant in order to increase the adsorption of DBT and its derivatives to the catalytic active sites, hence, promote the oxidative desulfurization ability of catalyst reaction (Liu et al., 2014). Moreover, the 3DOM structure of HPW/xCe-TiO2 catalyst provides large enough interconnected pore channel in mass transfer process, which makes DBT molecules easier to enter the internal pores and approach the active sites, thus further improving the catalytic efficiency of the catalyst.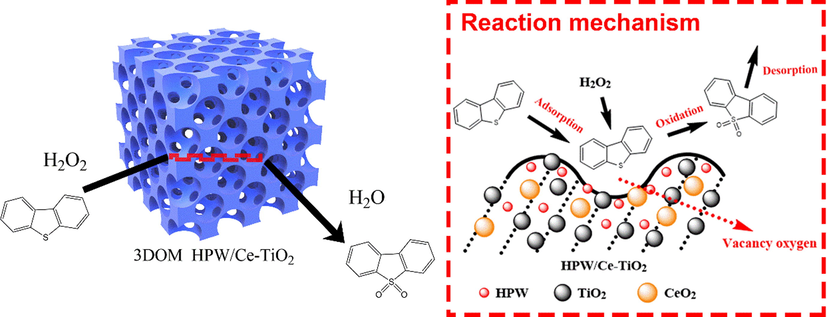
Schematic diagram of catalytic oxidation desulfurization process of 3DOM Ce-doped HPW/TiO2 material.
4 Conclusion
In this study, 3DOM HPW/xCe-TiO2 material has been successfully obtained by colloidal crystal template method. Interconnected macroporous structure can be observed on a large scale, with Keggin type HPW dispersed homogeneously on the titanium dioxide skeleton. Meanwhile, the as-synthesized catalysts showed different ODS performance of DBT, which greatly affected by the ratio of the Ce content catalyst. Under identical test conditions (catalyst = 0.03 g, T = 60 °C, O/S = 4), HPW/15Ce–TiO2 catalyst exhibits the best catalytic oxidation activity of DBT in heteropoly acid/hydrogen peroxide system, which removes 500 ppm of DBT completely within 40 min. The apparent activation energy is calculated to be 51.79 kJ/mol. The existence of Ce3+ and Ce4+ will facilitate the formation of O-rich sites in the oxidation process, which can selectively adsorb the oxidant and increase the adsorption of DBT. However, excessive Ce content on 3DOM HPW/xCe-TiO2 catalyst will cause lattice contraction of TiO2, thus, restraint the phase transition from titanium dioxide to anatase. The combination of 3DOM structure and proper doping amount of Ce on HPW/xCe-TiO2 catalyst can effective improve the mass transfer of reactants and promote the adsorption behavior of the oxidant, respectively, which leads to the improvement of catalytic activity of 3DOM HPW/xCe-TiO2 catalyst.
Acknowledgements
This work was supported by the National Nature Science Foundation of China (Grant No. 21476177, 51502218).
References
- J. Environ. Chem. Eng.. 2017;5:1645-1656.
- Fuel.. 2014;126:16-25.
- Micropor. Mesopor. Mat.. 2010;131:289-293.
- Appl. Surf. Sci.. 2015;356:115-123.
- Fuel.. 2016;180:127-136.
- Sustain. Environ. Res.. 2016;26:184-190.
- Micropor. Mesopor. Mat.. 2018;264:272-280.
- Fuel.. 2018;226:148-155.
- Mater. Res. Bull.. 2018;105:210-219.
- J. Wuhan Univ. Technol.. 2018;33:849-854.
- J. Am. Chem. Soc.. 1995;117:681-691.
- Fuel. Process. Technol.. 2015;130:214-223.
- J. Mater. Sci-Mater. El.. 2016;27:11866-11872.
- Appl. Catal. A-Gen.. 2006;305:15-20.
- Langmuir. 2017;33:6601-6610.
- J. Phys. Chem. C.. 2012;116:3457-3466.
- J. Phys. Chem. C.. 2011;115:12995-13007.
- J. Mater. Chem. A.. 2014;2:9699-9708.
- J. Catal.. 2006;238:430-440.
- J. Hazard. Mater.. 2011;186:1183-1192.
- Appl. Surf. Sci.. 2018;439:1026-1033.
- Electrochim. Acta. 2016;214:103-109.
- J. Phys. Chem.. 2017;C.121:25795-25804.
- Inorg. Chem.. 2018;57:13009-13019.
- Micropor. Mesopor. Mat.. 2011;139:87-93.
- Appl. Catal. B.. 2014;160:684-691.
- Ultrason. Sonoche.. 2014;21:970-974.
- Appl. Organomet. Chem.. 2018;32:e40822
- Green. Chem.. 2018;20:4381-4568.
- Energ. Fuel. 2008;22:3303-3307.
- Monticello, D.J., 2000. Elsevier Ltd., England, 11, pp. 540–546.
- Phys. B: Condensed Matter.. 2012;407:2915-2918.
- Energ. Fuel. 2000;14:1232-1239.
- Energ. Fuel. 2018;32:10898-10903.
- Rsc. Adv.. 2018;8:7579-7587.
- Fuel.. 2015;147:195-202.
- Catal. Today. 2017;282:123-132.
- Catal. Today. 2009;144:13-18.
- J. Phys. Chem. C.. 2009;113:14249-14257.
- J. Mater. Chem. A.. 2013;48:15491-15500.
- Chem. Commun.. 2016;52:144-147.
- AIChE J.. 2015;61:631-639.
- Ind. Eng. Chem. Res.. 2014;53:19895-19904.
- Chem. Eng. J.. 2016;288:608-617.
- Catal. Sci. Technol.. 2013;3:1985-1992.
- Energ. Fuel. 2012;26:5879-5886.
- Ind. Eng. Chem. Res.. 2018;58:863-871.
- J. Porous. Mat.. 2019;26:133-144.
- Appl. Catal. B.. 2009;91:11-20.
- Fuel.. 2018;219:103-110.
- Chem. Eng. J.. 2014;245:65-70.
- Chem. Commun.. 2010;46:457-459.
- Chem. Eng. J.. 2013;220:328-336.
- Chem. Eng. J.. 2013;220:328-336.
- Green. Chem.. 2015;20:2464-2494.
- New J. Chem.. 2017;41:8382-8389.
Appendix A
Supplementary material
Supplementary data to this article can be found online at https://doi.org/10.1016/j.arabjc.2019.06.002.
Appendix A
Supplementary material
The following are the Supplementary data to this article:Supplementary data 1
Supplementary data 1


