

Translate this page into:
Quality uniformity evaluation of Babao Dan capsule based on its 14 main chemical compounds and in vitro anti-inflammatory activity
⁎Corresponding authors at: Institute of Chinese Materia Medica, China Academy of Chinese Medical Sciences, No.16, Nanxiaojie, Dongzhimennei, Beijing 100700, China. yliu1980@icmm.ac.cn (Yan Liu), aliu@icmm.ac.cn (An Liu)
-
Received: ,
Accepted: ,
This article was originally published by Elsevier and was migrated to Scientific Scholar after the change of Publisher.
Abstract
Abstract
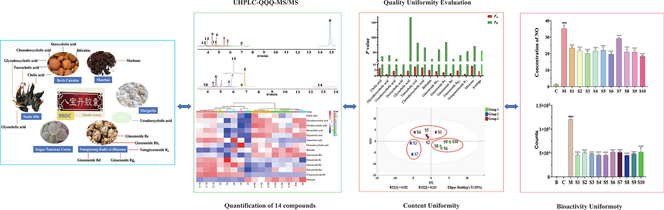
The Quality Uniformity Evaluation strategy was adopted to evaluate the consistencies of Babao Dan capsule (BBDC). An optimized UHPLC–QQQ–MS/MS method was developed to simultaneously determine the 14 main compounds of BBDC. The 10 batches were divided into three categories based on the inter–batches consistency. The anti-inflammatory activities of BBDC were studied and clearly distinguished in vitro by RAW264.7 and NF-ĸB-RE-luc HEK293 cells. The correlation analysis confirmed that the main chemical compounds related to anti-inflammatory activity in BBDC.
Abstract
Babao Dan capsule (BBDC) is a state secrecy traditional Chinese medicine patent prescription (TCMPP) that is widely used for hepatobiliary and urinary diseases. However, its quality uniformity evaluation (QUE) is lacking. It is necessary to develop a novel and multi–dimensional QUE strategy for BBDC based on chemical properties and bioactivities. An ultrahigh performance liquid chromatography–triple quadrupole–mass spectrometry (UHPLC–QQQ–MS/MS) was developed to quantify 14 compounds, and a QUE strategy was to assess intra–batch and inter–batches consistency. Furthermore, the anti-inflammatory activities were measured in vitro by RAW264.7 cell and NF-κB-RE-luc HEK293 cell. The results indicated that 14 compounds from 16 samples (10 batches) were accurately quantified. And the intra–batch consistency values were less than or equal to 20.1%, whereas the largest inter–batches consistency value was 167.5% of glycocholic acid. 10 batches were divided into three categories to distinction inter–batches differences. BBDC had anti-inflammatory activities including inhibition of LPS–induced NO production and TNF α–activated luciferase counts. The NO inhibition difference of 10 batches was 10.87 μM and accounted for 49.8%. Briefly, the anti-inflammatory activities of 10 batches were different, but the dynamic trends within the same batch were similar, which was supported by luciferase counts. And the correlation was confirmed that the main compounds related to anti-inflammatory in BBDC were bile acids and saponins. Hence, a QUE strategy for BBDC was proposed to improve quality and ensure efficacy. This strategy can be utilized as a reference for consistency evaluations of TCMPPs.
Keywords
Babao Dan capsule
Quality uniformity evaluation
UHPLC–QQQ–MS/MS
Anti-inflammatory

1 Introduction
Babao Dan capsule (BBDC), a well-known traditional Chinese medicine patent prescription (TCMPP) and a national confidential prescription, has a long medical history originating from the Ming Dynasty (Lu et al., 2020). It contains several rare Chinese medicinal substances, such as Bovis Calculus, Snake Bile, Saigae Tataricae Cornu, Margarita, Notoginseng Radix et Rhizoma, and Moschus. BBDC is widely used to clear damp heat, promote blood circulation and detoxification, and eliminate yellowing pain. In clinical settings, it is mainly used to treat various liver, gallbladder, and urinary system diseases. In the past few years, the clinical value of BBDC has been elucidated, and it has been found that BBDC exhibits antitumor activity; moreover, it has been clinically used as an adjuvant treatment for various cancers, such as liver, gastric, and non-small-cell lung cancers (Lan et al., 2021; Lu et al., 2020; Wang et al., 2019). Meanwhile, during the process of treatment, BBDC has been shown the good therapeutic effect and fewer side effects (Liang et al., 2023; Ren et al., 2023). The highly beneficial clinical value of BBDC has attracted attention to further assess its quality and biological activities.
It is widely known that the therapeutic efficacy of traditional Chinese medicine (TCM) relies on the synergism of multiple compounds. Hence, in the link of quality control, the requirements of multiple compounds are particularly important. However, in the current standard protocols of BBDC, only individual compound has been analyzed and controlled, which cannot effectively reflect the quality of the medication as whole, and therefore it is challenging to ensure the safety and effectiveness of the medication. Thus, for controlling and enhancing the quality of BBDC, it is more advantageous to utilize multiple compounds as quality indicators. In 2016, an ultrahigh performance liquid chromatography–quadrupole time–of–flight–mass spectrometry (UHPLC–QTOF–MS) method was established to identify a total of 78 chemical compounds from BBDC, including saponins, bile acids, amino acids, and macromolecular cyclic ketones (Li et al., 2016). In 2022, Sheng et al. (Sheng et al., 2022) identified 85 chemical compounds from BBDC, including 24 cholic acids, 33 saponins, and 15 fatty acids, using the newly established UHPLC–QTOF–MS method. These qualitative studies clarified the chemical compounds of BBDC. However, for high-quality development of TCM, determining the quantity of various compounds is also necessary. Of these previously identified compounds, 43 compounds in 11 batches of BBDC were quantified using the ultrahigh performance liquid chromatography–triple quadrupole–mass spectrometry (UHPLC–QQQ–MS/MS) method in 2021 (Cheng et al., 2021). However, although this quantification method was more advanced and an increasing number of compounds have been verified, discrepancies between the quality of different batches of BBDC and quality uniformity were absent, and its impact on pharmacological activity has not been addressed and studied.
As a complex TCM preparation, BBDC contains a wide variety of compounds, which vary greatly in polarity and content, with no characteristic UV absorption for most compounds, which makes the development of a quantitative analysis method challenging (Wu et al., 1996). The UHPLC–QQQ–MS/MS method is rapid and highly sensitive. It has the characteristics of a universal detector and can effectively overcome the difficulty of multicompounds coelution in the TCM. The dynamic multi reaction detection scanning mode can be used to improve the sensitivity and accuracy of quantification. In recent years, this method has been adopted as a powerful technical analysis tool for the quality control of TCM-containing phytochemical compounds(Hu et al., 2021; Liu et al., 2021; Yang et al., 2021).
The batch-to-batch quality variability of TCM is a critical issue for achieving stable efficacy and safety. Increased attention is now being paid to TCM decoction pieces; however, only a few studies have focused on the uniformity of TCMPP. The quality consistency evaluation strategy of TCMPP (Zhao et al., 2020; Zhao et al., 2022) was proposed by our team and it was aimed at evaluating intra–batch and inter–batches quality consistencies, compensating for the current deficit in the research and promoting the development of high quality for TCM. An increasing number of valuable evaluation methods have been developed with these new analytical techniques. These methods include fingerprint analysis, a quantitative and scientific comprehensive approach for authentication and quality uniformity assessment (Zhang et al., 2021). Chromatographic techniques combined with patterns, including similarity analysis, hierarchical clustering analysis (HCA), principal components analysis (PCA), and orthogonal partial least squares discrimination analysis (OPLS-DA), have been used to evaluate and classify batches to screen for the desired markers in TCM (Li et al., 2021)(Li et al., 2021). The evaluation method should not only focus on evaluating the function of TCM but also on guiding the improvement of the quality of TCM and needs to be evaluated by intra–batch and inter–batches homogeneity. To date, there are no reports on the quality uniformity evaluation (QUE) strategy across multiple compounds of BBDC.
Regarding the clinical application and biological activity of BBDC, a previous study demonstrated that BBDC could control excessive immune responses and may represent a cytokine-targeted agent suitable for COVID-19 treatment (Qian et al., 2021). BBDC inhibits cell growth by inducing autophagy through the PI3K/AKT/mTOR pathway and enhances the antitumor effects of cisplatin in non-small cell lung cancer cells (Zhao et al., 2021). In addition, BBDC inhibits lymphangiogenesis of gastric cancer in vitro and in vivo via the lncRNA-ANRIL/VEGF-C/VEGFR-3 signaling axis. Network pharmacology analysis was performed to predict the potential targets and pathways regulated by BBDC, and the pathways related to cancer, P13K-Akt signaling, and inflammatory bowel disease were listed as the top relevant pathways that contained most genes with a low P-value (Wang et al., 2019). In conclusion, several studies have demonstrated the significant anti-inflammatory activities of BBDC.
To scientifically and comprehensively determine the manufacturing quality of BBDC, a multidimensional QUE strategy was developed, which included investigation of chemical compound quality differences and in vitro biological activity based on intra–batch and inter–batches consistencies. An efficient and selective UHPLC–QQQ–MS/MS method was established to quantify 14 compounds from four prescriptions. Chemometrics were used to further evaluate the quality of the samples according to the QUE strategy. The bioactivities of BBDC were studied in vitro by the lipopolysaccharide (LPS)-induced-murine macrophage cell line RAW264.7 and luciferase inhibited counts based on the NF-ĸB-RE-luc HEK293. The scientific data generated in this study can be used to objectively evaluate the manufacturing quality of the sample and provide guidance and a reference for further quality improvement of BBDC and other TCMs.
2 Material and methods
2.1 Chemical reagents and reference standards
Acetonitrile (high performance liquid chromatography [HPLC] grade), methanol (HPLC grade), and formic acid (purity 99%) were obtained from Sigma–Aldrich (St. Louis, MO, USA). Other analytical grade chemicals were obtained from Beijing Chemistry Factory (Beijing, China). Millipore membranes (0.22 μm) were purchased from Beijing Alltech Biological Products Co., Ltd. (Beijing, China). Ultrapure water was prepared using a Mill-Q SP system (Millipore Co., Bedford, MA, USA).
Reference standards of cholic acid, ginsenoside Re, ginsenoside Rd, and corkone were purchased from National Institutes for Food and Drug Control (Beijing, China), and ginsenoside Rg1, ginsenoside Rb1, and obacunone internal standard (IS) were purchased from National Institute for the Control of Pharmaceutical and Biological Products. Glycodeoxycholic acid, chenodeoxycholic acid, taurocholic acid, and bilirubin were purchased from Jiangxi Baicaoyuan Bio-Technology Co., Ltd (Jiangxi, China). Ursodeoxycholic acid, deoxycholic acid, notoginsenoside R1, and muscone were purchased from Chengdu Push Bio-Technology Co., Ltd. (Chengdu, China). The purity of these compounds was greater than 98.0% (as determined via HPLC). The structures of the abovementioned 14 compounds and 1 IS were shown in Fig. 1. Ten batches of BBDC (batch numbers: 190301, 190401, 190704, 190901, 200203, 190502036, 190805017, 200401115, 190502038, and 190504045) were produced by and obtained from Xiamen Traditional Chinese Medicine Co., Ltd. These were defined as S1–S10.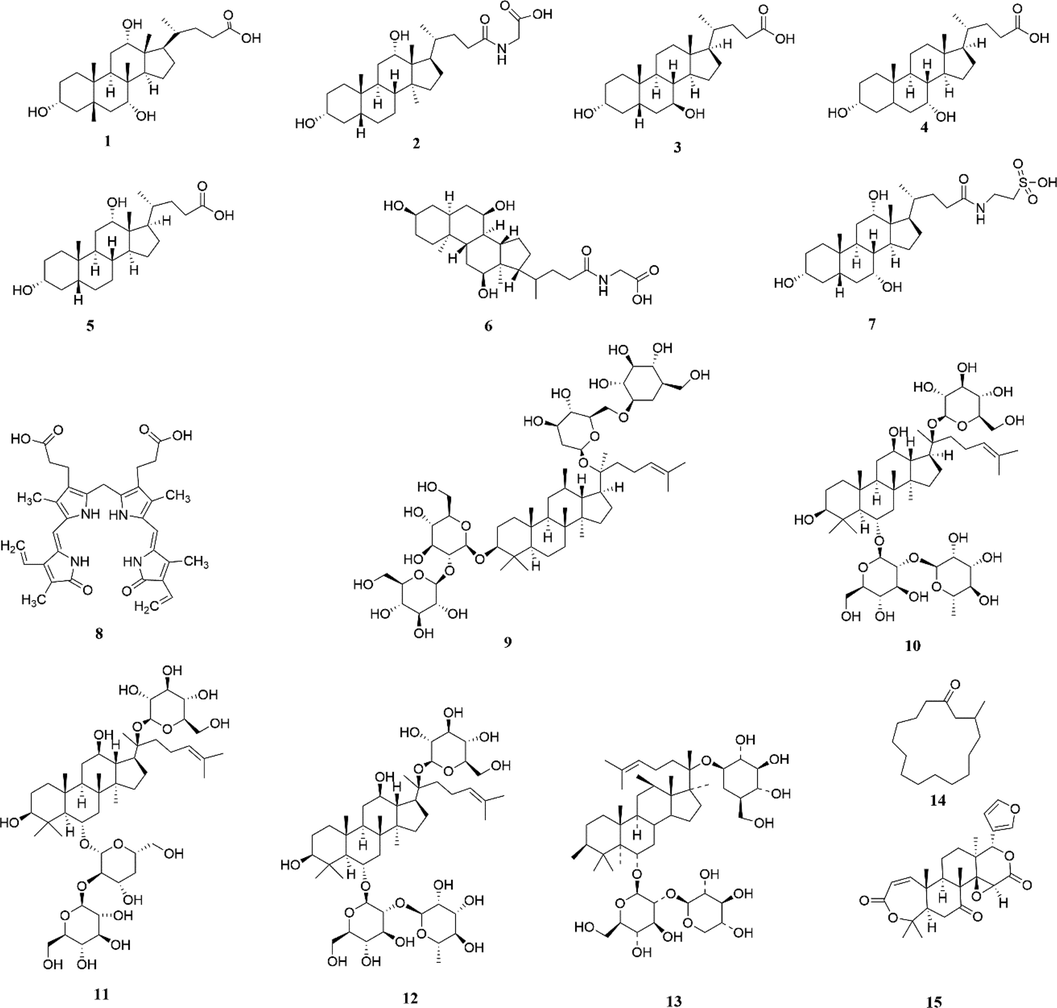
Chemical structures of 14 compounds in BBDC and one internal standard (IS). 1. Cholic acid; 2. Glycodeoxycholic acid; 3. Ursodeoxycholic acid; 4. Chenodeoxycholic acid; 5. Deoxycholic acid; 6. Glycocholic acid; 7. Taurocholic acid; 8. Bilirubin; 9. Ginsenoside Rb1; 10. Ginsenoside Re; 11. Ginsenoside Rd; 12. Ginsenoside Rg1; 13. Notoginsenoside R1; 14. Muscone; 15. Obacunone (IS).
2.2 Preparation of standard and sample solutions
Standard stock solutions of glycocholic acid, cholic acid, deoxycholic acid, taurocholic acid, ursodeoxycholic acid, glycodeoxycholic acid, chenodeoxycholic acid, ginsenoside Re, notoginsenoside R1, ginsenoside Rd, ginsenoside Rg1, ginsenoside Rb1, and muscone were prepared by gently dissolving the weighed samples of each compound in methanol. Bilirubin standard stock was prepared in solvent 1 (chloroform: ethanol; 7:3). The standard stock solution concentrations of the abovementioned 14 compounds were 0.05, 0.25, 0.06, 0.15, 0.05, 0.025, 0.025, 0.05, 0.1, 0.1, 0.5, 0.5, 0.01 and 0.1 mg/mL, respectively. Subsequently, the standard solution was obtained by precisely combining the above 14 stock solutions with solvent 2 (chloroform: dimethyl sulfoxide: methanol; 1:1:2), to provide the concentrations of 2.0, 5.0, 2.5, 4.5, 1.5, 1.0, 1.0, 2.0, 4.0, 2.5, 4.5, 8.5, 0.5, and 3.0 μg/mL, respectively. The obacunone (IS) solution was prepared in methanol at a concentration of 4.0 μg/mL. All standards solutions were stored at 4 °C.
Solvent 2 (100 mL) was added to 50 mg of powdered BBDC and sonicated (40 kHz, 600 W) for 45 min. The solution was allowed to cool and weighed to replenished with solvent 2, and the solution was mixed well. This extract was filtered through a 0.22 μm syringe filter. The filtrate was used as test solution A (TS-A). Test solution B (TS-B) was obtained by diluting TS-A five times. Both test solutions were combined with the IS solution at a ratio of 10:1 before analysis.
2.3 UHPLC–QQQ–MS conditions
An Agilent 1290 Infinity UHPLC system (Agilent Technologies, MA, USA) equipped with an Agilent G1329A auto sampler and triple quadrupole mass spectrometry was used. The analytical column used in this study was a Waters Acquity UPLC BEH C18 column (2.1 mm × 100 mm, 1.7 μm, USA). The column temperature was maintained at 45 °C. The mobile phases consisted of 0.1% (v/v) aqueous formic acid solution (phase A) and acetonitrile (phase B) at a flow rate of 0.3 mL/min, using a gradient elution program as follows: 5%–35% B at 0–2.5 min, 35%–50% B at 2.5–3 min, 50% –80% B at 3–10 min, 80%–95% B at 10–20 min, and re-equilibrated by 5% B for 3 min.
All MS experiments were conducted using an electrospray ionization source in the positive ion electrospray mode with a 6460B UHPLC–QQQ–MS (Agilent, USA). The optimal MS conditions were as follows: drying gas temperature: 350 °C; drying gas flow rate: 8 L/min; nebulizer gas pressure: 45 psi; sheath gas temperature: 300 °C; and sheath gas flow: 11 L/min. Detection was performed in the dynamic multiple reaction monitoring (DMRM) mode. All data were processed using the MassHunter Workstation software (V.7.0 Quantitative Analysis; Agilent, USA).
2.4 Method validation
To evaluate the sensitivity and precision of the established UHPLC–QQQ–MS/MS method, the linearities, limits of detection (LOD), limits of quantitation (LOQ), precisions, and recoveries of the 14 analytes were tested. The calibration curves of each compound were constructed by plotting the peak areas against the concentrations using the mixed standard solution in a concentration series. Precisions were determined by calculating the intra–day and inter–day variations in each analyte using the mixed standards for six replicates for three consecutive days. The LOD and LOQ for each analyte were estimated at a signal-to-noise ratio (S/N) of approximately 3 and 10, respectively. The accuracy of the established method was assessed through spiked-in recovery experiments. A known amount (equal to the content of each analyte in the sample) of the mixed standards was spiked into the sample (S1). The sample was prepared with six replicates and analyzed using the method detailed above. The recovery (%) was calculated using the following eq. (1):
2.5 Cell culture
The murine macrophage cell line RAW264.7 was saved at nitrogen canister in our laboratory and maintained in a humidified incubator containing 5% CO2 (v/v) at 37 °C in Dulbecco’s Modified Eagle Medium (Gibco, China, 8122037), supplemented with 10% (v/v) fetal bovine serum (Gibco, Australia, 2115802RP).
2.6 Cell viability and NO assay
To investigate the effect of BBDC on cell viability, RAW264.7 cells were seeded into 96-well plates (5 × 10³ cells/well) and treated with different concentrations of BBDC and LPS for 24 h. Cells without treatment were used as the control. Subsequently, cell viability was evaluated using a CCK-8 assay (Biosharp, China, 22011467) following the manufacturer’s instructions.
The production of NO was determined by the presence of its end product, i.e., nitrite, in the cell culture supernatant. Cells were pretreated with various samples of BBDC (150 μg/mL) for 2 h prior to exposure to LPS (1 μg/mL). Cells without any treatment were used as the control. After stimulation for 24 h, the NO in the culture media secreted by cells was measured at 540 nm within 15 mins of combining the supernatant with Griess (Sigma, USA, 1003486251) reagent.
2.7 Nuclear factor-ĸB (NF-ĸB) activity analysis
NF-ĸB response elements (NF-ĸB-REs) and luciferase gene were transfected into the HEK293 cell line (NF-ĸB-RE-luc HEK293). Then, 1 × 10⁴ cells/well were seeded into a 96-well plate, NF-ĸB activities were induced with 100 ng/mL human tumor necrosis factor α (TNF-α) (RD systems, USA) for 5 h, and BBDC was added along with TNF-α. Luciferase assay reagent (Promega, USA) was added into the wells and luminescence was measured using a luminometer.
2.8 QUE strategy
For TCMs, the greatest challenge and difficulty is determining a suitable method to ensure quality uniformity among different individual samples or batches by selecting appropriate chemical markers for active substances that compose complex mixtures. As of yet, the national Medical Products Administration has not issued a unified approach to address this concern. Appropriate guidance for the industry still demands that uniformity be determined independently on a case-by-case basis. Therefore, for the initial stage of QUE of TCMs, it was more feasible to consider the quality uniformity of different individual samples or batches. The individual samples selected from the same batch were used to compare the content of main compounds; stable content of compounds within the same batch was the key for quality control and high-quality development of TCM, especially TCMPP. In addition, different batches were selected to determine whether the products from different batches and the same manufacturer were uniform based on the content of the main compounds, bioactivity, etc.
The QUE included intra–batch and inter–batches consistencies, represented by PA and PB, respectively, which was parallel with the method previously proposed (Zhao et al., 2022). PA represents the difference in the values of the content of the main compounds or bioactivities within a batch. Three individuals from the same batch were selected for PA. PB represents the difference in the values of the content of main compounds and bioactivities among 10 different batches. The specific calculation formula of the TCMPP consistency is shown in eq. (2), which can be used to calculate the content, bioactivity, or others.
2.9 Statistical analysis
All data were presented as means ± standard deviation (SD) using one–way ANOVA to determine significant differences between multiple groups. Results were considered statistically significantly different at P < 0.05. The quantification and statistical analysis of the images were performed using GraphPad Prism 8.0.2.
3 Results and discussion
3.1 Selection of quantitative compounds
According to the published formula of BBDC, six kinds in BBDC are shown in Fig. 2. The composition of the BBDC types is diverse, containing phytomedicine (Notoginseng Radix et Rhizoma), mineral drugs (Margarita), and animal medicines (Bovis Calculus, Snake Bile, Saigae Tataricae Cornu, and Moschus). The combination of various prescription medicines plays a synergistic role. For stable clinical application, the quality control of BBDC should cover all prescription medicines as far as possible, and control standards should be established for the main and potential active compounds. In BBDC, three medicines were recorded in the Chinese Pharmacopoeia 2020 edition along with the main compounds for content determination (Chinese Pharmacopoeia Commission, 2020). Cholic acid and bilirubin are the required compounds to quantify for the raw material Bovis Calculus. Three saponins that originate from Notoginseng Radix et Rhizoma were used to determine the national standard, including notoginsenoside R1, ginsenoside Rb1, and ginsenoside Rg1. Muskone is a main compound that controls the content of Moschus. In this study, more comprehensive and abundant main compounds were identified and determined.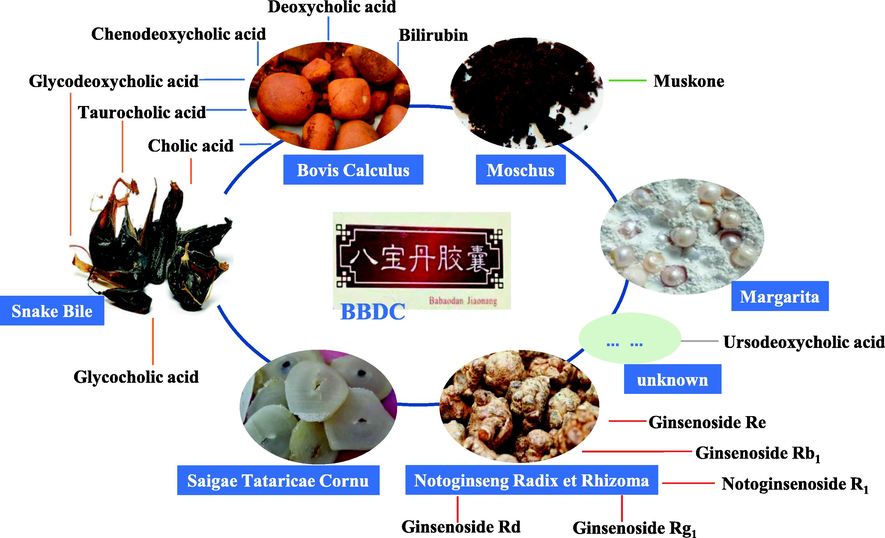
Composition of prescription medicines and source of quantitative compounds in BBDC.
In addition to the requirements of the Chinese Pharmacopoeia 2020 edition, more main compounds with their corresponding bioactivity should be provided for BBDC quality control determination. The role of taurocholic acid from Bovis Calculus and Snake Bile in BBDC is mainly to reduce capillary permeability of inflammatory tissue; inhibit inflammatory swelling; and inhibit the production of NO, PGE2, histamines, and other inflammatory mediators (Ge et al., 2023). Glycodeoxycholic acid induces hepatocyte apoptosis and exists in the Bovis Calculus and Snake Bile (Wu et al., 2022). Chenodeoxycholic acid and deoxycholic acid from the Bovis Calculus were confirmed as quality control compounds for BBDC; the former was used to inhibit the formation of cholesterol in clinical application and the latter was used to promote the secretion of bile and improve the related biliary tract functions (Apro et al., 2015; Guan et al., 2022). Glycocholic acid from Snake Bile enhances lipase activity, catalyzes fat decomposition, and promotes biliary secretion (Heianza et al., 2022). Two additional saponins from Notoginseng Radix et Rhizoma, namely, ginsenoside Rd and ginsenoside Re, were also added as quantitative indicators; moreover, these saponins exhibit cardiovascular and kidney protective functions as well as antitumor, immune regulatory, and other pharmacological effects (Zhou et al., 2016). In brief, 14 compounds from four medicines of BBDC were confirmed as quantitative indicators, and a UHPLC–QQQ–MS/MS method was established.
3.2 Optimization of the DMRM conditions
The parameters of fragmentor voltage and collision energy were optimized to obtain the richest relative abundance of parent ions and outputs for the optimization of the DMRM conditions. In addition, the DMRM transitions and parameters of the 14 main compounds and 1 IS were shown in Table 1.
No.
Compounds
Rt (min)
Precursor Ion (m/z)
Product Ion (m/z)
Fragmentor Voltage (V)
Collision Energy (eV)
1
Cholic acid
5.39
391.30
355.3
74
8
2
Glycodeoxycholic acid
5.67
450.30
414.4
103
5
3
Ursodeoxycholic acid
5.50
415.30
415.3
260
10
4
Chenodeoxycholic acid
6.67
357.10
95.0
250
34
5
Deoxycholic acid
6.90
357.10
95.0
250
34
6
Glycocholic acid
4.74
466.30
412.4
103
17
7
Taurocholic acid
4.43
533.45
516.1
93
9
8
Bilirubin
14.94
585.40
299.1
156
24
9
Ginsenoside Rb1
4.35
1131.30
365.2
370
54
10
Ginsenoside Re
3.86
969.40
789.5
370
60
11
Ginsenoside Rd
4.68
969.40
789.5
378
56
12
Ginsenoside Rg1
3.86
823.48
203.1
160
40
13
Notoginsenoside R1
3.72
955.70
775.3
372
45
14
Muskone
12.79
239.30
95.0
84
15
15
Obacunone (IS)
5.86
477.20
433.2
290
17
3.3 Optimization of the extraction conditions
To completely extract the compounds, various extraction conditions were explored. In the preliminary experiment, the extraction time and solvent were investigated, and the extraction methods including ultrasonic and reflux were compared. It was found that there was no significant difference between them. The ultrasonic extraction method was selected as the extraction method to be used in the study as the process was relatively simple and environmental friendly. In addition, various extraction solvents, such as methanol–water solution (v/ v 70%; 50%; 30%; 10%), methanol, ethanol, acetonitrile, and solvent 2, were investigated. By comparing the peak areas of the 14 main compounds in the different extraction solvents (Fig. 3), it was observed that solvent 2 had the best extraction ability, whereas acetonitrile had the worst. In addition, both the highly polar compounds (saponins) and weakly polar compounds (Bilirubin) were well dissolved in solvent 2.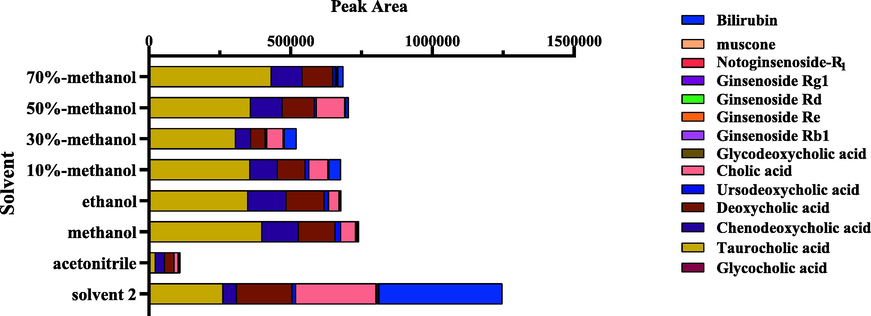
Peak areas of 14 main compounds by different types of extraction solvents.
3.4 Methodology validation
3.4.1 Specificity
The peaks of the 14 main compounds and IS presented with good separation based on the chromatographic and MS conditions mentioned above. The DMRM chromatograms for a blank test sample, mixed standard solution, and sample of BBDC are shown in Fig. 4A-C. The extracted ion chromatogram of the 14 main compounds is shown in Fig. 4D-E. These results indicate that the method was highly selective.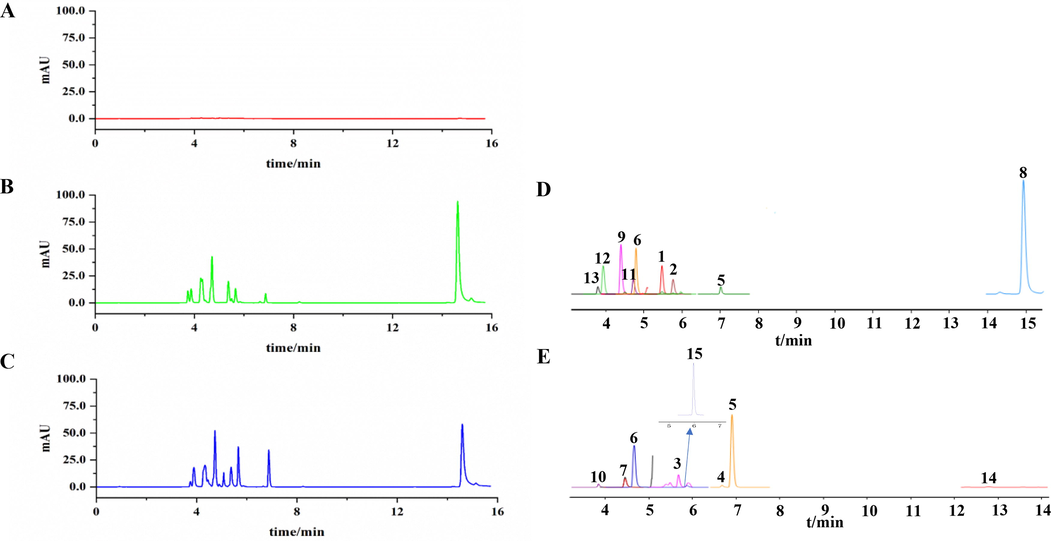
DMRM spectrograms of established quantified method for BBDC. A. the blank test sample; B. a mixed standard solution, C. BBDC sample; D and E. ion chromatograms of DMRM (1. Cholic acid; 2. Glycodeoxycholic acid; 3. Ursodeoxycholic acid; 4. Chenodeoxycholic acid; 5. Deoxycholic acid; 6. Glycocholic acid; 7. Taurocholic acid; 8. Bilirubin; 9. Ginsenoside Rb1; 10. Ginsenoside Re; 11. Ginsenoside Rd; 12. Ginseng Saponins Rg1; 13. Notoginsenoside R1; 14. Muscone; 15. Obacunone, IS).
3.4.2 Linearity, LOD, and LOQ
The linearity study was conducted by diluting each stock solution in a concentration series. The calibration curves were constructed for at least six of the different concentrations which were performed in triplicate. The linear calibration curve with r, linearity range, LOD, and LOQ values were listed in Table 2. The calibration curves for all the main compounds were constructed by plotting the ratio of the chromatography peak areas of the standard and IS (Y-axis) versus the corresponding concentration of the injected standard solutions (X-axis) using a linear least squares regression model. All calibration curves showed good linear regression (r ≥ 0.9950) for the tested ranges. The LOD (S/N = 3) and LOQ (S/N = 10) for the 14 main compounds were in the range of 0.26–27.34 and 0.88–91.15 ng/mL, respectively.
Compounds
Standard curve
r
Linear range (μg/mL)
LOD (ng/mL)
LOQ (ng/mL)
Cholic acid
y = 0.0054x + 0.2800
0.9983
0.0979–5.8734
10.31
34.36
Glycodeoxycholic acid
y = 0.1691x – 22.0730
0.9967
0.0086–1.0697
1.08
3.59
Ursodeoxycholic acid
y = 0.0042x − 0.3046
0.9982
0.0485–6.0640
27.34
91.15
Chenodeoxycholic acid
y = 0.0012x – 0.3530
0.9950
0.0656–2.7371
13.63
45.44
Deoxycholic acid
y = 0.0139x – 3.4261
0.9977
0.1790–2.2350
3.93
13.10
Glycocholic acid
y = 0.0327x − 2.9248
0.9989
0.0295–3.7332
0.87
2.89
Taurocholic acid
y = 0.0015x – 0.1176
0.9994
0.2619–3.2759
4.98
16.60
Bilirubin
y = 0.1532x + 10.7520
0.9977
0.0786–1.9631
0.26
0.88
Ginsenoside Rb1
y = 0.0076x – 1.6751
0.9992
0.0339–4.2370
1.01
3.37
Ginsenoside Re
y = 0.0014x −0.0357
0.9960
0.0148–1.8527
2.43
8.09
Ginsenoside Rd
y = 0.0146x − 0.4611
0.9957
0.0163–2.0532
2.60
8.67
Ginsenoside Rg1
y = 0.0024x − 0.4193
0.9959
0.1102–6.6100
8.23
27.44
Notoginsenoside R1
y = 0.0049x − 0.2351
0.9990
0.2913–3.6380
0.98
3.27
Muskone
y = 0.0005x + 0.0115
0.9996
0.0661–1.6528
12.78
42.60
3.4.3 Precision, stability, repeatability, and recovery
The precision of the method was assessed using mixed standard solutions during a single day (Table A.1-A.4), where the relative standard deviation (RSD) values were < 4.1%. For the stability analysis, the samples were analyzed at 0, 2, 4, 10, and 12 h after being stored at 4 °C with RSD values < 4.8% within 12 h. Moreover, the RSD values for the repeatability analysis were < 5.3%. The recovery tests were performed by comparatively analyzing the different spiked-in samples, and the recovery values were calculated. It was shown that the analytical method developed for the 14 main compounds had recovery rates ranging from 93.1% to 108.8%, and the RSD values were < 3.9%. The above analytical method was shown to be sufficiently precise, accurate, sensitive, and reliable for the quantitative determination of the 14 main compounds in BBDC. For further detailed analysis and validation data, refer to the supporting Table A.1-A.4.
3.5 Content of the 14 main compounds in BBDC
The developed and validated UHPLC–QQQ–MS/MS method was subsequently applied to evaluate the 14 main compounds from 10 batches of BBDC (16 independent samples). Among these, three independent samples were randomly selected from three different batches (S1, S6, and S8) to evaluate their intra–batch differences. The quantification results were summarized in Table 3. The total amount of bile acids was 31.08–53.32 mg/g, which included the different levels of cholic acid, glycodeoxycholic acid, ursodeoxycholic acid, deoxycholic acid, glycocholic acid, taurocholic acid, and chenodeoxycholic acid, and the maximum content of each was 21.39, 2.15, 2.34, 6.00, 11.73, 10.19 and 2.97 mg/g, respectively. In addition, the minimum content values of each were 14.50, 1.43, 1.77, 5.09, 1.15, 4.41, and 1.59 mg/g, respectively. For Notoginseng Radix et Rhizoma, the content of the total saponin was 98.25–142.94 mg/g (ginsenoside Rb1 33.74–62.93, ginsenoside Re 1.52–3.54, ginsenoside Rd 3.74–4.93, ginsenoside Rg1 47.64–74.36, notoginsenoside R1 3.11–5.31 mg/g). The content of bilirubin from the 16 samples was 3.15–4.16 mg/g, and muscone was 1.04–2.08 mg/g.
No.
Analyte content (mg/g)
Cholic acid
Glycodeoxycholic acid
Ursodeoxycholic acid
Deoxycholic acid
Glycocholic acid
Taurocholic acid
Chenodeoxycholic acid
Bilirubin
Ginsenoside Rb1
Ginsenoside Re
Ginsenoside Rd
Ginsenoside Rg1
Notoginsenoside R1
Muscone
S1-1
21.19
1.94
2.10
5.94
8.33
8.96
2.26
3.16
48.40
2.83
4.71
73.26
5.31
1.14
S1-2
21.35
1.95
2.18
5.91
8.55
8.77
2.00
3.34
49.18
2.83
4.76
74.36
5.27
1.14
S1-3
20.37
1.94
2.13
5.81
8.27
8.58
2.16
3.18
47.34
2.76
4.72
70.55
5.17
1.06
S2
18.52
1.88
2.04
5.65
7.52
8.34
1.92
3.15
44.73
2.61
4.53
66.48
4.97
1.07
S3
16.97
1.45
1.77
5.35
1.34
6.90
2.97
3.58
36.27
2.45
4.62
56.75
4.81
1.04
S4
19.86
1.43
2.04
5.09
1.15
7.12
1.59
3.30
33.74
3.54
4.67
70.05
4.99
1.07
S5
19.94
1.73
2.07
5.40
4.23
10.19
1.71
4.10
45.08
2.56
4.93
67.40
4.88
1.12
S6-1
21.39
2.14
2.34
5.88
11.73
7.49
2.35
4.01
58.11
2.24
3.88
55.17
3.31
1.65
S6-2
19.67
2.15
2.31
5.96
11.59
7.31
2.18
3.66
58.43
2.20
4.00
55.98
3.32
1.47
S6-3
19.46
2.08
2.24
5.93
10.70
6.33
2.35
3.76
55.55
2.12
3.80
56.94
3.24
1.80
S7
14.50
1.48
1.90
5.46
1.48
4.41
1.85
3.71
41.77
1.99
3.74
47.64
3.11
1.90
S8-1
18.60
1.85
2.04
6.00
5.80
5.84
1.96
4.16
60.58
2.10
4.23
63.24
3.27
1.89
S8-2
17.52
1.86
2.10
5.89
6.14
5.59
1.86
3.92
58.32
2.12
4.12
63.93
3.25
1.78
S8-3
20.05
1.89
2.24
5.96
6.15
6.36
2.07
4.02
62.87
2.19
4.17
69.83
3.30
1.95
S9
19.31
2.13
2.30
5.90
10.64
5.78
2.18
3.78
62.28
1.52
4.08
70.74
3.33
2.08
S10
19.51
2.15
2.22
5.71
10.93
5.86
2.25
4.00
62.93
2.20
4.06
70.47
3.28
1.77
For BBDC, the total content of the 14 main compounds was shown in Fig. 5. In Fig. 5A, the content was from nine independent samples that were originated form three different batches. In addition, the three individual samples next to each other represent the same batch, with the red line segments separating each batch. Fig. 5B represented the content of the 10 different batches. The total content of the different samples varied widely. As shown in Fig. 5A and 5B, among the other medicines ginsenoside Rg1 accounted for the largest proportion of the total content which was not<30.4%. The ginsenoside Rb1 accounted for 21.1–33.4%, cholic acid for 9.8–12.5%, and the other 11 main compounds accounted for the remaining 10.3–38.7%. Therefore, the main component of BBDC was ginsenosides, which might be absorbed into the bloodstream after drug administration, and were likely the active constituents.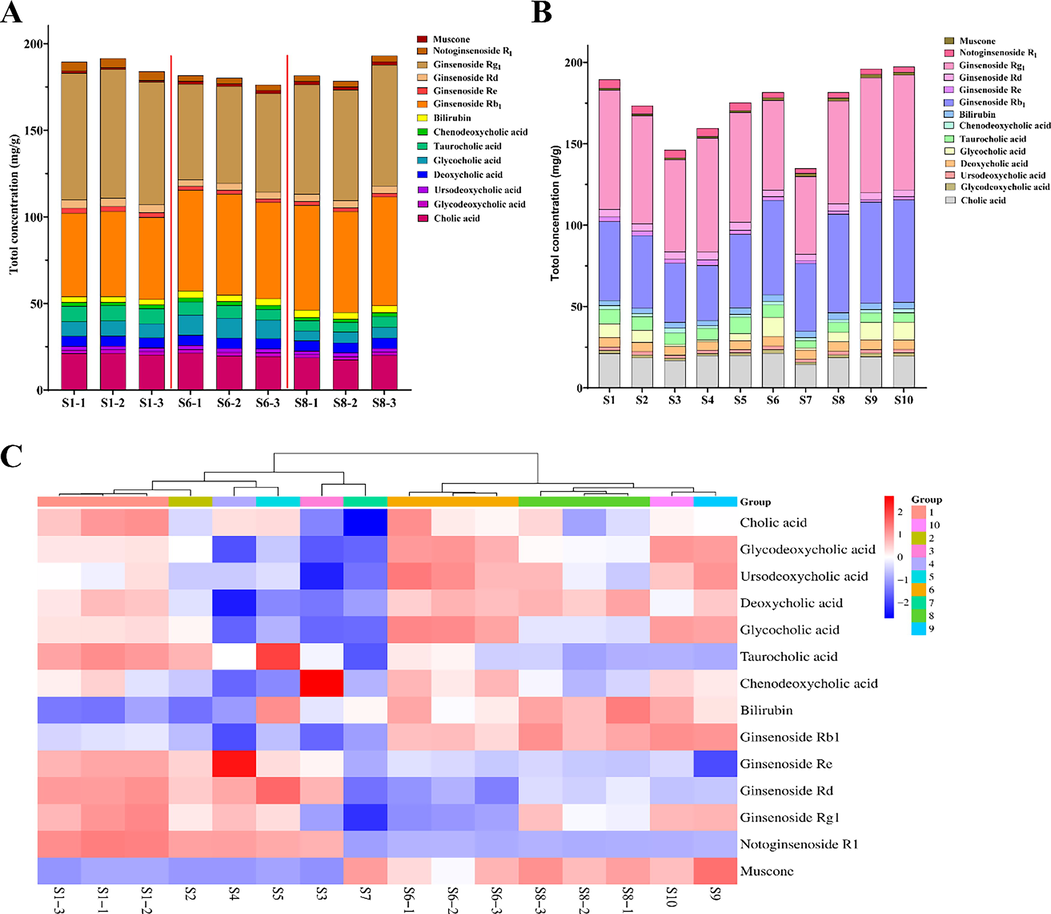
The content of 14 main compounds in 16 samples collected from 10 batches. A. the content of 14 main compounds in nine independent samples collected from three batches. B. the content of 14 main compounds in 10 samples collected from different batches. C. the content heatmap of 16 independent samples.
The heatmap analysis of the 14 main compounds from the 16 independent samples that originated from the 10 batches was shown in Fig. 5C. The differences between these 14 main compounds from the different samples were visualized, and the larger amounts were indicated in red and the lesser in blue. It was worth noting that the samples from the same batch were grouped together, while the samples from the different batches were grouped into different classes, which partially demonstrates that the samples from the same batch had more uniformity than different batches.
3.6 Consistency evaluation of BBDC
3.6.1 Intra–batch consistency
Samples were selected and quantified from the same batch, which aimed to evaluate the degree of intra–batch uniformity associated with the production process. The PA values were smaller and therefore the intra–batch consistency was better. Of the 10 batches, three batches (S1, S6, and S8), were randomly selected to be quantified and evaluated for intra–batch evaluation and three individual samples from each batch were used. The results of the content for the 14 main compounds obtained through the UHPLC-QQQ method were shown in Table 4 and the intra–batch consistency results and PA values were calculated. It was possible to determine whether the intra–batch consistency of each component in the production was effectively controlled, and the maximum PA value was 20.1% (muscone in S6), and minimum PA value was 0.5% (glycodeoxycholic acid in S1). By calculating the average consistency PA of each indicator component within the batch, it was found that the average PA values were less than or equal to 12.1%, and among them, the intra–batch consistency of deoxycholic acid was the best at 1.8%, and the average PA value of muscone was the worst at 12.1%. The reason for the variable consistency within the batches for the different indicator compounds was likely the different production conditions, such as the temperature, and degree of mixing etc. The above intra–batch consistency of BBDC was relatively satisfied, analogous to the PA values of other varieties (Zhao et al., 2022), although the number of medicines and main compounds in BBDC outclassed them, which it indicated that the intra–batch stability was good.
Compounds
Cholic acid
Glycodeoxycholic acid
Ursodeoxycholic acid
Deoxycholic acid
Glycocholic acid
Taurocholic acid
Chenodeoxycholic acid
S1-PA
4.7
0.5
3.7
2.2
3.3
4.3
12.1
S6-PA
9.6
3.3
4.4
1.4
9.1
16.5
7.4
S8-PA
13.5
2.1
9.4
1.8
5.8
13.0
10.7
P¯A
9.3
2.0
5.8
1.8
6.1
11.3
10.1
Compounds
Bilirubin
Ginsenoside Rb1
Ginsenoside Re
Ginsenoside Rd
Ginsenoside Rg1
Notoginsenoside R1
Muscone
S1-PA
5.6
3.8
2.5
1.1
5.2
2.7
7.2
S6-PA
9.2
5.0
5.5
5.1
3.2
2.4
20.1
S8-PA
6.0
7.5
4.2
2.6
10.0
1.5
9.1
P¯A
6.9
5.4
4.1
2.9
6.1
2.2
12.1
3.6.2 Inter–batches consistency
The computational formula of consistency was also applied for the inter–batches consistency of the 10 batches, where the PB values were compared with the PA values and were shown in Fig. 6. The PB values were outclassed by the PA values (Fig. 6A), where the largest value was 167.5% for glycocholic acid, and the minimum consistency difference value was 16.1% for deoxycholic acid (Fig. 6B). The difference in consistency between the TCMPP batches was due to the natural characteristic diversity of the raw materials. The producing origin, climate, years, processing methods, and other factors were important influences in the selection of raw materials. In particular, for BBDC, a large proportion of animal drugs were contained in the Bovis Calculus, Snake bile, and others. The quality control of the animal drugs focused on the origins, authenticity, processing methods, and storage conditions to guarantee the high-quality of raw materials. The PB value of glycocholic acid from Snake bile was 167.5% and a wide difference might exist in the raw materials for the 10 evaluated batches.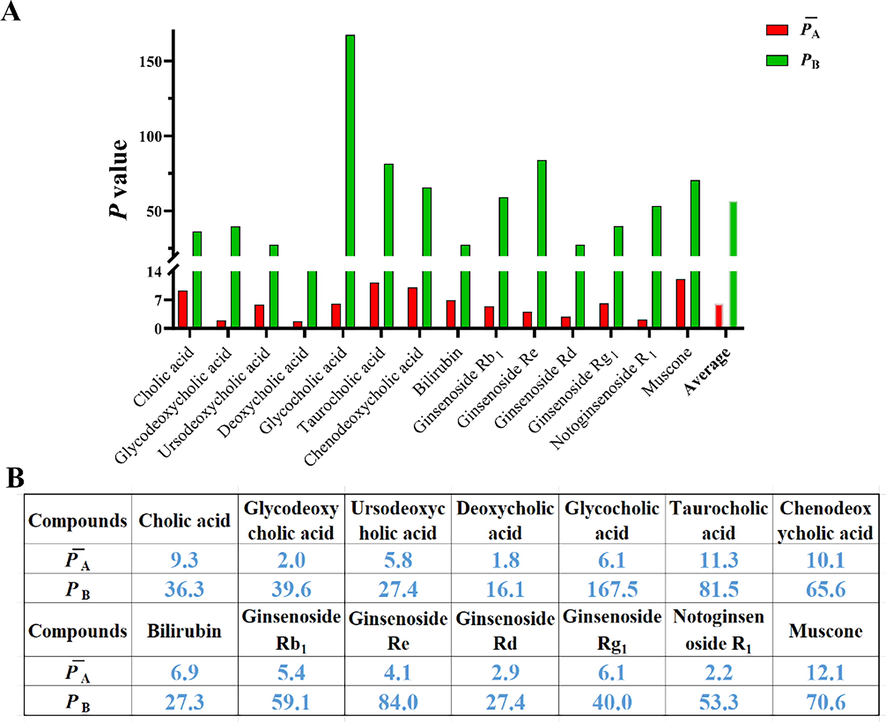
The PA and PB values of 14 main compounds based on the content of all samples.
3.7 Sample classification
The evaluation of inter–batches consistency for the 10 batches was less than satisfactory, and the chemometrics methods were analyzed and classified, as shown in Fig. 7. The HCA method (Simca-P) was applied to analyze the clustering of samples from the 10 batches, the clustering principle with the method of ward’ distance was applied (Fig. 7A). When the ward’ distance was < 20, the 10 batches were divided into three categories, S1, S2, S4, and S5 were grouped into a category; S3 and S7 were grouped in the same category; and S6, S8, S9, and S10 were the another.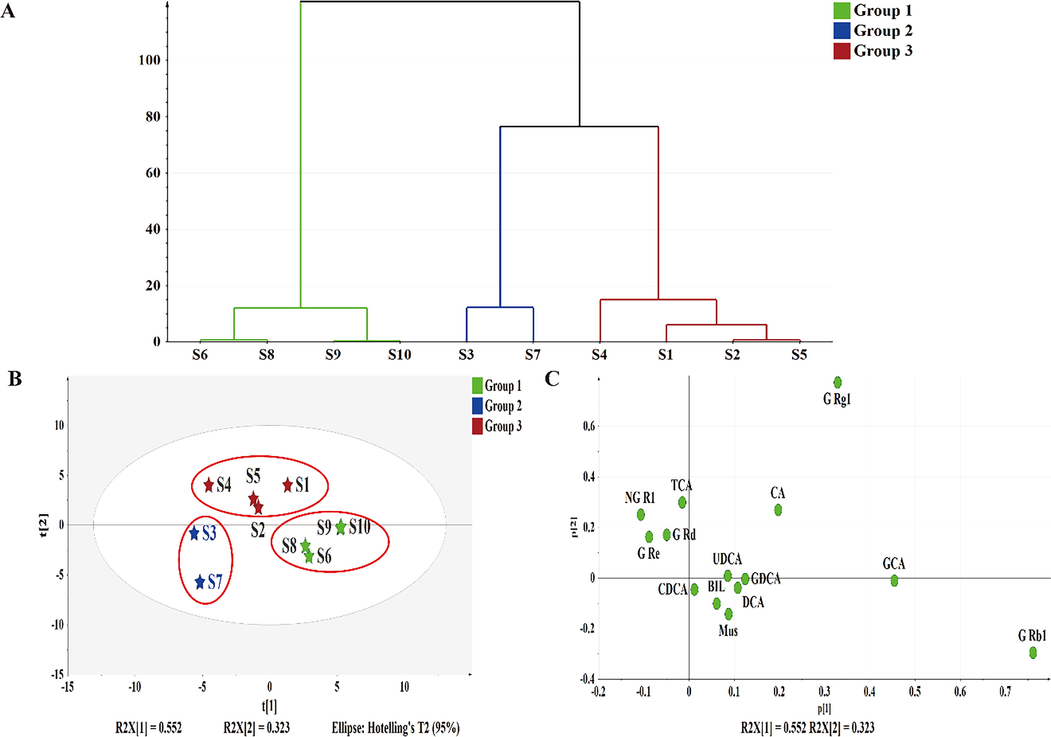
Classification results of 10 batch samples.
Then, the PCA was adopted to evaluate the inter–batches consistency. The contents of the 14 main compounds were introduced to the Simca-P for PCA, and two new comprehensive indicators were generated, with a cumulative variance rate of 87.5%, which represents most of the original data. The score plots of the 10 batches were shown in Fig. 7B and the loading plots in Fig. 7C. In Fig. 7B, the same color of the elements indicated that they were more similar and could be considered to be the same category, which was analogous with the HCA clustering. In addition, the diameter of the circle represented the degree of aggregation of samples from the same batch. The smaller the diameter, the higher the degree of aggregation, and the better consistency. Combined with the loading scores, this suggested that the points located in the same quadrant had a higher content of the corresponding main component in the sample. For example, the contents of ginsenoside Rb1 from S9 and S10 were highest of all the samples, and the maximum content of ginsenoside Rg1 was determined from S1. In short, for the 10 different batches of BBDC, there was generally a large variation for the inter–batches consistency based on eq. (2), and the three categories were established by HCA and PCA.
3.8 In vitro anti-inflammatory activity
Apart from the content determination from the perspective of chemical components, the anti-inflammatory activity of BBDC from the same or different batches were evaluated, and two methods were utilized, NO inhibition and luciferase inhibited counts. The CCK8 assay was performed to evaluate the cell viability of RAW264.7 with the additoin of 25–500 μg/mL BBDC, as shown in Fig. 8A. When the concentration was below 200 μg/mL, there was no obvious cytotoxicity and the cell viability was more than 100%. Then, 150 μg/mL BBDC was used to analyze the NO inhibition. Through LPS induction, the model (named M) was activated and the incresead concentration of NO is shown in Fig. 8B and C, and Table A.5. Moreover, the NO concentrations of the groups with 150 μg/mL BBDC decreased to varying degrees. The NO inhibition of five individual samples from S1 were to analyze (Fig. 8B) and the range between the maximum and minimum values was only 2.02 μM, which accounted for 8.7%. The NO inhibition of the 10 batches were shown in Fig. 8C and the differences in the NO concentration was apparent, and the difference between the maximum and minimum values was 10.87 μM and accounted for 49.8%.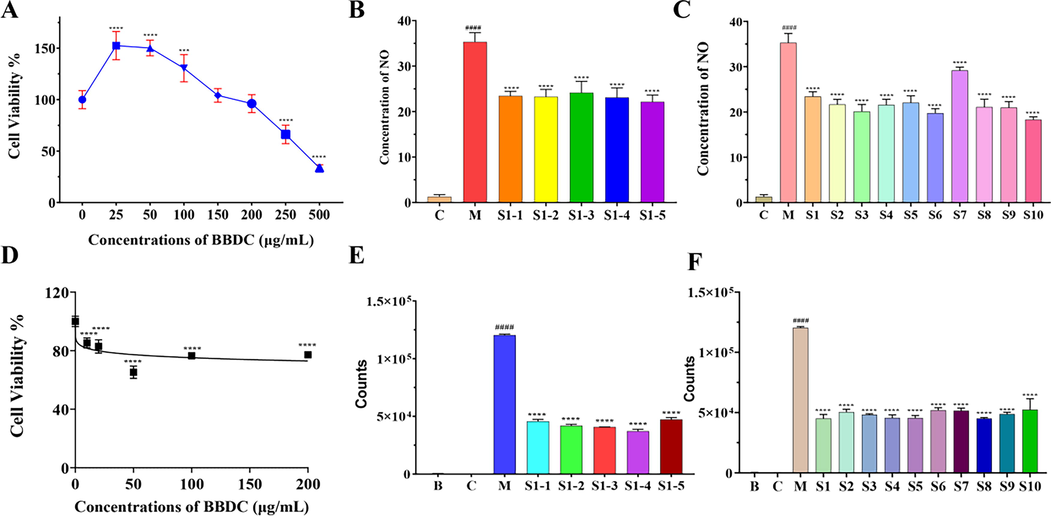
Anti-inflammatory activity of BBDC in vitro. A. Effects of different concentrations of BBDC on RAW264.7 cell viability; B. NO inhibition of five individuals from the same batch (S1); C. NO inhibition of 10 batches of BBDC; D. Effects of different concentrations of BBDC on NF-ĸB-RE-luc HEK293 cell viability; E. The inhibited counts by luciferase of five individuals from the same batch (S1); F. The counts by luciferase from 10 batches of BBDC under the NF-ĸB-RE-luc HEK293. ####, P < 0.0001 for the M group compared with the C group; *** or ****, P < 0.001 or P < 0.0001 for the BBDC groups compared with the M group, respectively.
The inhibited counts by the luciferase system was applied to evaluate the anti-inflammatory activity, which were shown in Fig. 8D-F. Different concentrations of BBDC were added to the NF-ĸB-RE-luc HEK293 and there was no obvious cytotoxicity for the 10–200 ug/mL, as shown in Fig. 8D. The five individual samples from S1 were analyzed for the inhibited counts of luciferase (Fig. 8E). After being activated with TNF-α, the luciferase counts in group M were significantly increased (P < 0.0001) in contrast to the control group (group C). The counts of luciferase from the five individual samples were also significantly different within group M (P < 0.0001). Among these, the difference counts were 10191. For the counts of luciferase from the 10 different batches, the results were shown in Fig. 8F, for which the inhibited activity of BBDC was compared with group M based the NF-ĸB-RE-luc HEK293. There were different inhibited activities of the different samples, which the maximum inhibitory counts were 45,185 and the minimal inhibitory counts were 52503. The above in vitro anti-inflammatory activity of BBDC were evaluated and the activity of the different batches varied to an extent, which suggested that the concentration of the active compounds of the BBDC was probably different. Notable, the anti-inflammatory performance of BBDC was not quite consistent with the classification results classified according to chemical composition, which indicated that there may be other factors affecting them. There was still a long way to go to further study the consistency of TCM, especially for TCMPP.
3.9 Correlation analysis of content and bioactivity of 14 main compounds
The consistency between the quantitative determination results of the main chemical compounds and the results of the anti-inflammatory biological assay indicated that the determination of biological activity could make up for the deficiency of the current quality control standards (Lu et al., 2019). Therefore, the Pearson correlation analysis was further conducted between the quantitative determination results of 14 main compounds and the results of two anti-inflammatory activity indexes. The aim was to clarify the consistency of chemical quality analysis and biological activity detection, so that their reliability could be mutually verified, and be to predict the potential active compounds and to be applied to establish the quality standard (Liao et al., 2021). After administration of BBDC, the decreased value about the concentration of NO compared with the group M, was used to establish correlations with 14 main compounds. The results (Table A.6 and Fig. 9) showed that the the correlation values (r) of each compound with two bioactivities were different and the larger the r, the more significant the anti-inflammatory activity of the compound, and it was more likely to be a potential active compound. For r-NO, the r of cholic acid was 0.6098, the maximum of all, indicated that cholic acid in BBDC played a key role in the activity of inhibiting NO in vitro. And the r of glycocholic acid, glycodeoxycholic acid and Ginsenoside Rg1 were subsequent, 0.4917, 0.4892 and 0.4704, respectively. It reindered that bile acids might have strong inhibitory effect on NO production. About the inhibitions of luciferase counts, the analogous correlation method was applied and the r values were also shown in Table A.6 and Fig. 9. Among of them, the r of ginsenoside Rd was the biggest, 0.7315, and the next was notoginsenoside R1, 0.5545. Different from NO inhibition correlation analysis, saponins should play a major role in the luciferase inhibition system, and also include ginsenoside Re (r = 0.4481) and ginsenoside Rg1 (r = 0.4590). To sum up, the above correlation analysis showed that the overall trend of quantitative chemical components and activity results was consistent, which confirmed the reliability of the selection of quantitative chemical indicators, and verified the chemical component groups mainly related to anti-inflammatory activity in BBDC, including bile acids and saponins. It was suggested that the quantitative method of 14 main compounds established in this study could be used for the quality control standard of BBDC, which was closely related to the biological activity of drugs.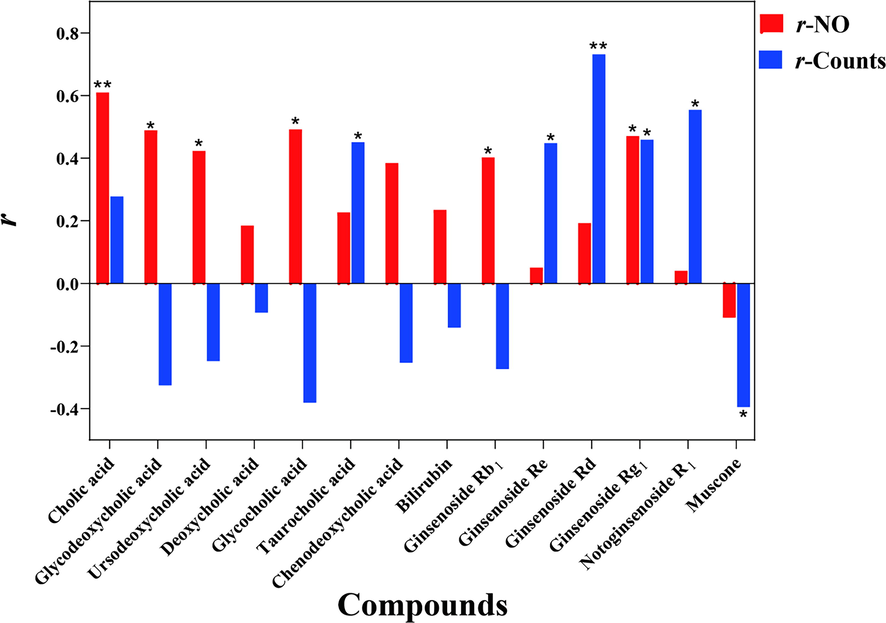
The correlation values (r) between the contents of 14 main compounds and two indexes of anti-inflammatory activity, which * indicated P < 0.05 and ** indicated P < 0.01.
4 Conclusions
In this study, we used the BBDC, an example of TCMPP, in a multidimensional strategy to assess the quality uniformity and construct comprehensive quality consistency parameters based on the chemical and biology properties. First, an optimized UHPLC–QQQ–MS/MS method was developed to simultaneously determine the 14 main compounds of BBDC, and this established analysis method was used to perform rapid and accurate quantitative analysis within 20 min. The QUE strategy was adopted to evaluate the intra–batch and inter–batches consistencies of BBDC, and the results showed that the PB values were greater than PA values. This suggested that the inter–batches consistency was a major factor affecting the quality stability of BBDC and that the uniformity of raw materials may be the core influence. The inter–batches consistency of the 10 batches was the worst, and they were divided into three categories by PCA and HCA, which were visualized to show the results of classification. Then the anti-inflammatory effects were measured in vitro by assessing the inhibition of NO production and luciferase activity in RAW264.7 and NF-ĸB-RE-luc HEK293 cells, respectively. The different activities were generated for the different batches, which was especially evident when the content of the main compounds was vastly different. Finally, the correlation analysis confirmed that the main chemical compounds related to anti-inflammatory activity in BBDC were bile acids and saponins, which were recommended as the main quality control compounds. In conclusion, the QUE strategy put forward in this study provides a scientific method for the QUE of BBDC, which may promote development of high-quality TCMPPs.
CRediT authorship contribution statement
Anyi Zhao: Data curation, Writing – original draft. Yanping Liu: Writing – original draft. Lianmei Wang: . Cong Guo: . Jun Zhang: . Sha Chen: Project administration. Qingxia Xu: . Jintang Cheng: . Yongzhen Lao: Visualization. Li Che: . Zhicheng Lai: . Lihua Yang: . Yan Liu: Writing – review & editing. An Liu: Conceptualization, Funding acquisition.
Acknowledgements
This work was supported by National Natural Science Cultivation Fund for Institute of Chinese Materia Medica, China Academy of Chinese Medical Sciences (grant number ZXKT23010).
Declaration of Competing Interest
The authors declare that they have no known competing financial interests or personal relationships that could have appeared to influence the work reported in this paper.
References
- Influence of dietary sugar on cholesterol and bile acid metabolism in the rat: Marked reduction of hepatic Abcg5/8 expression following sucrose ingestion. Biochem. Biophys. Res. Commun.. 2015;461:592-597.
- [CrossRef] [Google Scholar]
- Quantification and discovery of quality control chemical markers for Ba-Bao-Dan by UPLC-MS/MS combined with chemometrics. J. Pharm. Biomed. Anal.. 2021;204
- [CrossRef] [Google Scholar]
- Chinese Pharmacopoeia Commission, 2020. Pharmacopoeia of the People Republic of China. Chinese Medical Science and Technology Press. 12-13, 72-73, 402-403.
- Taurocholic acid and glycocholic acid inhibit inflammation and activate farnesoid X receptor expression in LPS-stimulated zebrafish and macrophages. Molecules. 2023;28(2005)
- [CrossRef] [Google Scholar]
- Bile acid coordinates microbiota homeostasis and systemic immunometabolism in cardiometabolic diseases. Acta Pharm. Sin. B. 2022;12(5):2129-2149.
- [CrossRef] [Google Scholar]
- Changes in circulating bile acid subtypes in response to weight-loss diets are associated with improvements in glycemic status and insulin resistance: The POUNDS Lost trial. Metabolism. 2022;136
- [CrossRef] [Google Scholar]
- Simultaneous quantification of bioactive components in Chinese herbal spirits by ultra-high performance liquid chromatography coupled to triple-quadrupole mass spectrometry (UHPLC-QQQ-MS/MS) Chin. Med.. 2021;16(26)
- [CrossRef] [Google Scholar]
- Effects of BaBao dan on TGF-β/Smad signaling pathway on growth and metastasis of drug-resistant gastric cancer cells. Mod. Chinese Med. Res. Pract.. 2021;35(2):34-38.
- [CrossRef] [Google Scholar]
- Ultra-high performance liquid chromatography/ion mobility time-of-flight mass spectrometry-based untargeted metabolomics combined with quantitative assay unveiled the metabolic difference among the root, leaf, and flower bud of Panax notoginseng. Arab. J. Chem.. 2021;14
- [CrossRef] [Google Scholar]
- UHPLC-Q-TOF-MS in analyzing chemical constituents of traditional Chinese herbal preparation Babao Dan. Acad. J. Second Mil. Med. Uni.. 2016;37(12):1548-1554.
- [CrossRef] [Google Scholar]
- Babao Dan decreases hepatocarcinogenesis by inhibiting hepatic progenitor cells malignant transformation via down-regulating toll-like receptor 4. Front. Oncol.. 2023;13
- [CrossRef] [Google Scholar]
- Comprehensive evaluation of NAODESHENG by combining UPLC quantitative fingerprint and antioxidant activity. J. Pharm. Biomed. Anal.. 2021;193
- [CrossRef] [Google Scholar]
- Simultaneous determination of eight potential Q-markers in Zishen Tongguan capsules based on UHPLC-MS/MS. Curr. Pharm. Anal.. 2021;17(1):47-56.
- [CrossRef] [Google Scholar]
- Lu J.X., Zhang C.X., Hu Y., Zhang M.H., Wang Y.N., Qian Y.X., Yang J., Yang W.Z., Jiang M.M., Guo D.A., 2019. Application of multiple chemical and biological approaches for quality assessment of Carthamus tinctorius L. (safflower) by determining both the primary and secondary metabolites. Phytomedicine. 58,. https://doi.org/10.1016/j.phymed.2019.152826 152826.
- BabaoDan cures hepatic encephalopathy by decreasing ammonia levels and alleviating inflammation in rats. J. Ethnopharmacol.. 2020;249
- [CrossRef] [Google Scholar]
- Babaodan controls excessive immune responses and may represent a cytokine-targeted agent suitable for COVID-19 treatment. Biomed. Pharmacother.. 2021;139
- [CrossRef] [Google Scholar]
- Clinical trial of Babaodan capsules in the treatment of patients with acute cholecystitis. Chin. J. Clin. Pharmacol.. 2023;39(12):1689-1693.
- [CrossRef] [Google Scholar]
- Identification of bioactive ingredients from Babaodan using UPLC-QTOF-MS analysis combined with network pharmacology guided bioassays. J. Chromatogr. B. 2022;1206
- [CrossRef] [Google Scholar]
- Babaodan inhibits cell growth by inducing autophagy through the PI3K/AKT/mTOR pathway and enhances antitumor effects of cisplatin in NSCLC cells. Am. J. Transl. Res.. 2019;11(8):5272-5283.
- [Google Scholar]
- Scopoletin and umbelliferone protect hepatocytes against palmitate- and bile acid-induced cell death by reducing endoplasmic reticulum stress and oxidative stress. Toxicol. Appl. Pharm.. 2022;436
- [CrossRef] [Google Scholar]
- Improvement of determination of bilirubin in BaBaodan by ultraviolet spectrophotometry. Chin. Tradit. Herb. Drug. 1996;27(10):596-597.
- [Google Scholar]
- UHPLC-QQQ-MS/MS assay for the quantification of dianthrones as potential toxic markers of Polygonum multiflorum Thunb: applications for the standardization of traditional Chinese medicines (TCMs) with endogenous toxicity. Chin. Med.. 2021;16(51)
- [CrossRef] [Google Scholar]
- Multiple-fingerprint analysis of Poria cocos polysaccharide by HPLC combined with chemometrics methods. J. Pharm. Biomed. Anal.. 2021;198
- [CrossRef] [Google Scholar]
- Zhao J.Y., Lan W.L., Peng J., Guan B., Liu J., Zhang M., Zhan Z.X., Lin J.M., 2021. Babao Dan Reverses Multiple-Drug Resistance in Gastric Cancer Cells via Triggering Apoptosis and Autophagy and Inhibiting PI3K/AKT/mTOR Signaling. Evid-based. Compl. Alt. https://doi.org/10.1155/2021/5631942 5631942.
- Current studies on quality of Chinese patent drugs with consistency as core and discussions on new high-quality evaluation model. China J. Chinese Mater. Med.. 2020;45(15):3740-3748.
- [CrossRef] [Google Scholar]
- Comprehensive quality consistency evaluation strategy and analysis of compound danshen tablet. J. Pharm. Biomed. Anal.. 2022;219
- [CrossRef] [Google Scholar]
- Synergistic effects of Danshen (Salvia Miltiorrhiza Radix et Rhizoma) and Sanqi (Notoginseng Radix et Rhizoma) combination in inhibiting inflammation mediators in RAW 264.7 Cells. Biomed Res. Int. 2016:5758195.
- [CrossRef] [Google Scholar]
Appendix A
Supplementary material
Supplementary data to this article can be found online at https://doi.org/10.1016/j.arabjc.2023.105276.
Appendix A
Supplementary material
The following are the Supplementary data to this article:Supplementary Data 1
Supplementary Data 1


