

Translate this page into:
Quantification of heavy metals and health risk assessment in processed fruits’ products
⁎Corresponding author. amabbasi@cuiatd.edu.pk (Arshad Mehmood Abbasi)
-
Received: ,
Accepted: ,
This article was originally published by Elsevier and was migrated to Scientific Scholar after the change of Publisher.
Peer review under responsibility of COMSATS University Islamabad, Abbottabad Campus Pakistan and King Saud University.
Abstract
Heavy metals’ associated health risk assessment was carried out in processed fruits’ based products. Concentration of HMs was relatively higher than permissible limits in all products. CA, PCA depicted strong association between Cr, Co, Pb and Fe. HRI for Cd, Cr and Pb was greater than unity (<1.0). THQ and HI of Cd, Cr and Pb were relatively high. TCR indicates HMs were within the acceptable limit, except Cd.
Abstract
Present study was intendant to assess heavy metals (HMs) concentration and associated health risk in processed fruits’ products sold in the local markets of North Pakistan. In total seven metals viz. cadmium (Cd), chromium (Cr), cobalt (Co), copper (Cu), iron (Fe), lead (Pb) and zinc (Zn) were quantified in 345 samples of different brands categorized into eight groups (Sauces, Ketchup, Juices, Jams, canned fruits, tomato paste, marmalades and pickles). On the comparative basis, Fe was dominating with highest concentration in pickles, canned fruits and sauces at 143.3 ± 43.2, 83.64 ± 23.19 and 50.17 ± 15.1 mg/kg, respectively), followed by Cd in sauces (22.94 ± 6.91 mg/kg), Cr in juices (12.97 ± 3.91 mg/kg) and Pb in pickles (12.53 ± 3.77 mg/kg). Measured levels of these metals varied significantly and were relatively higher than their permissible limits. Univariate and multivariate analysis depicted strong association among Cr, Co, Pb and Fe and confirmed HMs contamination through natural and anthropogenic sources in processed foods. Health risk index (HRI) for Cd, Cr and Pb was greater than unity (<1.0), particularly in sauces, jams and canned fruits. Target hazard quotient (THQ) and hazard index (HI) of Cd, Cr and Pb were relatively high. But target cancer risk (TCR) assessment indicates that these metals were within the acceptable limit, except for Cd concentration in sauces, jams and canned fruits that may cause cancer to consumers.
Keywords
Heavy metals
Health risk assessment
Processed foods
PCA
THQ
TCR

1 Introduction
Heavy metals (HMs) are among the major food chain contaminants triggering serious health effects even consumed in least concentration (Fathabad et al., 2018a). Natural processes (i.e. volcanic eruptions, leaching from soil and rocks etc.), and anthropogenic activities including mining, industrialization and urbanization are the main contributors of HMs adulteration in food chain (Ali et al., 2019; Tchounwou et al., 2012), and is the main concern in food safety, human health and quality assurance (Shaheen et al., 2016). Disproportionate use of chemical fertilizers, pesticides and polluted water for irrigation are the main factors responsible for HMs contamination, predominantly in fruits and vegetables (Amer et al., 2019).
Estimated, 90% of the HMs exposure to consumers occurs through contaminated food (Martorell et al., 2011), which contributes up to 30% of cancer in human along with other health disorders (Mansour et al., 2009). Foods either fresh or processed are contaminated with HMs (Hajeb et al., 2014), that become noxious when ingested above the tolerable limit (Dghaim et al., 2015). HMs possess various adverse health effect owing to inadequate mechanism of elimination from human body, non-biodegradable nature, long biological half-lives and potential to accumulate in different body parts (Shaheen et al., 2016). Therefore, bioaccumulation of HMs in human leads to mutagenesis, carcinogenesis, teratogenesis and heart, nervous system, liver, kidney, lungs, bone and spleen disorders (Parkar and Rakesh, 2018).
Cd concentration in food above 0.0004 mg/kg/day causes renal dysfunction, memory loss, cardiovascular disorders, cancer and even death (Fathabad et al., 2018a; Barone et al., 2018; Dghaim et al., 2015; Agoramoorthy et al, 2008). This metal mainly effects the renal system, causing irreversible damage to the renal tubules involved in the mechanisms of nutrient reabsorption (Rubio et al., 2018). Though, Cr involves in the synthesis of nucleic acids (DNA & RNA) and proper functioning of the immune system (Manore et al., 2009), but Cr6+ is lethal and even in a very low concentration (150 µg/g for adults and 0.2–5.5 µg/g for children) causes diabetes, heart attack and cancer (Kabatha-Pendias, 2001).
Elevated level of Co in human body results in vomiting, heart problems, and affects functioning of thyroid, causes nausea and over production of red blood cells (Parveen et al., 2020). Likewise, above the threshold level viz. 35 mg/day, Cu causes hair loss, skin infections and respiratory diseases (Khan et al., 2010). Nevertheless, Fe is important for red blood cells, enzymes activity and for appropriate immune functioning (Leung and Furness, 1999), but above its recommended level may cause diarrhea, dizziness, vomiting, nausea, joint pain, cardiovascular disorders and disturbs metabolic functions (Dghaim et al., 2015; Hashemi et al., 2017). Likewise, above permissible limits Pb damages the central nervous system (Hsu et al., 2006), exclusively in developing children and fetuses and cause nephropathies, alterations of the gastrointestinal tract and Alzheimer's disease (Paz et al, 2019; Fathabad et al., 2018a). Recommended daily intake of Zn is Zn in excessive amount viz. 21 mg/day (USEPA, 2002; Parveen et al., 2020), reduces immune function, causes obesity, diarrhea, kidney and liver failure and anemia (Singh et al., 2010), damages reproductive system (Nolan, 2003) and effects blood lipoprotein and copper level (Dghaim et al., 2015).
The presence of antioxidants and other biologically active ingredients in fruits makes them effective in the treatment of numerous diseases (Roba et al, 2016; Ji-yun et al, 2016). The use of processed foods and method of food preservation goes back to the time when human beings learned how to cook and store the food. Refrigeration, freezing, dehydration, acidification, irradiation, extrusion, extraction, filtering and packaging techniques involved in food preservation were invented in 20thcentury (Eicher-Miller et al., 2012). Although, food processing and preservation techniques are significant to meet the demand of growing human population. However, nature of food, harvesting time, mode of transportation, use of chemical preservatives, packaging and storage cause HMs contamination in processed foods specifically in developing countries where monitoring and managerial issues are ineffective and disorganized. Main populace in these countries use plants and animals based processed foods, which are one of the major sources of HMs exposure. In this context, present study was intended with the aim to estimate health risk assessment to consumers, predominantly associated with HMs concentration in the processed fruit-based food products available in the local markets of North Pakistan.
2 Materials and methods
2.1 Sampling
Based on availability, processed fruits-based products (n = 345) of different national and international brands viz. National, Shan, Shangrilla, Mitchell’s, Fruit Tree and Nestle were collected from the local markets of Abbottabad, Haripur and Mansehra districts of Khyber Pakhtunkhwa. Pakistan. These samples were collected in triplicates and categorized in to different groups including “juices”, “jam”, “canned fruits”, “sauces”, “ketchup”, “pickles”, marmalades and tomato paste (102, 81, 39, 33, 33, 33, 15 and 9 samples, respectively) on the basis of product types.
2.2 Digestion and instrumentation
Processed fruit product samples were digested following the protocol as explained earlier by Parveen et al. (2020). Briefly, powder sample (∼2g) was added into digestion tubes containing digestion mixture (HNO3 and HClO4) at 2:1. The mixture was heated on digester Pelican Kelplus- KES 20LRAL-TS at 120 °C until clear solution was obtained. Afterwards, final volume was adjusted up to 50 mL with deionized water. Along with a batch of 6 samples a blank was also prepared in the same way. Quantification of selected metals: Cd, Cr, Co, Cu, Fe, Pb and Zn was done using the flame atomic absorption spectrometer (Perkin Elmer S#80156060702) under optimum analytical conditions. Working standards for tested metals were prepared from stock solutions (1000 mg/L). Optimum analytical conditions maintained on atomic absorption spectrophotometer ‘AAS’ to selected metals using air-acetylene flame (Perkin Elmer S#80156060702) are mentioned in Table S1.
2.3 Statistical analysis
Analytical data were evaluated by univeriate and multivariate approaches using STATISTICA (StatSoft Inc, 1999) and SPSS Statistics V21.0 (IBM, Chicago USA). Cluster analysis (CA) and principle component analysis (PCA) were performed using Ward’s and Varimex rotation methods to find compositional pattern of data set and sources of contamination. Graphical representations of data were done by using GraphPad Prism 8.0 (GraphPad Software, Inc. USA) and Sigma Plot 12.1 (Systat Software Inc. San Jose, California). Data were presented as mean ± SD for triplicate analysis.
2.4 Health risk assessment
Filed survey was conducted to document the information regarding the consumption of processed fruit-based products among the local communities of three districts: Haripur, Abbottabad and Mansehra of KP province of Pakistan. In total, 100 informants were participated in the field survey (Table S2). Data were collected using semi structured interviews and questionnaire comprising multiple choice questions. Information were gathered on family members, types of product consumed, and quantity consumed etc. (Table S3).
The health risk was calculated by finding the daily intake (mg/day/person) of selected metals through consumption of the processed fruit-based products and then relate them to the reference oral dose (Singh et al., 2010).
Estimated daily intake (EDI) was calculated following the procedure reported previously (Cherfi et al., 2014) using equation: where; ‘C’ represents the metal concentration in fruit products (mg/kg), and ‘I’ denotes daily intake of the product.
Health risk index (HRI) is a proportion between the estimated daily intake (EDI) of the metal and reference oral dose (RfD) for each metal and body weight (BW) of the consumers (Cui et al., 2004) and the HRI less than 1 for any metal consider safe for consumer (Parveen et al., 2020). The HRI was calculated using following equation: where Cn is the mean metal concentration in specific fruit product on fresh weight basis (mg/kg); Dn is the average daily intake rate of a specific fruit product in a whole year; RfD showed safe level of exposure by oral intake for lifetime; and Bw is the average body weight.
Target hazard quotient (THQ) and Hazard index (HI) are used to evaluate the non-carcinogenic health risk to human (Yang et al., 2011). THQ was calculated using equation reported previously (USEPA, 2015). where C represents mean metals level in fruit product (mg/kg); I is the ingestion rate (g/day/person); Efr is the exposure frequency (days/year); EDtot is the total exposure duration (years); Bw is the average body weight adult (kg); and ATn is the averaging time, non-carcinogens (EDtot × 365 days/year).
Hazard index (HI) is the sum of hazard quotients for trace metals and was calculated by formula as reported by earlier (USEPA, 2006; USEPA, 2015). where THQ1 − n is Target hazard quotients for 1 − n metals.
Target cancer risk (TCR) is intended to determine the cancer risk to consumers due to food consumption. The TCR in processed fruit products was calculated following the method reported previously (USEPA, 2006; USEPA, 2015) where ATc is averaging time carcinogens; carcinogens potency slope oral (μg/g/day) is CPS; Efr is the exposure frequency (days/year); EDtot is the total exposure duration (years); BWa is the average body weight; and Cb is metal concentration.
3 Results and discussion
Heavy metals including Cd, Cr, Co, Cu, Fe Pb and Zn were quantified in 345 samples of processed fruit based products categorized in to eight groups viz. sauces, ketchup and pickles (n = 11 brands of each), juices (n = 34 brands), jams (n = 27 brands), canned fruits (n = 13 brands), tomato paste and marmalades (n = 3 and 5 brands, respectively).
3.1 Comparative assessment of HMs in fruits’ products
On the whole Fe was dominating in term of highest concentration in almost all brands of processed fruit-based products followed by Cd, Cr and Pb. Whereas, Co and Cu were usually at lowest levels (Table 1). Likewise, in many samples measured levels of HMs were below the detection limit. Alphabetical letters represents significant differences at p < 0.05.
Samples
Sample Name
Company
Cd
Cr
Co
Cu
Fe
Pb
Zn
Sauces
S1
Chilli garlic sauce
Mitchelle's
35.06 ± 0.57
41.41 ± 1.48
2.833 ± 0.41
0.958 ± 0.09
S2
Chilli garlic sauce
National
14.83 ± 0.72
9.704 ± 0.49
50.69 ± 1.16
S3
Chilli garlic sauce
Shangrilla
18.93 ± 0.59
2.909 ± 0.92
70.27 ± 1.06
2.353 ± 0.30
0.256 ± 0.08
S4
Chilli garlic sauce
Saucy
0.091 ± 0.01
0.678 ± 0.03
S5
Chilli garlic sauce
Kinza
0.312 ± 0.15
0.159 ± 0.02
0.060 ± 0.00
37.87 ± 1.54
2.728 ± 0.40
S6
Chilli garlic sauce
Knorr
0.375 ± 0.03
1.155 ± 0.08
29.19 ± 1.05
12.91 ± 0.92
S7
Chilli garlic sauce
Shezan
3.907 ± 0.27
1.189 ± 0.25
20.48 ± 0.78
6.147 ± 0.23
10.11 ± 0.29
S8
Khatti methi imli
National
140.9 ± 6.70
1.935 ± 0.24
8.591 ± 0.53
S9
Khatti methi imli
Mitchelle's
0.141 ± 0.03
0.126 ± 0.03
1.371 ± 0.39
S10
Khatti methi imli
Shangrilla
0.718 ± 0.09
0.047 ± 0.02
3.280 ± 0.96
1.658 ± 0.14
S11
Khatti methi imli
Kinza
57.47 ± 2.49
0.224 ± 0.14
1.732 ± 0.08
Max.
35.06
9.704
0.159
1.189
140.87
6.147
12.91
Min.
14.83
0.141
0.047
0.060
3.279
0.224
0.256
Mean
22.94
2.581
0.111
0.623
50.169
2.698
4.100
SE
6.917
0.778
0.033
0.188
15.127
0.814
1.236
Ketchup
K1
Tomato Ketchup
Shangrilla
10.76 ± 0.84
9.490 ± 0.54
30.14 ± 1.10
4.856 ± 0.66
0.160 ± 0.06
K2
Tomato Ketchup
National
5.609 ± 0.57
13.32 ± 0.48
27.93 ± 0.52
0.331 ± 0.09
5.969 ± 0.09
K3
Tomato Ketchup
Kinza
1.763 ± 0.31
0.528 ± 0.05
4.397 ± 1.00
1.435 ± 0.10
K4
Tomato Ketchup
Bake Parlor
0.140 ± 0.03
3.070 ± 0.69
1.520 ± 0.19
K5
Tomato Ketchup
Saucy
0.007 ± 0.00
0.888 ± 0.13
5.694 ± 0.45
K6
Tomato Ketchup
Mitchelle's
0.839 ± 0.03
0.297 ± 0.03
0.816 ± 0.04
K7
Tomato Ketchup
Knorr
0.815 ± 0.07
0.057 ± 0.01
5.761 ± 0.36
0.880 ± 0.09
K8
Tomato Ketchup
Best food
0.575 ± 0.04
0.032 ± 0.00
1.155 ± 0.23
K9
Tomato Ketchup
Bake Parlor
0.171 ± 0.04
23.30 ± 1.07
K10
Tomato Ketchup
Shezan
4.704 ± 0.44
1.590 ± 0.08
1.963 ± 0.29
10.66 ± 0.80
8.533 ± 0.68
K11
Tomato Ketchup
Open
1.478 ± 0.40
5.734 ± 0.33
0.639 ± 0.67
1.007 ± 0.07
6.595 ± 0.87
1.903 ± 0.16
0.211 ± 0.13
Max.
10.76
13.32
0.839
1.590
30.14
10.66
8.533
Min.
0.071
0.037
0.004
0.002
0.034
0.093
0.036
Mean
4.086
5.725
0.364
0.763
10.43
4.439
2.802
SE
1.232
1.726
0.109
0.230
3.146
1.338
0.845
Juices
JU1
Mango Juice
Fruitavitals
0.449 ± 0.04
1.443 ± 0.13
1.668 ± 0.17
JU2
Mango Juice
Fruitien
2.040 ± 0.17
4.147 ± 0.24
1.283 ± 0.22
4.156 ± 0.11
2.918 ± 0.14
JU3
Mango Juice
Nesfruta
1.917 ± 0.17
2.164 ± 0.25
JU4
Mango Juice
Slice
1.678 ± 0.17
0.130 ± 0.01
JU5
Mango Juice
Shezan
2.706 ± 0.08
6.476 ± 0.08
1.107 ± 0.04
16.38 ± 0.18
1.770 ± 0.30
JU6
Mango Juice
Haleeb
34.96 ± 0.23
4.094 ± 0.15
0.271 ± 0.04
4.868 ± 0.38
1.967 ± 0.07
1.223 ± 0.20
JU7
Apple Juice
Fruitavitals
2.972 ± 0.13
33.95 ± 1.45
1.443 ± 0.19
JU8
Apple Juice
Fruitien
1.331 ± 0.27
0.218 ± 0.03
4.618 ± 0.68
2.028 ± 0.15
JU9
Apple Juice
Nesfruta
0.191 ± 0.01
9.895 ± 0.16
3.833 ± 0.52
0.663 ± 0.17
JU10
Apple Juice
Tops
0.192 ± 0.01
1.163 ± 0.20
0.409 ± 0.02
0.873 ± 0.05
9.318 ± 0.45
2.740 ± 0.37
JU11
Apple Juice
Shezan
1.502 ± 0.17
0.177 ± 0.08
15.13 ± 1.59
8.392 ± 0.24
JU12
Apple Juice
Tops
0.044 ± 0.01
2.485 ± 0.46
2.533 ± 0.36
5.799 ± 0.31
7.860 ± 0.42
JU13
Apple Juice
Haleeb
3.696 ± 0.05
10.66 ± 0.49
0.495 ± 0.02
5.866 ± 0.38
0.567 ± 0.12
JU14
Guava Juice
Fruitiens
23.93 ± 0.10
0.828 ± 0.07
1.505 ± 0.26
0.221 ± 0.14
2.173 ± 0.27
JU15
Guava Juice
Fruitavitals
15.28 ± 0.49
1.149 ± 0.23
38.66 ± 0.50
7.318 ± 0.45
2.175 ± 0.39
JU16
Guava Juice
Tops Pouch
0.299 ± 0.00
2.992 ± 0.24
3.083 ± 0.54
0.345 ± 0.06
JU17
Guava Juice
Tops
1.171 ± 0.24
0.623 ± 0.03
77.13 ± 2.16
15.08 ± 0.80
0.495 ± 0.02
JU18
Guava Juice
Shezan
0.118 ± 0.03
0.191 ± 0.01
0.168 ± 0.02
1.057 ± 0.22
14.08 ± 3.22
0.781 ± 0.08
JU19
Red Grapes Juice
Fruitavitals
24.94 ± 0.10
3.486 ± 0.22
0.080 ± 0.02
37.85 ± 2.22
7.331 ± 0.45
11.24 ± 0.58
JU20
Red Grapes Juice
Fruitien
1.842 ± 0.11
0.614 ± 0.07
9.655 ± 0.48
1.324 ± 0.09
JU21
Red Grapes Juice
Tops
0.268 ± 0.04
0.589 ± 0.02
14.87 ± 0.50
0.492 ± 0.02
JU22
Peach Juice
Fruitavitals
0.491 ± 0.01
0.733 ± 0.02
0.040 ± 0.03
0.875 ± 0.14
70.64 ± 1.86
12.88 ± 0.43
3.275 ± 0.53
JU23
Peach Juice
Fruitien
0.159 ± 0.03
2.202 ± 0.23
0.788 ± 0.07
3.688 ± 0.46
JU24
Peach Juice
Rani float
7.053 ± 0.39
0.195 ± 0.02
3.685 ± 0.46
JU25
Pineapple Juice
Fruitien
5.141 ± 0.31
0.519 ± 0.03
3.593 ± 0.69
4.005 ± 0.49
JU26
Pomegranate Juice
Fruitien
0.441 ± 0.03
2.783 ± 0.29
4.287 ± 0.39
1.946 ± 0.12
0.962 ± 0.09
JU27
Lychee Juice
Tops
1.506 ± 0.18
0.142 ± 0.03
8.508 ± 0.41
JU28
Sugarcane Juice
Open
5.076 ± 0.22
3.628 ± 0.55
13.90 ± 0.26
11.29 ± 1.04
6.930 ± 0.13
JU29
Fruit Punch
Shezan
0.271 ± 0.04
4.840 ± 0.40
0.553 ± 0.10
2.422 ± 0.38
5.565 ± 6.60
JU30
Fruit Punch
Shezan 250
1.488 ± 0.19
1.615 ± 0.33
1.191 ± 0.24
3.908 ± 0.15
0.293 ± 0.07
6.833 ± 0.75
JU31
Kinnow
Fruitavitals
0.868 ± 0.12
2.910 ± 0.21
0.552 ± 0.10
7.833 ± 0.26
2.814 ± 0.25
0.368 ± 0.07
JU32
Orange Juice
Fruitien
4.190 ± 0.27
2.148 ± 0.19
1.641 ± 0.20
0.875 ± 0.05
8.856 ± 0.22
1.640 ± 0.20
JU33
Orange Pulpy
Open
0.050 ± 0.01
2.623 ± 0.36
4.378 ± 0.34
0.588 ± 0.02
2.738 ± 0.39
0.381 ± 0.03
JU34
Orange Juice
Shezan
3.667 ± 0.18
5.805 ± 0.62
1.677 ± 0.16
6.190 ± 0.30
2.172 ± 0.27
Max.
24.94
34.96
15.29
5.799
77.13
15.09
11.24
Min.
0.044
0.191
0.040
0.080
0.875
0.221
0.345
Mean
2.194
4.115
4.786
1.091
14.90
6.781
2.772
SE
0.376
0.706
0.821
0.187
2.556
1.163
0.475
Jams
JM1
Strawberry Jam
Mitchell's
0.048 ± 0.02
3.881 ± 0.19
7.398 ± 0.36
JM2
Strawberry Jam
National
13.60 ± 0.59
0.402 ± 0.01
5.140 ± 0.29
1.741 ± 0.08
5.904 ± 0.59
JM3
Strawberry Jam
Mitchell's
26.64 ± 0.55
1.537 ± 0.24
2.384 ± 0.03
JM4
Strawberry Jam
Fruit tree
4.421 ± 0.33
1.308 ± 0.08
4.654 ± 0.72
3.275 ± 0.27
7.318 ± 0.43
JM5
Strawberry Jam
Salman's
12.73 ± 0.94
2.156 ± 0.20
22.20 ± 1.14
4.382 ± 0.26
JM6
Strawberry Jam
Shezan
2.791 ± 0.08
6.295 ± 0.39
1.530 ± 0.62
JM7
Apple Jam
Mitchell's
11.48 ± 0.82
0.700 ± 0.13
4.114 ± 0.48
JM8
Apple Jam
National
74.73 ± 4.45
1.231 ± 0.17
0.163 ± 0.02
5.796 ± 0.31
JM9
Apple Jam
Fruit tree
2.483 ± 0.42
24.33 ± 1.12
2.427 ± 0.31
1.472 ± 0.23
JM10
Apple Jam
Salman's
8.862 ± 0.22
1.502 ± 0.18
1.169 ± 0.22
0.162 ± 0.06
22.37 ± 1.89
3.895 ± 0.17
JM11
Mixed Fruit Jam
Mitchell's
0.077 ± 0.02
4.919 ± 0.13
3.526 ± 0.23
JM12
Mixed Fruit Jam
National
30.68 ± 0.54
0.162 ± 0.02
3.833 ± 0.19
5.946 ± 0.25
JM13
Mixed Fruit Jam
Mitchell's
19.09 ± 0.26
19.81 ± 1.50
8.730 ± 0.40
1.322 ± 0.06
JM14
Mixed Fruit Jam
Fruit tree
2.789 ± 0.26
0.033 ± 0.01
11.89 ± 1.62
2.669 ± 0.17
4.264 ± 0.13
JM15
Pineapple Jam
Mitchell's
27.60 ± 0.80
1.566 ± 0.10
2.291 ± 0.25
16.09 ± 1.03
41.20 ± 1.15
JM16
Pineapple Jam
Fruit tree
4.105 ± 0.21
43.59 ± 1.02
1.543 ± 0.31
5.180 ± 0.27
JM17
Pineapple Jam
National
2.895 ± 0.16
11.90 ± 1.19
1.530 ± 0.37
8.066 ± 0.70
JM18
Mango Jam
Mitchell's
0.074 ± 0.02
1.672 ± 0.19
3.588 ± 0.09
JM19
Mango Jam
National
37.31 ± 0.48
0.801 ± 0.02
48.42 ± 1.57
16.94 ± 0.38
15.71 ± 0.42
JM20
Mango Jam
Salman's
3.199 ± 0.32
1.711 ± 0.21
0.188 ± 0.02
2.667 ± 0.05
0.806 ± 0.07
JM21
Mango Jam
Ahmad's
5.066 ± 0.33
0.501 ± 0.00
0.412 ± 0.00
0.003 ± 0.00
4.776 ± 0.33
JM22
Blackcurrant
Mitchell's
24.08 ± 0.27
3.192 ± 0.29
19.86 ± 0.33
3.406 ± 0.39
JM23
Blackcurrant
National
7.611 ± 0.22
6.133 ± 0.30
7.807 ± 0.29
1.354 ± 0.30
JM24
Blackcurrant
Fruit tree
8.941 ± 0.45
7.538 ± 0.60
5.461 ± 0.33
JM25
Blackcurrant
Salman's
0.710 ± 0.02
0.697 ± 0.08
0.138 ± 0.05
5.600 ± 6.55
11.29 ± 0.38
JM26
Banana jam
Shezan
1.556 ± 0.15
0.269 ± 0.05
22.65 ± 0.51
1.837 ± 0.25
JM27
Orange jam
Shezan
0.267 ± 0.05
5.514 ± 0.38
0.490 ± 0.03
18.22 ± 1.05
7.334 ± 0.32
Max.
74.73
7.611
48.42
16.94
43.59
22.65
41.20
Min.
0.267
0.402
0.162
0.003
4.654
0.700
0.806
Mean
18.23
2.286
6.380
1.680
18.53
6.132
5.910
SE
3.509
0.440
1.228
0.323
3.567
1.180
1.137
Canned Fruits
C1
Fruit Cocktail
California
0.256 ± 0.08
0.073 ± 0.01
23.96 ± 0.18
1.768 ± 0.18
C2
Fruit Cocktail
Italia
1.196 ± 0.24
0.226 ± 0.01
0.796 ± 0.04
28.96 ± 0.55
0.542 ± 0.04
C3
Fruit Cocktail
Farm Fresh
1.770 ± 0.08
0.403 ± 0.01
14.31 ± 1.30
C4
Fruit Cocktail
Fruitamins
0.083 ± 0.01
0.623 ± 0.08
17.95 ± 1.01
C5
Pineapple
Fine life
9.577 ± 0.53
1.204 ± 0.16
26.67 ± 0.47
1.744 ± 0.22
C6
Pineapple
Mitchell's
0.561 ± 0.06
97.29 ± 1.21
19.38 ± 0.38
C7
Pineapple
OK
26.10 ± 0.68
3.320 ± 0.08
60.67 ± 1.19
0.717 ± 0.12
18.02 ± 0.30
C8
Pineapple
California
0.306 ± 0.01
23.17 ± 0.55
1.057 ± 0.11
138.2 ± 3.70
18.78 ± 0.64
8.914 ± 0.14
C9
Pineapple
Pollac
0.161 ± 0.06
1.581 ± 0.28
21.85 ± 2.39
3.280 ± 0.40
4.930 ± 0.27
C10
Strawberry
Italia
0.796 ± 0.01
8.443 ± 0.30
19.93 ± 0.11
0.997 ± 0.01
195.4 ± 8.56
16.78 ± 0.46
60.11 ± 1.27
C11
Cherry
Italia
2.889 ± 0.18
26.26 ± 1.40
0.594 ± 0.04
209.9 ± 9.09
20.81 ± 0.35
11.36 ± 0.92
C12
Pear halves
California
11.88 ± 0.15
12.12 ± 0.19
186.5 ± 4.26
20.38 ± 0.93
14.90 ± 0.46
C13
Peach halves
California
15.07 ± 0.11
1.425 ± 0.33
65.80 ± 4.66
5.750 ± 0.37
1.817 ± 0.21
Max.
26.10
15.07
26.26
1.58
209.9
20.81
60.11
Min.
0.306
0.161
0.083
0.073
14.309
0.717
0.542
Mean
8.593
5.328
9.547
0.875
83.65
11.03
14.17
SE
2.383
1.478
2.648
0.243
23.20
3.06
3.93
Tomato paste
TP1
Tomato Paste
Lui
8.043 ± 0.35
2.563 ± 0.16
15.04 ± 0.58
3.736 ± 0.39
TP2
Tomato Paste
Mitchell's
3.480 ± 0.57
0.924 ± 0.08
41.57 ± 0.62
0.517 ± 0.03
0.175 ± 0.04
TP3
Tomato Paste
White Pearl
2.417 ± 0.23
3.907 ± 0.15
9.570 ± 0.93
16.69 ± 0.41
14.46 ± 0.78
Max.
8.043
2.563
3.907
41.57
16.69
14.46
Min.
3.480
0.924
3.907
9.570
0.517
0.175
Mean
5.761
1.968
3.907
22.06
8.603
6.122
SE
3.326
1.136
2.256
12.737
4.967
3.535
Marmalades
MM1
Citrus Marmalade
Salman's
3.987 ± 0.04
2.245 ± 0.17
0.045 ± 0.02
12.99 ± 0.35
3.463 ± 0.27
2.941 ± 0.10
MM2
Golden Mist
Mitchelle's
0.695 ± 0.03
2.096 ± 0.22
MM3
Orange Marmalade
National
1.441 ± 0.12
0.119 ± 0.00
0.004 ± 0.00
4.243 ± 0.11
2.446 ± 0.44
MM4
Harar murabba
Open
1.219 ± 0.21
4.952 ± 0.26
9.936 ± 0.41
0.565 ± 0.12
7.944 ± 0.10
MM5
Saib murabba
Open
3.987 ± 0.04
2.245 ± 0.17
0.045 ± 0.02
12.99 ± 0.35
3.463 ± 0.27
2.941 ± 0.10
Max.
3.987
2.245
0.695
4.952
12.998
3.463
7.944
Min.
3.987
1.219
0.119
0.004
4.243
0.565
2.096
Mean
3.987
1.635
0.407
1.667
9.059
2.014
3.857
SE
1.783
0.731
0.182
0.745
4.051
0.900
1.725
Pickles
A1
Mixed Achar
Natoional
8.518 ± 0.39
8.275 ± 0.35
317.9 ± 10.20
26.16 ± 0.27
10.78 ± 0.68
A2
Mango
Natoional
0.869 ± 0.07
19.64 ± 0.53
12.33 ± 0.44
2.936 ± 0.09
213.3 ± 4.27
13.57 ± 0.62
14.77 ± 0.66
A3
Mango
Mitchell's
2.395 ± 0.06
19.31 ± 0.48
2.611 ± 0.24
1.070 ± 0.09
186.7 ± 8.16
8.720 ± 0.22
15.01 ± 0.07
A4
Lime and chilli
Mitchell's
1.350 ± 0.27
19.15 ± 0.50
20.21 ± 0.35
0.004 ± 0.00
233.1 ± 9.33
17.29 ± 0.38
13.07 ± 0.25
A5
Mixed Achar
Ahmad's
1.571 ± 0.27
12.49 ± 0.10
0.510 ± 0.08
158.8 ± 9.19
14.17 ± 0.26
11.29 ± 0.39
A6
Mixed Achar
Shangrilla
3.936 ± 0.10
7.205 ± 0.27
0.487 ± 0.06
158.5 ± 2.61
14.17 ± 0.30
14.05 ± 0.72
A7
Mango kasundi
Mitchell's
1.970 ± 0.13
21.48 ± 0.60
6.073 ± 0.09
182.2 ± 3.75
18.02 ± 0.48
14.69 ± 2.68
A8
Chilli achar
Natoional
17.01 ± 0.44
3.276 ± 0.25
32.70 ± 2.21
0.523 ± 0.06
9.842 ± 0.59
A9
Mixed Achar
Shezan
11.87 ± 0.24
4.399 ± 0.39
0.742 ± 0.08
71.24 ± 1.91
9.870 ± 0.68
10.31 ± 0.82
A10
Phalli Achar
Open
0.091 ± 0.01
2.394 ± 0.35
9.901 ± 0.17
4.832 ± 0.25
6.158 ± 0.027
2.877 ± 0.19
3.233 ± 0.19
A11
Chilli Achar
Open
1.474 ± 0.23
3.691 ± 0.15
6.499 ± 0.40
16.10 ± 2.06
2.000 ± 0.05
Max.
8.518
19.64
21.48
6.499
317.95
26.16
15.01
Min.
0.091
1.474
2.611
0.004
6.158
0.523
2.000
Mean
2.588
12.98
10.26
2.643
143.35
12.54
10.82
SE
0.780
3.913
3.093
0.797
43.22
3.780
3.263
As mentioned in Fig. 1a, in different brands of sauces Fe, Cd and Zn were highest in concentration (50.17 ± 15.1, 22.94 ± 6.92 and 4.100 ± 1.24 mg/kg, respectively). Relatively average concentration of Cd, Cu, Fe, Pb and Zn, in our samples were higher than previous reports from Bahrain (Musaiger, 2008) and Bangladesh (Haque et al., 2018). In ketchup samples, Fe, Cr and Pb were dominating in term of mean concentration levels (10.43 ± 3.5.725 ± 1.72 and 4.438 ± 1.33 mg/kg, respectively). Measured levels of all metals in ketchup were more than reported in tomato sauce from Nigerian (Adegbola, 2013) and in different brands of ketchup consumed by the inhabitants of Ghana (Boadi et al., 2012), Nigeria (Iwegbue et al., 2012) and Romania (David et al., 2008). In addition, average concentration of Pb (4.438 ± 1.33 mg/kg), was also higher than the recommended standard of Codex (2016) for ketchup (1.0 mg/kg). However, Fe concentration in our samples was relatively lower than reported earlier by Harmanescu et al., (2007) and David et al., (2008) from Romania.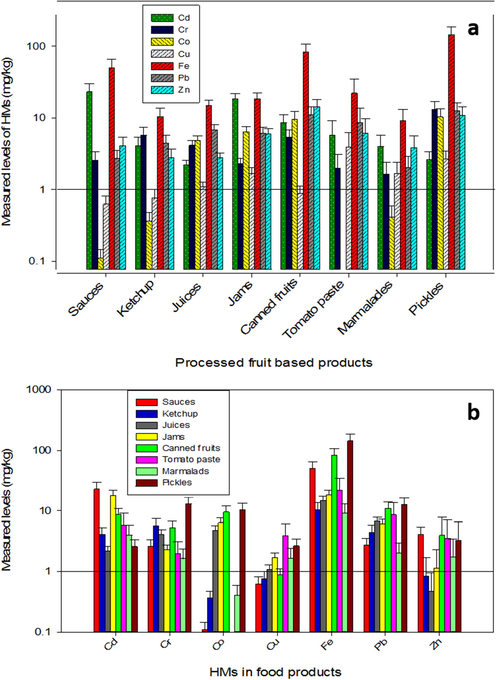
Comparative assessment of heavy metals in processed fruits’ products.
In juice samples of 34 brands average levels of HMs concentration in different brands of juice was in subsequent order: Fe ˃ Pb ˃ Co ˃ Cr ˃ Zn ˃ Cd ˃ Cu. Comparatively, lower mean concentrations of Fe, Zn, Cu, Co, and Cr were reported in the fruit juice from Saudi Arabia (Farid and Enani, 2010), but were higher than the fruit juice sold in the markets of Jordan (Massadeh and Al-massaedh, 2018), Pakistan (Anwar et al., 2014), Iraq (Al-Mayaly, 2013), Poland (Szymczycha-Madeja and Welna, 2013), Turkey (Hamurcu et al., 2010) and Italy (Coco, 2006). Threshold levels of Cd, Cu, Pb and Zn in fruit juice are 0.005, 0.01, 0.01 and 0.2 mg/kg, respectively (WHO, 1984). Conversely, measured levels of these metals in our case were far beyond the permissible limits, therefore may cause severe threat to consumers’ health. There was no significant difference in Fe and Cd levels in different brands of Jam (Table 1). Relatively, measured levels of Pb, Cd and Cr in our samples were significantly higher than fruit jam consumed in the markets of India and Rwanda (Asema and Parveen, 2018; Poornima et al., 2014; Mukantwali et al., 2014). Estimated levels of Cu, Fe, Pb, Zn and Cd levels in pineapple jam sold in the local markets of Rwanda were 3.29, 2.95, 0.77, 3.55, 0.01 mg/kg, respectively ().
The descending order of HMs quantified in various brands of canned fruits was: Fe ˃ Zn ˃ Pb ˃ Co ˃ Cd ˃ Cr ˃ Cu. Fe was in highest concentration, followed by Zn and Pb (88.64 ± 23.1; 14.73 ± 3.93 and 11.02 ± 3.05 mg/kg, respectively). Source of raw material, mode of transportation, storage and packaging, pH, concentration of oxygen in space between product and can head and quality of coating material used (Iwegbue et al., 2009), and industrial processes i.e. kneading, cutting, rolling, sheeting, and chopping (Jothi and Uddin, 2014), contribute significantly in HMs contamination in canned fruits. Comparatively, measured values of HMs in our samples were higher than reported previously in canned fruits (Divis et al., 2017; Leao et al., 2016; Rafique et al., 2008). Furthermore, average Cd level in our samples was considerably higher than European Union standard “0.05 mg/kg” (EU, 2006b), which is alarming and may leads to serious adverse health effects.
In tomato paste, mean value of Fe was highest (22.06 ± 12.7 mg/kg), followed by Pb and Zn (8.603 ± 4.96 and 6.122 ± 3.53 mg/kg, respectively). Relatively, all HMs in tomato paste were higher than reported from Nigeria (Adegbola, 2013; Hadiani et al., 2014), Iran (Hadiani et al, 2014), Turkey (Kocak et al., 2005), and Romania (David et al., 2008)). Furthermore, mean values of Pb and Cd in tomato paste were above the threshold levels of these metals viz. 1.0 and 0.05 mg/kg, respectively (Codex, 2016). To best of our knowledge, HMs metals have rarely been investigated in marmalades. Present study revealed that Fe, Cd and Zn metals were highest (9.058 ± 4.96, 3.986 ± 1.78 and 3.856 ± 1.72 mg/kg, respectively) in different brands of marmalades, while Co was lowest in concentration (0.406 ± 0.181 mg/kg). In 11 different brands of pickles, Fe was highest with an average of (143.3 ± 43.2 mg/kg), followed by Cr and Pb at 12.97 ± 3.91 and 12.53 ± 3.77 mg/kg. Comparatively, measured levels HMs in our samples were higher than reported previously from Behrain and Turkey (Musaiger, 2008; Tuzen, 2007).
Fig. 1b, revealed that Fe concentration was reasonably higher in all brands of fruits’ produced, followed by Cd, Zn, Cr, Pb, Co and Cu. Cd metal ranged from 22.94 ± 6.91 to 2.193 ± 0.376 mg/kg in different brands of sauces and fruit juice, respectively. This indicates that even the lowest level of Cd in our samples was significantly higher than the permissible limit viz. 0.05 mg/kg (Codex, 2016), that may lead to serious health issues in consumers specifically associated with this metal (Baldwin and Marshall 1999). Municipal sewage, chemical industries, Ni-Cd batteries, metallic alloys, tobacco smoking, smelting, plating, and non-recycled Cd products contributing significantly in increasing levels of Cd in soil, water and food chain (Divis et al., 2017; Poornima et al., 2014; Chakraborty et al., 2013; Tiimub and Afua, 2013; ATSDR, 1999). Comparatively, Cr was highest in different brands of fruit juice, jams and ketchup (12.97 ± 3.93, 5.792 ± 1.72, 5.327 ± 1.47 mg/kg, respectively). And these values were relatively higher than the recommended level of Cr in canned or processed foods is 0.4 mg/kg (FAO/WHO, 2003). However, in other products i.e. canned fruits, sauces, tomato paste, marmalades and pickles measured levels of Cr were within safe limit.
Average concentration of Co was highest in pickles, followed by canned fruits, jams, juices, marmalades, ketchup, sauces, and tomato paste. Measured levels of Co in fruit juice were relatively higher than reported previously from Saudi Arabia (Farid and Enani, 2010) and Ghana (Ackah et al., 2014). In processed foods, Co concentration should not be more than 0.05 mg/kg (EU, 2006a), but in except tomato paste this metal was significantly higher than threshold level, which may impose adverse health effects on consumers Use of copper vessels in jams ensures equal heat distribution, lowers cooking time, and preserves fruit colors. In studied samples, Cu concentration was ranged 0.623 ± 0.18 mg/kg (sauces) to 3.907 ± 2.23 mg/kg (tomato paste). Permissible limit for Cu in fruits’ juice is 5 mg/kg, whereas in tomato ketchup, sauces and tomato paste is 50 mg/kg (FAO/WHO, 2003). Therefore, in our samples Cu concentration lies within permissible limits.
Maximum permissible limit for Fe in processed foods is 50 mg/kg (Health Ministry, 1988). Pickles, canned fruits and sauces were among the top three groups having the highest levels of Fe at 143.3 ± 43.2, 83.64 ± 23.1 and 50.16 ± 15.1 mg/kg, respectively. Extensive use of Fe in machinery or steel containers in food processing industries, use of iron rich spices in sauces and pickles may increase its concentration processed foods. Likewise, presence of acids in different fruits may cause leeching of iron, particularly if such fruits are stored or packed in iron or steel containers (Ogidi et al., 2017). Pb concentration was significantly higher in pickle samples, canned fruits and tomato paste (12.53 ± 3.77, 11.02 ± 3.05 and 8.602 ± 4.96 mg/kg, respectively) compared to its permissible limits viz. 1 mg/kg for canned fruits, jams and preserved tomatoes and 0.03 mg/kg for juices (Codex, 2016). Pb concentration in our samples was in agreement with previous reports from Bangladesh (Tasnim et al., 2010) and Iran (Fathabada et al., 2018b). High concentration of Pb in canned fruits and paste may be attributed to the soldering process (Divis et al., 2017), while Pb deposition in soil and atmosphere, use of pesticides and fertilizers, harvesting techniques, storage conditions, transportation, processing machinery, water pipes and containers, gasoline and burning paints may involve in Pb contamination in processed foods (Jothi and Uddin, 2014). It has been reported that about 90% daily exposure to Pb in human comes from the food (Krejpcio et al., 2005), which is lethal to human and causes various types of cancer (Shariatifar et al., 2017). Average concentration of Zn in all products ranged 2.771 ± 0.47 (in juices) to 14.17 ± 3.93 mg/kg (in canned fruits). Measured level of Zn was much higher in canned fruits than permissible limit that is 5 mg/kg (FAO/WHO, 2003). Maximum level of zinc in canned fruit might be due to its application in metal alloys used in making cans.
3.2 Correlations
Interrelationship among the measured levels of mean HMs concentration were investigated in terms of correlation varimax. Results of Pearson’s correlation coefficient analysis of HMs’ concentration in processed fruit-based products are mentioned in Table 2. Except Cd, all metals showed associations with each other. This might be due the fact that Cd has different origin than rest of the metals quantified in our samples. Highly significant positive associations were observed between Co-Pb and Cr-Fe at r = 0.956 and 0.843 (p < 0.01), respectively. Whereas, Co-Zn, Pb-Zn, Fe-Zn and Fe-Pb also depicted strong positive relationships with r = 0.841, r = 0.813, r = 0.781 and r = 0.746, respectively (p < 0.05). Such a strong association between these metals suggests their common sources of contamination in processed foods such as various activities involve in food processing industries. However, inverse relationships showed depletion or enrichment of specific elements at the cost of others as seen in case of negative correlations of Cd with other metals (Table 2). Furthermore, negative associations suggest that Cd content are not controlled by single source factor and may be synergistic effect of both natural and anthropogenic activities (Suresh et al., 2012). The quartile distribution of HMs in different categories of processed fruit products was assessed as shown in box and whisker plot (Fig. 2). All targeted metals demonstrated broad range spread over various orders of magnitude. Cd, Cr, Pd, Zn and Fe showed broad and symmetrical distribution, whereas Co and Cu depicted broad ranged asymmetrical spread in the quartile values. Narrow range distribution was observed in the case of Mg, Zn, Cu, and Cd.
HMs
Cd
Cr
Co
Cu
Fe
Pb
Zn
Cd
1.000
Cr
−0.405
1.000
Co
−0.200
0.626
1.000
Cu
−0.315
0.104
0.529
1.000
Fe
−0.074
0.843**
0.731
0.152
1.000
Pb
−0.350
0.687
0.956**
0.428
0.746*
1.000
Zn
−0.055
0.508
0.841*
0.163
0.781*
0.813*
1.000
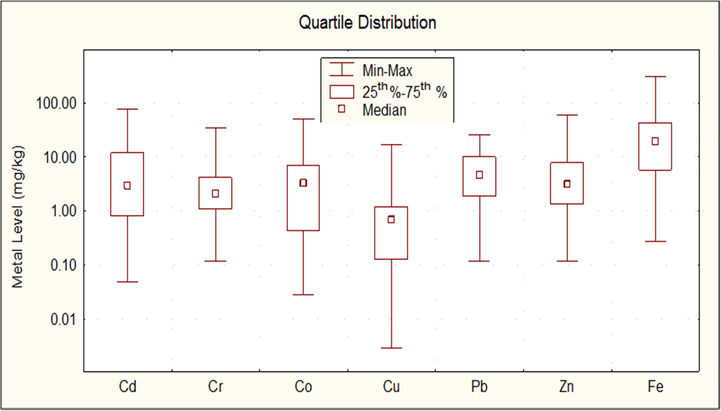
Quartile distribution of heavy metals in studied samples.
3.3 Multivariate analysis
Multivariate analysis was performed using cluster analysis (CA) and principal component analysis (PCA) to identify the sources of heavy metals in selected samples. BioVinci software was used for hierarchal cluster analysis of HMs in processed fruit samples (Fig. 3), depicted three main clusters. Based on average distribution pattern of HMs, two main clusters were identified for heavy metals. Among HMs, Cd-Zn were placed in first cluster, whereas Fe, Cr, Pb, Co and Cu were grouped in second cluster. The second cluster comprises two subgroups viz. Fe-Cr and Pb-Co, while Cu was in separate group. Likewise, based on distribution of HMs, different categories of processed fruit-based products were also in two main clusters, which were composed of sub-clusters. In first cluster, pickles and canned fruits were closely associated, accompany by tomato paste. Marmalades, ketchup, juice and jams were grouped in second cluster, whereby ketchup and juice were closely linked along with marmalades and jams. However, sauces were placed in separate group. Hierarchal cluster analysis specifies close association of HMs metals, which might be due to similarities in distribution pattern and source of contamination in the studied samples. Though, Cd is a carcinogenic metal, but was bunched with Zn that is an essential metal and within the permissible limit.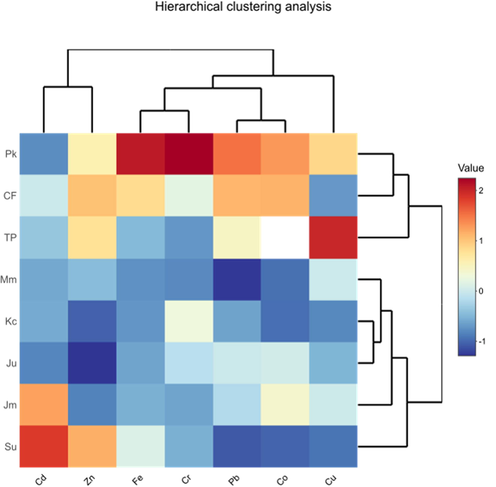
Hierarchal clustering of heavy metals in processed fruits' products.
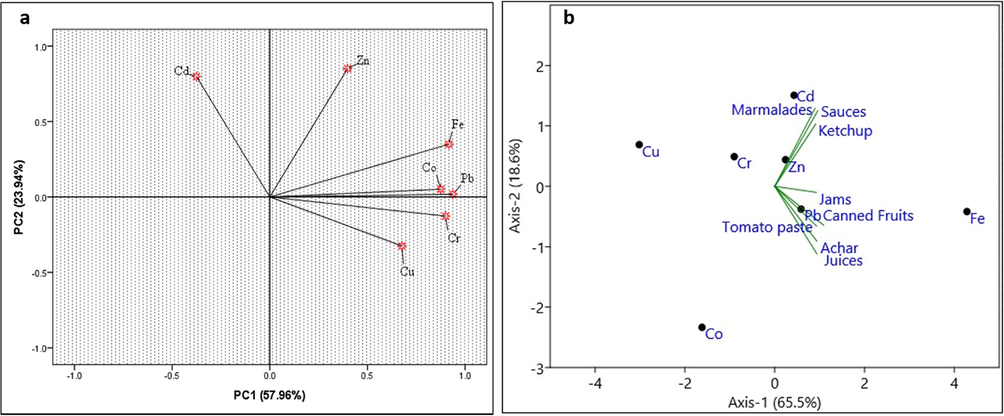
Principle component analysis (PCA) is extensively used to estimate the contribution of natural and anthropogenic sources of HMs contamination in water, soil, air and plant samples (Liu et al., 2015). Mean values of HMs in processed fruits’ products were treated by PCA using Varimax rotation with Kaiser Normalization to find out their compositional pattern and sources of contamination. Two principle components viz. PCA1 and PCA2 were extracted based on eigenvalue (˃1) and accumulated variance explained 81.88% of the total variations (Table 3). First component contributes 57.96% variation of the total variation with maximum loading of four metals (Pb, Fe, Cr and Co), with percentage variance of 0.937, 0.929, 0.896 and 0.877, respectively. The contribution rate of these metals in PC1 revealed that main sources of contamination of these metals are related to each other. Such as natural phenomenon including mineral weathering, biogenic and forest fires, erosion and volcanic activities, and anthropogenic activities like industrial processing, use of chemical fertilizers and pesticides, municipal water and mining contributing considerably Co, Cr, Fe and Pb contamination in food chain and processed foods as well (Singh et al., 2018). The contribution of second component was 23.92% of the cumulative variation and had maximum loading of Zn (0.836%) and Cd (0.811%). This indicates that Zn and Cd had common origin in processed fruits’ products. Fig. 4a, indicates that Pb, Fe, Cr and Co metals shares come sources of contamination in processed fruits’ products shares, while Cd and Zn come from other sources. In Fig. 4b, solid symbols represent the mean concentration of HMs in each food type. The position of black circles in a plot relative to the direction of green lines approximates correlations between food and the gradient of element concentrations. The lengths of green lines indicate the overall contribution of each food to the analysis. The directions of the green lines indicate the correlation with each axis i.e. vector lines parallel to an axis are highly correlated with that axis, while angles between the vector lines show correlations between food types.
Variables
PC 1
PC 2
Eigen value
4.057
1.605
Total Variance (%)
57.96
23.92
Cumulative Variance (%)
57.91
80.88
Cd
−0.347
0.811
Cr
0.896
−0.159
Co
0.877
0.020
Cu
0.665
−0.349
Fe
0.929
0.317
Pb
0.937
−0.015
Zn
0.428
0.836
Principle component analysis of heavy metals' concentration in samples analyzed.
3.4 Health risk assessment
Health risk assessment associated with HMs’ contamination in processed fruits’ products was calculated by estimating health risk index (HRI), target hazard quotient (THQ), hazard index (HI) and target cancer risk (TCR). Heat map of HRI associated with Fe, Zn, Cu, Co, Cr, Cd and Pd concentration in 345 samples of processed fruits’ products categorized into eight different groups was generated using GraphPad Prism version 8.0 (Fig. 5a&b). For each group, HMs concentration was presented in each rectangle of the heat map, whereby red colors represent high metal concentrations and blue color indicates low concentrations. Measured levels of HRI for Co, Cu, Fe and Zn (Fig. 5a), in all categories of processed fruits’ products were within the safe limit (<1.0). However, HRI values for Cd, Cr and Pb were greater than unity in all samples and could be health risk to consumers (Parveen et al., 2020). The HRI values for Cd were higher in almost all groups of fruits’ products, particularly in sauces, jam, and canned fruit. Likewise, HRI associated with Pb except sauces and marmalades and Cr except sauces, jams, tomato paste and marmalades was more than unity. Health protection standard of lifetime risk for THQ and HI is 1.0 (USEPA, 2006).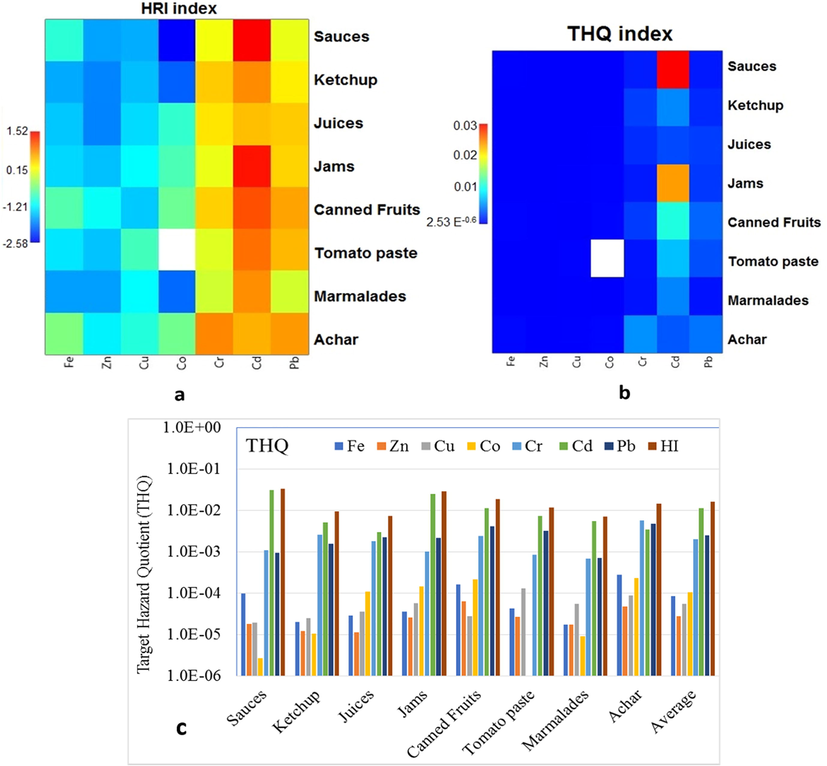
HRI, THQ and HI associated with HMs contamination in processed fruits’ products.
In the present study, THQ and HI values of HMs concentrations in all different groups of processed fruits’ products (Fig. 5b&c) were within the safe limit (<1.0). Consequently, our findings demonstrated that ingestion of these products pertaining to these metals is safe and will not cause non-carcinogenic risk to consumers. The THQ and HI values of Cd, Cr and Pb were relatively higher than rest of the studied metals, therefore further assessed for TCR. As demonstrated by USEPA (2006), acceptable cancer risk limit for carcinogenic metals i.e. Cd, Cr and Pb is ranged 1 × 10⁻⁴ to 1 × 10⁻⁶. Among, the studied samples TCR values for Cd, Cr and Pb were found within the acceptable limit (Fig. 6). However, TCR values of Cd was alarming in sauces, jams and canned fruits and may cause cancer to consumers over long-time exposure. Likewise, Cr and Pb concentration was alarming in pickles and canned fruits.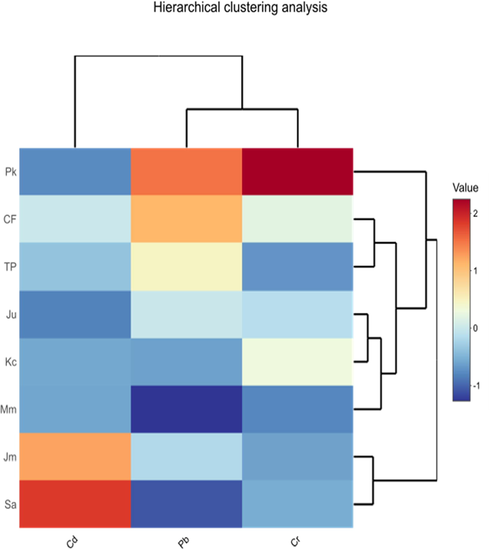
Target cancer risk associated with heavy metals' concentration in processed fruits.
4 Conclusion
Present study was aimed to assess health risk related to HMs consumption present in processed fruit-based products sold in the local markets of North Pakistan. In total seven metals viz. Cd, Cr, Co, Cu, Fe, Pb and Zn were quantified in 345 samples categorized into eight groups (Sauces, Ketchup, Juices, Jams, canned fruits, tomato paste, marmalades and pickles). On the whole, Fe was dominating in term of concentration, followed by Cd, Cr and Pb. Whereas, Co and Cu were lowest in concentration. Pickles contain highest concentration of Fe, Pb and Co, while sauce, juice, canned fruits and tomato paste were rich in Cd, Cr, Zn and Cu, respectively. ANOVA test depicted that HMs contaminations in processed fruits’ products varied considerably. Univariate and multivariate analysis revealed not only strong association among HMs i.e. Cr, Co, Pb and Fe, but also confirmed the contribution of natural and anthropogenic sources in processed foods’ contamination. Measured levels of Cr in different brands of fruit juice, jams and ketchup were higher than the recommended level in processed food. The HRI values for Cd, Cr and Pb were greater than unity (>1.0), particularly HRI of Cd in sauces, jams and canned fruit was alarming. Likewise, THQ and HI levels for Cd, Cr and Pb were relatively high, but in TCR analysis were within the acceptable limit. However, TCR indicates that Cd concentration in sauces, jams and canned fruits may cause cancer to consumers over long-time ingestion.
Acknowledgment
The authors extend their appreciation to the researchers supporting project number (RSP-2020/173), King Saud University, Riydah, Saudi Arabia. Special thanks to COMSATS University Islamabad, Abbottabad Campus, Pakistan and Quaid-i-Azam University Islamabad, Pakistan for providing lab facilities.
Authors’ contribution
HA did sampling, designed experiment work and prepared initial draft, MHS provided intellectual support and assist in data analysis, MM and ZH offered lab facilitation, WU involve in write up, MSE, JA and MSA, provided financial assistance and help in proof reading of manuscript. AMA supervised project, involved in data analysis and prepared final draft.
Declaration of Competing Interest
All authors declared that they have no conflict of interest.
References
- Determination of some heavy metal levels in soft drinks on the Ghanaian market using atomic absorption spectrometry method. Environ. Monit. Assess.. 2014;186:8499-8507.
- [CrossRef] [Google Scholar]
- Comparative analysis of heavy metals in processed tomato paste and fresh tomatoes sold in markets in Ibadan, Nigeria. Polytech. J. Sci. Technol.. 2013;8:53-59.
- [Google Scholar]
- Threat of heavy metal pollution in halophytic and mangrove plants of Tamil Nadu, India. Environ. Pollut.. 2008;155:320-326.
- [CrossRef] [Google Scholar]
- Contamination and human health risk assessment of heavy metals in soil of a municipal solid waste dumpsite in Khamees-Mushait, Saudi Arabia. Toxin Rev. 2019:1-14.
- [CrossRef] [Google Scholar]
- Al-mayaly, I.K., 2013. Available online at http://www.ijrdpl.com. Determination of some heavy metals in some artificial fruit juices in Iraqi local markets 2, 507–510.
- Exposure assessment of heavy metal residues in some Egyptian fruits. Toxicol. Reports. 2019;6:538-543.
- [CrossRef] [Google Scholar]
- Heavy metals in fruit juices in different packing material. FUUAST J. Biol.. 2014;4:191-194.
- [Google Scholar]
- Study of heavy metal content by AAS in a variety of flavours of jam samples and its physicochemical characterization. Res. Sci., Eng. Technol.. 2018;4:2394-4099.
- [Google Scholar]
- Agency for Toxic Substances and Disease Registry [ATSDR], 1999. Toxicological Profile for Lead. Agency for Toxic Substances and Disease Registry, US Department of Health and Human Services, Public Health Service, 205, 93-0606.
- Baldwin, D.R., Marshall, W.J., 1999. Heavy metal poisoning and its laboratory investigation 267–300.
- Barone, G., Dambrosio, A., Storelli, M.M., 2018. Estimated dietary intake of trace metals from swordfish consumption: a human health problem 1–11. https://doi.org/10.3390/toxics6020022.
- Single source molecular precursor routes to lead chalcogenides. Dalton Trans.. 2012;41:10497-10506.
- [Google Scholar]
- Chakraborty, D., Bhar, S., Majumdar, J., Santra, S.C., 2013. Heavy metal pollution and Phytoremediation potential of Avicennia officinalis L. in the southern coast of the Hoogly estuarine system Heavy metal pollution and Phytoremediation potential of Avicennia officinalis L. in the southern coast of the Hoogly estuarine system. https://doi.org/10.6088/ijes.2013030600045.
- Food survey: levels and potential health risks of chromium, lead, zinc and copper content in fruits and vegetables consumed in Algeria. Food Chem. Toxicol.. 2014;70:48-53.
- [Google Scholar]
- Coco, F. Lo, 2006. Determination of cadmium and lead in fruit juices by stripping chronopotentiometry and comparison of two sample pretreatment procedures 17, 966–970. https://doi.org/10.1016/j.foodcont.2005.06.015.
- Codex Alimentarius Commission, 2016. General Standard for Contaminants and Toxins in Food and Feed (CODEX STAN 193-1995).
- Transfer of metals from soil to vegetables in an area near a smelter in Nanning, China. Env. Int.. 2004;30:785-791.
- [Google Scholar]
- David, I., Nela, M., Balcu, I., Berbentea, F., 2008. The heavy metals analyses in canned tomato paste 14, 341–345.
- Dghaim, R., Khatib, S. Al, Rasool, H., Khan, M.A., 2015. Determination of Heavy Metals Concentration in Traditional Herbs Commonly Consumed in the United Arab Emirates 2015.
- Determination of tin, chromium, cadmium and lead in canned fruits from the Czech market. Potravinarstvo Slovak J. Food Sci.. 2017;11(1):564-570.
- [Google Scholar]
- Contributions of Processed Foods to Dietary Intake in the US from 2003–2008: A Report of the Food and Nutrition Science Solutions Joint Task Force of the Academy of Nutrition and Dietetics, American Society for Nutrition, Institute of Food Technologists, and International Food Information Council–4. J. Nutri.. 2012;142:2065S-2072S.
- [Google Scholar]
- EU, 2006. European Union, maximum levels for cadmium in food for infants and young children sufficient BfR Opinion No. 026/2018 of 7 August 2018.
- Europe, P.T., 2006. Statutory Instrument S.I. No. 412 of 2006 European Communities (Sampling Methods and Methods of Analysis for the Official Control of the Levels of Certain Contaminants in Foodstuffs) (No. 2) Regulations 2006 2, 1–17.
- Farid, S.M., Enani, M.A., 2010. Levels of Trace elements in commercial fruit juices in Jeddah, Saudi Arabia 31–38.
- Determination of heavy metal content of processed fruit products from Tehran’s market using ICP- OES: A risk assessment study. Food Chem. Toxicol. 2018
- [CrossRef] [Google Scholar]
- Determination of heavy metal content of processed fruit products from Tehran’s market using ICP- OES: A risk assessment study. Food Chem. Toxicol.. 2018;115:436-446.
- [Google Scholar]
- Food and agriculture organization/world health organization. Joint FAO/WHO Food Standard Programme, 2003. Codex Committee on Food Hygiene, 35th Session, Orlando, Florida, USA, January 27-February 1.
- Evaluation of heavy metals contamination in Iranian foodstuffs: canned tomato paste and tomato sauce (ketchup) Food Add. Contaminants: Part B. 2014;7:74-78.
- [Google Scholar]
- Hajeb, P., Sloth, J.J., Shakibazadeh, S., Mahyudin, N.A., 2014. Toxic Elements in Food: Occurrence, Binding, and Reduction Approaches 13, 457–472. https://doi.org/10.1111/1541-4337.12068.
- Mineral and heavy metal levels of some fruits grown at the roadsides. Food Chem. Toxicol.. 2010;48:1767-1770.
- [CrossRef] [Google Scholar]
- Haque, M.N., Islam, M.M.T., Hassan, M.T., Shekhar, H.U., 2018. Determination of Heavy Metal Contents in Frequently Consumed Fast Foods of Bangladesh Proceeding of National Academy of Sciences India, 89, 543-549.
- Harmanescu, M., Dragan, S., Poiana, M., 2007. Metals composition of some functional food components: tomato sauce and degreased soyxl, 243–252.
- Hashemi, M., Salehi, T., Aminzare, M., Raeisi, M., Afshari, A., 2017. Contamination of Toxic Heavy Metals in Various Foods in Iran: a Review.
- Health Ministry, 1988. Decree 1.6.88 n. 243. Disciplina degli oggetti in banda cromata verniciata destinati a venire in contatto con gli alimenti. Gazz Uff Repubbl Ital No. 153 of 01.7.88.
- Hsu, M.J., Selvaraj, K., Agoramoorthy, G., 2006. Taiwan’ s industrial heavy metal pollution threatens terrestrial biota * 143, 327–334. https://doi.org/10.1016/j.envpol.2005.11.023.
- Characteristic levels of heavy metals in canned sardines consumed in Nigeria. The Environmentalist. 2009;29:431.
- [CrossRef] [Google Scholar]
- Impact of land-use patterns on chemical properties of trace elements in soils of rural, Semi-Urban, and Urban Zones of the Niger Delta, Nigeria. Soil Sediment Contaminat.: Int. J.. 2012;21(1):19-30.
- [CrossRef] [Google Scholar]
- Ji-yun, N.I.E., Li-xue, K., Zhi-xia, L.I., Wei-hua, X.U., Cheng, W., Qiu-sheng, C., An, L.I., 2016. Assessing the concentration and potential health risk of heavy metals in China’s main deciduous fruits 15, 1645–1655. https://doi.org/10.1016/S2095-3119(16)61342-4.
- Jothi, J.S., 2014. Detection of Heavy Metals in Some Commercial Brands of Noodles.
- Kabatha-Pendias, K., 2001. Soil constituents. 3rd ed. In: Kabatha-Pendias, K., Pendias, H. (Eds.), Trace Elements in Soil and Plants, CRC press, Boca Raton, FL, pp. 27–48.
- Khan, S., Rehman, S., Zeb, A., Khan, M.A., Shah, M.T., 2010. Ecotoxicology and Environmental Safety Soil and vegetables enrichment with heavy metals from geological sources in Gilgit, northern Pakistan 73, 1820–1827. https://doi.org/10.1016/j.ecoenv.2010.08.016.
- Some heavy metal and trace essential element detection in canned vegetable foodstuffs by differential pulse polarography (DPP) Electronic J. Environ. Agric. Food Chem.. 2005;4:871-878.
- [Google Scholar]
- Krejpcio, Z., Sionkowski, S., Bartela, J., 2005. Safety of fresh fruits and juices available on the polish market as determined by heavy metal residues 14, 877–881.
- Talanta Simultaneous determination of cadmium, iron and tin in canned foods using high-resolution continuum source graphite furnace atomic absorption spectrometry. Talanta. 2016;153:45-50.
- [CrossRef] [Google Scholar]
- Effects of animal size on concentrations of metallothionein and metals in periwinkles littorina littorea collected from the firth of clyde. Scotland. 1999;39:8-9.
- [Google Scholar]
- Adaptive sparse principal component analysis for enhanced process monitoring and fault isolation. Chem. Int. Lab. Sys.. 2015;146:426-436.
- [Google Scholar]
- Mineral and Exercise. In: Sport Nutrition for Health and Performance. New York, USA: Thames and Hudson; 2009. p. :608.
- [Google Scholar]
- Chemosphere Monitoring of pesticides and heavy metals in cucumber fruits produced from different farming systems. Chemosphere. 2009;75:601-609.
- [CrossRef] [Google Scholar]
- Martorell, I., Perelló, G., Martí-cid, R., Llobet, J.M., Castell, V., Domingo, J.L., 2011. Human exposure to arsenic, cadmium, mercury, and lead from foods in Catalonia, Spain: Temporal Trend 309–322. https://doi.org/10.1007/s12011-010-8787-x.
- Massadeh, A.M., Al-massaedh, A.A.T., 2018. Determination of heavy metals in canned fruits and vegetables sold in Jordan market 1914–1920.
- Mukantwali, C., Laswai, H., Tiisekwa, B., Wiehler, S., 2014. Microbial and heavy metal contamination of pineapple products processed by small and medium scale processing enterprises in Rwanda 13, 3977–3984. https://doi.org/10.5897/AJB2014.13906.
- Musaiger, A.O., 2008. Occurrence of contaminants in foods commonly consumed in Bahrain 19, 854–861. https://doi.org/10.1016/j.foodcont.2007.08.011.
- A follow-up study health risk assessment of heavy metal leachability from household cookwares. J. Food Sci. Toxicol.. 2017;1:3.
- [Google Scholar]
- Parkar, J., Rakesh, M., 2018. Risk Assessment of Dietary Elemental Intakes Contributed by Commercial Baby Foods from Indian Market Risk Assessment of Dietary Elemental Intakes Contributed by Commercial Baby Foods from Indian Market. doi.org/10.13140/RG.2.2.25266.30408.
- Accumulation of selected metals in the fruits of medicinal plants grown in urban environment of. J. Chem. Arab.. 2020;13:308-317.
- [Google Scholar]
- Toxic metals (Al, Cd, Pb and Hg) in the most consumed edible seaweeds in Europe. Chemosphere. 2019;218:879-884.
- [Google Scholar]
- Poornima, S., Ashwini, S., Balakrishna, S.M., 2014. Analysis of heavy metals in edible jams – a case study 4, 209–212.
- General public's and physicians' perception of health risk associated with radon exposure in the state of Azad Jammu and Kashmir. Public Health Nurs.. 2008;25:327-335.
- [Google Scholar]
- Roba, C., Ro, C., Pi, I., Ozunu, A., Baciu, C., 2016. Heavy metal content in vegetables and fruits cultivated in Baia Mare mining area (Romania) and health risk assessment 6062–6073. https://doi.org/10.1007/s11356-015-4799-6.
- Rubio, C., Martínez, C., Paz, S., Gutiérrez, A.J., González-weller, D., Revert, C., Burgos, A., Hardisson, A., 2018. Trace element and toxic metal intake from the consumption of canned mushrooms marketed in Spain.
- Shaheen, N., Nourin, I., Islam, S., 2016. Chemosphere Presence of heavy metals in fruits and vegetables: Health risk implications in Bangladesh 152. doi.org/10.1016/j.chemosphere.2016.02.060.
- Assessment of heavy metal content in refined and unrefined salts obtained from Urmia, Iran. Toxin Rev.. 2017;36:89-93.
- [Google Scholar]
- Singh, R., Gandhi, M., Gramoday, C., Ahirwar, N.K., Gandhi, M., Gramoday, C., Tiwari, J., Pathak, J., 2018. Review on sources and effect of heavy metal in soil: its 0–22.
- Health risk assessment of heavy metals via dietary intake of foodstuffs from the wastewater irrigated site of a dry tropical area of India. Food Chem. Toxicol.. 2010;48:611-619.
- [CrossRef] [Google Scholar]
- Ecotoxicology and Environmental Safety Assessment of spatial distribution and potential ecological risk of the heavy metals in relation to granulometric contents of Veeranam lake sediments, India. Ecotoxicol. Environ. Saf.. 2012;84:117-124.
- [CrossRef] [Google Scholar]
- Evaluation of a simple and fast method for the multi-elemental analysis in commercial fruit juice samples using atomic emission spectrometry. Food Chem.. 2013;141:3466-3472.
- [CrossRef] [Google Scholar]
- Tasnim, F., M, A.H., Nusrath, S., M, K.H., Lopa, D., 2010. Quality Assessment of Industrially Processed Fruit Juices Available in Dhaka City, Bangladesh.
- Heavy metal toxicity and the environment. Exp. Suppl.. 2012;2012(101):133-164.
- [CrossRef] [Google Scholar]
- Determination of selected heavy metals and Iron concentration in two common fish species in Densu River at Weija District in Grater Accra region of Ghana. Amer. Int. J. Bio.. 2013;1:45.
- [Google Scholar]
- Tuzen, M., 2007. Food Chemistry Evaluation of trace element contents in canned foods marketed from Turkey 102, 1089–1095. https://doi.org/10.1016/j.foodchem.2006.06.048.
- USEPA region III risk-based concentration table: Technical background information. Washington, DC: United States Environmental Protection Agency; 2006.
- USEPA, 2002. A Review of the Reference Dose and Reference Concentration Processes. EPA/630/P-02/002F. http://www2.epa.gov/osa/review-reference-dose-and-reference-concentration-processes.
- USEPA, 2015. United state environmental protection agency. Quantitative Risk Assessment Calculations 7–9. https://www.epa.gov/sites/production/files/2015-05/documents/13.pdf.
- Guidelines for Drinking Water Quality: Heath Criteria and Other Supporting Information. Vol Vol. 2. Geneva: WHO; 1984.
- Concentration and potential health risk of heavy metals in market vegetables in Chongqing, China. Ecotoxicol. Env. Saf.. 2011;74:1664-1669.
- [Google Scholar]
Appendix A
Supplementary material
Supplementary data to this article can be found online at https://doi.org/10.1016/j.arabjc.2020.10.020.
Appendix A
Supplementary material
The following are the Supplementary data to this article:Supplementary Data 1
Supplementary Data 1


