

Translate this page into:
Quantification of macro, micro and trace elements, and antimicrobial activity of medicinal herbs and their products
⁎Corresponding author at: Department of Chemistry, Shaheed Benazir Bhutto Women University, Peshawar, Pakistan. nargisjamila@sbbwu.edu.pk (Nargis Jamila)
⁎⁎Corresponding author at: Department of Chemistry, Kohat University of Science and Technology, Kohat, Khyber Pakhtunkhwa, Pakistan. nkhan812@gmail.com (Naeem Khan),
-
Received: ,
Accepted: ,
This article was originally published by Elsevier and was migrated to Scientific Scholar after the change of Publisher.
Abstract
Abstract
Macro, micro, and essential elements of 13 herbs and their products from Pakistan. Microwave assisted digestion, ICP-OES, and ICP-MS analysis. Toxic elements content determination of herbs and products. Antimicrobial potential of herbs and products. Toxic elements within the permissible limits.
Abstract
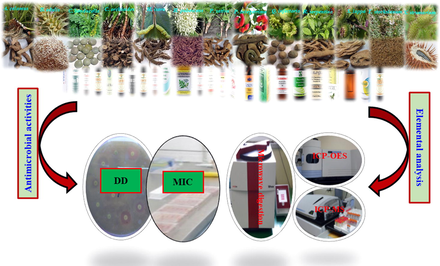
The study describes the content of macro, micro, and trace essential and toxic elements in thirteen medicinal herbs and their products including Acorus calamus, Blepharis edulis, Caesalpinia bonducella, Curculigo orchioides, Helicteres isora, Holarrhena pubescens, Pastinaca sativa, Pistacia integerrima, Quercus infectoria, Rauwolfia serpentina, Saussurea lappa, Teucrium stocksianum, and Xanthium strumarium available in the local markets of Pakistan. The elemental content were analyzed with the techniques of inductively coupled plasma (ICP) optical emission spectroscopy (OES) and ICP-mass spectrometry (MS). Furthermore, their antibacterial and antifungal activities were evaluated against the selected microbial pathogens including Staphylococcus aureus, Pseudomonas aeruginosa, Bacillus subtilis and Escherichia coli, Candida albicans, Candida krusei, Aspergillus flavus, and Trichophyton mentagrophytes. Among macro elements, K and Ca showed the highest content, micro elements were in the order of Rb85/ Sr87 > Zn64/Cu63 > Ni60, and among essential trace elements, the content of Cr52/Cr53 and Co59 were high. The content of the analyzed toxic elements were lower than the permissible standard values. The antimicrobial activities against the subject strains were significant with inhibition zones of 7.0-19.0 mm in disc diffusion procedure, and 62.5–1000 µg/mL in minimum inhibitory concentration method. Hence, the presence of nutritional elements at appreciable concentrations, toxic elements within permissible ranges, and significant antimicrobial potential assume the subject herbs as promising nutritional and therapeutic remedies.
Keywords
Herbs
Pakistan
Trace elements
Inductively coupled plasma-optical emission spectroscopy
Antimicrobial

1 Introduction
Plants, either herbs, fruits or vegetables in the form of food and supplement are the main source of bioactive components and inorganic elements, and traditionally used to cure different diseases (Dall'Acqua et al., 2009; Billah et al., 2013; Peng et al., 2014; Jamila et al., 2016). In today’s market, a large number of medicinal herbs and their formulations are available to treat various diseases. For example, the species; Acorus calamus, Blepharis edulis, Caesalpinia Bonducella, Cuculigo orchioides, Helicteres isora, Holarrhena pubescens, Pastinaca sativa, Pistacia integrima, Quercus infectoria, Rauwolfia serpentina, Sassurea lappa, Teucrium stocksianum, and Xantium stumarium and their products are found in the Pansaar/Hakeems’ shops throughout Pakistan, which are used by the local people for the treatment of ulcer, diarrhea, digestive disorders, asthma, cough, diabetes, cardiovascular and as tonic (Table S1, supplementary material). Medicinal herbs are cost effective and easily accessible, and therefore a large number of Pakistani population specifically local segments, rely on these medicinal herbs. A. calamus is an aromatic plant playing significant role in the nervous system disorders, removal of fat, hemorrhoids, nasal problems, colic pain, diabetes, bronchitis, and skin diseases having anti-inflammatory, antidiabetic, and antimicrobial properties (Kim et al., 2009; Wu et al., 2009). B. edulis distributed throughout Pakistan, Iran, Afghanistan, and India is sold in markets as diuretic, expectorant, and wounds healing agent, showing significant antimicrobial, anticancer, and antiplatelet aggregation activities (Mahboubi et al., 2013). C. bonducella is utilized to cure tumors, inflammation, and liver disorders possessing antidiarrheal, antimicrobial, antidiabetic, antitumor, anti-inflammatory, and antioxidant properties (Billah et al., 2013). C. orchioides is locally used for jaundice, asthma, male sex dysfunction, bleeding, injuries, and to regulate menstrual cycle and possesses hepatoprotective, cytotoxic, and anticonvulsive properties (Wu et al., 2005; Dall'Acqua et al., 2009; Nie et al., 2013). H. isora is used to treat diarrhea, snake biting, and constipation (Kumar and Singh, 2014). H. pubescens is useful in amoebic dysentery, spleen and chest infections (Tuntiwachwuttikul et al., 2007; Yang et al., 2012). P. sativa is known as tonic, anti-inflammatory, and carminative (Waksmundzka-Hajnos et al., 2004). P. integerrima has been reported to reduce inflammation and gastrointestinal disorder having anticancer, anti-inflammatory, and leishmanicidal activities (Ahmad et al., 2008; Rauf et al., 2014). Q. infectoria is used as wound healing, in digestive disorders, kidneys, dental, and vaginal tightening in Asia (Fan et al., 2014; Kaur et al., 2004). R. serpentina is widely utilized as antihypertensive and tranquilizing agent to cure schizophrenia, cholera, colic, and snakebite (Bharti et al., 2017). S. lappa is used to cure skin allergies, asthma, carminative, and anthelmintic (Robinson et al., 2008; Julianti et al., 2011). T. stocksianum has been used in stomachic, diarrhea, diabetes, gastrointestinal ailments, and sore throat having anti-inflammatory activity (Bakhtiari and Asgarpanah, 2015; Shah and Shah, 2015). X. strumariam is taken in asthma, nasal sinusitis, and headache (Han et al., 2007; Peng et al., 2014). The detailed phytochemical and pharmacological profile of these medicinal herbs is given in Table S1, supplementary material.
Plants are the main source of several elements, which are essential for human beings. The elements when present in large quantity (100 mg/g) are known as macronutrients/major elements, those in small amounts (>1 µg/g) referred as micronutrients or minor elements or those present in trace amount (<1 µg/g) are called trace elements. These elements have major functions in metabolic cycles and inhibition of diseases within their recommended and permissible ranges. Therefore, to fulfil the nutritional requirement, plants and herbs should be used in the daily diet. In addition, consumers have increased interest to choose the diet having high nutrient levels, preferably from natural sources (Asioli et al., 2017). However, nowadays, the use of fertilizers and pesticides have been considerably contributed to the increased level of non-biodegradable toxic metals such as arsenic, cadmium, lead, and mercury in the soil and crops, which are accumulated by vegetables, fruits and medicinal plants/herbs (Chen et al., 2014; Bloise et al., 2016, 2020). In products formulation and synthesis, various processes including extraction, dehydration, refrigeration, preservation, packaging and storage can cause contamination of the products with toxic metals (Abbasi et al., 2020). For example, several Indian and Chinese herbal medicines contained lead, arsenic, and mercury more than the permissible limits, which caused poisoning to human (Saeed et al., 2011; Shen et al., 2012). The excessive accumulation of these metals in food and herbal medicine may pose serious health risks to humans upon consumption. Hence, besides the market quality attributes, the determination of content levels (permissible/impermissible) of toxic metals, and safety of the medicinal herbs and their products need to be investigated.
Different analytical techniques such as atomic absorption spectrometry, inductively coupled plasma optical emission spectroscopy (ICP-OES), and inductively coupled plasma mass spectrometry (ICP-MS) have been applied for content determination of trace essential and toxic elements in environmental and biological samples (Huang et al., 2007; Ivanova-Petropulos et al., 2015; Park et al., 2018). Among these methods, ICP-MS and ICP-OES are efficient and accurate techniques with low detection limits and wider linear dynamic range (Park et al., 2018; Jamila et al., 2019, 2020).
Considering the scientific and consumers’ demand predominantly the toxicity associated with heavy metals, the present study aimed to analyze medicinal herbs including A. calamus, B. edulis, C. Bonducella, C. orchioides, H. isora, H. pubescens, P. sativa, P. integerrima, Q. infectoria, R. serpentina, S. lappa, T. stocksianum, X. strumarium, and their products available in the local markets of Khyber Pakhtunkhwa, Pakistan. The content of macronutrients (Al, Ca, Fe, K, Mg, Na, P, S), micronutrients (Cu, Ni, Rb, Sr, Zn), trace essential nutrients (Co, Cr, Se, V), trace non-toxic (Ga, Li), and toxic elements (As, Ba, Be, Cd, Cs, In, Pb, Tl, U) were determined. The applied ICP-OES and ICP-MS techniques were validated by quality parameters; limits of detection (LOD), limits of quantification (LOQ), precision (%RSD), spiking recovery tests, analyzing the certified reference materials (NIST-1570a, spinach leaves), and by participation in accredited laboratory proficiency test (inter laboratories calibrations) organized by Food Analysis Performance Assessment Scheme (FAPAS). Plants are the potential sources of antimicrobial drugs against microbial pathogens (Shin et al., 2018; Hammerbacher et al., 2019). Therefore, the current study in addition to the elemental content determination, reports the antibacterial and antifungal activities of the subject medicinal herbs ad their related products.
2 Materials and methods
2.1 Samples collection
A. calamus (root), B. edulis (seeds), C. Bonducella (seeds), C. orchioides (root), H. isora (fruit), H. pubescens (seeds), P. sativa (root), P. integerrima (fruit), Q. infectoria (galls), R. serpentina (root), S. lappa (root), T. stocksianum (aerial part), and X. strumarium (leaves) and their products (P1-P39) in triplicate, were collected and procured from three different markets of Peshawar, Khyber Pakhtunkhwa, during January-June 2019. The samples were identified by a Taxonomist from Kohat University of Science and Technology, Kohat, and the voucher specimen are deposited at the Herbarium of Department of Botany.
2.2 Chemicals and instrumentation
Chemicals for the samples digestion and elemental analysis; nitric acid (HNO3), hydrogen peroxide (H2O2), ultra-pure deionized water (>18.0 MΩ.cm), multi-element standards (1000 mg/L and 10 mg/L), and standard reference material (SRM-1570a, spinach leaves) were purchased from Dongwoo, Fine-Chem (Korea), Millipore (Bedford, MA, USA), Perkin Elmer (CT, USA), and National Institute of Standards and Technology, NIST (Gaithersburg, MD, USA). For samples digestion and elemental profile, a microwave reaction system (Analytik Jena Topwave 3000, Austria), an ICP-OES (Optima 8000), and ICP-MS (300D) were used under the conditions established by our laboratory (Park et al., 2018; Jamila et al., 2019). Microbial strains; Staphylococcus aureus (ATCC 29213), Bacillus subtilis (ATCC 19659), Pseudomonas aeruginosa (ATCC 17588), Escherichia coli (ATCC 25922), Candida albicans (ATCC90029), Candida krusei (ATCC6258), Aspergillus flavus (ATCC9807), and Trichophyton mentagrophytes (ATCC40004), nutrient agar (Muller Hinton Broth), p-iodonitrotetrazolium chloride (INT), vancomycin, streptomycin, fluconazole, and amphotericin were purchased from Oxoid (England) and Sigma-Aldrich (USA).
2.3 Samples preparation for elemental analysis and antimicrobial activity
For elemental analysis, the dried powdered samples were digested using microwave digestion system and decomposition procedures (Park et al., 2018; Jamila et al., 2019) in which 0.5 g of the samples were mixed with 1.0 mL H2O2 (30%, v/v) and 7.0 mL HNO3 (70%) in microwave polytetrafluoroethylene digestion vessels. The system was operated at 1000 W and different temperature as; 80 °C, 5 min; 120 °C, 5 min; 150 °C, 5 min; 180 °C, 20 min; and cooling at 40 °C. After decomposition, the combusted samples after dilution with deionized water up to 20.0 g were filtered and subjected to elemental analysis. For antimicrobial activity, the ethanolic extracts of the subject samples were prepared by extracting dried grinded samples (10 g) in Soxhlet extractor with ethanol (100 mL) and evaporation through rotary evaporator.
2.4 Elemental analysis and validation of ICP-OES and ICP-MS techniques
Macronutrients; Al, Ca, Fe, K, Mg, Na, P and S were analyzed by ICP-OES whereas micro (Cu, Ni, Rb, Sr, Zn), trace essential (Co, Cr, Se, V), trace non-toxic (Li, Ga) and trace toxic (As, Ba, Be, Cd, Cs, In, Os, Pb, Tl, U) elements were determined by ICP-MS technique. The methods were validated through linearity, limits of detection and quantification (LOD, LOQ), precision, accuracy, and analysis of certified reference material (Park et al., 2018; Jamila et al., 2019). The LOD and LOQ were calculated as three and ten times standard deviations (3xSD and 10xSD) from ten replicates of blank per slope of the calibration curve, respectively.
2.5 Antimicrobial activity assessments of herbs and their products
Antimicrobial activity was determined using disc diffusion (DD) and micro-dilution (MD) methods against S. aureus, B. subtilis, P. aeruginosa, E, coli, C, albicans, C. krusei, A. flavus, and T. mentagrophytes using Muller-Hinton agar (MHA) and broth (MHB) micro-dilution methods (Jamila et al., 2020). In DD assay, an inoculum of 100 μL was streaked on the Mueller–Hinton agar surface using a sterile cotton swab. Then, sterile paper disc impregnated with 20 μL of 2000 μg/mL (2 mg extract per 1 mL of ethanol) extracts of each herb and product sample, and the standards including streptomycin, vancomycin, fluconazole, and amphotericin were kept on inoculated agar. The samples were incubated at 37 °C overnight, and after that, the diameters of inhibition zone (mm) were measured. In MD assay, a concentration range of 1000–31.25 µg/mL using sterile flat-bottom 96-well plate was performed. The bacterial strains were Bacillus subtilis, Staphylococcus aureus, Escherichia coli and Pseudomonas aeruginosa whereas yeasts included Candida albicans, Candida krusei, Aspergillus flavus, and Trichophyton mentagrophytes.
2.6 Statistical analysis
The obtained results are reported as means ± standard deviations (n = 3). The mean significant differences (represented by superscript letters) between the obtained values were analyzed using ANOVA along with Tukey’s HSD test in SPSS, version 20.0 (SPSS Inc., Chicago, USA). Data are expressed with a significance level of p < 0.05.
3 Results and discussion
3.1 Validation of ICP-OES and ICP-MS techniques
The validation results obtained are given in Table S2, supplementary material. The values of relative standard deviation (%RSD) for precision were below 3%, and spike recovery (%) obtained was ranging from 94 to 104%. The recoveries of reference material; NIST SRM-1573a, tomato leaves analysis for accuracy are given in Table S3, supplementary material. In the inter laboratories calibrations by FAPAS, the results of the proficiency test were successfully achieved within 0.5 Z-score. Hence, the applied techniques for the elemental analysis of the subject herbs fulfill the required standards of Association of Official Analytical Chemists (AOAC, 2012).
3.2 Elemental content analysis of herbs and their products
A large segment of the developing countries still relies on the traditional medicine due to their efficacy and accessibility. However, contamination of medicinal herbs and their products with heavy metals, which ultimately affect their safety and quality, is one of the most pressing threats to human health as well as the pharmaceutical industries (Asgari et al., 2017). The results (mean ± standard deviation, µg/g) of macro, micro and essential trace nutrients are enlisted as Tables 1–6. From the result of the elemental analysis, it was found that the content of the macronutrients are in the order of: K > P > Ca > Na > S > Mg > Fe > Al (A. calamus), K > Ca > P > Mg > Al > Fe > S > Na (B. edulis), K > P > Ca > Mg > S > Fe > Al > Na (C. bonducella), Ca > K > Al > Mg > P > Na > S > Fe (C. orchioides), K > Ca > Mg > P > S > Na > Fe > Al (H. isora), K > Ca > P > Mg > S > Fe > Al > Na (H. pubescens), K > P > Ca > Mg > S > Al > Na > Fe (P. integerrima), K > Ca > Mg > P > Fe > Al > S > Na (P. sativa), K > Ca > P > Mg > S > Na > Al > Fe (Q. infectoria), K > Ca > P > Mg > Al > Fe > S > Na (R. serpentina), Ca > K > Mg > S > P > Fe > Al > Na (S. lappa), K > Ca > Mg > Fe > Al > P > Na > S (T. stocksianum), and K > Ca > Mg > Al > Fe > P > S > Na (X. strumarium). All the herbs except C. orchioides and S. lappa showed the highest content of K followed by Ca. Overall, the analyzed herbs were preferably the rich sources of K, Ca, P, and Mg. An inconsistency and variations were found in the content of macronutrients, when compared to the literature, which might be attributed to geographical variations. For example, in Q. infectoria of Turkish origin, the content of K and Fe analyzed by atomic absorption spectroscopy, were present as 8326 µg/g and 19 µg/g, respectively. In A. calamus, the content of Ca, K, Al, and Fe were 2658 µg/g, 11447 µg/g, 979 µg/g, and 707 µg/g, respectively (Özcan and Bayçu, 2005; Özcan and Akbulut, 2008). Regarding the macro elements content, on the whole, Ca, K, Mg and Na were the dominating macronutrients in almost all the products whereas S and P were present at lower concentrations (Table 2).
Elements
A. calamus
B. edulis
C. Bonducella
C. orchioides
H. isora
H. pubescens
P. integerrima
P. sativa
Q. infectoria
R. serpentina
S. lappa
T. stocksianum
X. strumarium
Macro elements
Al
308 ± 21.3
33.1 ± 6.26
24.8 ± 6.39
3188.5 ± 152.7
2.5 ± 0.68
853.6 ± 197.6
114.8 ± 18.6
728.6 ± 24.6
32.4 ± 8.7
785.7 ± 46.0
174.5 ± 24.3
2712.3 ± 448.3
893.6 ± 211.1
Ca
4634.9 ± 136.2
155.2 ± 11.6
1181.0 ± 44.6
16293.6 ± 293.3
141.9 ± 1.44
9409.0 ± 221.6
1918.5 ± 37.0
6306.3 ± 46.0
1426.0 ± 12.4
6515.8 ± 562.3
14984.7 ± 765.8
12569.3 ± 741.6
6012.8 ± 284.8
Fe
758.3 ± 34.5
29.9 ± 2.16
56.2 ± 1.97
225.3 ± 126.2
2.85 ± 0.408
1063.5 ± 230.2
39.8 ± 5.39
776.6 ± 17.3
16.6 ± 2.45
630.7 ± 37.3
234.9 ± 16.2
3067.2 ± 554.0
733.8 ± 76.4
K
29748.0 ± 970.5
400.4 ± 1.48
15887.6 ± 244.0
10249.1 ± 384.1
523.6 ± 13.7
10336.5 ± 233.2
24556.5 ± 616.2
8180.8 ± 193.7
6821.6 ± 76.5
10256.4 ± 492.1
7591.0 ± 283.8
15509.6 ± 735.2
7341.1 ± 143.6
Mg
1291.0 ± 26.5
68.2 ± 1.45
1015.9 ± 32.0
2728.8 ± 84.9
104.5 ± 6.87
3048.7 ± 31.6
727.8 ± 50.4
1549.8 ± 145.7
411.9 ± 2.29
1157.1 ± 33.6
2771.3 ± 189.6
3143.4 ± 207.8
1382.3 ± 26.5
Na
2439.6 ± 105.8
8.96 ± 0.770
14.0 ± 3.62
428.3 ± 36.5
2.99 ± 0.586
94.3 ± 12.4
79.2 ± 25.8
76.5 ± 8.2
73.5 ± 0.403
196.3 ± 23.0
29.9 ± 7.08
1515.9 ± 84.9
177.6 ± 82.5
P
6372.6 ± 77.9
114.7 ± 4.45
2653.5 ± 91.5
1105.9 ± 26.7
67.5 ± 6.58
5586.3 ± 233.2
2737.7 ± 57.9
999.7 ± 40.9
565.4 ± 12.4
2131.2 ± 159.0
1495.4 ± 49.2
2045.6 ± 83.7
725.6 ± 5.85
S
1385.9 ± 35.5
14.8 ± 0.415
362.7 ± 7,03
282.5 ± 9.70
11.0 ± 0.841
1111.2 ± 12.1
188.2 ± 5.70
242.7 ± 20.2
80.9 ± 4.75
573.4 ± 26.3
1754.5 ± 102.4
616.8 ± 32.9
178.3 ± 0.858
Micro elements
Ni60
1.30 ± 0.052
0.095 ± 0.016
2.01 ± 0.129
7.17 ± 0.171
0.080 ± 0.019
8.21 ± 0.760
0.8500.061±
4.94 ± 0.382
3.01 ± 0.278
7.09 ± 0.042
4.61 ± 0.246
6.36 ± 0.613
5.93 ± 0.507
Cu63
8.21 ± 0.137
0.554 ± 0.045
9.30 ± 0.305
6.90 ± 0.230
0.206 ± 0.022
10.5 ± 0.764
2.60 ± 0.088
4.78 ± 0.127
4.36 ± 0.194
9.48 ± 0.442
0.824 ± 0.007
8.03 ± 0.092
9.59 ± 0.213
Zn64
17.1 ± 0.968
0.856 ± 0.024
23.2 ± 0.813
50.8 ± 0.830
0.861 ± 0.086
41.2 ± 1.30
7.91 ± 2.89
23.2 ± 1.89
3.91 ± 1.45
20.23 ± 0.779
9.53 ± 0.453
31.2 ± 0.524
26.9 ± 0.676
Sr87
162.8 ± 7.23
0.649 ± 0.043
122.9 ± 2.05
416.1 ± 10.7
8.68 ± 0.342
180.0 ± 15.0
184.2 ± 11.2
62.4 ± 25.4
113.7 ± 5.74
164.5 ± 7.79
417.1 ± 15.1
140.6 ± 2.45
192.1 ± 8.43
Rb85
83.7 ± 4.75
1.45 ± 0.309
137.5 ± 2.75
284.0 ± 5.56
8.18 ± 0.290
145.7 ± 13.6
215.9 ± 11.9
6.79 ± 0.186
124.1 ± 7.37
13.1 ± 7.77
80.3 ± 1.63
67.4 ± 2.18
106.5 ± 5.55
Trace essential elements
V51
0.95 ± 0.03
0.10 ± 0.002
0.09 ± 0.001
5.78 ± 0.386
0.01 ± 0.0009
2.84 ± 0.482
0.10 ± 0.003
2.57 ± 0.16
0.12 ± 0.002
1.73 ± 0.089
0.722 ± 0.119
5.25 ± 0.880
2.54 ± 0.31
Cr52
1.21 ± 0.090
0.295 ± 0.108
3.70 ± 0.529
7.957 ± 0.365
0.040 ± 0.004
89.2 ± 15.3
0.777 ± 0.144
5.62 ± 0.037
0.526 ± 0.127
33.7 ± 6.97
1.60 ± 0.120
8.08 ± 0.857
3.76 ± 0.430
Cr53
1.13 ± 0.092
0.214 ± 0.004
2.40 ± 0.552
8.66 ± 0.412
0.032 ± 0.004
21.0 ± 3.70
0.506 ± 0.130.6
5.83 ± 0.395
0.445 ± 0.137
10.7 ± 0.772
1.45 ± 0.108
7.87 ± 0.926
3.27 ± 0.404
Co59
0.697 ± 0.015
0.011 ± 0.001
0.418 ± 0.004
1.359 ± 0.084
0.003 ± 0.0003
0.496 ± 0.039
0.025 ± 0.0004
0.461 ± 0.028
0.087 ± 0.021
0.506 ± 0.042
0.171 ± 0.049
0.736 ± 0.128
0.771 ± 0.033
Se82
0.033 ± 0.010
0.001 ± 0.0002
0.051 ± 0.003
1.44 ± 0.194
0.0006 ± 0.0001
0.052 ± 0.008
0.010 ± 0.001
0.190 ± 0.041
0.051 ± 0.011
0.178 ± 0.037
0.088 ± 0.018
0.833 ± 0.224
0.016 ± 0.009
Trace non toxic elements
Li7
0.196 ± 0.012
0.051 ± 0.003
0.167 ± 0.008
3.20 ± 0.224
0.006 ± 0.0006
0.702 ± 0.151
0.070 ± 0.002
3.61 ± 0.211
4.45 ± 0.424
2.20 ± 0.144
0.427 ± 0.101
7.12 ± 1.12
1.74 ± 0.281
Ga69
0.738 ± 0.049
0.013 ± 0.002
0.117 ± 0.009
2.63 ± 0.041
0.005 ± 0.0003
0.626 ± 0.030
0.110 ± 0.023
1.79 ± 0.045
0.273 ± 0.067
0.698 ± 0.048
0.889 ± 0.058
0.756 ± 0.136
2.86 ± 0.207
Trace toxic elements
As75
0.212 ± 0.044
0.008 ± 0.002
0.026 ± 0.002
0.189 ± 0.012
0.001 ± 0.00008
0.091 ± 0.005
0.018 ± 0.002
0.221 ± 0.017
0.040 ± 0.008
0.168 ± 0.020
0.063 ± 0.015
0.899 ± 0.127
0.159 ± 0.042
Cd111
0.021 ± 0.001
0.0004 ± 0.00004
0.014 ± 0.001
0.028 ± 0.008
0.0008 ± 0.000004
0.019 ± 0.002
0.002 ± 0.0009
0.025 ± 0.003
0.022 ± 0.003
0.021 ± 0.001
0.041 ± 0.009
0.088 ± 0.0002
0.052 ± 0.002
In115
0.009 ± 0.004
0.0002 ± 0.00004
0.0001 ± 0.00001
0.004 ± 0.0001
0.0003 ± 0.000001
0.011 ± 0.0001
0.012 ± 0.00002
0.002 ± 0.0003
0.071 ± 0.006
0.008 ± 0.002
0.054 ± 0.011
0.003 ± 0.0007
0.010 ± 0.0002
Cs133
0.019 ± 0.001
0.008 ± 0.00003
0.027 ± 0.0002
0.526 ± 0.021
0.005 ± 0.0003
0.182 ± 0.057
0.355 ± 0.131
0.236 ± 0.011
0.367 ± 0.020
0.295 ± 0.018
0.171 ± 0.0008
0.506 ± 0.088
266.8 ± 0.035
Ba138
418.8 ± 9.72
3.25 ± 0.085
5.35 ± 0.315
1086.0 ± 187.9
3.83 ± 0.166
375.7 ± 44.2
5.18 ± 1.02
772.3 ± 34.2
102.0 ± 5.60
205.4 ± 15.3
680.5 ± 23.1
182.5 ± 22.0
1829.9 ± 67.8
Be9
0.003 ± 0.0006
0.0004 ± 0.00007
0.0009 ± 0.0002
0.044 ± 0.002
0.00005 ± 0.000008
0.016 ± 0.002
0.00004 ± 0.00001
0.018 ± 0.001
0.025 ± 0.003
0.016 ± 0.0009
0.017 ± 0.003
0.038 ± 0.0007
0.016 ± 0.004
Tl205
0.028 ± 0.008
0.0003 ± 0.00004
0.005 ± 0.0002
0.043 ± 0.001
0.0006 ± 0.0001
0.007 ± 0.001
0.007 ± 0.0001
0.015 ± 0.0004
0.080 ± 0.016
0.033 ± 0.002
0.057 ± 0.090
0.020 ± 0.003
0.024 ± 0.001
Pb206
2.99 ± 0.260
0.051 ± 0.006
4.58 ± 0.465
1.24 ± 0.069
0.040 ± 0.022
0.872 ± 0.068
0.429 ± 0.060
1.98 ± 0.168
0.917 ± 0.242
0.638 ± 0.064
2.15 ± 0.061
4.51 ± 0.937
1.84 ± 0.190
Pb208
3.03 ± 0.274
0.051 ± 0.005
4.86 ± 0.461
1.28 ± 0.067
0.039 ± 0.023
0.833 ± 0.077
0.419 ± 0.063
2.04 ± 0.189
0.933 ± 0.241
0.638 ± 0.060
2.14 ± 0.051
4.80 ± 1.12
1.82 ± 0.199
U238
0.038 ± 0.004
0.002 ± 0.00008
0.002 ± 0.0001
0.047 ± 0.002
0.000009 ± 0.000009
0.181 ± 0.015
0.005 ± 0.0003
0.059 ± 0.007
0.0001 ± 0.00003
0.091 ± 0.008
0.002 ± 0.0009
0.004 ± 0.001
0.038 ± 0.009
Herb
Product
Al
Ca
K
Fe
Mg
Na
P
S
A. calamus
P1
18.7 ± 1.44
196.7 ± 6.08
219.7 ± 8.19
116.8 ± 1.01
186.3 ± 1.17
179.5 ± 3.03
39.3 ± 0.173
138.9 ± 2.78
P2
93.7 ± 3.17
119.4 ± 2.09
210.0 ± 1.43
104.9 ± 0.91
389.2 ± 11.9
215.8 ± 6.49
59.8 ± 1.60
219.7 ± 10.5
P3
29.5 ± 3.02
194.3 ± 11.6
307.1 ± 7.91
148.4 ± 5.79
201.8 ± 5.19
172.4 ± 3.82
48.7 ± 1.03
176.0 ± 5.29
B. edulis
P4
28.3 ± 1.16
186.4 ± 7.18
227.9 ± 5.05
167.2 ± 5.19
56.9 ± 0.91
17.6 ± 0.59
38.9 ± 1.00
85.3 ± 1.03
P5
50.5 ± 2.15
169.2 ± 3.19
257.7 ± 4.41
94.7 ± 1.04
79.0 ± 3.17
37.6 ± 1.49
50.3 ± 1.03
106.8 ± 4.19
P6
38.3 ± 0.916
119.4 ± 3.00
301.2 ± 11.0
108.9 ± 1.38
84.0 ± 2.11
28.9 ± 1.11
41.7 ± 1.16
95.0 ± 1.93
C. bonducella
P7
101.8 ± 1.59
69.6 ± 3.10
206.7 ± 11.9
17.9 ± 0.917
191.4 ± 8.29
95.7 ± 5.82
71.5 ± 1.72
18.5 ± 0.617
P8
104.6 ± 7.13
58.4 ± 1.53
147.1 ± 11.3
42.8 ± 4.19
115.8 ± 4.72
100.6 ± 5.16
25.9 ± 2.91
32.6 ± 1.88
P9
131.7 ± 1.34
37.2 ± 1.10
151.5 ± 5.07
15.0 ± 1.93
93.7 ± 4.03
69.3 ± 3.07
17.5 ± 1.03
11.3 ± 1.08
C. orchioides
P10
73.2 ± 1.88
232.2 ± 7.93
531.7 ± 16.1
104.9 ± 6.17
128.4 ± 11.8
39.0 ± 5.09
48.1 ± 5.08
101.6 ± 11.0
P11
91.9 ± 1.13
159.6 ± 4.45
363.8 ± 12.9
248.4 ± 15.9
164.4 ± 16.9
61.8 ± 3.81
79.9 ± 7.16
90.0 ± 4.79
P12
58.6 ± 6.10
139.7 ± 13.7
293.1 ± 9.15
293.2 ± 21.7
175 ± 11.9
64.4 ± 5.23
91.9 ± 7.86
106.9 ± 12.2
H. isora
P13
2.10 ± 5.43
347.2 ± 15.3
229.5 ± 14.1
115.9 ± 15.8
188.3 ± 29.0
371.7 ± 28.3
19.0 ± 1.15
97.6 ± 19.5
P14
3.27 ± 0.941
323.1 ± 16.0
199.2 ± 7.88
110.8 ± 12.3
200.7 ± 10.7
314.3 ± 21.6
26.3 ± 1.63
99.3 ± 16.0
P15
5.51 ± 1.16
286.9 ± 13.9
217.3 ± 2.05
91.7 ± 7.65
214.6 ± 3.76
165.2 ± 12.6
23.2 ± 1.83
114.7 ± 11.7
H. pubescens
P16
5.99 ± 1.34
84.9 ± 1.41
277.8 ± 5.49
127.6 ± 9.51
381.1 ± 4.79
193.7 ± 10.2
181.3 ± 8.45
93.7 ± 9.89
P17
4.29 ± 1.61
94.8 ± 0.858
191.8 ± 11.3
113.5 ± 7.32
279.3 ± 13.4
178.3 ± 4.99
172.8 ± 11.7
113.5 ± 11.9
P18
9.17 ± 2.70
110.1 ± 14.3
266.9 ± 18.9
98.9 ± 9.94
237.3 ± 12.6
160.5 ± 12.9
235.2 ± 27.3
87.5 ± 8.39
P. integerrima
P19
11.7 ± 2.46
212.4 ± 9.99
391.2 ± 12.1
194.2 ± 9.18
254.5 ± 11.2
211.2 ± 3.99
283.8 ± 20.7
71.9 ± 10.5
P20
21.2 ± 2.46
194.7 ± 11.0
423.7 ± 16.6
236.8 ± 15.0
326.1 ± 13.7
143.9 ± 12.6
307.5 ± 19.0
94.9 ± 7.91
P21
32.8 ± 4.86
159.5 ± 14.4
352.8 ± 20.3
147.9 ± 16.7
366.4 ± 9.59
217.3 ± 10.5
123.6 ± 13.5
108.6 ± 10.1
P. sativa
P22
53.8 ± 2.95
71.5 ± 4.02
472.4 ± 13.6
79.6 ± 8.17
243.5 ± 10.4
154.1 ± 12.8
73.0 ± 6.29
51.9 ± 3.06
P23
63.4 ± 6.15
97.8 ± 7.51
630.5 ± 27.8
49.0 ± 4.52
193.6 ± 12.6
119.4 ± 9.69
105.4 ± 10.2
39.8 ± 3.17
P24
48.7 ± 3.16
104.7 ± 14.3
428.6 ± 28.9
103.7 ± 11.3
236.4 ± 9.93
138.2 ± 12.9
127.2 ± 16.8
51.3 ± 9.74
Q. infectoria
P25
58.2 ± 7.98
285.7 ± 13.8
908.7 ± 73.5
197.9 ± 14.5
178.1 ± 15.5
205.6 ± 11.2
155.6 ± 15.3
98.1 ± 9.26
P26
61.9 ± 7.39
158.5 ± 12.9
715.4 ± 71.3
254.1 ± 10.7
213.5 ± 12.3
241.5 ± 28.1
194.2 ± 13.8
139.0 ± 19.4
P27
28.0 ± 2.95
170.3 ± 13.8
594.4 ± 41.8
295.7 ± 21.3
22.9c ± 1.39
50.8d ± 3.98
117.8 ± 9.01
172.6 ± 20.8
R. serpentina
P28
104.7 ± 23.9
481.5 ± 63.7
140.5 ± 11.8
194.8 ± 12.6
103.7 ± 9.78
37.7 ± 4.98
59.0 ± 6.44
84.2 ± 10.3
P29
92.3 ± 9.6
355.0 ± 25.0
112.6 ± 19.3
238.9 ± 17.8
117.5 ± 12.7
39.5 ± 3.13
71.3 ± 7.99
67.2 ± 5.87
P30
99.3 ± 7.36
265.6 ± 14.7
116.6 ± 15.8
211.4 ± 16.9
138.3 ± 13.8
45.9 ± 6.70
63.8 ± 8.15
59.9 ± 7.16
S. lappa
P31
16.8 ± 0.916
56.8 ± 5.8
271.3 ± 57.3
98.4 ± 11.7
112.2 ± 1.96
51.9 ± 3.73
31.8 ± 1.03
52.9 ± 2.85
P32
37.8 ± 6.82
49.5 ± 2.96
272.5 ± 15.6
127.9 ± 13.8
206.7 ± 26.6
79.9 ± 5.24
27.4 ± 1.58
63.7 ± 7.47
P33
20.6 ± 2.50
91.5 ± 7.85
167.6 ± 17.0
100.5 ± 8.04
203.4 ± 17.6
71.8 ± 5.78
36.9 ± 4.19
50.5 ± 2.03
T. stocksianum
P34
105.5 ± 9.33
80.6 ± 6.02
941.9 ± 57.3
73.2 ± 5.81
531.6 ± 65.4
401.9 ± 43.5
137.8 ± 14.6
118.6 ± 11.4
P35
99.6 ± 7.62
104.7 ± 11.3
888.5 ± 94.9
58.3 ± 6.14
396.1 ± 21.8
430.8 ± 37.4
103.7 ± 11.9
144.7 ± 12.9
P36
87.9 ± 9.18
118.3 ± 15.8
885.1 ± 78.6
63.7 ± 7.72
305.3 ± 35.9
413.4 ± 26.9
99.6 ± 9.36
102.7 ± 11.1
X. strumarium
P37
116.8 ± 8.26
482.3 ± 86.2
407.6 ± 31.9
79.5 ± 8.16
378.8 ± 27.5
693.7 ± 56.0
72.4 ± 8.13
47.3 ± 4.11
P38
91.7 ± 7.31
493.4 ± 71.9
469.4 ± 87.8
65.8 ± 8.29
329.9 ± 22.69
562.0 ± 35.6
65.0 ± 7.14
39.6 ± 5.11
P39
77.3 ± 6.94
406.4 ± 31.9
519.4 ± 57.8
53.8 ± 7.35
311.6 ± 38.6
650.8 ± 60.2
55.7 ± 6.71
44.8 ± 3.19
Herb
Product
Ni60
Cu63
Zn64
Sr87
Rb85
A. calamus
P1
1.69 ± 0.111
1.11 ± 0.219
11.3 ± 1.95
59.3 ± 3.87
63.4 ± 4.69
P2
2.00 ± 0.107
1.49 ± 0.404
19.1 ± 1.18
50.1 ± 4.01
68.9 ± 6.19
P3
1.59 ± 0.405
0.915 ± 0.010
12.7 ± 1.67
61.2 ± 11.1
72.4 ± 3.07
B. edulis
P4
4.18 ± 0.311
0.518 ± 0.071
3.39 ± 0.017
2.17 ± 0.051
3.06 ± 0.215
P5
3.78 ± 0.401
0.383 ± 0.091
4.59 ± 1.02
3.14 ± 0.072
2.27 ± 0.081
P6
4.97 ± 0.917
0.69 ± 0.039
2.17 ± 0.729
2.73 ± 0.052
2.79 ± 0.471
C. bonducella
P7
1.60 ± 0.591
0.911 ± 0.029
9.18 ± 1.83
25.6 ± 1.21
95.8 ± 3.17
P8
2.01 ± 0.715
0.893 ± 0.091
12.8 ± 2.30
29.3 ± 2.17
104.8 ± 9.17
P9
2.06 ± 0.619
1.06 ± 0.431
10.4 ± 1.06
23.4 ± 1.73
110.6 ± 13.8
C. orchioides
P10
1.85 ± 0.092
0.557 ± 0.048
21.1 ± 2.79
74.3 ± 7.17
196.9 ± 11.0
P11
1.71 ± 0.094
0.618 ± 0.098
18.2 ± 3.50
79.5 ± 5.18
173.8 ± 10.4
P12
2.10 ± 0.097
1.00 ± 0.059
15.9 ± 1.16
80.3 ± 9.03
205.7 ± 15.6
H. isora
P13
0.454 ± 0.016
1.50 ± 0.261
1.75 ± 0.704
10.2 ± 1.00
10.1 ± 0.981
P14
0.706 ± 0.031
1.39 ± 0.906
2.60 ± 0.946
9.44 ± 0.973
9.63 ± 1.03
P15
0.517 ± 0.068
1.10 ± 0.291
3.38 ± 1.19
11.3 ± 2.03
11.7 ± 1.81
H. pubescens
P16
0.963 ± 0.031
1.32 ± 0.604
31.3 ± 3.16
90.3 ± 9.01
123.5 ± 9.24
P17
1.18 ± 0.059
1.49 ± 0.439
26.4 ± 2.01
101.1 ± 10.1
134.6 ± 8.24
P18
0.946 ± 0.051
1.68 ± 0.379
34.3 ± 4.15
87.1 ± 7.18
157.9 ± 14.0
P. integerrima
P19
2.09 ± 0.712
0.330 ± 0.005
2.50 ± 0.701
130.6 ± 8.83
169.9 ± 12.1
P20
2.01 ± 0.503
0.519 ± 0.073
2.18 ± 0.513
159.9 ± 10.8
193.7 ± 14.9
P21
1.87 ± 0.701
0.364 ± 0.014
3.11 ± 0.241
129.0 ± 6.78
207.7 ± 10.7
P. sativa
P22
4.03 ± 1.01
2.21 ± 0.037
4.57 ± 0.735
194.6 ± 14.7
11.5 ± 1.17
P23
4.72 ± 0.872
2.27 ± 0.031
4.44 ± 0.719
117.9 ± 10.0
11.0 ± 0.741
P24
4.43 ± 0.819
1.92 ± 0.043
4.92 ± 0.536
160.7 ± 13.8
9.47 ± 1.10
Q. infectoria
P25
2.61 ± 0.771
0.536 ± 0.091
0.971 ± 0.517
52.8 ± 7.93
117.8 ± 14.0
P26
3.01 ± 0.913
0.626 ± 0.017
0.986 ± 0.083
60.1 ± 6.09
126.1 ± 10.1
P27
2.89 ± 0.952
0.654 ± 0.080
1.36 ± 0.075
73.5 ± 9.15
109.6 ± 9.93
R. serpentina
P28
1.14 ± 0.089
0.357 ± 0.017
29.3 ± 4.10
103.6 ± 9.00
9.94 ± 1.06
P29
1.25 ± 0.348
0.328 ± 0.041
31.6 ± 2.27
97.6 ± 10.2
12.6 ± 1.59
P30
0.998 ± 0.063
0.295 ± 0.058
27.8 ± 2.96
113.1 ± 15.9
14.8 ± 1.51
S. lappa
P31
0.108 ± 0.021
0.009 ± 0.001
7.89 ± 1.01
180.1 ± 20.6
71.4 ± 7.91
P32
0.095 ± 0.009
0.016 ± 0.003
6.94 ± 1.00
203.7 ± 17.1
87.1 ± 11.0
P33
0.122 ± 0.030
0.019 ± 0.002
8.73 ± 0.994
317.9 ± 19.2
76.2 ± 7.38
T. stocksianum
P34
5.21 ± 1.26
1.01 ± 0.003
1.59 ± 0.310
103.2 ± 9.03
56.7 ± 12.3
P35
4.57 ± 0.991
1.43 ± 0.053
1.48 ± 0.073
129.8 ± 11.0
49.5 ± 4.67
P36
4.25 ± 1.02
0.937 ± 0.051
1.77 ± 0.094
119.3 ± 9.09
55.4 ± 5.19
X. strumarium
P37
1.13 ± 0.039
5.00 ± 0.901
19.9 ± 1.37
100.5 ± 7.11
101.7 ± 9.51
P38
0.986 ± 0.051
4.63 ± 0.994
25.8 ± 1.04
148.0 ± 12.4
92.7 ± 9.90
P39
0.902 ± 0.039
5.31 ± 1.05
20.9 ± 2.03
126.3 ± 11.2
87.2 ± 5.08
Herb
Product
V51
Cr52
Cr53
Co59
Se82
A. calamus
P1
0.882 ± 0.116
1.17 ± 0.092
0.991 ± 0.011
0.658 ± 0.096
0.028 ± 0.006
P2
0.952 ± 0.081
1.19 ± 0.061
1.020 ± 0.089
0.662 ± 0.054
0.019 ± 0.005
P3
1.06 ± 0.045
1.57 ± 0.369
0.967 ± 0.027
0.599 ± 0.046
0.022 ± 0.006
B. edulis
P4
0.108 ± 0.017
0.291 ± 0.501
0.024 ± 0.006
0.012 ± 0.004
0.002 ± 0.0003
P5
0.119 ± 0.027
0.310 ± 0.059
0.245 ± 0.004
0.017 ± 0.005
0.001 ± 0.0002
P6
0.959 ± 0.045
0.295 ± 0.061
0.211 ± 0.003
0.019 ± 0.006
0.001 ± 0.0001
C. bonducella
P7
1.07 ± 0.034
3.35 ± 0.039
2.01 ± 0.092
0.399 ± 0.098
0.049 ± 0.007
P8
1.01 ± 0.085
3.11 ± 0.062
1.93 ± 0.219
0.364 ± 0.012
0.051 ± 0.006
P9
1.12 ± 0.117
2.69 ± 0.075
2.04 ± 0.322
0.410 ± 0.045
0.041 ± 0.003
C. orchioides
P10
4.43 ± 0.749
6.852 ± 0.812
7.75 ± 1.00
0.312 ± 0.008
1.04 ± 0.009
P11
4.347 ± 0.618
7.27 ± 0.948
6.91 ± 0.908
0.336 ± 0.046
1.08 ± 0.009
P12
3.87 ± 0.459
9.13 ± 1.09
7.14 ± 0.993
0.369 ± 0.092
1.12 ± 0.008
H. isora
P13
0.073 ± 0.001
0.057 ± 0.007
0.029 ± 0.009
0.004 ± 0.001
0.003 ± 0.0002
P14
0.021 ± 0.004
0.046 ± 0.002
0.020 ± 0.008
0.005 ± 0.001
0.002 ± 0.0003
P15
0.024 ± 0.004
0.039 ± 0.004
0.024 ± 0.004
0.006 ± 0.002
0.001 ± 0.0001
H. pubescens
P16
2.18 ± 0.761
82.2 ± 4.51
20.05 ± 1.06
0.427 ± 0.069
0.051 ± 0.011
P17
2.21 ± 0.839
76.9 ± 3.93
18.6 ± 1.10
0.367 ± 0.057
0.049 ± 0.010
P18
1.95 ± 0.617
81.4 ± 6.31
19.0 ± 1.03
0.479 ± 0.061
0.047 ± 0.009
P. integerrima
P19
0.172 ± 0.031
0.700 ± 0.039
0.514 ± 0.005
0.019 ± 0.189
0.014 ± 0.006
P20
0.131 ± 0.007
0.753 ± 0.028
0.465 ± 0.039
0.024 ± 0.005
0.009 ± 0.0008
P21
0.127 ± 0.007
0.631 ± 0.044
0.531 ± 0.089
0.019 ± 0.005
0.009 ± 0.003
P. sativa
P22
2.18 ± 0.743
4.471 ± 0.615
5.06 ± 0.992
0.496 ± 0.006
0.170 ± 0.006
P23
2.37 ± 0.962
5.49 ± 0.918
4.85 ± 0.836
0.411 ± 0.038
0.182 ± 0.009
P24
3.17 ± 0.949
6.01 ± 0.913
4.14 ± 0.937
0.392 ± 0.096
0.146 ± 0.007
Q. infectoria
P25
0.217 ± 0.017
0.473 ± 0.009
0.372 ± 0.011
0.084 ± 0.013
0.058 ± 0.006
P26
0.259 ± 0.089
0.398 ± 0.051
0.420 ± 0.087
0.079 ± 0.018
0.048 ± 0.007
P27
0.214 ± 0.045
0.513 ± 0.041
0.464 ± 0.054
0.076 ± 0.009
0.046 ± 0.009
R. serpentina
P28
2.01 ± 0.094
29.5 ± 2.38
9.05 ± 1.03
0.502 ± 0.069
0.179 ± 0.017
P29
2.21 ± 0.072
23.6 ± 1.96
7.94 ± 0.910
0.567 ± 0.009
0.164 ± 0.030
P30
2.59 ± 0.419
27.1 ± 1.14
8.01 ± 0.995
0.479 ± 0.039
0.170 ± 0.089
S. lappa
P31
0.792 ± 0.134
1.56 ± 0.077
1.01 ± 0.042
0.119 ± 0.018
0.082 ± 0.006
P32
0.801 ± 0.089
2.03 ± 0.600
0.930 ± 0.092
0.114 ± 0.011
0.075 ± 0.009
P33
0.726 ± 0.074
2.11 ± 0.716
1.19 ± 0.752
0.120 ± 0.009
0.074 ± 0.011
T. stocksianum
P34
6.11 ± 1.00
6.44 ± 1.15
6.38 ± 0.905
0.712 ± 0.911
0.740 ± 0.006
P35
5.87 ± 0.762
7.26 ± 1.09
5.84 ± 0.939
0.701 ± 0.717
0.789 ± 0.009
P36
5.07 ± 0.718
8.16 ± 1.05
5.14 ± 0.973
0.699 ± 0.428
0.764 ± 0.007
X. strumarium
P37
1.79 ± 0.471
3.75 ± 1.17
3.07 ± 0.719
0.841 ± 0.011
0.015 ± 0.006
P38
2.28 ± 0.051
2.97 ± 0.961
2.78 ± 0.908
0.769 ± 0.095
0.016 ± 0.005
P39
2.41 ± 0.089
1.99 ± 0.847
3.41 ± 0.991
0.696 ± 0.066
0.011 ± 0.004
Herb
Product
Li7
Ga69
A. calamus
P1
0.186 ± 0.009
0.614 ± 0.009
P2
0.167 ± 0.099
0.662 ± 0.073
P3
0.177 ± 0.083
0.602 ± 0.015
B. edulis
P4
0.058 ± 0.017
0.014 ± 0.005
P5
0.048 ± 0.012
0.011 ± 0.004
P6
0.052 ± 0.015
0.011 ± 0.003
C. bonducella
P7
0.177 ± 0.031
0.101 ± 0.042
P8
0.169 ± 0.048
0.126 ± 0.047
P9
0.182 ± 0.061
0.104 ± 0.011
C. orchioides
P10
2.91 ± 0.815
1.68 ± 0.130
P11
3.30 ± 0.727
1.83 ± 0.471
P12
3.47 ± 0.618
2.14 ± 0.536
H. isora
P13
0.003 ± 0.001
0.006 ± 0.001
P14
0.005 ± 0.001
0.004 ± 0.001
P15
0.004 ± 0.001
0.007 ± 0.002
H. pubescens
P16
0.718 ± 0.061
0.602 ± 0.071
P17
0.721 ± 0.093
0.763 ± 0.191
P18
0.698 ± 0.097
0.700 ± 0.041
P. integerrima
P19
0.072 ± 0.022
0.114 ± 0.007
P20
0.069 ± 0.007
0.127 ± 0.009
P21
0.072 ± 0.007
0.119 ± 0.035
P. sativa
P22
3.11 ± 0.618
1.81 ± 0.717
P23
2.61 ± 0.467
1.89 ± 0.992
P24
2.19 ± 0.816
1.94 ± 0.990
Q. infectoria
P25
4.26 ± 0.051
0.272 ± 0.015
P26
3.99 ± 0.817
0.269 ± 0.091
P27
3.82 ± 0.749
0.264 ± 0.040
R. serpentina
P28
2.11 ± 0.911
0.608 ± 0.073
P29
1.93 ± 0.718
0.799 ± 0.093
P30
2.09 ± 0.614
0.707 ± 0.071
S. lappa
P31
0.399 ± 0.091
0.801 ± 0.057
P32
0.382 ± 0.071
0.831 ± 0.078
P33
0.429 ± 0.080
0.819 ± 0.693
T. stocksianum
P34
7.01 ± 0.901
0.739 ± 0.080
P35
6.19 ± 0.619
0.802 ± 0.201
P36
5.81 ± 0.415
0.700 ± 0.064
X. strumarium
P37
1.66 ± 0.417
2.09 ± 0.667
P38
1.69 ± 0.475
2.29 ± 0.887
P39
1.77 ± 0.999
2.11 ± 0.718
Herb
Product
As75
Cd111
In115
Cs133
Ba138
Be9
Tl205
Pb206
Pb208
U238
A. calamus
P1
0.200 ± 0.005
0.020 ± 0.004
0.008 ± 0.0003
0.017 ± 0.002
121.5 ± 9.05
0.004 ± 0.0001
0.023 ± 0.003
2.82 ± 0.072
2.51 ± 0.042
0.0001 ± 0.00002
P2
0.199 ± 0.016
0.019 ± 0.005
0.008 ± 0.0003
0.015 ± 0.004
148.3 ± 8.10
0.004 ± 0.0001
0.021 ± 0.003
2.75 ± 0.063
2.59 ± 0.091
0.0001 ± 0.00002
P3
0.183 ± 0.082
0.024 ± 0.008
0.006 ± 0.0004
0.013 ± 0.005
137.5 ± 8.09
0.002 ± 0.0001
0.019 ± 0.004
2.68 ± 0.075
2.48 ± 0.593
0.0001 ± 0.00001
B. edulis
P4
0.009 ± 0.003
0.0005 ± 0.003
0.0002 ± 0.00004
0.007 ± 0.0003
3.20 ± 0.808
0.0005 ± 0.00003
0.001 ± 0.0001
0.053 ± 0.006
0.059 ± 0.007
0.00002 ± 0.000005
P5
0.008 ± 0.001
0.005 ± 0.001
0.0002 ± 0.00003
0.008 ± 0.0002
3.09 ± 0.091
0.0006 ± 0.00003
0.001 ± 0.0005
0.050 ± 0.007
0.055 ± 0.007
0.00002 ± 0.000003
P6
0.008 ± 0.001
0.0004 ± 0.001
0.0003 ± 0.00003
0.008 ± 0.0007
3.23 ± 0.098
0.0004 ± 0.00002
0.005 ± 0.001
0.046 ± 0.007
0.054 ± 0.007
0.00002 ± 0.000003
C. bonducella
P7
0.020 ± 0.004
0.012 ± 0.006
0.004 ± 0.0003
0.0002 ± 0.00007
6.23 ± 1.01
0.001 ± 0.0002
0.006 ± 0.0003
3.74 ± 0.058
3.38 ± 0.059
0.0003 ± 0.0001
P8
0.019 ± 0.006
0.011 ± 0.007
0.004 ± 0.0004
0.022 ± 0.008
5.71 ± 0.974
0.0009 ± 0.0002
0.006 ± 0.00002
3.06 ± 0.576
3.42 ± 0.511
0.0003 ± 0.00002
P9
0.019 ± 0.005
0.015 ± 0.s001
0.005 ± 0.0003
0.029 ± 0.003
4.02 ± 0.902
0.001 ± 0.0002
0.005 ± 0.0001
2.52 ± 0.873
3.27 ± 0.517
0.0002 ± 0.0001
C. orchioides
P10
0.193 ± 0.083
0.028 ± 0.001
0.0003 ± 0.0001
0.453 ± 0.004
104.0 ± 10.7
0.049 ± 0.011
0.041 ± 0.016
1.17 ± 0.508
1.10 ± 0.300
0.0003 ± 0.00002
P11
0.203 ± 0.095
0.029 ± 0.001
0.0003 ± 0.0001
0.496 ± 0.043
120.3 ± 9.08
0.058 ± 0.009
0.049 ± 0.012
0.999 ± 0.095
1.09 ± 0.038
0.0002 ± 0.00003
P12
0.200 ± 0.046
0.025 ± 0.003
0.0003 ± 0.0001
0.513 ± 0.068
157.2 ± 10.9
0.041 ± 0.005
0.053 ± 0.009
1.01 ± 0.082
1.13 ± 0.047
0.0001 ± 0.00003
H. isora
P13
0.002 ± 0.0004
0.0008 ± 0.0003
0.018 ± 0.0002
0.003 ± 0.0002
3.01 ± 0.065
0.0001 ± 0.00004
0.0006 ± 0.0001
0.035 ± 0.002
0.039 ± 0.007
0.0004 ± 0.0001
P14
0.001 ± 0.0004
0.0008 ± 0.0002
0.013 ± 0.004
0.005 ± 0.001
3.32 ± 0.904
0.0007 ± 0.00001
0.0007 ± 0.0001
0.039 ± 0.003
0.043 ± 0.006
0.0005 ± 0.00009
P15
0.002 ± 0.0005
0.0009 ± 0.0002
0.014 ± 0.004
0.003 ± 0.0005
3.51 ± 0.095
0.0005 ± 0.0001
0.0007 ± 0.0001
0.027 ± 0.002
0.036 ± 0.006
0.0003 ± 0.00001
H. pubescens
P16
0.085 ± 0.004
0.0205 ± 0.003
0.013 ± 0.001
0.164 ± 0.057
217.2 ± 11.8
0.019 ± 0.009
0.007 ± 0.0001
0.617 ± 0.076
0.626 ± 0.085
0.0003 ± 0.00002
P17
0.099 ± 0.006
0.019 ± 0.001
0.010 ± 0.002
0.183 ± 0.092
194.9 ± 10.3
0.023 ± 0.007
0.008 ± 0.0005
0.559 ± 0.007
0.619 ± 0.068
0.0002 ± 0.00001
P18
0.088 ± 0.007
0.0 ± 0.001
0.022 ± 0.003
0.173 ± 0.078
199.2 ± 9.19
0.021 ± 0.007
0.008 ± 0.0003
0.643 ± 0.005
0.661 ± 0.069
0.0003 ± 0.00001
P. integerrima
P19
0.185 ± 0.005
0.005 ± 0.0006
0.002 ± 0.0004
0.326 ± 0.027
4.23 ± 0.777
0.00015 ± 0.00009
0.008 ± 0.0003
0.385 ± 0.049
0.328 ± 0.027
0.0004 ± 0.00001
P20
0.191 ± 0.067
0.006 ± 0.0003
0.003 ± 0.0004
0.311 ± 0.017
4.16 ± 0.099
0.0003 ± 0.00002
0.008 ± 0.0001
0.318 ± 0.053
0.337 ± 0.032
0.0003 ± 0.00001
P21
0.176 ± 0.054
0.005 ± 0.00001
0.003 ± 0.0004
0.349 ± 0.013
4.05 ± 0.914
0.0001 ± 0.00004
0.006 ± 0.0001
0.399 ± 0.094
0.348 ± 0.037
0.0002 ± 0.0001
P. sativa
P22
0.231 ± 0.087
0.024 ± 0.001
0.061 ± 0.002
0.279 ± 0.046
123.4 ± 8.91
0.011 ± 0.003
0.012 ± 0.005
0.993 ± 0.098
0.817 ± 0.059
0.0003 ± 0.000001
P23
0.215 ± 0.096
0.026 ± 0.001
0.074 ± 0.007
0.294 ± 0.053
115.4 ± 7.92
0.009 ± 0.002
0.011 ± 0.002
1.00 ± 0.175
1.37 ± 0.149
0.0002 ± 0.00001
P24
0.207 ± 0.009
0.025 ± 0.003
0.078 ± 0.003
0.271 ± 0.071
121.6 ± 7.19
0.009 ± 0.003
0.013 ± 0.002
1.17 ± 0.047
1.21 ± 0.038
0.0001 ± 0.00001
Q. infectoria
P25
0.041 ± 0.008
0.022 ± 0.0003
0.008 ± 0.0004
0.161 ± 0.023
43.4 ± 3.24
0.011 ± 0.004
0.083 ± 0.003
0.785 ± 0.062
0.737 ± 0.039
0.0004 ± 0.00003
P26
0.026 ± 0.009
0.022 ± 0.004
0.008 ± 0.0005
0.174 ± 0.054
39.6 ± 3.13
0.017 ± 0.003
0.089 ± 0.004
0.659 ± 0.033
0.690 ± 0.027
0.0005 ± 0.00002
P27
0.043 ± 0.009
0.022 ± 0.007
0.007 ± 0.001
0.170 ± 0.057
47.6 ± 3.06
0.009 ± 0.002
0.080 ± 0.003
0.584 ± 0.11
0.683 ± 0.091
0.0004 ± 0.0001
R. serpentina
P28
0.177 ± 0.083
0.020 ± 0.003
0.057 ± 0.003
0.001 ± 0.0003
116.2 ± 9.10
0.009 ± 0.001
0.031 ± 0.002
0.063 ± 0.006
0.066 ± 0.016
0.0002 ± 0.0001
P29
0.170 ± 0.057
0.009 ± 0.001
0.052 ± 0.003
0.001 ± 0.0002
127.8 ± 7.71
0.010 ± 0.001
0.029 ± 0.003
0.059 ± 0.007
0.069 ± 0.012
0.0002 ± 0.00001
P30
0.188 ± 0.074
0.024 ± 0.001
0.053 ± 0.006
0.0003 ± 0.00007
139.5 ± 7.93
0.011 ± 0.001
0.020 ± 0.003
0.057 ± 0.004
0.077 ± 0.013
0.0002 ± 0.00003
S. lappa
P31
0.060 ± 0.016
0.022 ± 0.006
0.003 ± 0.004
0.072 ± 0.007
178.2 ± 11.7
0.012 ± 0.004
0.051 ± 0.009
1.04 ± 0.004
1.17 ± 0.281
0.0004 ± 0.00001
P32
0.067 ± 0.011
0.011 ± 0.007
0.005 ± 0.0003
0.089 ± 0.008
201.0 ± 10.4
0.016 ± 0.004
0.049 ± 0.006
1.59 ± 0.005
1.48 ± 0.351
0.0003 ± 0.00002
P33
0.061 ± 0.009
0.0005 ± 0.00001
0.002 ± 0.0005
0.091 ± 0.003
198.3 ± 10.8
0.014 ± 0.005
0.055 ± 0.005
1.78 ± 0.009
1.71 ± 0.082
0.0004 ± 0.00001
T. stocksianum
P34
0.785 ± 0.098
0.0004 ± 0.0001
0.531 ± 0.132
0.009 ± 0.0004
217.6 ± 7.81
0.031 ± 0.007
0.021 ± 0.005
3.31 ± 0.726
3.27 ± 0.648
0.0001 ± 0.00002
P35
0.814 ± 0.095
0.0006 ± 0.00001
0.552 ± 0.094
0.009 ± 0.0003
273.6 ± 9.10
0.039 ± 0.009
0.019 ± 0.002
3.00 ± 0.575
3.16 ± 0.514
0.0001 ± 0.00001
P36
0.807 ± 0.074
0.005 ± 0.0003
0.494 ± 0.093
0.008 ± 0.0006
199.7 ± 10.9
0.029 ± 0.005
0.030 ± 0.005
3.58 ± 0.602
3.16 ± 0.591
0.0001 ± 0.00002
X. strumarium
P37
0.148 ± 0.051
0.049 ± 0.003
0.013 ± 0.003
0.221 ± 0.092
316.8 ± 13.7
0.019 ± 0.007
0.023 ± 0.003
1.65 ± 0.715
1.69 ± 0.614
0.0002 ± 0.00001
P38
0.136 ± 0.033
0.055 ± 0.003
0.018 ± 0.003
0.271 ± 0.004
328.3 ± 14.3
0.009 ± 0.001
0.021 ± 0.003
1.78 ± 0.816
1.71 ± 0.375
0.0002 ± 0.00001
P39
0.155 ± 0.087
0.052 ± 0.003
0.011 ± 0.003
0.287 ± 0.056
298.5 ± 11.4
0.013 ± 0.002
0.018 ± 0.003
1.59 ± 0.781
1.53 ± 0.418
0.0002 ± 0.00001
Most herbs contain several micro and essential elements such as Co, Cr, Cu, Ni, Rb, Se, V, Sr, and Zn in therapeutic concentrations. However, the low and excessive daily intake could lead to deficiency or overload and ultimately severe consequences. From the results (Table 1), it was observed that among micronutrients, Rb85 (1.45, B. edulis to 284 µg/g, C. orchioides) and Sr87 (0.649, B. edulis to 417 µg/g, S. lappa) had the higher content in all the analyzed herbs. The amount of Zn, Cu, and Ni was found to be in similar increasing order after Rb85 and Sr87and trend as Rb85/ Sr87 > Zn64/Cu63 > Ni60. In the analyzed products, in micro elements content, the average levels were in subsequent order of Rb85 ˃ Sr87 ˃ Zn ˃ Ni ˃ Cu (Table 3). Furthermore, the measured levels of micro elements were well below the permissible limits, hence, the subject herbs can be considered safe for consumers’ health.
Other elements; Co, Cr, Mn, Se, and V are essential trace elements, which have key role as cofactors in metabolic processes. Among these elements, all the herbs and products were rich in Cr52/Cr53 followed by Co59, V51, and Se82 (Tables 1 and 4). Hence, these herbs contain appreciable macro and microelements to add on to the nutritional requirements as supplementary food. Some other elements such as Li7 and Ga69 present in the soil are also absorbed by plants and are non-toxic. Among the samples analyzed, the content of Li7 and Ga69 were found high (Tables 1 and 5).
In developing countries, mostly the herbs and the products are directly sold in the market without their safety analysis, which may lead to lethality due to the presence of mycotoxins, pesticides or the presence of some elements such as arsenic, cadmium, lead, and mercury, which are harmful to the human body even when present in very small concentration. Therefore, from therapeutical and safety aspects, it is important to evaluate any herbs or products for toxic elements content. In this study, among the trace toxic elements (Tables 1 and 6), Ba138 and Pb206/Pb208 were present in high levels. It is worth highlighting that the toxic elements content in the analyzed samples, were all well below the safety limits (50 µg/kg/day for As, 0.833 µg/kg/day for Cd, 0.63 µg/kg/day BMDL for adult for Pb) set by Joint Food and Agriculture Organization/World Health Organization Expert Committee on Food Additives, and European Food Safety Authority (JECFA, 2004, 2010; EFSA, 2010). On the basis of obtained trace and toxic elements data for the analyzed samples, the consumption of the analyzed herbs and their products apparently may not have health risks to the consumers.
3.3 Antimicrobial activity of the herbs and products
Antimicrobial activity of the ethanolic extracts was evaluated against selected microbial pathogens, and the zones of inhibition were compared with that of the standard antibiotics. The bacterial pathogens included S. aureus, B. subtilis, P. aeruginosa, E. coli, and the pathogenic fungi were; C. albicans, C. krusei, A. flavus, and T. mentagrophytes. Most of the herbal extracts significantly inhibited the analyzed microbes (Tables 7 and 8). In DD assay, the zones of inhibition ranged from 7.0 mm to 19.0 mm and MIC values of 62.5 to 1000 µg/mL. Among the analyzed samples, the ethanolic extracts of S. lappa and its products were the most active against both the Gram-positive and negative bacterial strains with inhibition zones 10.0–17.0 mm (herbs) and 9.0 to 18.0 mm (products), and MIC values of 62.5 to 250 µg/mL (herbs) and 62.5 to 500 µg/mL (products). This potent antibacterial activity could be due to the presence of bioactive constituents present in the samples. The detailed values of inhibition zone and MIC are given in Tables 7 and 8. Regarding the antifungal activity described in Tables 7 and 8, X. strumarium, S. lappa, and H. isora and their products exhibited pronounced inhibitory potential against all fungal species. Values are mean ± standard deviations of three (n = 3) measurements. The superscript letters in columns represent significantly different values (p < 0.05) by Tukey’s and Duncan's multiple range tests.
Samples
Disk diffusion (mm)
Minimum inhibitory concentration method (µg/mL)
S. aureus
B. subtilis
P. aeruginosa
E. coli
S. aureus
B. subtilis
P. aeruginosa
E. coli
Acorus calamus
9.0 ± 0.45a
11.0 ± 0.52c
7.0 ± 0.35a
6.0 ± 0.10a
500e
500e
1000c
1000c
Blepharis edulis
11.0c ± 0.26c
13.0 ± 0.42e
9.0 ± 0.32c
8.0 ± 0.41c
250d
250d
500b
500b
Caesalpinia bonducella
10.0 ± 0.22b
11.0 ± 0.24c
9.0 ± 0.30c
9.0 ± 0.38d
250d
250d
500b
500b
Curculigo orchioides
13.0 ± 0.62e
12.0 ± 0.42d
8.0 ± 0.28b
8.0 ± 0.27c
250d
250d
500b
500b
Helicteres isora
14.0 ± 0.51f
15.0 ± 0.40g
8.0 ± 0.33b
6.0 ± 0.20a
125c
62.5b
500b
1000c
Holarrhena pubescens
11.0 ± 0.62c
11.0 ± 0.38c
10.0 ± 0.41d
8.0 ± 0.18c
250d
250d
500b
500b
Pastinaca sativa
13.0 ± 0.10e
10.0 ± 0.21b
8.0 ± 0.32b
7.0 ± 0.14b
250d
250d
500b
1000c
Pistacia integerrima
14.0 ± 0.36f
12.0 ± 0.44d
9.0 ± 0.40c
9.0 ± 0.52d
125c
250d
500b
500b
Quercus infectoria
12.0 ± 0.61d
14.0 ± 0.35f
7.0 ± 0.09a
6.0 ± 0.06a
250d
125c
1000c
1000c
Rauwolfia serpentina
10.0 ± 0.11b
9.0 ± 0.39a
8.0 ± 0.51b
7.0 ± 0.18b
250d
250d
500b
1000c
Saussurea lappa
16.0 ± 0.47g
17.0 ± 0.22h
10.0 ± 0.16d
10.0 ± 0.33e
62.5b
62.5b
250a
250a
Teucrium stocksianum
10.0 ± 0.10b
12.0 ± 0.23d
7.0 ± 0.15a
7.0 ± 0.26b
250d
250d
1000c
1000c
Xanthium strumarium
12.0 ± 0.21d
10.0 ± 0.17b
10.0 ± 0.22d
10.0 ± 0.33e
250d
250d
250a
250a
Vancomycin*
19.0 ± 0.28i
27.0 ± 0.31i
13.0 ± 0.10e
13.0 ± 0.15f
31.25a
31.25a
500b
250a
Streptomycin*
17.0 ± 0.20h
27.0 ± 0.35i
16.0 ± 0.16f
17.0 ± 0.19g
31.25a
31.25a
500b
500b
Antifungal activity
Samples
Disk diffusion (mm)
Minimum inhibitory concentration method (µg/mL)
C. albicans
C. krusei
A. flavus
T. mentagrophytes
C. albicans
C. krusei
A. flavus
T. mentagrophyte
Acorus calamus
11.0 ± 0.32d
8.0 ± 0.21c
10.0 ± 0.23d
8.0 ± 0.42b
250d
1000f
500c
1000e
Blepharis edulis
12.0 ± 0.14e
14.0 ± 0.10f
12.0 ± 0.13e
15.0 ± 0.23g
250d
250d
62.5a
250c
Caesalpinia bonducella
10.0 ± 0.17c
9.0 ± 0.27d
9.0 ± 0.25c
10.0 ± 0.26d
250d
500e
250b
250c
Curculigo orchioides
14.0 ± 0.31f
12.0 ± 0.42e
13.0 ± 0.33f
13.0 ± 0.23f
125c
250
500c
500d
Helicteres isora
14.0 ± 0.11f
16.0 ± 0.37g
12.0 ± 0.62e
9.0 ± 0.10c
125c
125c
250b
250c
Holarrhena pubescens
9.0 ± 0.10b
8.0 ± 0.24c
10.0 ± 0.22d
8.0 ± 0.31b
500e
250d
250b
500d
Pastinaca sativa
9.0 ± 0.27b
7.0 ± 0.16b
8.0 ± 0.33b
10.0 ± 0.21d
500e
500e
500c
250c
Pistacia integerrima
9.0 ± 0.13b
9.0 ± 0.34b
7.0 ± 0.20a
7.0 ± 0.16a
500e
500e
500c
500d
Quercus infectoria
11.0 ± 0.41d
12.0 ± 0.55e
12.0 ± 0.25e
9.0 ± 0.13c
250d
250d
250b
250c
Rauwolfia serpentina
8.0 ± 0.20a
7.0 ± 0.19b
8.0 ± 0.38b
8.0 ± 0.32b
500e
500e
500c
500d
Saussurea lappa
16.0 ± 0.20g
16.0 ± 0.29g
17.0 ± 0.34g
12.0 ± 0.17e
125c
125c
62.5a
250c
Teucrium stocksianum
8.0 ± 0.17a
6.0 ± 0.24a
7.0 ± 0.36a
8.0 ± 0.18b
1000f
1000f
1000
1000e
Xanthium strumarium
17.0 ± 0.26h
17.0 ± 0.16h
18.0 ± 0.23h
19.0 ± 0.19h
62.5b
62.5b
62.5a
62.5b
Fluconazole*
22.0 ± 0.31i
24.0 ± 0.19j
27.0 ± 0.35j
29.0 ± 0.31j
31.25a
31.25a
62.5a
31.25a
Amphotericin*
22.0 ± 0.24i
21.0 ± 0.26i
20.0 ± 0.38i
24.0 ± 0.41i
62.5b
62.5b
62.5a
31.25a
Samples
Disk diffusion (mm)
Minimum inhibitory concentration method (µg/mL)
S. aureus
B. subtilis
P. aeruginosa
E. coli
S. aureus
B. subtilis
P. aeruginosa
E. coli
P1-P3
7.0–10.0
9.0–11.0
6.0–8.0
6.0–8.0
250–500
250–500
500–1000
500–1000
P4-P6
7.0–12.0
11.0–14.0
8.0–9.0
6.0–9.0
125–250
125–250
250–500
500–1000
P7-P9
7.0–10.0
10.0–12.0
9.0–10.0
8.0–10.0
125–250d
250–500
250–500
500–1000
P10-P12
8.0–12.0
10.0–13.0
7.0–9.0
7.0–9.0
250–500
250–500
500–1000
500–1000
P13-P15
8.0–14.0
13.0–15.0
7.0–9.0
6.0–7.0
125–250
62.5–250
500–1000
500–1000
P16-P18
7.0–10.0
10.0–11.0
10.0–11.0
7.0–9.0
250–500
250–500
500–1000
500–1000
P19-P21
8.0–13.0
9.0–11.0
6.0–8.0
7.0–8.0
125–250
250–500
250–1000
500–1000
P22-P24
10.0–14.0
10.0–13.0
9.0–10.0
8.0–10.0
125–250
250–500
500–1000
250–500
P25-P27
10.0–13.0
11.0–15.0
7.0–9.0
6.0–7.0
250–500
125–500
500–1000
500–1000
P28-P30
7.0–10.0
8.0–10.0
8.0–9.0
6.0–8.0
250–500
250–500
500–1000
500–1000
P31-P33
12.0–16.0
14.0–18.0
10.0–12.0
9.0–11.0
62.5–250
62.5–125
125–250
125–500
P34-P36
7.0–10.0
10.0–13.0
7.0–9.0
7.0–8.0
250–500
250–500
500–1000
500–1000
P37-P39
10.0–13.0
9.0–11.0
10.0–12.0
9.0–11.0
250–500
250–500
125–500
125–250
Vancomycin*
19.0
27.0 ± 0.31
13.0 ± 0.10
13.0 ± 0.15
31.25
31.25
500
250
Streptomycin*
17.0
27.0 ± 0.35
16.0 ± 0.16
17.0 ± 0.19
31.25
31.25
500
500
Antifungal activity
Samples
Disk diffusion (mm)
Minimum inhibitory concentration method (µg/mL)
C. albicans
C. krusei
A. flavus
T. mentagrophytes
C. albicans
C. krusei
A. flavus
T. mentagrophyte
P1-P3
10.0–12.0
7.0–8.0
10.0–11.0
6.0–8.0
250–500
1000
250–500
1000
P4-P6
19.01.0–13.0
13.0–14.0
12.0–14.0
14.0–15.0
125–250
125–250
125–250
125–250
P7-P9
9.0–10.0
8.0–10.0
8.0–9.0
9.0–10.0
250–500
500–1000
250–500
250–500
P10-P12
13.0–15.0
11.0–12.0
12.0–13.0
12.0–14.0
125–250
250–500
125–250
125–250
P13-P15
13.0–15.0
15.0–17.0
12.0–13.0
8.0–11.0
125–250
125–250
125–250
250–500
P16-P18
8.0–9.0
6.0–8.0
9.0–11.0
6.0–9.0
250–500
500–1000
250–500
500–1000
P19-P21
8.0–10.0
6.0–8.0
6.0–8.0
9.0–10.0
250–500
500–1000
500–1000
250–500
P22-P24
8.0–9.0
8.0–9.0
6.0–7.0
6.0–7.0
500–1000
500–1000
500–1000
1000
P25-P27
11.0–12.0
11.0–12.0
11.0–12.0
9.0–10.0
125–250
250–500
250–500
250–500
P28-P30
7.0–9.0
7.0–8.0
7.0–8.0
6.0–8.0
500–1000
500–1000
500–1000
500–1000
P31-P33
15.0–17.0
15.0–17.0
15.0–17.0
11.0–13.0
125–250
125–250
62.5–125
250–500
P34-P36
7.0–8.0
6.0–7.0
6.0–7.0
6.0–8.0
1000
1000
1000
1000
P37-P39
16.0–17.0
15.0–17.0
16.0–18.0
17.0–19.0
62.5–125
62.5–125
62.5–125
62.5–125
Fluconazole*
22.0 ± 0.31
24.0 ± 0.19
27.0 ± 0.35
29.0 ± 0.31
31.25
31.25
62.5
31.25
Amphotericin*
22.0 ± 0.24
21.0 ± 0.26
20.0 ± 0.38
24.0 ± 0.41
62.5
62.5
62.5
31.25
4 Conclusions
The study investigated thirteen medicinal herbs and their products for elemental content and antimicrobial activity. The study revealed that the analyzed samples are the significant sources of K, Ca, Mg, P, S, Co, Ni, Se, V, and Zn. The content of potentially toxic elements are present below the provisional tolerable intake values. Hence, the analyzed herbs and products along with medicinal remedies could also be potential sources of mineral elements. This research further concludes that the evaluated herbs and products are potentially inhibiting the microbial pathogens. Overall, the analyzed samples are effective nutritional as well as safe source against various microbial pathogens. This is the first detailed report on the mineral and toxic elements content of the commonly used medicinal herbs and the products available in the local markets of Peshawar, Pakistan.
Acknowledgements
This research study was supported by the research grant; 8967/KPK/NRPU/R&D/HEC/2017. The authors are thankful to the Higher Education Commission (HEC) for awarding this project.
Declaration of Competing Interest
The authors declare that they have no known competing financial interests or personal relationships that could have appeared to influence the work reported in this paper.
References
- Quantification of heavy metals and health risk assessment in processed fruits’ products. Arab. J. Chem.. 2020;13(12):8965-8978.
- [CrossRef] [Google Scholar]
- Pharmacological basis for use of Pistacia integerrima leaves in hyperuricemia and gout. J. Ethnopharmacol.. 2008;117(3):478-482.
- [CrossRef] [Google Scholar]
- AOAC (Association of Official Analytical Chemists). 2012. Standard method performance requirements (AOAC SMPR 2011.009) for Cr, Mo and Se in infant formula and adult/pediatric nutritional formula. J. AOAC Int. 95, 297.
- Heavy metals in contaminated environment: destiny of secondary metabolite biosynthesis, oxidative status and phytoextraction in medicinal plants. Ecotoxicol. Environ. Saf.. 2017;145:377-390.
- [CrossRef] [Google Scholar]
- Making sense of the “clean label” trends: a review of consumer food choice behavior and discussion of industry implications. Food Res. Int.. 2017;99:58-71.
- [CrossRef] [Google Scholar]
- Volatile constituents of Teucrium stocksianum Boiss. fruits from south of Iran. J. Essent. Oil-Bear. Plants. 2015;18(5):1174-1179.
- [CrossRef] [Google Scholar]
- Elemental investigation of the leaf and seed of coriander plant by synchrotron radiation X-ray fluorescence spectroscopy. Natl. Acad. Sci. Lett.. 2017;40(5):373-377.
- [CrossRef] [Google Scholar]
- Antibacterial, antidiarrhoeal, and cytotoxic activities of methanol extract and its fractions of Caesalpinia bonducella (L.) Roxb leaves. BMC Complement. Altern. Med.. 2013;13:1-7.
- [CrossRef] [Google Scholar]
- Potentially toxic elements (PTEs) associated with asbestos chrysotile, tremolite and actinolite in the Calabria region (Italy) Chem. Geol.. 2020;558:119896.
- [CrossRef] [Google Scholar]
- Accumulation and ecological effects of soil heavy metals in conventional and organic greenhouse vegetable production systems in Nanjing, China. Environ. Earth Sci.. 2014;71(8):3605-3616.
- [CrossRef] [Google Scholar]
- Two phenolic glycosides from Curculigo orchioides Gaertn. Fitoterapia. 2009;80(5):279-282.
- [CrossRef] [Google Scholar]
- European Food Safety Authority, 2010. EFSA panel on contaminants in the food chain (CONTAM). EFSA J. 8, 1570.
- Evaluation of analgesic activity of the methanol extract from the galls of Quercus infectoria (Olivier) in rats. Evid. Based Complementary Altern. Med.. 2014;2014:1-6.
- [CrossRef] [Google Scholar]
- Roles of plant volatiles in defence against microbial pathogens and microbial exploitation of volatiles. Plant, Cell Environ.. 2019;42(10):2827-2843.
- [CrossRef] [Google Scholar]
- Bioactivity-guided fractionation for anti-inflammatory and analgesic properties and constituents of Xanthium strumarium L. Phytomedicine. 2007;14(12):825-829.
- [CrossRef] [Google Scholar]
- Mesoporous titanium dioxide as a novel solid-phase extraction material for flow injection micro-column preconcentration on-line coupled with ICP-OES determination of trace metals in environmental samples. Talanta. 2007;73(2):274-281.
- [CrossRef] [Google Scholar]
- Determination of Pb and Cd in Macedonian wines by electrothermal atomic absorption spectrometry (ETAAS) Food Anal. Methods. 2015;8(8):1947-1952.
- [CrossRef] [Google Scholar]
- A bioactive cycloartane triterpene from Garcinia hombroniana. Nat. Prod. Res.. 2016;30(12):1388-1397.
- [CrossRef] [Google Scholar]
- Determination of macro, micro, trace essential, and toxic elements in Garcinia cambogia fruit and its anti-obesity commercial products. J. Sci. Food Agric.. 2019;99:2455-2462.
- [CrossRef] [Google Scholar]
- Characterization of natural gums via elemental and chemometric analyses, synthesis of silver nanoparticles, and biological and catalytic applications. Int. J. Biol. Macromol.. 2020;147:853-866.
- [CrossRef] [Google Scholar]
- Joint Food and Agriculture/World Health Organization Expert Committee on Food Additives, 2004. (JECFA 1956–2003), Washington, DC: ILSI Press, International Life Sciences Institute.
- Joint Food and Agriculture/World Health Organization Expert Committee on Food Additives. 2010. Geneva. 8–17 June 2010. JECFA/73/SC, pp. 1–17.
- Antitrypanosomal sesquiterpene lactones from Saussurea costus. Fitoterapia. 2011;82(7):955-959.
- [CrossRef] [Google Scholar]
- Antiinflammatory evaluation of alcoholic extract of galls of Quercus infectoria. J. Ethnopharmacol.. 2004;90(2-3):285-292.
- [CrossRef] [Google Scholar]
- Anti-inflammatory activity of a water extract of Acorus calamus L. leaves on keratinocyte HaCaT cells. J. Ethnopharmacol.. 2009;122(1):149-156.
- [CrossRef] [Google Scholar]
- Plant profile, phytochemistry and pharmacology of Avartani (Helicteres isora Linn.): A review. Asian Pac. J. Trop. Biomed.. 2014;4:S22-S26.
- [CrossRef] [Google Scholar]
- Total phenolic content, antioxidant and antimicrobial activities of Blepharis edulis extracts. Songklanakarin J. Sci. Technol.. 2013;35(1)
- [Google Scholar]
- Medicinal plants of genus Curculigo: Traditional uses and a phytochemical and ethnopharmacological review. J. Ethnopharmacol. 2013;147(3):547-563.
- [CrossRef] [Google Scholar]
- Some elemental concentrations in the acorns of Turkish Quercus L. (Fagaceae) taxa. Pak. J. Botany. 2005;37:361.
- [Google Scholar]
- Estimation of minerals, nitrate and nitrite contents of medicinal and aromatic plants used as spices, condiments and herbal tea. Food Chem.. 2008;106(2):852-858.
- [CrossRef] [Google Scholar]
- Origin discrimination of defatted pork via trace elements profiling, stable isotope ratios analysis, and multivariate statistical techniques. Meat Sci.. 2018;143:93-103.
- [CrossRef] [Google Scholar]
- Anti-allergic rhinitis effect of caffeoylxanthiazonoside isolated from fruits of Xanthium strumarium L. in rodent animals. Phytomedicine. 2014;21(6):824-829.
- [CrossRef] [Google Scholar]
- In-vivo antinociceptive, anti-inflammatory and antipyretic activity of pistagremic acid isolated from Pistacia integerrima. Phytomedicine. 2014;21:1509-1515.
- [CrossRef] [Google Scholar]
- A new sesquiterpene lactone from the roots of Saussurea lappa: Structure–anticancer activity study. Bioorg. Med. Chem. Lett.. 2008;18(14):4015-4017.
- [CrossRef] [Google Scholar]
- Assessment of heavy metal content of branded Pakistani herbal products. Trop. J. Pharm. Res.. 2011;10:499-506.
- [CrossRef] [Google Scholar]
- Phytochemicals, antioxidant, antinociceptive and anti-inflammatory potential of the aqueous extract of Teucrium stocksianum bioss. BMC Complement. Altern. Med.. 2015;15:351.
- [CrossRef] [Google Scholar]
- Rapid control of Chinese star anise fruits and teas for neurotoxic anisatin by Direct Analysis in Real Time high resolution mass spectrometry. J. Chromatogr. A. 2012;1259:179-186.
- [CrossRef] [Google Scholar]
- The multi-faceted potential of plant-derived metabolites as antimicrobial agents against multidrug-resistant pathogens. Microb. Pathog.. 2018;116:209-214.
- [CrossRef] [Google Scholar]
- Constituents of the leaves of Holarrhena pubescens. Fitoterapia. 2007;78(3):271-273.
- [CrossRef] [Google Scholar]
- Influence of the extraction mode on the yield of some furanocoumarins from Pastinaca sativa fruits. J. Chromatogr. B. 2004;800(1-2):181-187.
- [CrossRef] [Google Scholar]
- Insulin sensitizing activity of ethyl acetate fraction of Acorus calamus L. in vitro and in vivo. J. Ethnopharmacol.. 2009;123(2):288-292.
- [CrossRef] [Google Scholar]
- Antioxidative Phenols and Phenolic Glycosides from Curculigo orchioides. Chem. Pharm. Bull.. 2005;53(8):1065-1067.
- [CrossRef] [Google Scholar]
- Steroidal alkaloids from Holarrhena antidysenterica as acetylcholinesterase inhibitors and the investigation for structure–activity relationships. Life Sci.. 2012;90(23-24):929-933.
- [CrossRef] [Google Scholar]
Appendix A
Supplementary material
Supplementary data to this article can be found online at https://doi.org/10.1016/j.arabjc.2021.103055.
Appendix A
Supplementary material
The following are the Supplementary data to this article:


