

Translate this page into:
Quantitative analysis of amorphous form in indomethacin binary polymorphic mixtures using infrared spectroscopy analytical techniques combined with chemometrics methods
⁎Corresponding author: State Key Laboratory of Chemical Engineering, School of Chemical Engineering and Technology, Tianjin University, Tianjin 300072, PR China wusonggu@tju.edu.cn (Songgu Wu)
-
Received: ,
Accepted: ,
This article was originally published by Elsevier and was migrated to Scientific Scholar after the change of Publisher.
Abstract
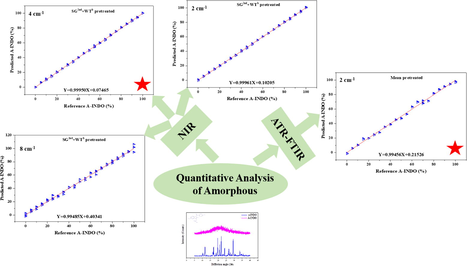
Different contents of A-INDO in INDO binary mixtures were quantified by Attenuated Total Reflectance Fourier Transform Infrared (ATR-FTIR) and Near-Infrared (NIR) analytical techniques combined with chemometrics methods. Different pretreatment methods pretreated ATR-FTIR and different resolutions NIR data were used to establish PLSR models to quantify A-INDO content.
Abstract
Different contents of A-INDO in INDO binary mixtures were quantified. The ATR-FTIR spectral data was selected to establish the PLSR models for quantify the content of A-INDO in binary mixtures. A-INDO content PLSR models of different resolutions of NIR data were established to quantify the content of A-INDO.
Abstract
Pharmaceutical corporations prefer amorphous active pharmaceutical ingredients (APIs) because of their high apparent solubility and bioavailability, which are caused by long-range disorder, large unit surface free energy, and easily wetted particle surfaces. APIs in amorphous form tend to recrystallize into crystalline form during production, transportation, and storage, leading to differences in safety and clinical efficacy, which has been a major obstacle to development of amorphous drugs. In this study, rapid and nondestructive methods for quantitative analysis of amorphous indomethacin (A-INDO) content in A-INDO and γ-indomethacin (γ-INDO) binary mixtures were established based on Attenuated Total Reflection Fourier Transform Infrared spectroscopy (ATR-FTIR) and Near-Infrared spectroscopy (NIR) combined with chemometrics methods. Partial least squares regression (PLSR) was used to establish quantitative analysis models of A-INDO content ranging from 0.000 % to 10.000 % w/w %. A variety of spectral pretreatment methods were used to pretreat the spectral, reducing the influence of inconsistent particle size and uneven mixing, and highlighting the sample component information. The two analytical techniques’ best PLSR models were selected, and the performance of the best models was confirmed by the validation samples. The most effective PLSR model based on ATR-FTIR was Y = 0.99456 X + 0.21526, R2 = 0.99456, the limit of detection (LOD) was 0.714 % and the limit of quantification (LOQ) was 2.164 %. The optimal PLSR model based on NIR was Y = 0.99950 X + 0.07465, R2 = 0.99950, with LOD = 0.246 % and LOQ = 0.747 %. The results showed that the PLSR models established by ATR-FTIR and NIR solid-state analytical techniques combined with stoichiometric method could be used to detect the content of amorphous APIs and to control the production quality of APIs.
Keywords
Indomethacin
Amorphous
Quantitative analysis
ATR-FTIR
NIR

1 Introduction
Active pharmaceutical ingredients (APIs) are prone to polymorphism, which is a significant factor affecting the efficacy and safety of medications. Different physical, chemical and mechanical characteristics of polymorphism affect API safety and bioavailability, resulting in variations in clinical efficacy (Shefter and Higuchi, 1963; Räsänen et al., 2001; Patterson et al., 2005; Tiwary, 2001; Sandler et al, 2005; Airaksinen et al., 2004). In light of this, a major issue in the pharmaceutical processes is the appearance or disappearance of API polymorphism during production, shipping or storage (Brittain, 2010; Lancaster et al., 2007; Bauer et al., 2001). According to generalized polymorphism theory, amorphous refers to molecules, atoms, and ions that occur in short-range orderly organization and long-range chaos in three-dimensional space (Wang et al., 2020). In comparison to crystal phases, the amorphous form has a higher enthalpy, entropy, free energy and volume as a result (Wang et al., 2020; Liu et al., 2019). Because of its larger free energy, it was frequently employed in commercially available medications and typically showed faster dissolution rates, higher apparent solubility and higher bioavailability (Wang et al., 2020; Ahmed et al., 1996; Német et al., 2009; Phillips, 1997). The amorphous form, however, is a high energy state that is a member of a thermodynamically unstable system and is easily recrystallized under the influence of pressure, humidity and temperature during the preparation, transportation and storage processes, resulting in a reduction of bioavailability (Guo et al., 2014; Chen et al., 2002; Aceves-Hernandez et al. 2009; Kistenmacher and Marsh, 1972). As a result, a method for quickly and accurately quantifying the transformation of amorphous API into crystal state during production is thought to be essential for creation of amorphous pharmaceuticals (Auer et al., 2003; Pöllänen et al., 2005; Trifkovic and Rohani, 2007).
Indomethacin (C19H16ClNO4, 1-(4-chlorobenzoyl)-5-methoxy-2-methylindol-3-acetic acid, INDO, Fig. 1) is a sort of insoluble and highly crystalline API utilized for antipyretic and inflammatory pain treatment, which has α-INDO (Chen et al., 2002) and γ-INDO (Aceves-Hernandez et al. 2009; Kistenmacher and Marsh, 1972) two common crystal forms. γ-INDO is a commercially available product. Pharmaceutical companies prefer the amorphous form of indomethacin (A-INDO), because of its high apparent solubility and bioavailability (Wang et al., 2020; Ahmed et al., 1996; Német et al., 2009; Phillips, 1997; Yu, 2001; Newman et al., 2012; Kalra et al., 2018; Karagianni et al., 2018; Ueda et al., 2018). However, it is a thermodynamic high-energy state, it easily transforms into stable crystal forms during production, storage and transportation, thus reducing its bioavailability. Therefore, it is crucial to establish a quick and accurate method for A-INDO content quantitative analysis in A-INDO and γ-INDO binary solid mixtures.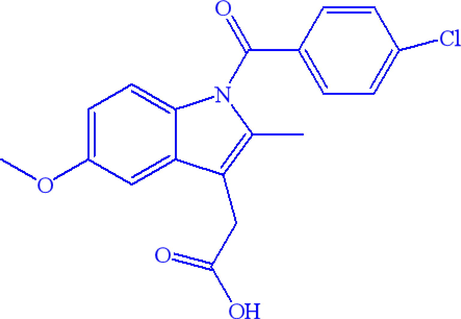
Chemical structure of indomethacin.
Several analytical techniques, such as Powder X-ray Diffraction (PXRD), Differential Scanning Calorimetry (DSC), Mid-Infrared spectrum (MIR), Near-infrared Spectrum (NIR), Raman spectrum (Raman) and Terahertz spectrum (THz), were used to quantitatively analyze the processes of amorphous conversion to crystalline in the early stage of exploitation. PXRD is a common technique that can offer comprehensive structural analysis among them. Although it has been used in industry, one of its disadvantages is that some limitations in quantitative analysis of amorphous content in API (Surana and Suyanarayanan, 2000; Zografi and Crowley, 2002). Additionally, DSC can be used to define amorphous system, analyze polymorphic change and quantify the content of amorphous and crystal in the solid mixtures by using crystal heat or melting heat (Ahmed et al., 1996; Német et al., 2009; Phillips, 1997; Lefort et al., 2004; Shah et al., 2006). However, a significant barrier to the widespread use of DSC as a quantitative tool is the covering of phase conversion endothermic or exothermic peaks between various forms during heat map acquisition (Liu et al., 2021). The non-destructive technique of infrared spectroscopy can reveal information on the differences in relative vibration and molecular rotation between atoms inside molecules. It was widely utilized in the quantitative and qualitative analysis of impurity crystal in solid drugs and APIs and has been the leading technology for identifying and quantifying various polymorphism form for several decades (Guo et al., 2014; Polat and Eral, 2021; Atici and Karlığa, 2015; Bhavana et al., 2019; Silva et al., 2015; Agatonovic-Kustrin et al., 2008; Hennigan and Ryder, 2013; Hu et al., 2010).
This study used Attenuated Total Reflectance Fourier Transform Infrared (ATR-FTIR) and Near-Infrared (NIR) spectroscopy combined with stoichiometry to quantify the content of A-INDO in A-INDO and γ-INDO binary solid mixtures, and detect and control the production quality of A-INDO APIs, in order to ensure the quality of preparation.
2 Materials and methods
2.1 Materials and samples preparation
2.1.1 Materials
γ-INDO (purity > 99.9 %, Tm γ-INDO = 163 ℃, MW = 357.79 g·mol−1) was purchased from Dalian Meilun Biotechnology Co., Ltd. A-INDO was prepared from γ-INDO, melting an appropriate amount of γ-INDO in an aluminum pot at 165 ℃ in a preheated oven for 30 min. The aluminum pot was quickly removed and the completely melted γ-INDO was poured into dry and clean beaker with liquid nitrogen. When the sample reached to room temperature, it was collected and stored in a 4 ℃ phosphorus pentoxide dryer pending further analysis. Both two solid forms of INDO have been characterized by powder X-ray diffraction (PXRD)to ensure their polymorph purity. These two solid forms were used as standard samples for the quantitative analysis.
2.1.2 Preparation of binary mixture samples
A-INDO and γ-INDO was grinded in agate mortar and then passed through 100 mesh sieves to ensure uniformity of particle size. Binary mixture samples for quantitative analysis were prepared by weighing on a Mettler-Toledo electronic balance (ME204T/02, Mettler-Toledo Instruments Ltd., Shanghai, China) as described in Table 1. To ensure mixing uniformity and consistency of powder particles, each binary mixture samples was grinded in agate mortar for 5 min and then mixed on laboratory vortex mixer for 20 min to collect ATR-FTIR and NIR data. Grinding and mixing experiments were monitored using PXRD to ensure that no phase transition occurred.
Number of samples
Set name
Weight of
A-INDO (mg)Weight of
γ-INDO (mg)Weight ofmixture
(mg)Content of
A-INDO (%)
1
Calibration set
0.0
1000.1
1000.1
0.000
2
50.0
950.9
1000.9
4.996
3
100.2
900.3
1000.5
10.015
4
150.4
849.5
999.9
15.042
5
200.4
800.6
1001.0
20.020
6
250.2
750.4
1000.6
25.005
7
300.2
700.2
1000.4
30.008
8
349.9
650.5
1000.4
34.976
9
400.6
599.8
1000.4
40.044
10
450.3
549.8
1000.1
45.026
11
500.2
500.0
1000.2
50.010
12
550.3
450.4
1000.7
54.992
13
600.1
400.5
1000.6
59.974
14
650.6
349.8
1000.4
65.034
15
700.5
299.7
1000.2
70.036
16
750.5
250.4
1000.9
74.983
17
800.1
200.2
1000.3
79.986
18
850.4
149.8
1000.2
85.023
19
900.2
100.4
1000.6
89.966
20
950.2
49.9
1000.1
95.011
21
1000.3
0.0
1000.3
100.000
1
Validation set
50.1
951.9
1002.0
5.000
2
150.2
851.1
1001.3
15.000
3
250.0
750.0
1000.0
25.000
4
350.1
650.2
1000.3
35.000
5
450.2
550.2
1000.4
45.000
6
700.1
300.0
1000.1
70.000
2.2 Methods
Powder X-ray diffraction (PXRD), ATR-FTIR and NIR were used to characterize the different solid forms.
2.2.1 Powder X-ray diffraction (PXRD)
PXRD patterns were obtained on a Rigaku R-AXIS-RAPID powder diffractometer (Rigaku Co., Japan), with a Cu Ka radiation, λ = 1.5405 Å, and operated at 40 kV and 100 mA. All the measurements were conducted at ambient conditions over a 2θ range of 2-50° using a 0.02° step at a scan rate of 8°·min−1. All samples were analyzed by PXRD for three times.
2.2.2 Attenuated Total Reflectance Fourier Transform Infrared spectroscopy (ATR-FTIR)
All ATR-FTIR spectral data were recorded using a Bruker Alpha ATR-FTIR instrument (Alpha II, Bruker Co., Germany) under the conditions of 4000–400 cm−1, resolution of 4 cm−1, wavenumber interval of 1 cm−1, and cumulative scanning of 16 times. Each sample was scanned three times consecutively for average value at first and this process was repeated twice to obtain three average spectral data to constructed the ATR-FTIR database for quantitative analysis of A-INDO content in binary mixtures of A-INDO and γ-INDO.
2.2.3 Near-Infrared spectroscopy (NIR)
All NIR spectra were tested in near-infrared spectrometer (Antaris Ⅱ, Thermo Fisher Scientific Co., America) at 10000–4000 cm−1, resolution of 4 cm−1, wave number interval of 1 cm−1 and cumulative scans of 16 times. Each sample was scanned three times consecutively for average value at first, and then this process was repeated twice to obtain three average spectral data for constructed the NIR database for quantitative analysis of A-INDO content in binary mixtures of A-INDO and γ-INDO.
2.3 Pretreatment of spectral data
In the preliminary work, 63 average ATR-FTIR spectra (three average spectral data for each sample) and 63 average NIR spectra (three average spectral data for each sample) were collected to develop and validate the quantitative models of A-INDO in the binary mixture of A-INDO and γ-INDO, respectively.
ATR-FTIR and NIR spectra were pretreated by various pretreatment methods to eliminate invalid information in sample spectra (such as uneven particle distribution, scattering caused by particle size differences, optical path changes, etc.) and highlight the intrinsic information. These pretreatment methods included Mean, Multiple Scattering Correction (MSC), Standard Normal Transformation of Variable (SNV), Savitzky-Golay First Derivative (SG1st), Savitzky-Golay Second Derivative (SG2nd), Wavelet Transform (included Wavelet Transform Denoising (WTD) and Wavelet Transform Compression (WTC)) and their combined pretreatment methods. And then, PLSR was used to establish the quantitative models based on ATR-FTIR and NIR in MATLAB2014a. Origin software was used for data processing of linear regression. The quality of the model was evaluated based on the calibration set goodness of fit (R2), root mean square error of calibration (RMSEC), cross-validation (RMSECV) and prediction (RMSEP) values. These are calculated by the Eqs. (1) and (2):
2.4 Validation of developed models
To check the accuracy of the PLSR models, several samples of known A-INDO content (5.000%, 15.000%, 25.000%, 35.000%, 45.000%, 70.000%) were scanned by ATR-FTIR and NIR and predicted the content, respectively. ATR-FTIR and NIR solid-state analysis techniques were confirmed by using A-INDO content of 45.000% to describe precision, repeatability, stability. All the relative standard deviation (RSD) were calculated according to Eq. (3). Limit of detection (LOD) and limit of quantification (LOQ) for each calibration curves were calculated using Eqs. (4) and (5).
Where , , , , was predicted content, average values of the predicted content, number of the samples, standard deviation of predicted content, slope of the calibration curve, respectively.
3 Results and discussion
3.1 Characterization of A-INDO and γ-INDO
Different solid forms PXRD patterns of INDO were showed in Fig. 2. A and B compared the PXRD patterns of γ-INDO (from Cambridge Crystallographic Data Centre (CCDC)) and commercially available INDO, it was found that peak positions of the characteristic peaks were completely consistent, which confirmed that the commercially available INDO was γ-INDO; B and C showed the PXRD patterns of commercially available INDO and prepared A-INDO, it can be seen from the PXRD patterns of C that the characteristic peaks of γ-INDO disappeared, and replaced by the representative “amorphous halo”, indicating that A-INDO has been successfully prepared.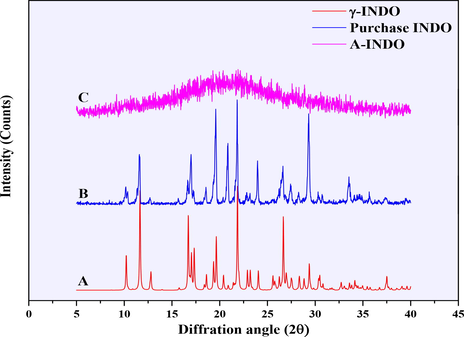
PXRD pattern of different INDO solid forms. A, B and C was the PXRD pattern of γ-INDO, commercially available INDO and prepared A-INDO, respectively.
ATR-FTIR spectra of different solid forms of INDO were showed in Fig. 3, where the various absorption peaks of γ-INDO and A-INDO were consistent with the literature reported by Lynne and Zografi (1997). The ATR-FTIR spectra of 21 different A-INDO content binary mixtures were showed in Fig. S1 for quantitative analysis of A-INDO in binary mixtures.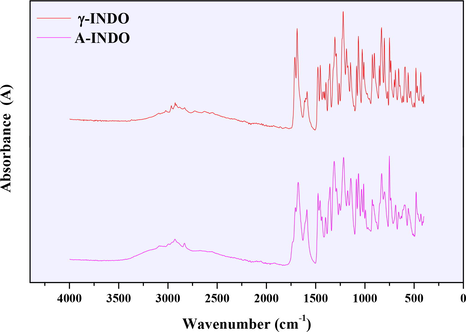
ATR-FTIR spectra of different INDO solid forms.
Fig. 4A showed the ATR-FTIR at 1800–400 cm−1 overlay spectra of 21 binary mixture samples with different A-INDO content, and marked several regions where the peak shape changes significantly with the increase of A-INDO content by orange blocks; Fig. 4B showed the enlarged spectra of 2935–2920 cm−1. It can be seen that the absorption peak intensity increases with the increase of A-INDO content, which laid the foundation for quantitative analysis of A-INDO content based on ATR-FTIR spectra. However, the enhancement trend of intensity with A-INDO content was not obvious, which means that the accuracy of the relation between single peak intensity or area with A-INDO content was not high. Therefore, the full spectrum combined with PLSR method was chosen to establish the quantitative analysis models of A-INDO content.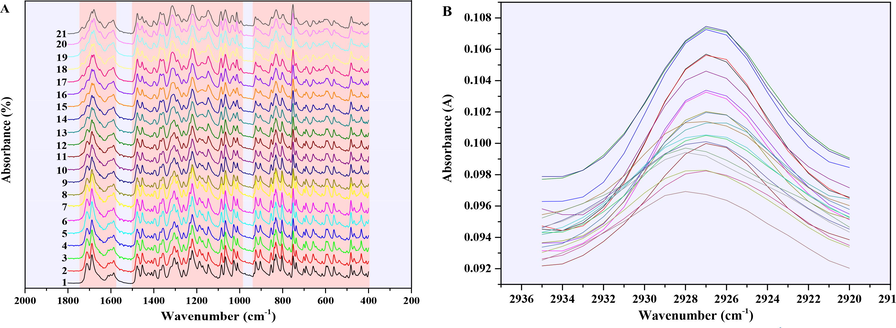
(A) ATR-FTIR overlay spectra of 21 INDO solid mixture samples at 1800–400 cm-1and (B) ATR-FTIR spectra of 21 INDO mixture samples at 2935–2920 cm−1. The Arabic numerals in (A) represented the mixture samples number.
NIR spectra of different solid forms of INDO were showed in Fig. 5, according to the literature (Otsuka et al., 2000), 8532 cm−1, 8432 cm−1, 5940 cm−1, 4656 cm−1 were the functional groups of —CH3, HC⚌CH, aromatic ring, HC⚌CH in INDO molecules, respectively.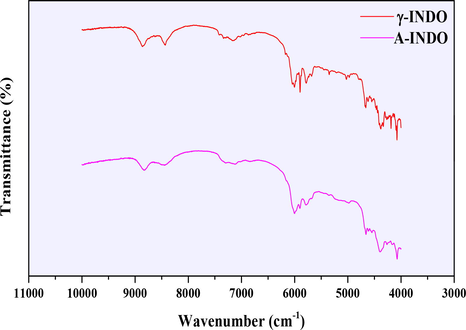
NIR spectra of different INDO solid forms.
The NIR spectra of 21 different A-INDO content binary mixtures were also showed in Fig. 6 for quantitative analysis of A-INDO content. Fig. 6A showed the NIR overlay spectra of 21 samples with different A-INDO content at the resolution of 4 cm−1, and marked nine regions where the peak shape changes significantly with the increase of A-INDO content by pink lines; Fig. 6B showed the enlarged NIR spectra at 9000–8000 cm−1. It can be vaguely seen that the intensity of transmission peak tends to weaken with the increase of A-INDO content, which laid the foundation for the quantitative analysis of A-INDO content based on NIR spectroscopy. However, the decreases trend of the intensity was not obvious with the increases of A-INDO content, which indicated that the quantitative method of the relation between single peak intensity or area and A-INDO content was not accurate. Therefore, the models for quantitative analysis of A-INDO content were established by combining the PLSR method with the full NIR spectrum.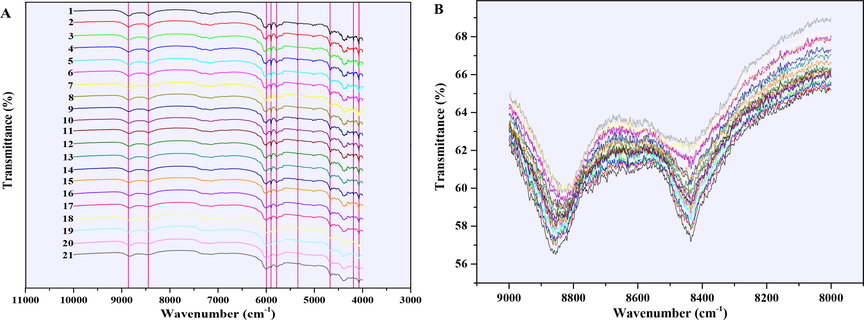
(A) NIR overlay spectra of 21 INDO solid mixture samples and (B) NIR spectra of 21 INDO mixture samples at 9000–8000 cm−1. The Arabic numerals in (A) represented the mixture samples number.
3.2 Development of ATR-FTIR quantification models
Based on ATR-FTIR data of 4000–400 cm−1, PLSR models of different pretreatment methods were established to quantitatively analyze the content of A-INDO in binary INDO mixture. Those results were showed in Table 2 and all calibration curves were showed in Fig. S2.
Pretreatment methods
N
Cross validation validity
RMSECV (%)
RMSECP (%)
RMSEC (%)
R2
LOD (%)
LOQ (%)
Mean
6
−2.535
0.015
2.010
2.234
0.99456
0.714
2.164
MSC
4
−0.500
0.021
3.590
3.009
0.99013
1.497
4.535
SNV
4
−0.590
0.024
3.370
3.161
0.98910
1.709
5.178
SG1st
37
−0.477
0.000
1.633
0.000
1.00000
0.000
0.000
SG2nd
34
0.011
0.000
1.747
0.000
1.00000
0.000
0.000
WTD
5
−0.323
0.008
3.166
2.539
0.99297
1.093
3.313
WTC
5
−0.323
0.008
3.166
2.539
0.99297
1.093
3.313
MSC + WTD
4
−0.786
0.024
3.531
3.222
0.98867
1.839
5.573
MSC + WTC
4
−0.785
0.024
3.531
3.222
0.98867
1.839
5.573
SNV + WTD
4
−0.743
0.029
3.187
3.392
0.98744
2.093
6.342
SNV + WTC
4
−0.744
0.029
3.187
3.392
0.98744
2.093
6.342
SG1st + WTD
4
−0.352
0.017
2.749
2.560
0.99285
1.082
3.278
SG1st + WTC
4
−0.364
0.017
2.744
2.557
0.99287
1.078
3.267
SG2nd + WTD
5
−0.032
0.002
3.984
2.318
0.99414
1.063
3.223
SG2nd + WTC
5
−0.032
0.002
3.978
2.311
0.99417
1.050
3.181
From the R2 values in Table 2, ATR-FTIR spectral data were pretreated by Mean, MSC, MSC + WTD, MSC + WTC, SNV + WTD, SNV + WTC, SG1st + WTD, SG1st + WTC, SG2nd + WTD and SG2nd + WTC, and established the PLSR models had a good effect, all the R2 can reach more than 0.98000, which can be used to detect the A-INDO content in INDO binary mixtures. R2 even can reach more than 0.99000, which pretreated by Mean, MSC, MSC + WTD, MSC + WTC, SG1st + WTD, SG1st + WTC, SG2nd + WTD and SG2nd + WTC, were considered as the better PLSR models, the calibration curves were showed in Fig. S1 (A, B, H, I, L, M, N, O). However, combined with the parameters of RMSEC, RMSECP, RMSECV, number of principal components (N), LOD and LOQ in Table 2, PLSR model established by Mean pretreated (as Fig. 4A) was the most appropriate regression model relative to other pretreatment methods. The calibration curve was Y = 0.99456 X + 0.21526, N = 6, R2 = 0.99456, and various root mean square error such as RMSECV (0.015 %), RMSECP (2.010 %), RMSEC (2.234 %) were very small, LOD = 0.714 %, LOQ = 2.164 %, which had good performance in the range of A-INDO content of 0.000–100.000 % w/w %. The best calibration curve was showed in Fig. 7.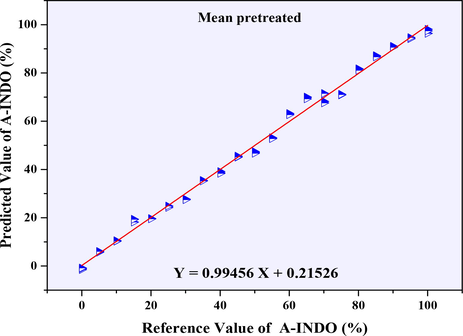
Calibration curve of reference value of A-INDO vs. predicted value of A-INDO.
According to the modeling results in Table 2, Mean pretreatment method could eliminate the common information of all samples, and highlight the differences between samples, which made the PLSR model established by ATR-FTIR data was fully use to quantitative A-INDO content in INDO binary mixtures. SG derivative could improve the resolution of the original data, but also improve the resolution of the noise in the original data, which led to the increase of N during modeling and existed the risk of over fitting. MSC and SNV reduced the influence of uneven of particle distribution and inconformity of particle size, enhance the information related to component content, and reduced N during modeling, but their LOD and LOQ were high. MSC + WT and SNV + WT pretreatment further reduced the noise or other unnecessary information in the original data, made the pretreated data closer to the sample eigen information. N was suitable in modeling, but it also had the problem of higher LOD and LOQ. SG + WT further improved the resolution of the original data so that it was closer to the intrinsic information, and N in modeling was also reduced. However, SG + WT also had the problem of higher LOD and LOQ, which was not suitable for the detection and quantification of low-concentration A-INDO.
3.3 Development of NIR quantification models
Preliminary experiments found that the PLSR models established by different pretreatment methods based on NIR 10000–4000 cm−1 data with different resolutions (2 cm−1, 4 cm−1, 8 cm−1) were not ideal. The comparison showed that the PLSR models established based on NIR 9000–4000 cm−1 data can be used to quantify the content of A-INDO in INDO binary mixture.
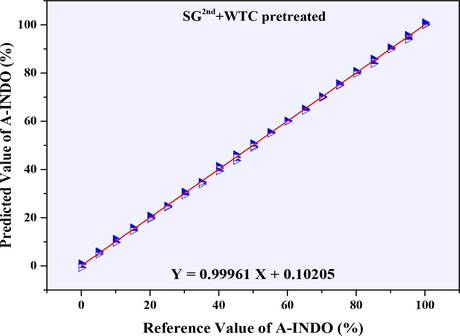
The PLSR models established based on NIR data (9000–4000 cm−1) with the resolution of 2 cm−1 were showed in Table 3, and its calibration cures were showed in Fig. S3. According to the R2 values in Table 3, it was found that PLSR models for quantitative analysis of A-INDO content in INDO binary mixtures established by WTD, WTC, MSC + WTD, MSC + WTC, SNV + WTD, SNV + WTC, SG1st + WTD, SG1st + WTC, SG2nd + WTD and SG2nd + WTC pretreated were effectively models. The calibration curves were showed in Fig. S2 (F, G, H, I, J, K, L, M, N, O), the R2 can reach more than 0.99700, it can be used to detect the A-INDO content in the binary mixture. Among them, the R2 of PLSR models established by SG1st + WTD, SG1st + WTC, SG2nd + WTD and SG2nd + WTC pretreatment methods can reach more than 0.99900, which was regarded as the better models, the calibration curves as showed in Fig. S2 (L, M, N, O). However, combined with the parameters of RMSEC, RMSECP, RMSECV, N and LOD and LOQ in Table 3, the PLSR model pretreated by SG2nd + WTC was the most appropriate model relative to others. The Calibration curve was Y = 0.99961 X + 0.10205, N = 6, R2 = 0.99961, and various RMS errors such as RMSECV (0.002 %), RMSECP (3.978 %), RMSEC (2.311 %) were very small, LOD = 1.050 %, LOQ = 3.181 %, and had good performance in the range of A-INDO content of 0.000–100.000 % w/w %. The Calibration curve was showed in Fig. 8.
Pretreatment methods
N
Cross validation validity
RMSECV (%)
RMSECP (%)
RMSEC (%)
R2
LOD (%)
LOQ (%)
Mean
36
−0.017
0.000
0.502
0.000
1.00000
0.000
0.000
MSC
38
0.039
0.000
0.402
0.000
1.00000
0.000
0.000
SNV
36
−0.021
0.000
0.419
0.000
1.00000
0.000
0.000
SG1st
37
−0.085
0.000
1.790
0.000
1.00000
0.000
0.000
SG2nd
39
−0.412
0.000
2.121
0.000
1.00000
0.000
0.000
WTD
5
0.083
0.001
0.860
1.139
0.99858
0.235
0.711
WTC
5
0.083
0.001
0.860
1.139
0.99858
0.235
0.711
MSC + WTD
5
−0.126
0.002
1.947
1.307
0.99814
0.169
0.511
MSC + WTC
5
−0.126
0.002
1.948
1.308
0.99814
0.168
0.510
SNV + WTD
5
0.095
0.003
1.499
1.380
0.99792
0.291
0.882
SNV + WTC
5
0.096
0.003
1.500
1.380
0.99792
0.291
0.882
SG1st + WTD
8
0.032
0.001
2.070
0.373
0.99985
0.109
0.331
SG1st + WTC
8
0.039
0.001
1.983
0.372
0.99985
0.112
0.340
SG2nd + WTD
8
0.039
0.001
1.983
0.372
0.99985
0.112
0.340
SG2nd + WTC
6
0.078
0.000
1.776
0.606
0.99961
0.337
1.021
Calibration curve of reference value of A-INDO vs. predicted value of A-INDO (2 cm−1).
According to the modeling results in Table 3, the N of models established by Mean, MSC, SNV, SG1st and SG2nd pretreatment was too large, and there was a risk of over fitting. After MSC + WTD, MSC + WTC, SNV + WTD and SNV + WTC pretreated, RMSECP and RMSEC of models were too large, which was unfavorable for predicting the A-INDO content of unknown samples in the later stage. SG1st + WTD, SG1st + WTC and SG2nd + WTD had the problem of excessive RMSECP. Only the PLSR model established after SG2nd + WTCpretreated fully met the requirements.
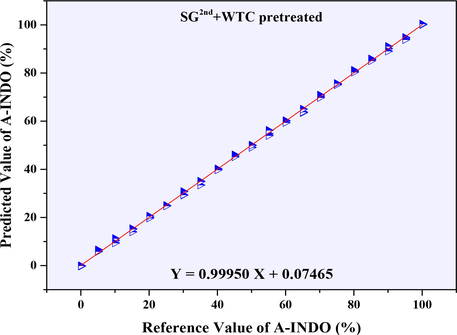
The PLSR models established based on NIR data (9000–4000 cm−1) with the resolution of 4 cm−1 were showed in Table 4, and all the calibration cures were showed in Fig. S4. Considering the R2 values from table 4, the PLSR models with R2 greater than 0.99950 were selected as the better models, and its calibration curves were showed in Fig. S4 (H, I, L, M, N, O). Combined with the parameters of RMSEC, RMSECP, RMSECV, N, LOD, LOQ, it was found that, PLSR model established after SG2nd + WTC pretreated was the most suitable regression model. The calibration curve was Y = 0.99950 X + 0.07465, N = 7, R2 = 0.99950, all kinds of root mean square errors such as RMSECV (0.002%), RMSECP (1.034%) and RMSEC (0.678 %) were very small. With LOD = 0.246 % and LOQ = 0.747 %, it had good performance in the range of A-INDO content of 0.000–100.000 % w/w %, and its calibration curve was showed in Fig. 9.
Pretreatment methods
N
Cross validation validity
RMSECV (%)
RMSECP (%)
RMSEC (%)
R2
LOD (%)
LOQ (%)
Mean
4
−0.014
0.025
1.518
2.094
0.99522
0.836
2.532
MSC
34
0.078
0.000
0.357
0.000
1.00000
0.000
0.000
SNV
32
−0.187
0.000
0.464
0.000
1.00000
0.000
0.000
SG1st
32
−0.401
0.000
0.560
0.000
1.00000
0.000
0.000
SG2nd
25
0.028
0.000
1.572
0.000
1.00000
0.000
0.000
WTD
4
0.013
0.008
1.438
1.582
0.99727
0.568
1.723
WTC
4
0.013
0.008
1.438
1.582
0.99727
0.568
1.723
MSC + WTD
8
−0.028
0.001
1.032
0.513
0.99971
0.113
0.341
MSC + WTC
8
−0.029
0.001
1.034
0.513
0.99971
0.129
0.422
SNV + WTD
5
0.084
0.003
0.626
1.017
0.99887
0.172
0.520
SNV + WTC
5
0.084
0.003
0.627
1.017
0.99887
0.172
0.520
SG1st + WTD
9
−0.107
0.001
1.493
0.354
0.99986
0.098
0.297
SG1st + WTC
9
−0.101
0.001
1.431
0.346
0.99987
0.102
0.310
SG2nd + WTD
7
0.048
0.002
1.034
0.678
0.99950
0.246
0.747
SG2nd + WTC
7
0.048
0.002
1.034
0.678
0.99950
0.246
0.747
Calibration curve of reference value of A-INDO vs. predicted value of A-INDO (4 cm−1).
Table 4 was showed that the RMSECP and RMSEC of the models built after Mean, WTD and WTC pretreated were too large, which was not good for the prediction of unknown samples in the later stage. The N was too large for MSC, SNV, SG1st and SG2nd pretreated. After pretreated with MSC + WT and SG1st + WT, N and RMSECP were larger in modeling. After SNV + WTD and SNV + WTC pretreated, models RMSEC were large, and R2 was not high enough. Only the PLSR model established after SG2nd + WT pretreated met the requirements.
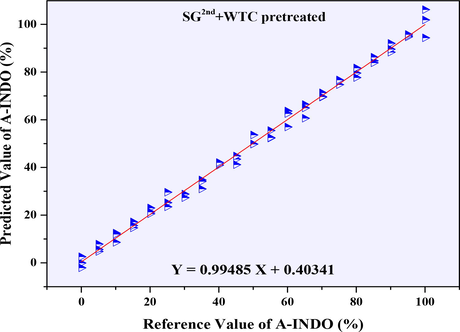
The PLSR models established based on NIR data (9000–4000 cm-1) with the resolution of 8 cm−1 were showed in Table 5, and all the calibration cures were showed in Fig. S5. Considering the R2 values, the PLSR models with R2 greater than 0.99000 were selected as the better models, and its calibration curves were showed in Fig. S5 (L, M, N, O). Combined with the parameters of RMSEC, RMSECP, RMSECV, N, LOD, LOQ, it was found that, PLSR model established after SG2nd + WTC preprocessing was the most suitable PLSR model. The calibration curve was Y = 0.99485 X + 0.40341, N = 4, R2 = 0.99487, all kinds of root mean square errors such as RMSECV (0.009 %), RMSECP (3.055 %) and RMSEC (2.178 %) were very small. With LOD = 1.338 % and LOQ = 4.055 %, it had good performance in the range of A-INDO content of 0.000–100.000 % w/w %, and its calibration curve was showed in Fig. 10.
Pretreatment methods
N
Cross validation validity
RMSECV (%)
RMSECP (%)
RMSEC (%)
R2
LOD (%)
LOQ (%)
Mean
4
−0.292
0.065
1.778
4.506
0.97785
3.561
10.791
MSC
4
0.079
0.014
1.951
3.772
0.98448
2.463
7.464
SNV
4
−0.857
0.047
1.843
3.712
0.98497
2.342
7.096
SG1st
2
0.096
0.004
3.552
3.512
0.98658
2.683
8.130
SG2nd
2
−0.617
0.038
5.059
5.341
0.96893
5.836
17.686
WTD
4
−0.304
0.059
0.965
4.238
0.98041
3.250
9.849
WTC
4
−0.304
0.059
0.965
4.238
0.98041
3.250
9.849
MSC + WTD
4
0.018
0.024
1.759
4.025
0.98233
2.808
8.510
MSC + WTC
4
0.018
0.024
1.759
4.025
0.98233
2.808
8.509
SNV + WTD
4
−0.567
0.044
1.634
4.075
0.98189
2.833
8.584
SNV + WTC
4
−0.567
0.044
1.634
4.075
0.98189
2.833
8.584
SG1st + WTD
4
−0.370
0.007
3.474
2.427
0.99357
1.120
3.394
SG1st + WTC
4
−0.372
0.007
3.464
2.430
0.99356
1.122
3.401
SG2nd + WTD
4
−0.098
0.010
3.025
2.175
0.99488
1.411
4.275
SG2nd + WTC
4
−0.103
0.009
3.055
2.178
0.99487
1.338
4.055
Calibration curve of reference value of A-INDO vs. predicted value of A-INDO (8 cm−1).
Table 5 was showed that the N of the models built after pretreated by Mean, MSC, SNV, SG1st, SG2nd, WTD, WTC, MSC + WTD, MSC + WTC, SNV + WTD, SNV + WTC SG1st + WTD, SG1st + WTC and SG2nd + WTD was suitable, but RMSECP, RMSEC, LOD and LOQ were too large, which was unfavorable to the detection and prediction of unknown samples in the later stage. Only the PLSR model established after SG2nd + WTC pretreated generally met the requirements.
Among the optimal models built with different resolutions, the RMSECP (3.055 %) of the model with the resolution of 8 cm−1 was larger, R2 (0.99487) was smaller, LOD (1.338 %) and LOQ (4.055 %) were higher. Therefore, although N was smaller, but it was poor in model performance. The optimal models with the resolution of 2 cm−1 and 4 cm−1 could meet the requirement of quantitative analysis of A-INDO content in INDO binary mixture, but comparatively, the RMSECP, especially LOD and LOQ of the model with a resolution 4 cm−1 were smaller than that of 2 cm−1. It was indicated that the model had less error in predicting the unknown content of A-INDO, and can detect and quantify the lower content of A-INDO. Therefore, the model with a resolution of 4 cm−1 was considered to be the most suitable model. This also proved that the increase of resolution can improve the peak shape, but when it reached a certain level, increasing the resolution was not only meaningless to change the peak shape, but also increased the noise.
3.4 Validation of quantitative models
In order to verify the predictive ability of the models, authors reformulated the INDO binary mixture with known A-INDO content (5.000 %, 15.000 %, 25.000 %, 35.000 %, 45.000 %, 70.000 %), collected ATR-FTIR and NIR data, pretreated by the same pretreatment method, and predicted content by PLSR models, which used to investigate the predictive ability of the models. At the same time, the corresponding data of 45.000 % A-INDO content sample were collected to investigate the precision, repeatability and stability. The results were showed in Table 6.
Test Instrument
ATR-FTIR
NIR
Resolution
2 cm−1
2 cm−1
4 cm−1
8 cm−1
Pretreatment method
Mean
SG2nd + WTC
SG2nd + WTC
SG2nd + WTC
Verification sample 1 (%)
6.073
4.764
5.533
7.484
Verification sample 2 (%)
19.247
15.961
15.141
10.839
Verification sample 3 (%)
24.413
23.262
23.418
21.903
Verification sample 4 (%)
35.718
31.940
33.292
36.574
Verification sample 5 (%)
45.18
42.871
44.213
40.873
Verification sample 6 (%)
67.96
71.014
70.269
68.152
Precision (%)
6.382
--
7.186
--
Repeatability (%)
5.662
--
6.535
--
Stability (%)
4.382
--
4.676
--
It can be seen from Table 6 that the predicted value of ATR-FTIR optimal PLSR model for six known samples was close to the actual value, and the prediction effect was good. The relative errors between the predicted value and the actual value were 21.452 %, 28.315 %, −2.350 %, 2.051 %, 0.400 % and −2.914 %, respectively. It can be found that when the content of A-INDO was<15.000 %, the relative error was large, which indicated that the prediction effect of this model for low-content A-INDO was not very good. The predicted values of the PLSR model with different resolution NIR for six samples with known content were also close to the actual values, indicating that the prediction effect was good. The relative errors between predicted values and real values were following: −4.717 %, 6.406 %, 6.953 %, 8.744 %, 4.730 %, 1.448 % (2 cm−1);10.666 %, 0.940 %, 6.327 %, 4.879 %, 1.750 %, 0.385 % (4 cm−1); 49.678 %, −27.742 %, −12.388 %, 4.496 %, −9.171 %, −2.640 % (8 cm−1). Compared the relative errors, it was found that models with resolution of 2 cm−1 and 8 cm−1 were larger and resolution of 4 cm−1 was smaller, which indicated that the PLSR model established under the test condition with resolution of 4 cm−1 had the better performance at the content of 0.000–100.000 % w/w %.
3.5 Comparation of two Solid-State analysis techniques
RMSECV, RMSECP, RMSEC, R2, LOD, LOQ, precision, repeatability and stability of the best ATR-FTIR PLSR model were 0.015 %, 2.010 %, 2.234 %, 0.99456, 0.714 %, 2.164 %, 6.382 %, 5.662 % and 4.382 %, respectively. Those of NIR best PLSR model were 0.002 %, 1.034 %, 0.678 %, 0.99950, 0.246 %, 0.747 %, 7.186 %, 6.535 % and 4.676 %, respectively. Therefore, the optimal PLSR models established by ATR-FTIR and NIR data can be fully satisfy the requirements for a quantitative assay. Compared with the PLSR model established by Heinz et al. (2007) in 2007 by SNV pretreated NIR data of 1500 nm-1800 nm, the optimal PLSR model of NIR established in this study had a higher R2 (0.99950 greater than 0.989), lower RMSECP (1.034 % < 3.6 %) and RMSEC (0.678 % < 4.4 %).
In general, these two solid analysis techniques were suitable for the quantitative analysis of A-INDO content in INDO binary mixtures with good linear range, small prediction error, high accuracy, precision and repeatability. Compared with ATR-FTIR, the optimal quantitative model established by NIR analysis technology had lower LOD and LOQ on the basis of similar other performance parameters, which was more suitable for quantitative analysis of INDO binary mixtures with low A-INDO content.
4 Conclusion
This study’s objective was to establish a rapid and accurate quantitative analysis of the transformation from amorphous to crystalline state during the manufacture of amorphous bulk medicines. ATR-FTIR and NIR have been frequently employed in the quantitative analysis of various crystalline forms in polycrystalline mixtures. Both ATR-FTIR and NIR were non-destructive, non-contact and fast analysis techniques, but they were easily affected by scattering caused by particle size and mixing uniformity. Therefore, the PLSR models for quantitative analysis of A-INDO content were established based on ATR-FTIR and NIR spectroscopy combined with a number of pretreatment methods to preprocess spectral data. The optimal PLSR models for quantitative analysis of A-INDO content in the binary mixture of A-INDO and γ-INDO with two analytical techniques were selected by analysis and comparison. The models were suitable for quality monitoring during the process of INDO amorphous API, according to the examination of the predicted relative error analysis of samples with known content.
The quantitative models of amorphous content in bulk drugs established by ATR-FTIR and NIR analysis combined with stoichiometry can be used to monitor the transformation from amorphous to crystalline state in the process of production, storage and transportation of bulk drugs. These models can offer trustworthy technical support for the detection of amorphous content in bulk drugs.
Acknowledgements
The authors are grateful to the Tianjin City Natural Science Foundation of China (21JCZDJC00400), Hebei Province Major Projects of China (21282602Z), National Natural Science Foundation of China 21621004 and Qinghai Province Natural Science Foundation of China (2020-HZ-802, 2020-ZJ-953Q).
Declaration of Competing Interest
The authors declare that they have no known competing financial interests or personal relationships that could have appeared to influence the work reported in this paper.
References
- Indomethacin polymorphs: experimental and conformational analysis. J. Pharm. Sci.. 2009;98:2448-2463.
- [CrossRef] [Google Scholar]
- Analysing the crystal purity of mebendazole raw material and its stability in a suspension formulation. Int. J. Pharmaceut.. 2008;361:245-250.
- [CrossRef] [Google Scholar]
- The use of isothermal microcalorimetry in the study of small degrees of amorphous content of a hydrophobic powder. Int. J. Pharmaceut.. 1996;130:195-201.
- [CrossRef] [Google Scholar]
- Comparison of the effects of two drying methods on polymorphism of theophylline. Int. J. Pharmaceut.. 2004;276:129-141.
- [CrossRef] [Google Scholar]
- Quantitative determination of two polymorphic forms of imatinib mesylate in a drug substance and tablet formulation by X-ray powder diffraction, differential scanning calorimetry and attenuated total reflectance Fourier transform infrared spectroscopy. J. Pharmaceut. Biomed.. 2015;114:330-340.
- [CrossRef] [Google Scholar]
- Qualitative and quantitative study of polymorphic forms in drug formulations by near infrared FT-Raman spectroscopy. J. Mol. Struct.. 2003;661:307-317.
- [CrossRef] [Google Scholar]
- Ritonavir: an extraordinary example of conformational polymorphism. Pharm. Res.. 2001;18:859-866.
- [CrossRef] [Google Scholar]
- Quantification of niclosamide polymorphic forms-A comparative study by Raman, NIR and MIR using chemometric techniques. Talanta. 2019;199:679-688.
- [CrossRef] [Google Scholar]
- Polymorphism and solvatomorphism 2008. J. Pharm. Sci.. 2010;99:3648-3664.
- [CrossRef] [Google Scholar]
- Reactivity differences of indomethacin solid forms with ammonia gas. J. Am. Chem. Soc.. 2002;124:15012-15019.
- [CrossRef] [Google Scholar]
- Cryogenic grinding of indomethacin polymorphs and solvates: assessment of amorphous phase formation and amorphous phase physical stability. J. Pharm. Sci.. 2002;91:492-507.
- [CrossRef] [Google Scholar]
- Quantitative analysis of mebendazole polymorphs in pharmaceutical raw materials using near-infrared spectroscopy. J. Pharmaceut. Biomed.. 2015;115:587-593.
- [CrossRef] [Google Scholar]
- Pharmaceutical coamorphous a newly defined single-phase amorphous binary system. Prog. Chem.. 2014;26:478-486.
- [CrossRef] [Google Scholar]
- Quantifying ternary mixtures of different solid-state forms of indomethacin by Raman and near-infrared spectroscopy. Eur. J. Pharm. Sci.. 2007;32:182-192.
- [CrossRef] [Google Scholar]
- Quantitative polymorph contaminant analysis in tablets using Raman and near infra-red spectroscopies. J. Pharmaceut. Biomed.. 2013;72:163-171.
- [CrossRef] [Google Scholar]
- Quantitative analysis of sulfathiazole polymorphs in ternary mixtures by attenuated total reflectance infrared, near-infrared and Raman spectroscopy. J. Pharmaceut. Biomed.. 2010;53:412-420.
- [CrossRef] [Google Scholar]
- Exploring molecular speciation and crystallization mechanism of amorphous 2-phenylamino nicotinic acid. Pharm. Res.. 2018;35:51.
- [CrossRef] [Google Scholar]
- Co-amorphous solid dispersions for solubility and absorption improvement of drugs: composition, preparation, characterization and formulations for oral delivery. Pharmaceutics. 2018;10:98.
- [CrossRef] [Google Scholar]
- Crystal and molecular structure of an anti-inflammatory agent, indomethacin, 1-(p-chlorobenzoyl)-5-methoxy-2methylindole-3-acetic acid. J. Am. Chem. Soc.. 1972;94:1340-1345.
- [CrossRef] [Google Scholar]
- The polymorphism of progesterone: stabilization of a “disappearing” polymorph by co-crystallization. J. Pharm. Sci-Us.. 2007;96:3419-3431.
- [CrossRef] [Google Scholar]
- Solid-state NMR and DSC methods for quantifying the amorphous content in solid dosage forms: an application to ball-milling of trehalose. Int. J. Pharmaceut.. 2004;280:209-219.
- [CrossRef] [Google Scholar]
- Identification and investigation of the vibrational properties of crystalline and co-amorphous drugs with Raman and terahertz spectroscopy. Biomed. Opt. Express. 2019;10:4290-4304.
- [CrossRef] [Google Scholar]
- Quantitative analysis of binary mixtures of entecavir using solid-state analytical techniques with chemometric methods. Arab. J. Chem.. 2021;14:103360
- [CrossRef] [Google Scholar]
- Spectroscopic characterization of interactions between PVP and indomethacin in amorphous molecular dispersions. Pharm. Res.-Dordr.. 1997;14:1691-1698.
- [CrossRef] [Google Scholar]
- Quantitative determination of famotidine polymorphs: X-ray powder diffractometric and Raman spectrometric study. J. Pharmaceut. Biomed.. 2009;49:338-346.
- [CrossRef] [Google Scholar]
- Assessing the performance of amorphous solid dispersions. J. Pharm. Sci.. 2012;101:1355-1377.
- [CrossRef] [Google Scholar]
- Comparative evaluation of the degree of indomethacin crystallinity by chemoinfometrical fourie-transformed near-infrared spectroscopy and conventional powder X-ray diffractiometry. AAPS Pharm. Sci.. 2000;2:9.
- [Google Scholar]
- The influence of thermal and mechanical preparative techniques on the amorphous state of four poorly soluble compounds. J. Pharm. Sci.. 2005;94:1998-2012.
- [CrossRef] [Google Scholar]
- An approach to estimate the amorphous content of pharmaceutical powders using calorimetry with no calibration standards. Int. J. Pharmaceut.. 1997;149:267-271.
- [Google Scholar]
- Effect of L-alanyl-glycine dipeptide on calcium oxalate crystallization in artificial urine. J. Cryst. Growth. 2021;566:126176
- [CrossRef] [Google Scholar]
- IR spectroscopy together with multivariate data analysis as a process analytical tool for in-line monitoring of crystallization process and solid-state analysis of crystalline product. J. Pharmaceut. Biomed.. 2005;38:275-284.
- [CrossRef] [Google Scholar]
- Novel identifcation of pseudopolymorphic changes of theophylline during wet granulation using near infrared spectroscopy. J. Pharm. Sci.. 2001;90:389-396.
- [CrossRef] [Google Scholar]
- Pellet manufacturing by extrusion-spheronization using process analytical technology. AAPS Pharm. Sci. Tech.. 2005;6:E174-E183.
- [CrossRef] [Google Scholar]
- Analytical techniques for quantification of amorphous/crystalline phases in pharmaceutical solids. J. Pharm. Sci.. 2006;95:1641-1665.
- [CrossRef] [Google Scholar]
- Dissolution behavior of crystalline solvated and nonsolvated forms of some pharmaceuticals. J. Pharm. Sci.. 1963;52:781-791.
- [CrossRef] [Google Scholar]
- Quantitation of crystallinity in substantially amorphous pharmaceuticals and study of crystallization kinetics by X-ray powder diffractometry. Powder Diffr.. 2000;15:2-6.
- [CrossRef] [Google Scholar]
- Modification of crystal habit and its role in dosage form performance. Drug. Dev. Ind. Pharm.. 2001;27:699-709.
- [CrossRef] [Google Scholar]
- Polymorphic generation through solvent selection: ranitidine hydrochloride. Org. Process. Res. Dev.. 2007;11:138-143.
- [CrossRef] [Google Scholar]
- Application of a salt coformer in a co-amorphous drug system dramatically enhances the glass transition temperature: a case study of the ternary system carbamazepine, citric acid, and l-arginine. Mol. Pharmaceut.. 2018;15:2036-2044.
- [CrossRef] [Google Scholar]
- Exploring the physical stability of three nimesulide-indomethacin co-amorphous systems from the perspective of molecular aggregates. Eur. J. Pharm. Sci.. 2020;147:105294
- [CrossRef] [Google Scholar]
- Amorphous pharmaceutical solids: preparation, characterization and stabilization. Adv. Drug. Deliver. Rev.. 2001;48:27-42.
- [CrossRef] [Google Scholar]
Appendix A
Supplementary material
Supplementary data to this article can be found online at https://doi.org/10.1016/j.arabjc.2023.104885.
Appendix A
Supplementary material
The following are the Supplementary data to this article:Supplementary data 1
Supplementary data 1


