

Translate this page into:
Quantitative elemental analysis of nutritional, hazardous and pharmacologically active elements in medicinal Rhatany root using laser induced breakdown spectroscopy
⁎Corresponding author. magondal@kfupm.edu.sa (M.A. Gondal)
-
Received: ,
Accepted: ,
This article was originally published by Elsevier and was migrated to Scientific Scholar after the change of Publisher.
Abstract
Rhatany roots (RRs) have been used in indigenous systems of medicines to treat many common illnesses due to the presence of highly active astringent and antiviral biochemical constituents that possess strong therapeutic and pharmacological properties. Due to its widespread use, the accurate knowledge on the elemental composition of this medicinal plant can set a pharmacological research platform to investigate the effect of certain elements, and their ions in mediating the human metabolism and therapy. In this work calibration-free laser-induced breakdown spectroscopy (CF-LIBS) is used to detect the elements present in RRs sample, by analyzing the characteristic emission wavelengths and their respective intensities in the laser induced plasma, without the need for using any calibration standards or methods. Many nutritional elements, which are of human health significance and instrumental in mediating the established biological activities of RRs, were identified in a relative abundance. In addition to this, our analysis identified the trace level of a few toxic elements, whose overdose due to reckless intake wreaks havoc to human health and wellbeing. The reliability of qualitative and quantitative detection of the elements in RR by LIBS were validated by the standard inductively coupled plasma optical emission spectroscopy (ICP OES), the results of which are in good agreement with LIBS data with better relative accuracy. Also, in order to discriminate, and single out any two elements with the overlapping emission wavelength in LIBS, X-ray photoelectron spectroscopy was also carried out, which in its own right is in good agreement with the elemental analysis of LIBS in general.
Keywords
Rhatany roots (RRs)
Laser-induced breakdown spectroscopy (LIBS)
Calibration-free laser-induced breakdown spectroscopy (CF-LIBS)
Inductively coupled plasma optical emission spectroscopy (ICP OES)
X-ray photoelectron spectroscopy (XPS)

1 Introduction
Rhatany (Krameria lappacea or Krameria triandra) is a parasitic shrub, cultivated mainly in Peru, and other Latin American countries, and it is widely used in many indigenous systems of medicines, as its root is believed to be a good astringent and antimicrobial agent [1–2]. Therapeutic efficacy of this plant is time tested to treat various gastrointestinal diseases like diarrhea, dysentery, colitis, anal fissures and haemorrhoids; gynecological afflictions like menorrhagia (heavy or prolonged menstrual periods), vaginal discharge (leukorrhea); oral illness like inflammation of the mucous membrane of the mouth (stomatitis), gingivitis, sore throat (pharyngitis), and inflammation of the tissue around the teeth (periodontitis) [1,3,4]. Many pharmacopoeia and medicinal monographs depicted the preparation of decoction and tincture of RRs as a medicinal product [5,6], and many biological studies have substantiated the astringent [5], antidiabetic [7], vasoprotective [8], antiinflammatory [9], antimicrobial [5,10,11], and antioxidant [12,13] properties of RRs. Although, a few scientific studies on the therapeutic effectiveness of the herbs like RRs have been cropping up, the use of these herbs in the traditional system of medicine is partly time tested and partly based on conviction. Ironically, these days the number of people using this medicine has been increasing in spite of the availability of modern medicines and treatments. There have been many reports about the presence of hazardous heavy metals and chemical compounds in the medicinal plants and reckless and nonscientific use of this medicine can wreak havoc to human health and wellbeing. The pharmacological activities of RRs plant are far from the scope of this study rather our work dwells on detecting the hazardous as well as the nutritional elements present in RRs, which gives the awareness about the pros and con of using this common medicinal plant for various treatments. In this focus area, there have been many scientific reports about the chemical and elemental composition of individual medicinal plants like RRs [14,15].
Laser induced breakdown spectroscopy (LIBS) is basically an atomic emission spectroscopy, capable of characterizing the elemental composition of a sample by recording the atomic transition lines of neutral and ionized atomic species, present in the laser induced sample plasma. In LIBS, the highly focused pulsed laser beam, bearing high energy almost atomizes and ionizes all the molecules present in the sample and creates the luminous plasma. The hot and chaotic plasma generated by the intense laser pulse gradually cools down and during this process of temporal evolution, the emission from the constituent atomic (in both neutral and ionic forms) and molecular species takes place. The dispersed emission spectrum recorded by a spectrograph-ICCD camera, at an appropriate time delay after excitation represents the characteristic elemental composition of the sample under study [16,17]. In the area of elemental analysis, LIBS could be viewed as one of the many techniques like X-ray fluorescence spectroscopy (XRF), inductively coupled plasma, atomic emission spectroscopy (ICP AES), and atomic absorption spectroscopy (AAS). However, LIBS stands out in many practical and experimental features like, simple instrumentation, rapid and real-time data collection, easy sample preparation, portability, minimum deterioration to the sample, remote capability, and its capability to be used for samples in three different states of matter [16,18,19].
The application of LIBS is vast and versatile; hence we restrict the literature survey to the reports on biological samples relevant to the present sample under study [17,20,21]. Owing to the unique biological function, the chemical compositions of plant roots are quite complex, containing a large number of nutrients and even phytotoxic elements. The in-situ LIBS analysis on wheat seedlings by Kumar et al., indicated a high level of Cr (VI), in addition to comparatively lower concentrations of nutrient elements like K, Ca, Mg, N, and Na in the wheat seedling [22]. In a subsequent LIBS works, the effect of supplementing silicon (Si) in wheat seedling was studied. Their results indicated that the increased Si content in the wheat seedling diminished the level of hazardous Cr (VI) and Pb (I) contents and also enhanced the level of vital macronutrients (K, P, Ca, S, and Mg) and micronutrients (Fe, Zn, B, Cu, Na, Mn, and Ni) [23–24]. Liu et al. [25] carried out LIBS analysis, in conjunction with chemometric models on tobacco roots and estimated the level of Cd. Two other reports on plant roots by LIBS analysis were the identification of Cu and Ag ions in Vicia faba root [26] and vetch roots [27]. Conventionally, the quantitative analysis in LIBS is carried out by the calibration curve (emission line intensity vs. known elemental concentration), using a few matrix-matched reference samples. The applicability of this method is limited because a matrix with composition similar to the unknown sample is required. Ciucci et al. [28] for the first time proposed a novel method of performing a method that does not require the cumbersome calibration procedures or any compatible calibration matrix. The prerequisites for the CF-LIBS procedure are that the plasma should be optically thin, and in the state of local thermodynamic equilibrium and should have few lines of each constituent elements [29,30]. The striking feature of this method is that the sample matrix is taken as the part of the analysis rather than taking the sample matrix as the external disturbing interference. The main advantage of CF- LIBS is that it does not require a matching matrix, which is always not available and the disadvantage is that we need a set of lines detected in the sample to carry out this procedure.
Earlier analytical works on RRs were focused on studying the pharmacological constituents in the perspective of remedy for different disorders and diseases [5,7–13]. The current study aims to carry out LIBS based calibration free elemental analysis to investigate the nutritional and toxic elements present in RRs, using a 266 nm pulsed laser excitation. Prior to the analysis, the LIBS system was optimized for laser pulse energy, the excitation acquisition delay time, and the establishment of local thermodynamic equilibrium (LTE) was verified by measuring plasma parameters like plasma temperature and the electron number density. In this optimum condition, the LIBS spectrum was recorded and the quantitative analysis of the elemental composition of RR was carried out by calibration free method (CF-LIBS), using the laser induced plasma parameters, spectroscopic parameters and the Maxwell-Boltzmann distribution of the elements under study. The LIBS elemental analysis results were validated using inductively coupled plasma optical emission spectroscopy (ICP OES) and X-ray photoelectron spectroscopy (XPS).
2 Experimental details
2.1 LIBS setup
In the LIBS system, the excitation source for the sample plasma generation is the fourth harmonic (266 nm) of pulsed Nd-YAG laser (Quantel Ultra), with the pulse duration of 8 ns and the repletion rate of 20 Hz. The laser beam of 50 mJ/pulse energy was directed on the sample surface using UV mirrors and a UV lens of 30 cm focal length to create a focused beam size of about 100 µm. The signal from the luminous plasma was collected by the fiber optic cable, equipped with proper collection optics, and directed into the input port 500 mm spectrograph (Andor SR 500 i-A) with the grating grove density of 1200 line per mm, which gives the spectral resolution of 0.1 nm. The exit slit of the spectrograph is attached to ICCD camera (Andor – iStar) with 1024 by 1024 pixel size, which also has built in delay generator to delay the acquisition with respect to the excitation pulse. The excitation acquisition delay was used in many optimized values and the gate opening was kept at 2 μs. The integration time of the ICCD camera of the measurement was 17 ms, which on average gives 3 pulse average per accumulation (20 Hz laser), and each LIBS scan was carried out in 25 such accumulations in order to enhance the accuracy of the measurements. A detailed description of the LIBS setup is shown in Fig. 1, and in our previous publications [31–33].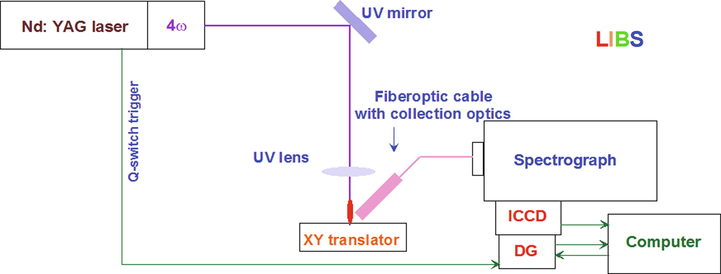
Schematic diagram of the LIBS setup applied for the analysis of Rhatany roots samples.
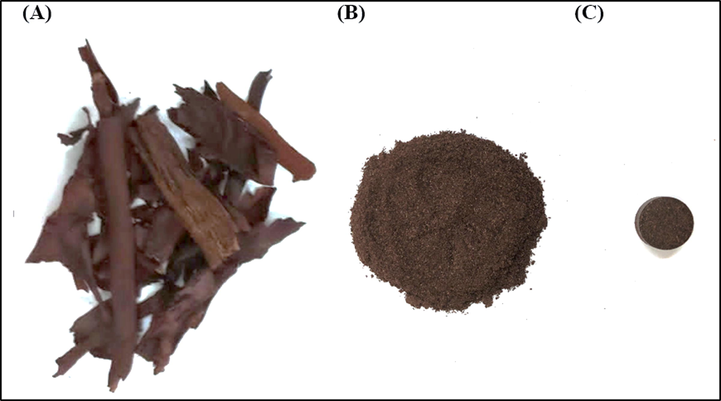
Preparation of Rhatany roots samples, a) dried as purchased roots, b) ground roots, and c) pelletized roots.
2.2 Sample preparation of Rhatany roots for LIBS analysis
Dried Rhatany roots used in our work are commercially procured in the dried form and presumably, it is sun dried with no water content in it. At first, the dried roots were properly cleaned from dust and any extraneous particles. The dried RRs was ground into a fine powder using a research-grade ball milling machine and sieved with a metallic filter, having a pore size of around 500 µm. So, it is expected that the RR powder specimen used for this study should have a particle size of about 500 µm. Extreme care was taken not to contaminate the sample. The pellets of 13 mm diameter and 4 mm thick were made with hydraulic press under the pressure of 10 tons (Specac Ltd., GS15011) using 1 g of powder. Pellets were kept in a desiccator to avoid dust, contamination and air-moisture prior to conducting the atomic spectroscopic analysis. No binders were used for the pelletizing, as the pellets were hard enough to endure the laser pulses irradiation thrust. The photographs of the raw roots, ground root, and the palletized sample are shown in Fig. 2.
2.3 XPS analysis
X-ray photoelectric spectrometer (Kratos Axis Ultra DLD instrument) equipped with a monochromatic Al Kα X-ray source (1486.6 eV) and the power of 150 W was used for the XPS analysis. All the spectra were recorded with slot dimension of 300 μm × 700 μm. To avoid the differential charging all the samples were put on the floating mode, wherein the charge neutralization was prerequisite and therefore well dried Rhatany roots samples were used for XPS analysis.
2.4 Microwave-assisted acid digestion procedure of Rhatany roots for ICP OES elemental analysis
ICP OES system (Agilent's 5110 Vertical Dual View (VDV) ICP OES) was used for elemental analysis using the characteristic atomic emission lines of the plasma by the optical emission spectrometer. The RRs powder of 33 mg for analyzing Ca, K, Mg, S, Si, Al, P, and Na elements, and 150 mg for analyzing the rest of the elements were digested in a single reaction chamber (SRC) using the microwave acid digestion system (Milestone Inc., Italy). To dissolve the samples, about 5 ml of the nitric acid (HNO3) solution (69%, Sigma Aldrich) was added to the weighed powdered roots in sterilized and sealed Teflon MW-vessels. The samples were kept under fixed power of 1500 Watts and maximum pressure of 100 bar. Then, the samples were heated with a digestion program in three steps: samples were, first, heated to 130 °C for 10 min, and then heated to 240 °C for 10 min, and finally at 240 °C for 15 min. Next, the samples were cooled down by the chiller to room temperature for 15 min. After that, the completely digested samples were transferred to 50 ml translucent polypropylene (PP) vials, and diluted to 20 ml using deionized (DI) water. Same procedure was carried out for the preparation of blank samples. According to the analytical 200.7 method developed by United States Environmental Protection Agency (EPA), the dried RRs were analyzed using ICP OES technique. All the elemental analyzes were carried out under normal instrumental operating conditions. The radiofrequency (RF) with source power (1200 W), nebulizer gas flow rate (0.7 L/min), plasma gas flow (12 L/min), auxiliary gas flow rate (1 L/min), sample flow rate (1.2), peristaltic pump rate (12 rpm) for sample introduction into the nebulizer, and sample uptake delay (55 s) were used. The concentrations were estimated for three replicates of the sample.
3 Results and discussion
3.1 Optimization of LIBS experimental parameters.
Prior to carrying out elemental analysis of RR, the LIBS system was optimized for the right laser pulse energy and excitation acquisition delay time in order to ensure the establishment of local thermodynamic equilibrium (LTE) of the laser induced plasma, and also to steer clear of the hot continuum plasma emission. In the laser-induced plasma, the mass ablation from the sample increases with the laser pulse energy, and at particular pulse energy at the higher side, the mass ablation is so large that the resulting LIBS signal gets saturated, or even becomes smaller due to plasma shielding. On the contrary, when the laser pulse energy is below certain value, the plasma density is so low that sufficient electron density is not generated to establish LTE condition. Hence, the optimum value of laser pulse energy is important to carry out the quantitative elemental analysis using LIBS in general and CF-LIBS in particular. Also, the plasma created by the pulsed laser has a temporal evolution, with chaotic hot plasma with the high emission intensity at the early stage, and its luminous intensity gradually tailing off to zero. At a particular duration, after the excitation, the plasma condition is so conducive that the most decipherable emission from neutral and atomic species with optimum signal intensity can be recorded [34]. Fig. 3a and b depict the delay time optimization for the elemental analysis of RRs. For this, the emission spectra of the persistent lines of the most abundant Ca-I (422.6 nm) and K-1 (766.4 nm) atomic transitions were recorded with varied time delays at a regular interval of 50 ns excitation-acquisition delay. It was found that the optimum time delay for Ca-I (422.6 nm) and K-1 (766.4 nm) atomic transitions were 350 ns and 400 ns respectively. Every atomic transition has a different transition probability (Einstein A coefficient) and lifetime; hence, in the laser-induced plasma, the fluorescence decay profile of each atomic transition is different. For this reason, the optimum time delay is different for different atomic transitions. Hence, we have carried out such optimization of time day for every identified elements and we found the optimum time delay is around 380 ns. For the pulse energy optimization, the LIBS intensities of Ca-I (422.6 nm) and K-1 (766.4 nm) atomic transitions were recorded at different laser pulse energies with 5 mJ/pulse increment at the respective optimum time delays, and the results are shown in Fig. 4a and 4b. It is quite clear from Fig. 4 that the LIBS signal from both the transitions saturates beyond the pulse energy of 25 mJ/pulse; thus, 25 mJ/pulse was ascertained as the optimum excitation energy at our experimental conditions. This saturation could be attributed to the shielding of the incident laser beam by the high intense plasma to reach RRs surface for ablation (plasma shielding), due to increased electron number density [35,36], and also due to the increased self-absorption of the emitted atomic lines by the intense plasma. In high-density plasma, the sharp electron temperature and density gradients tend the transition lines of ground lower state (resonant line) or close to it to get broadened and quenched, and this effect becomes more prominent as the elemental concentration [37–39] or the laser irradiance increases [40].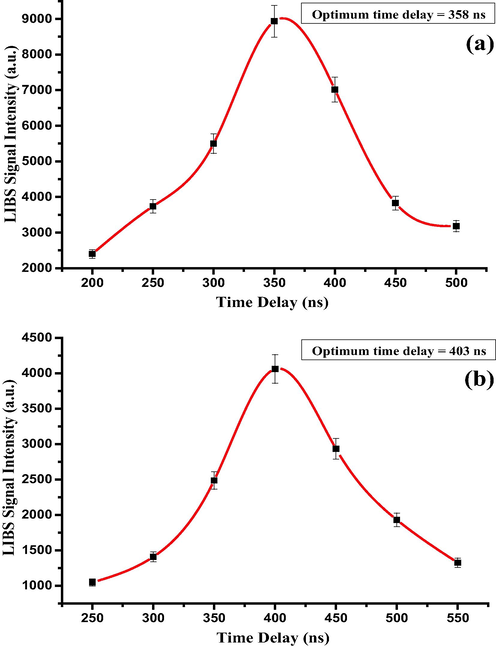
The influence of time delay variation on LIBS signal intensities using neutral atomic (a) Ca and (b) K lines at wavelengths 422.6 nm and 766.4 nm, respectively.
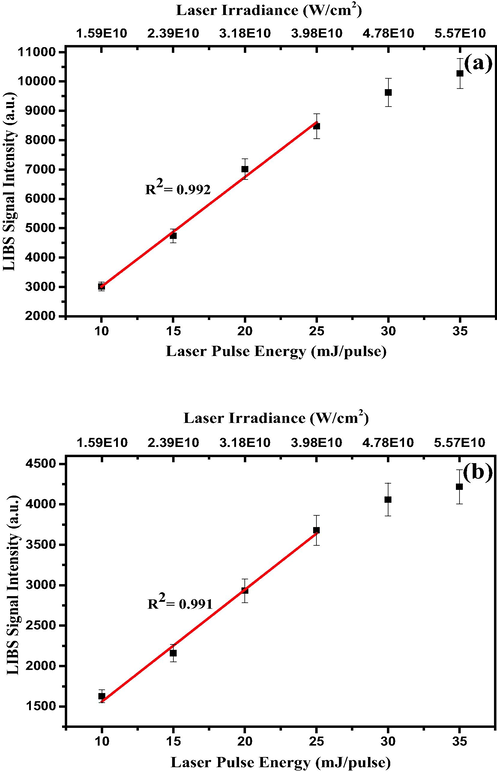
Variation in LIBS signal intensities of (a) Ca I and (b) K I lines at 422.6 nm and 766.4 nm, respectively, with laser excitation energy.
3.2 Measurements of laser-induced plasma (LIP) parameters for the verification of local thermodynamic equilibrium
In LIBS analysis, the quantification of the detected elements is accurate and reliable when the self-absorption (the absorption of the emitted radiation by the plasma medium) is significantly reduced. That happens only when the constituents of plasma obey the classical Boltzmann distribution, and this condition in the parlance of plasma physics is called local thermodynamic equilibrium (LTE), and, under this condition, the plasma is optically thin [41,42]. In order for the plasma to achieve this thermodynamic condition, the plasma temperature and the electron number density play a crucial role, which is governed by McWhirter criterion [36,43]. The number distribution in different upper energy levels of an atom at a given temperature is given by Boltzmann distribution, and the observed emission intensity of a particular atomic transition is proportional to the number density in the upper energy levels of that transition. Therefore, from the experimentally measured emission intensities of various transitions of one particular element and with the knowledge of the energies of their respective upper levels, the plasma temperature can be deduced. In order to estimate the plasma temperature, the Boltzmann distribution is transformed into a linear form in such a way that the natural logarithm of the intensity containing variables is plotted against the energies of the upper states of the atomic transitions under consideration. Therefore, it is quite obvious that the slope of such plot is the reciprocal of kT, from which the unique plasma temperature can be estimated, and it should be noted that all the atomic species in the plasma have same temperature [36,44].
Fig. 5 depicts the linear Boltzmann plot for neutral calcium atom, using Ca-I (428.9 nm), Ca-I (430.7 nm), Ca-I (442.5 nm), Ca-I (527.0, nm), Ca-I (422.6 559.4 nm), Ca-I (585.7 nm), Ca-I (612.2 nm), and Ca-I (649.3 nm) atomic transition lines, where the basic spectroscopic data was taken from NIST [45], which are presented in Table 1. The reason for choosing Ca-I atomic transitions for the plasma temperature estimation is that, in RR sample, there are many Ca-I transition lines in the 200–900 nm spectral region. However, the strong Ca-I (422.6 nm) atomic transition was deliberately excluded, as it is prone to more self-absorption [46]. Also, care was taken only to choose the transition lines, whose upper energy levels are well separated, whose emission intensities are quite accurate and reliable, and the ones that are not susceptible to self-absorption [36,38]. The plasma temperature deduced from the linear Boltzmann plot is 8630 ± 550 K, with a good linear fit (R2 = 0.984), and the uncertainty in the temperature measurement is mainly due to the uncertainty in the LIBS intensity measurements. In addition to Ca-I transition lines, we also used Fe-I transition lines to estimate the plasma temperature, as shown in Fig. 5. The values are in agreement with the one estimated using Ca-I lines.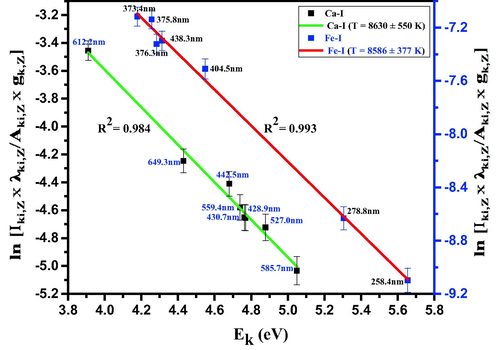
Boltzmann plot based on several Ca I and Fe I lines, recorded for Rhatany roots samples. The red and green lines represent the best linear fit of the data. The wavelength of each line is also indicated.
Wavelength (nm)
Element
Signal Intensity
Configurations
Statistical weight
Transition probability
Aik ×10 8(S−1)Energy of the upper level
gi
gk
Ei
(eV)Ek
(eV)
428.9
Ca I
3996
3p64s4p 3Po0
3p64p2 3P1
1
3
0.6
1.879
4.769
430.7
Ca I
4405
3p64s4p 3Po1
3p64p2 3P0
3
1
1.99
1.885
4.763
442.5
Ca I
4101
3p6 4s4p 3Po0
3p6 4s4d 3D1
1
3
0.498
1.879
4.68
527.0
Ca I
4212
3p6 3d4s 3D3
3p63d4p 3Po2
7
5
0.5
2.526
4.878
559.4
Ca I
3483
3p6 3d4s 3D2
3p63d4p 3Do2
5
5
0.38
2.523
4.739
585.7
Ca I
3670
3p6 4s4p 1Po1
3p6 4p2 1D2
3
5
0.66
2.933
5.049
612.2
Ca I
4440
3p6 4s4p 3Po1
3p6 4s5s 3S1
3
3
0.287
1.886
3.91
649.3
Ca I
4851
3p63d4s 3D1
3p63d4p 3Fo2
3
5
0.44
2.521
4.43
The second important plasma parameter require to verify the LTE condition is the electron number density, which can be obtained from the FWHM of the Stark broadened peak, due to the electric field in plasma, acting upon the emitting atomic species. In addition to Stark broadening, the emission lines are subjected to Doppler broadening, and the instrumental broadening. The Stark broadening is Lorentzian and instrumental broadening is Gaussian in shape. Fig. 6 is the Ca-I (612.2 nm) atomic transition line, showing a good Lorentzian fit, which clearly indicates that the combined contribution of Doppler broadening and instrument broadening is quite marginal compared to Lorentzian broadening. Hence, line broadening observed in Fig. 6 is predominantly due to the Stark broadening mediated by the electron cloud in the plasma medium, and FWHM can be safely used for the estimation of electron number density, as the FWHM of the Stark broadened peak is proportional to the electron number density [35,38,47,48]. FWHM of Ca-I (612.2 nm) atomic transition is around 0.051 nm (Fig. 6), which corresponds to the electron number density of 4.5 × 1016 cm−3 using the formula given in the literature [33,35]. While doing so, we considered only the electrons' contribution in the collisional interaction with the atoms or ions [35,38,47], owing to their relatively higher velocities compared to singly ionized atoms [49]. The electron impact parameter used for the estimation of electron density is 0.057 Å [38,50]. The lower limit of the number density for the LTE condition, determined by McWhirter criterion was calculated from the plasma temperature and the energy difference between the higher and lower levels of Ca-I (612.2 nm) atomic transition and this value is 1.23 × 1015 cm−3. It is quite obvious that the electron density estimated in the laser induced plasma of RRs (4.5 × 1016 cm−3) is higher than the lower limit of the electron number density (1.23 × 1015 cm−3) for LTE stipulated by McWhirter criterion. This ensures that the laser induced RRs plasma is in LTE condition, and because of which the self-absorption is minimal. Hence, the atomic emission line intensities can be used for a reliable quantification of detected elements in the RRs sample [35].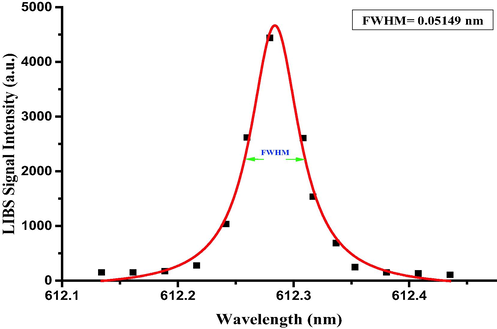
Lorentzian-fitted line profile of Ca I line at 612.2 nm corresponding to the transition configuration of (p6 4s4p 3Po1
3p6 4s5s 3S1).
3.3 Qualitative analysis of the elemental constituents of Rhatany roots samples using LIBS
Having established the optimized LIBS detection system with the favorable LTE condition, the unambiguous qualitative and quantitative elemental analysis can be carried out using the characteristic atomic emission lines of neutral and singly ionized atomic species. The LIBS spectra of RRs samples were recorded in the ambient conditions by taking the average of 25 spectra accumulations from 5 arbitrary sites on the sample surface, which was another precaution for further LIBS signal improvement and hence signal-to-noise (S-N) ratio enhancement. The LIBS spectra of RRs in 245–350 nm, 385–555 nm, and 580–780 spectral regions are presented in Figs. 7–9, respectively, with the elemental assignments based on the NIST database and where the sharp well resolved Lorentzian peak profiles of the many atomic transitions are evident. Moreover, during the data acquisition, the sample was constantly moved in the X and Y directions in order to minimize the signal fluctuation due to inhomogeneity and to avoid laser induced deep crater formation on the sample surface. The LIBS spectra in Figs. 7–9 show the prescence of the neutral and singly-ionized transition lines of Ca, K, Mg, S, Si, Al, Fe, P, Na, Ba, Ti, Mn, B, Cu, Cd, Pb, and Zn in RRs samples in different emission intensities. The detected neutral and singly ionized elements, their characteristic atomic emission wavelengths, and their recorded LIBS intensities, along with key spectroscopic parameters are listed in Table 2, from which it is quite clear that the presence of Ca is quite predominant followed by K, and Mg. The wavelength positions of certain elements such as Se and S coincide with other emission wavelength, and this uncertainty was eliminated by substantiating their presence with XPS spectra, described in a subsequent section. *ND – Not detected.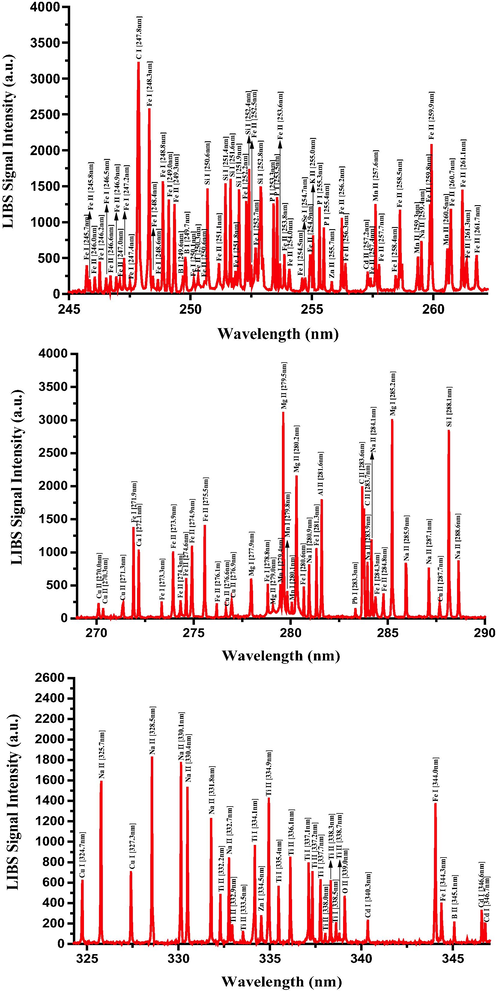
Typical LIBS spectra of the dried RRs in the 245 nm to 350 nm spectral range.
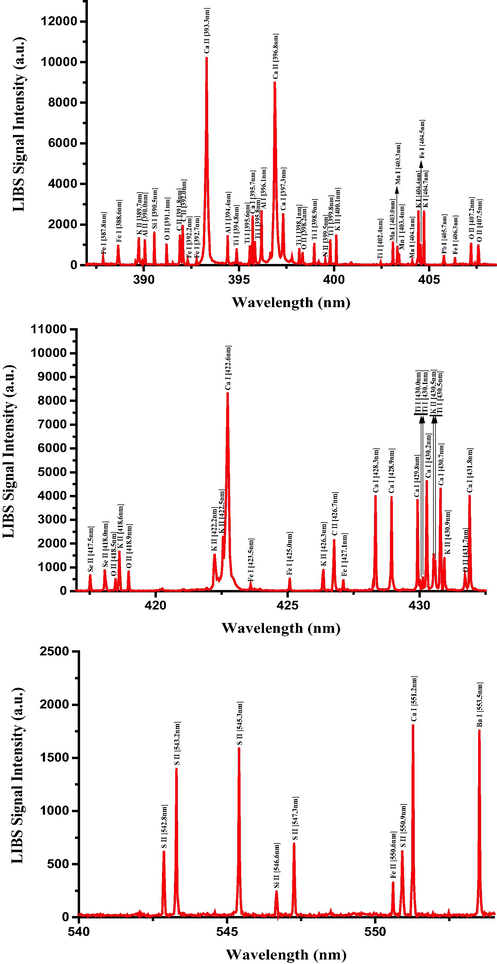
Typical LIBS spectra of the dried RRs in the 385 nm to 555 nm spectral range.
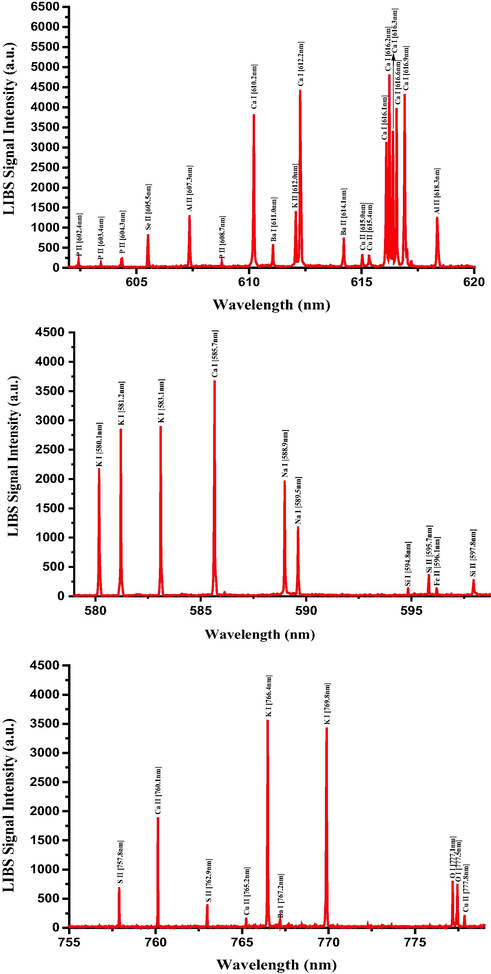
Typical LIBS spectra of the dried RRs in the 580 nm to 780 nm spectral range.
Elements
Wavelength (nm)
Transition Configuration
LIBS Signal Intensity (a.u.)
ICP-OES concentration (mg/kg)
Ca
393.3
3p64s 2S1/2
3p64p 2Po3/2
10,248
24,168
396.8
3p64s 2S1/2
3p64p 2Po1/2
9038
370.6
3p64p 2Po1/2
3p65s 2S1/2
3517
422.6
3p64s2 1S0
3p64s4p 1P°1
8355
445.4
3p6 4s4p 3Po2
3p6 4s4d 3D3
5023
616.2
3p6 4s4p 3Po2
3p6 4s5s 3S1
4815
643.9
3p63d4s 3D3
3p63d4p 3Fo4
5541
K
404.7
3p6 4s 2S1/2
3p6 5p 2P°1/2
2686
2281
766.4
3p6 4s 2S1/2
3p6 4p 2P°3/2
3565
769.8
3p6 4s 2S1/2
3p6 4p 2P°1/2
3436
Mg
279.5
2p6 3s 2S1/2
2p6 3p 2P°3/2
3121
1150
280.2
2p6 3s 2S1/2
2p6 3p 2P°1/2
2163
285.2
2p6 3s2 1S0
3s3p 1P°1
3012
S
543.2
3s23p2(3P) 4s 4P3/2
3s23p2(3P) 4p 4Do5/2
1405
716
545.3
3s23p2(3P) 4s 4P5/2
3s23p2(3P) 4p 4Do7/2
1598
563.9
3s23p2(3P) 4s 2P3/2
3s23p2(3P) 4p 2Do5/2
737
Si
251.6
3s23p2 3P2
3s23p4s 3Po2
1598
661
252.4
3s23p2 3P1
3s23p4s 3Po0
1734
288.1
3s23p2 1D2
3s23p4s 1Po0
2851
Al
281.6
3s3p 1Po1
3s4s 1S0
1804
609
394.4
3s23p 2Po1/2
3s24s 2S1/2
1468
396.1
Fe3s23p 2Po3/2
3s24s 2S1/2
2690
Fe
248.3
3d6 4s2 5D4
3d6(5D)4s4p (1Po) 5F°5
2580
573
259. 9
3d6 (5D) 4s 6D9/2
3d6(5D) 4p 6Do9/2
2082
275.5
3d6 (5D) 4s 4D7/2
3d6(5D) 4p 4Fo9/2
1413
373.4
3d7 (4F) 4s 5F5
3d7(4F) 4p 5Fo5
2155
404.5
3d7 (4F) 4s 3F4
3d7(4F) 4p 3Fo4
1052
P
253.5
3s23p3 2Po3/2
3s23p2(3P) 4s 2P3/2
1344
258
255.3
3s23p3 2Po1/2
3s23p2(3P) 4s 2P1/2
1202
Na
328.5
2s2 2p5 3s 1Po1
2s2 2p5 3p 1D2
1833
136
588.9
2p6 3s 2S1/2
2p6 3p 2Po3/2
1958
589.5
2p6 3s 2S1/2
2p6 3p 2Po1/2
1175
Ba
553.5
6s2 1S0
6s6p 1Po1
1766
93
614.1
5d 2D5/2
6p 2Po3/2
750
Ti
334.9
3d2 (3F) 4s 4F9/2
3d2(3F) 4p 4Go11/2
1430
26
365.3
3d24s2 3F4
3d2(3F) 4s4p (1Po) 3Go5
1231
398.9
3d24s2 3F3
3d2(3F) 4s4p (1Po) 3Fo3
1093
399.8
3d24s2 3F4
3d2(3F) 4s4p (1Po) 3Fo4
1259
Mn
403.0
3d54s2 6S5/2
3d5(6S) 4s4p (3P°) 6Po7/2
1167
20
257.6
3d5(6S)4s 7S3
3d5(6S) 4p 7Po4
1247
259.3
3d5(6S)4s 7S3
3d5(6S) 4p 7Po3
515
Se
418.0
4s2 4p2 (3P) 5p 4Do7/2
4s2 4p2 (3P) 5d 4F9/2
909
13
522.7
4s2 4p2 (3P) 5 s 4P5/2
4s2 4p2 (3P) 5p 4Do7/2
1021
B
249.6
2s2 2p 2Po1/2
2s2 3s 2S1/2
250
8
249.7
2s2 2p 2Po3/2
2s2 3s 2S1/2
510
345.1
1s2 2s2p 1Po1
1s2 2p2 1D2
220
Cu
324.7
3d10(1S) 4s 2S1/2
3d10(1S) 4p 2P°3/2
626
7
327.3
3d10(1S) 4s 2S1/2
3d10(1S) 4p 2P°1/2
712
Cd
340.3
4d10 5s5p 3Po0
4d10 5s5d 3D1
237
7
346.7
4d10 5s5p 3Po1
4d10 5s5d 3D1
200
Pb
405.7
6s2 6p2
6s2 6p7s
490
6
Zn
255.7
3d104p 2Po3/2
3d10 5s 2S1/2
170
5
334.5
3d10 4s4p 3Po2
3d10 4s4d 3D3
282
Cr
–
–
ND*
ND*
The medicinal and health benefits of the nutritional elements and the health hazards of the toxic elements present in RRs sample are discussed below. The benefits of Ca to human health in general and bone health in particular are well established [51,52]. The well-known astringent nature of RRs can be rationalized from the property of the predominant Ca 2+ in boosting the essential FVIII protein involved in the intrinsic blood clotting mechanism [51–53]. Ca also assists 2-(2,4-dihydroxyphenyl)-5-(E)-propenylbenzofuran (DPPB), a lignan in RRs, in the activation of endothelial nitric oxide synthase (eNOS), which mediates the vasoprotective action in the vein endothelial cells [8]. Phosphorus (P) is another essential nutritional element, which in conjunction with Ca to produce hydroxyapatite (HAp) in bones and teeth for their stiff and inflexible structure. Magnesium (Mg) also plays an important role in reducing the risk of developing some of the severe cardiovascular complications [54]. Sodium and Potassium (through Na+/K+-ATPase transporter-enzyme) govern the balance of the fluid and electrolytes distribution over both sides of the semi-permeable cell membrane. Iron is a nutrient element that exists primarily in red blood cells as an oxygen transporter [52].
Sulfur (S) is a component of the glutathione (GSH), a cysteine (amino acid) derivative, which is considered as noticeable antioxidant opposing the oxidative stress of reactive oxygen species (ROS) [55]. Krameria triannda roots could provide the precursors of GSH that together, with their contained antioxidant neolignans [13], could reinforce the defense of the human body cells against photo-damage to the skin. Selenium (Se) is a component of the enzymes, namely Glutathione peroxidases (Gpxs), which are the most important antioxidants in the human body [56]. The researchers [57] suggested suitable antioxidants, i.e., GSH-GPx, as a relevant cure for acne. Improving the condition of acne vulgaris was also reported in patients given a daily supplemental combination contained sodium selenite for 12 weeks [58]. Krameria triandra roots, as selenium supplement, could act productively with neolignan derivatives from the Krameria extract to help in treating acne, as a formulation extract mixture of Krameria triandra and Mesua ferrea highly recommended for curing acne lesions [11]. In addition, the antiinflammatory impacts of the Krameria lappacea root extract due to its isolated pure compounds (lignans) were in vivo and in vitro found promising to alleviate the oropharyngeal inflammations [9]. The anti-inflammatory potency of selenium was also confirmed for the gastrointestinal tract (GI) [59].
Silicon (Si) is a beneficial nutritional element that is bioavailable in the human body in the form of silicic acid [60]. Silicon is needed for the formation of the extracellular matrix (ECM) in different connective tissues. Si also can act as an impediment of aluminum (Al) toxicity through the GI tract [61]. It was reported that silicon content in the body contributes to the fast healing wound [62]. Also, vasoprotection activity established in DPPB lignan in Rhatany roots [8] could also be reliant on the high amount of Si in these roots due to considerable increase of the eNOS enzyme in the vascular endothelium of mice with an elevated incidence of developing vascular dysfunction after drinking water supplemented with silicic acid [63].
Some elements observed in dried roots samples such as Aluminum (Al), Barium (Ba), and Titanium (Ti), Cadmium (Cd), and Lead (Pd) have no evident involvement in the biological processes in the human body. Although iron, which is abundant in RRs, and phosphates as constituents of our daily diet, reportedly help to decrease the gastrointestinal uptake of Al, Al concentration in RRs is more than the weekly permissible dosage, which is 2 mg/kg [64]. Despite the soluble and bioavailable barium compounds are less-common or even rare, Ba concentration in RRs exceeds the EPA’s oral safe permissible limit of 0.2 mg/kg/day for adults [65]. As a result, Al and Ba are considered toxic in RRs and the traditional therapeutic uses of RRs should be restricted to cure skin illnesses and delineated by a low-dose and brief-time period exposure. Ti element is naturally found as titanium dioxide (TiO2). The orally administered fine (>100 nm)-TiO2 particles are weakly soluble and low toxic compared to nano (<100 nm)-TiO2 particles [66,67]. Since most minerals of TiO2 exist in soil having a 53–125 µm diameter-size [68], the microscaled-TiO2 particles in the plants are poorly soluble by the GI tract, which could then lessen any related detrimental health effects. Out of six nanoscaled-TiO2 particles with different diameter-sizes (up to 400 nm), only two particles (<33 nm) stimulated inflammation in the cell of the skin epidermis [69]. Moreover, only 0.19 percent of the nanoscaled-TiO2 particles in a kind of sunscreens (primary particle size: ≥ 20 nm) after 24 h reached the epidermis/dermis layers [70]. Therefore, the microscaled-TiO2 particles in the RRs have no interference with the skin therapeutic usefulness of RRs. Cd and Pb elements in RRs below 8 mg/kg are implied as toxic elemental constituents as their daily tolerable intake are 0.88 and 3 µg/kg-b.w., respectively [71]. With the knowledge of the elemental analysis carried out by LIBS, a good research platform in pharmacology can be established to investigate more on this age old and time tested wonder medicinal plant to put an effective use for human health and wellbeing backed by studies that are more scientific.
3.4 CF-LIBS quantification method
In the CF-LIBS, the quantification of the identified elements was carried out from the y intercept of the linear Boltzmann plot, from which basically the number of each ionic species can be deduced [28–30]. As the plasma is in the LTE condition, the stoichiometry of the ablated plasma should be same as that of the target material and under this condition, the Boltzmann distribution of a particular specie can be written as in equation 1.
Combining Eqs. (1) and (2) and transform it in to linear form, we get Eq. (3).
Plotting the term on the left hand side of Eq. (3) against the energy of the upper state (Ek), we can estimate the common plasma temperature from the slope and importantly the
from the y intercept of the plot (
) and the partition function
of that specie as in equation 4.
Elements detected in Rhatany roots samples
Comparison of LIBS and ICP, and RA
RSD (%)
CF-LIBS
mg/kg
ICP
mg/kg
RA
Ca
24,120
24,168
0.08
1.58
K
2272
2281
0.39
1.87
Mg
1162
1150
43.0
2.14
S
701
716
0.42
2.47
Si
649
661
0.47
2.94
Al
621
609
0.46
2.85
Fe
577
573
0.09
2.97
P
265
258
0.48
3.24
Na
129
136
0.49
3.42
Ba
97
93
0.31
3.53
Ti
31
26
0.49
5.20
Mn
23
20
0.37
5.40
Se
15
13
0.32
5.48
B
7.8
8
0.03
5.68
Cu
7.9
7
0.09
5.52
Cd
7.2
7
0.03
5.62
Pb
6.5
6
0.06
5.61
Zn
6.1
5
0.22
5.70
3.5 Validation of LIBS analysis by ICP OES
The validation of qualitative and quantitative analysis using CF-LIBS was performed by comparing the LIBS results with the elemental analysis carried out by standard ICP OES. The ICP OES elemental analysis for the dried RRs was performed adopting the standard procedure, described in the experimental section and the detected elements and their respective concentrations by this technique are listed next to the LIBS results in Table 3 in the descending order of concentration. It is quite clear from the Table 3 that ICP OES confirm all the elements recorded in the LIBS analysis and more importantly, the concentrations of the detected elements in RRs from both CF- LIBS and ICP OES are in a good agreement.
Two figures of merit, the relative accuracy (RA), and the relative standard deviation (RSD) were used to validate the accuracy and reliability of LIBS analysis of RRs sample. The relative accuracy reveals the extent of accuracy of LIBS measurements with respect to the standard values, which in our case are ICP OES measurements. The relative accuracy (RA) in equation 7 relates the quantitative difference (d) between the concentrations measured using LIBS and the same measured by ICP OES, the standard deviation (σ) in n number of LIBS measurements, with the t value at 2.5% error confidence (t0.975) in the tail of normal distribution curve, and the corresponding standard concentration M from ICP OES.
The relative accuracy of each LIBS elemental concentrations listed in Table 3 are in the range of 0.02–0.49, which is quite acceptable for any analytical measurements. Also the repeatability and the reproducibility of LIBS data is expressed in terms of relative standard deviation (RSD), shown in equation 8, which is the ratio of standard deviation (σ) and the mean (X) of n measurements expressed in percentage.
The RSD in the LIBS measurement is between 1.58 and 5.70%, which is quite acceptable.
3.6 XPS analysis of dried Rhatany roots
The elemental analysis of dried RRs was carried out by XPS and the high-resolution XPS spectra of all the detected elements (C, Al, Ca, Mn, N, Na, O, P, S, Se, Si and Zn), at their characteristic binding energies are shown in Fig. 10 with the marking of their respective atomic states. All the elements detected by XPS in RRs sample are qualitatively in agreement with the elements detected by LIBS. However, some elements with low concentration in RR are not present in XPS characterization, due to its inherent lower sensitivity. In the case of calcium, the neighboring peaks at 347.4 and 350.9 eV are respectively from Ca 2p3/2 and Ca 2p1/2 atomic states. Particularly, XPS analysis substantiated LIBS results in the case of certain ambiguous elements such as Se and S, as these two elements in LIBS spectrum overlaps with the emission wavelength of other elements. Although the primary analytical method that has been used for the qualitative and quantitative elemental analysis for this work is the LIBS system, under optimized plasma condition (local thermodynamic equilibrium), the purpose of using XPS is to verify the elemental composition, particularly for the elements in RRs, whose emission wavelengths overlap with that of other elements in the NIST data. XPS is the analysis based on X-ray photoelectric effect for elemental analysis of the sample with the characteristic binding energy of the elements (except hydrogen and helium), hence validating the LIBS results with a technique like XPS, and with an entirely different principle is quite reliable. However, in XPS, the elemental binding energy and the peak intensity of a particular element depend on the chemical environment of the atom, like the atom to which it is bonded to, and this apparently positive feature of XPS restricts its application for the absolute elemental quantification [72,73].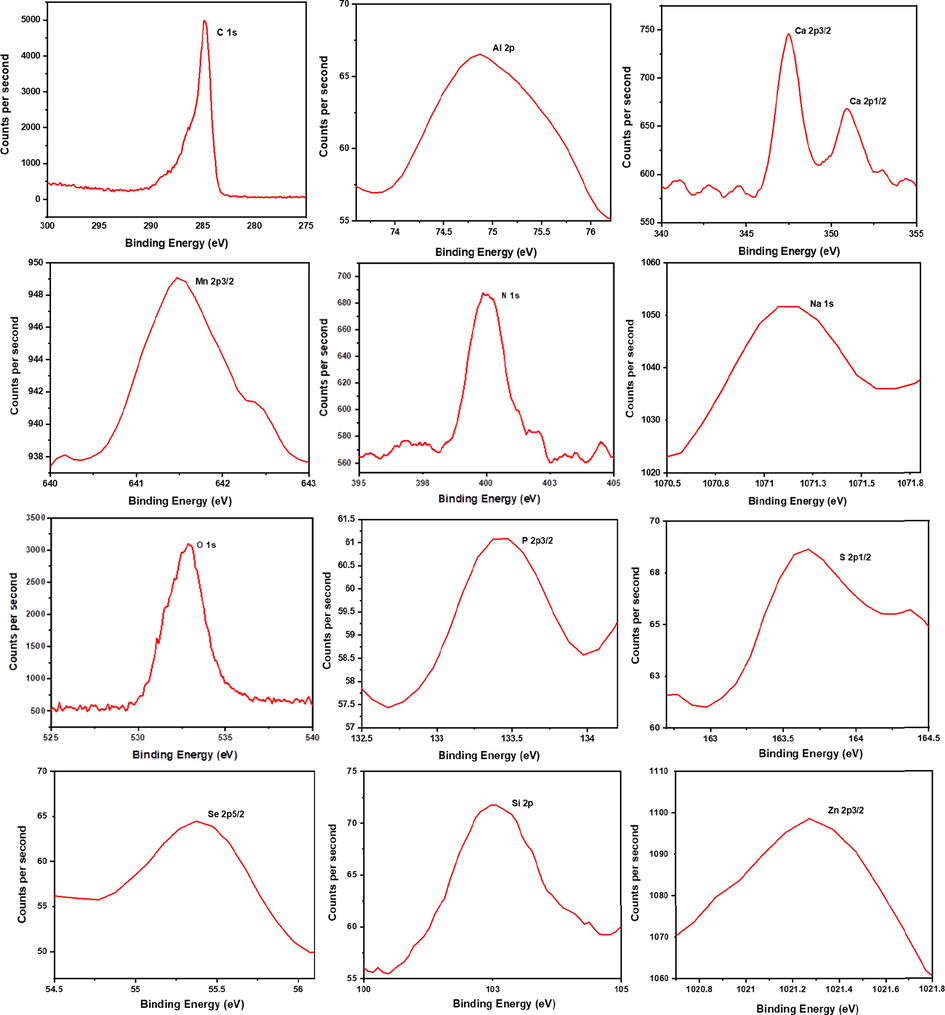
High-resolution XPS analysis of C, Al, Ca, Mn, N, Na, O, P, S, Se, Si and Zn in dried Rhatany roots.
4 Conclusion
CF-LIBS was applied for the elemental analysis of medicinal Rhatany root, without any calibration standards or methods. In order to acquire a reliable quantification, the LIBS system was experimentally optimized to establish local thermodynamic condition and optically thin plasma, which ensure less self-absorption by plasma, which ensures a reliable elemental analysis by LIBS. Many nutritional and pharmacologically active elements, along with a trace level of hazardous elements were detected using LIBS system. The quantitative and qualitative elemental analysis by CF-LIBS were substantiated by the ICP OES technique to a good level of accuracy and qualitatively concurred by X-ray photoelectron spectroscopy. The abundant calcium in RRs, credibly enlighten the effective and established role of calcium ion in mediating the unique astringent properties of RRs, which makes this medicinal plant one of the most sought after for centuries. The results of this study can pave a way for more pharmacological research on RRs, which has many times tested therapeutic properties.
Acknowledgements
The authors are thankful to KFUPM for supporting this work under project # RG 181001.
Declaration of interest statement
The authors declare no competing interests and all authors are aware of the submission and agree to its publication in Arabian Journal of Chemistry.
References
- The past and present uses of rhatany (Krameria, Krameriaceae) Econ. Bot.. 1991;45(3):397-409.
- [CrossRef] [Google Scholar]
- Parasitism and haustorium anatomy of Krameria lappacea (Dombey) Burdet & BB Simpson (Krameriaceae), an endangered medicinal plant from the Andean deserts. J. Arid Environ.. 2012;83:94-100.
- [CrossRef] [Google Scholar]
- Encyclopedia of Herbs and their uses. London: Dorling Kindersley; 1995.
- Medicinal plants of the world (revised ed.). Wallingford: CABI; 2018.
- Proanthocyanidins from Krameria triandra root. Planta Med.. 1989;55(4):379-384.
- [CrossRef] [Google Scholar]
- Quantitative analysis of anti-inflammatory lignan derivatives in Ratanhiae radix and its tincture by HPLC–PDA and HPLC–MS. J. Pharmaceut. Biomed. Anal.. 2011;56(3):546-552.
- [CrossRef] [Google Scholar]
- Ratanhiaphenol III from Ratanhiae radix is a PTP1B inhibitor. Planta Med.. 2012;78(7):678.
- [CrossRef] [Google Scholar]
- 2-(2, 4-dihydroxyphenyl)-5-(E)-propenylbenzofuran promotes endothelial nitric oxide synthase activity in human endothelial cells. Biochem. Pharmacol.. 2012;84(6):804-812.
- [CrossRef] [Google Scholar]
- Lignan derivatives from Krameria lappacea roots inhibit acute inflammation in vivo and pro-inflammatory mediators in vitro. J. Nat. Prod.. 2011;74(8):1779-1786.
- [CrossRef] [Google Scholar]
- Antibacterial activity of some Peruvian medicinal plants from the Callejon de Huaylas. J. Ethnopharmacol.. 2002;79(1):133-138.
- [CrossRef] [Google Scholar]
- Bombardelli, E., Morazzoni, P., Cristoni, A., Seghizzi, R., 2002. U.S. Patent No. 6,475,536. Washington, DC: U.S. Patent and Trademark Office.
- A rapid screening by liquid chromatography/mass spectrometry and fast-atom bombardment tandem mass spectrometry of phenolic constituents with radical scavenging activity, from Krameria triandra roots. Rapid Commun. Mass Spectrom.. 1997;11(12):1303-1308.
- [Google Scholar]
- Antioxidant and photoprotective activity of a lipophilic extract containing neolignans from Krameria triandra roots. Planta Med.. 2002;68(03):193-197.
- [CrossRef] [Google Scholar]
- Rapid elemental analysis and provenance study of Blumea balsamifera DC using laser-induced breakdown spectroscopy. Sensors. 2015;15(1):642-655.
- [CrossRef] [Google Scholar]
- Spectral analysis of Miracle Moringa tree leaves using X-ray photoelectron, laser induced breakdown and inductively coupled plasma-optical emission spectroscopic techniques. Talanta. 2020;121062
- [CrossRef] [Google Scholar]
- Laser induced breakdown spectroscopy methods and applications: A comprehensive review. Radiat. Phys. Chem.. 2020;170:108666
- [CrossRef] [Google Scholar]
- Laser-induced breakdown spectroscopy for human and animal health: a review. Spectrochim. Acta B. 2019;152:123-148.
- [CrossRef] [Google Scholar]
- A review of laser-induced breakdown spectroscopy for analysis of geological materials. Appl. Spectrosc. Rev.. 2015;50(1):1-26.
- [CrossRef] [Google Scholar]
- LIBS coupled with ICP/OES for the spectral analysis of betel leaves. Appl. Phys. B-Lasrs O.. 2018;124(5):76.
- [CrossRef] [Google Scholar]
- Recent advances and future trends in LIBS applications to agricultural materials and their food derivatives: an overview of developments in the last decade (2010–2019). Part II. Crop plants and their food derivatives. TrAC. Trend. Anal. Chem.. 2019;118:453-469.
- [CrossRef] [Google Scholar]
- Laser-induced breakdown spectroscopy as a promising tool in the elemental bioimaging of plant tissues. TrAC, Trend Anal. Chem.. 2020;122:115729
- [CrossRef] [Google Scholar]
- In-situ monitoring of chromium uptake in different parts of the wheat seedling (Triticum aestivum) using laser-induced breakdown spectroscopy. Spectrosc. Lett.. 2014;47(7):554-563.
- [CrossRef] [Google Scholar]
- Silicon-mediated alleviation of Cr (VI) toxicity in wheat seedlings as evidenced by chlorophyll florescence, laser induced breakdown spectroscopy and anatomical changes. Ecotoxicol. Environ. Saf.. 2015;113:133-144.
- [CrossRef] [Google Scholar]
- LIB spectroscopic and biochemical analysis to characterize lead toxicity alleviative nature of silicon in wheat (Triticum aestivum L.) seedlings. J. Photochem. Photobiol. B. 2016;154:89-98.
- [CrossRef] [Google Scholar]
- Quantitative analysis of cadmium in tobacco roots using laser-induced breakdown spectroscopy with variable index and chemometrics. Front. Plant Sci.. 2018;9:1316.
- [CrossRef] [Google Scholar]
- Mapping of the spatial distribution of silver nanoparticles in root tissues of Vicia faba by laser-induced breakdown spectroscopy (LIBS) Talanta. 2017;173:28-35.
- [CrossRef] [Google Scholar]
- Improving the accuracy of spectroscopic identification of geographical origins of agricultural samples through cooperative combination of near-infrared and laser-induced breakdown spectroscopy. Spectrochim. Acta B. 2018;149:281-287.
- [CrossRef] [Google Scholar]
- New procedure for quantitative elemental analysis by laser-induced plasma spectroscopy. Appl. Spectrosc.. 1999;53(8):960-964.
- [CrossRef] [Google Scholar]
- A numerical study of expected accuracy and precision in calibration-free laser-induced breakdown spectroscopy in the assumption of ideal analytical plasma. Spectrochim. Acta B. 2007;62(12):1287-1302.
- [CrossRef] [Google Scholar]
- Application of calibration-free laser-induced breakdown spectroscopy to radially resolved spectra from a copper-based alloy laser-induced plasma. Spectrochim. Acta B. 2009;64(7):685-689.
- [CrossRef] [Google Scholar]
- Detection of the level of fluoride in the commercially available toothpaste using laser induced breakdown spectroscopy with the marker atomic transition line of neutral fluorine at 731.1 nm. Opt. Laser Technol.. 2014;57:32-38.
- [CrossRef] [Google Scholar]
- Determination of carcinogenic fluorine in cigarettes using pulsed UV laser-induced breakdown spectroscopy. Appl. Opt.. 2015;54(17):5560-5567.
- [CrossRef] [Google Scholar]
- Direct spectral analysis and determination of high content of carcinogenic bromine in bread using UV pulsed laser induced breakdown spectroscopy. J. Environ. Sci. Health B. 2016;51(6):358-365.
- [CrossRef] [Google Scholar]
- LIBS for the detection of lead in ready to use henna paste and nutrients in fresh henna leaves and cultivated soils. Talanta. 2019;199:203-211.
- [CrossRef] [Google Scholar]
- Temporal and spatial behavior of electron density and temperature in a laser-produced plasma from YBa2Cu3O7. Appl. Spectrosc.. 1998;52(3):449-455.
- [CrossRef] [Google Scholar]
- A procedure for correcting self-absorption in calibration free-laser induced breakdown spectroscopy. Spectrochim. Acta B. 2002;57(2):339-353.
- [CrossRef] [Google Scholar]
- Handbook of laser induced breakdown spectroscopy (first ed.). England: John Wiley & Sons Ltd.; 2006.
- Laser Ablation. In: Singh J.P., Thakur S.N., eds. Laser Induced Breakdown Spectroscopy. Amsterdam: Elsevier; 2007. p. :49-82.
- [Google Scholar]
- Laser-induced breakdown spectroscopy (second ed.). New York: Elsevier; 2020.
- Laser-induced breakdown spectroscopy (LIBS), part I: review of basic diagnostics and plasma–particle interactions: still-challenging issues within the analytical plasma community. Appl. Spectrosc.. 2010;64(12):335A-366A.
- [CrossRef] [Google Scholar]
- Local thermodynamic equilibrium in laser-induced breakdown spectroscopy: beyond the McWhirter criterion. Spectrochim. Acta B. 2010;65(1):86-95.
- [CrossRef] [Google Scholar]
- Spectral Intensities. In: Huddlestone R.H., Leonard S.L., eds. Plasma Diagnostic Techniques. New York: Academic Press; 1965. p. :201-264.
- [Google Scholar]
- Influence of irradiation conditions on plasma evolution in laser-surface interaction. J. Appl. Phys.. 1993;74(5):3071-3079.
- [Google Scholar]
- Kramida, A., Ralchenko, Y., Reader, J., NIST ASF Team, 2020. NIST Atomic Spectra Database. v5.8), https://dx.doi.org/10.18434/T4W30F.
- Stark broadening measurements in plasmas produced by laser ablation of hydrogen containing compounds. Spectrochim. Acta B. 2016;122:118-126.
- [CrossRef] [Google Scholar]
- Plasma broadening and shifting of non-hydrogenic spectral lines: present status and applications. Phys. Rep.. 1999;316(6):339-401.
- [CrossRef] [Google Scholar]
- Influence of the optical depth on spectral line emission from laser-induced plasmas. Spectrochim. Acta B. 2001;56(6):619-628.
- [CrossRef] [Google Scholar]
- Deconvolution of Stark broadened spectra for multi-point density measurements in a flow Z-pinch. Rev. Sci. Instrum.. 2011;82(10):103504
- [CrossRef] [Google Scholar]
- Stark broadening parameter tables for neutral calcium spectral lines. II. Serb Astron. J.. 2000;161:39-88.
- [CrossRef] [Google Scholar]
- Prescription for nutritional healing (fourth ed.). New York: Penguin; 2006.
- The importance of mineral elements for humans, domestic animals and plants – a review. Afr. J. Food Sci.. 2010;4(5):200-222. Retrived from
- [Google Scholar]
- Single-molecule nanomechanical spectroscopy shows calcium ions contribute to chain association and structural flexibility of blood clotting factor VIII. Biochem. Biophys. Res. Commun.. 2019;513(4):857-861.
- [CrossRef] [Google Scholar]
- Sources and deficiency diseases of mineral nutrients in human health and nutrition: a review. Pedosphere. 2014;24(1):13-38.
- [CrossRef] [Google Scholar]
- Sulphur-containing amino acids: protective role against free radicals and heavy metals. Curr. Med. Chem.. 2018;25(3):324-335.
- [CrossRef] [Google Scholar]
- Micronutrient selenium: Uniqueness and vital functions. Biophysics. 2019;64(4):510-521.
- [CrossRef] [Google Scholar]
- Production of superoxide anions by keratinocytes initiates P. acnes-induced inflammation of the skin. PLoS Pathog.. 2009;5(7):e1000527
- [CrossRef] [Google Scholar]
- Acne vulgaris, mental health and omega-3 fatty acids: a report of cases. Lipids Health Dis.. 2008;7(1):36.
- [CrossRef] [Google Scholar]
- Effect of selenium deficiency on nitric oxide and heat shock proteins in chicken erythrocytes. Biol. Trace Elem. Res.. 2016;171(1):208-213.
- [CrossRef] [Google Scholar]
- Dietary silicon intake and absorption. Am. J. Clin. Nutr.. 2002;75(5):887-893.
- [CrossRef] [Google Scholar]
- Trace elements in human nutrition (ii) – an update. Int. J. Prev. Med.. 2020;11(1):2.
- [CrossRef] [Google Scholar]
- Silicon deprivation decreases collagen formation in wounds and bone, and ornithine transaminase enzyme activity in liver. Biol. Trace Elem. Res.. 2002;89(3):251-261.
- [CrossRef] [Google Scholar]
- Silicic acid in drinking water prevents age-related alterations in the endothelium-dependent vascular relaxation modulating eNOS and AQP1 expression in experimental mice: an immunohistochemical study. Acta Histochem.. 2013;115(5):418-424.
- [CrossRef] [Google Scholar]
- Systematic review of potential health risks posed by pharmaceutical, occupational and consumer exposures to metallic and nanoscale aluminum, aluminum oxides, aluminum hydroxide and its soluble salts. Crit. Rev. Toxicol.. 2014;44(sup4):1-80.
- [CrossRef] [Google Scholar]
- A review of the health impacts of barium from natural and anthropogenic exposure. Environ. Geochem. Health. 2014;36(4):797-814.
- [CrossRef] [Google Scholar]
- Chen, Z., Han, S., Zhou, S., Feng, H., Liu, Y., Jia, G., 2020. Review of health safety aspects of titanium dioxide nanoparticles in food application. NanoImpact, 100224. https://doi.org/10.1016/j.impact.2020.100224.
- Critical review of public health regulations of titanium dioxide, a human food additive. Integr. Environ. Assess. Manage.. 2015;11(1):10-20.
- [CrossRef] [Google Scholar]
- Characterization of the natural colloidal TiO2 background in soil. Separations. 2018;5(4):50.
- [CrossRef] [Google Scholar]
- Toxicity assessment of six titanium dioxide nanoparticles in human epidermal keratinocytes. Cutan. Ocul. Toxicol.. 2019;38(1):66-80.
- [CrossRef] [Google Scholar]
- Penetration study of formulated nanosized titanium dioxide in models of damaged and sun-irradiated skins. Photochem. Photobiol.. 2012;88(6):1513-1521.
- [CrossRef] [Google Scholar]
- World Health Organization, Food and Agriculture Organization of the United Nations & Joint FAO/WHO Expert Committee on Food Additives. Meeting (73rd: 2010: Geneva, Switzerland), (2011). Evaluation of certain food additives and contaminants: seventy-third [73rd] report of the Joint FAO/WHO Expert Committee on Food Additives. World Health Organization. https://apps.who.int/iris/handle/10665/44515.
- The effect of Cu-doping on CdS thin films deposited by the spray pyrolysis technique. J. Mater Res. Technol.. 2019;8(2):2021-2030.
- [CrossRef] [Google Scholar]
- Fast identification of inorganic and organic gunshot residues by LIBS and electrochemical methods. Forensic Chem.. 2018;8:146-156.
- [CrossRef] [Google Scholar]


