

Translate this page into:
Quick monitoring of coloring agents in highly consumed candies using multivariate calibration
⁎Corresponding author. j.abdelghani@hu.edu.jo (Jafar I. Abdelghani)
-
Received: ,
Accepted: ,
This article was originally published by Elsevier and was migrated to Scientific Scholar after the change of Publisher.
Peer review under responsibility of King Saud University.
Abstract
Multivariate calibration are gaining popularity in assaying food matrices. Partial least squares is a powerful multivariate calibration method that used to build a quantitative relationship between measured variables and a property of interest (i.e., concentration) of the system under study. Partial least squares PLS calibration along with UV/vis spectral data was efficient to account for indirect food matrix and direct interference effects resulted from overlapping food dyes. PLS was able to quantify tartrazine TAT, allura red AR, sunset yellow SY and brilliant black BB that added to wide selection sugar-based candies. The results indicated that 70% of samples containing single dye while 8% containing TAT-SY mix and certain samples containing TAT + SY + AR + BB. Lollypops were found to contain high levels of AR (77–120 mg/kg) and TAT (56–166 mg/kg). The maximum adulteration was 50% observed in lollypops. PLS calibration was workable to predict colorants with prediction errors of 7%. Using PLS, dyes were detected down to 0.1 mg/L with acceptable accuracy and precision. PLS showed comparable performance with liquid chromatography for dyes quantification and can substitute laborious chromatography for quick detection of coloring agents in candies.
Keywords
Food colorants
PLS calibration
Direct/indirect interferences
Food monitoring

1 Introduction
Synthetic colorants are often added to many food stuffs to maintain a natural appearance of processed food that may affect under the harsh processing conditions and to give the desired natural shades for certain foods particularly liquid drinks and sweet candies (Siva et al. 2011; Bayarri et al. 2001; Downham and Collins, 2000). European legislations have approved 15 artificial coloring agent and in certain processed foods including beverages, chewing gum, powdered soft drinks, dried sweets, beers, chocolates, candy, jelly, biscuits, and luncheon meat (OJEU, 2011). Commercially, tartrazine, sunset yellow, carmoisine, and allura red, brilliant blue, and brilliant black are heavily used (Dixit et al., 2010). Due to their potential risk on human health, colorants should be added to levels within the permissible limits and should be measured periodically to avoid their risk (Rose 1978; Nagaraja and Desiraju, 1993). The acceptable daily intake ADI of coloring agent vary from 0.1 up to 25 mg kg−1 day−1 and this range indicated a 250-fold which seems to be unrealistic considering that most dyes permitted at uniform limit of 100 mg/kg or mg/L (Tripathi et al, 2007; Rao and Sudershan, 2008; Dixit et al., 2011; Dixit et al., 2013). Accordingly, the actual intake of food colors should be monitored and serious actions should be attempted if the daily intake exceeded the safe limit. Many countries have started national-level surveillance studies to measure food colors intake by different individual (Tripathi et al., 2007; Doell et al., 2016). Indian research groups have discussed the usage of permitted and unpermitted food dyes in highly consumed food commodities (Rao and Bhat, 2003; Rao et al., 2004; Rao and Sudershan, 2008; Dixit et al., 2010). The authors surveyed 2000 food samples that consumed by children. The screened foods were milk sweet, sugar confectionery, jam, jellies, bakery products, beverages, and ice-cream (Dixit et al., 2010). The detected dyes were BB, SY, TAT, carmosine, and ponceau while metanil yellow and rhodamine were detected as unpermitted dyes (Rao and Bhat, 2003; Rao et al., 2004; Rao and Sudershan, 2008; Dixit et al., 2010). Running such surveillance studies would require analysis too many samples which require intense analytical efforts. For this reason, development of quick and accurate analytical methods for assaying complex food matrices is very important.
Determination of coloring agents in complex food matrices has been reported using numerous methods such direct spectrometry (Unsal et al, 2012; Dixit et al., 2013), liquid chromatography (Kucharska and Grabka, 2010; Bonan et al., 2013), and multivariate calibration (Al-Degs, 2009; Botelho et al., 2014). In simultaneous quantification of several coexisting analytes by spectroscopy, peak overlapping and poor selectivity for some analytes may be compensated by applying first-order multivariate calibration methods (Ni and Gong, 1997; Goicoechea and Olivieri, 1998; Al-Degs et al., 2008). First order multivariate calibration methods includes principal component regression PCR, partial least-squares PLS-1, hybrid linear analysis HLA, net-analyte signal-based methods (NAS-based methods) were adopted for quantification of food additives (Olivieri et al., 2004).
Among multivariate calibration methods, PLS-1 considered is rather efficient for developing a quantitative relationship between several predictor variables A (spectral measurements) and a property of interest y (the independent variable or dyes content in this work) as: y = Xb, where y contains the concentrations of calibrated solute while A contains absorbance values of standard solutions measured at different wavelengths and b is the calibration sensitivity. In fact, b is necessary to find dyes content in real food matrices at low or moderate spectral interferences of other additives or food ingredients. In fact, PLS-1 was adopted for quantification of dyes and other food additives in different food matrices, however, and the application for the current quaternary system (TAT-SY-AR-BB) was not reported.
In this work, the application of partial least squares PLS-1 as an efficient multivariate calibration method for quick monitoring of four common coloring agents (tartrazine TAT, sunset yellow SY, allura red AR, and brilliant black BB) in different candies is outlined. One-hundred food samples covering seven food items will be considered. Sugar based candies, milk-coated-chocolate candies, lollypops, marshmallows, liquid drinks, jellies, and powder soft drinks are highly consumed by young consumer and should be tested on regular basis. The output of this research will be important for monitoring the acceptable daily intake of coloring agents.
2 Material and methods
2.1 Food dyes
The tested coloring agent were of high usage in food industry. Tartrazine, sunset yellow, allura red, and brilliant black were purchased from Aldrich®. The chemical structures of dyes (with E-number) are provided as following: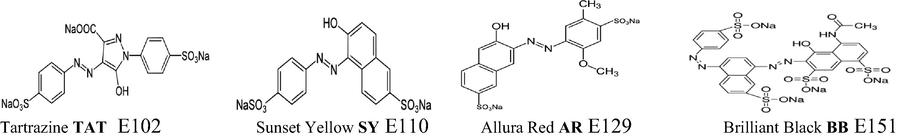
The tested dyes were obtained with the following purities 100, 100, 90, and 80 for E102, E133, E110, and E129 respectively. The tested agents used to color biscuits, cakes, chocolate, chewing gums, chips, jelly and soft drinks. The solvents including petroleum ether (40–60 °C), methanol, water were of HPLC grade and were Aldrich® products. HCl, NaOH and ammonium acetate were purchased from DBH company (UK). Spectral measurements were carried out using double beam UV–Vis spectrometer (Thermo evolution 100 electro corporation, USA). Chromatographic separation was achieved by Shimadzu-HPLC (Shimadzu, LC6AD Liquid Chromatography, Japan). pH measurements were carried out using a Toledo Metler (Switzerland).
2.2 Collection of food samples from local market
Based on a quick food questionnaire in the local markets, the selected foods seems to have high consumption rate by young consumers (age less than 18 years). About 100 samples were collected from different stores in Amman area. The collection process was made within the period 15-10-2015 to 15-3-2016. Amman is tentatively divided into five main areas. From each area, two main supermarkets were specified for collection purposes. All samples were tightly packaged, labeled, and kept in a cold place before analysis. The samples were grouped into seven categories: Lollypops (12), marshmallows (14), milk-coated-chocolate candies (17), hard and soft sugar-based candies (14), liquid drinks (8), jellies (12), and powder soft drinks (24).
2.3 Standard reagents and preparation of working solutions
A 500 mg/L stock solutions were prepared for each additive at the desired pH. pH of solutions were adjusted using 0.01 M NaOH or 0.01 M HCl. Mixtures of dyes were prepared from their stock solutions by mixing the appropriate amounts and all mixture were diluted with distilled water. pH adjustment was made before doing the final dilution.
2.4 Calibration and validation sets for multivariate calibration
Initially, calibration standards were prepared to create PLS model while another independent set (validation set) was necessary for external validation. The design of calibration set was created according to Brereton’s tables to ensure a balance combination of coloring agents in the mixtures while validation set was randomly created (Brereton, 1997). The composition of calibration and validation sets are provided in Table 1.
Number
TAT
SY
AR
BB
Calibration Seta
1
4.0 (0)
4.0 (0)
4.0 (0)
4.0 (0)
2
2.0 (−1)
6.0 (+1)
6.0 (+1)
4.0 (0)
3
6.0 (+1)
6.0 (+1)
4.0 (0)
6.0 (+1)
4
6.0 (+1)
4.0 (0)
6.0 (+1)
2.0 (−1)
5
4.0 (0)
6.0 (+1)
2.0 (−1)
2.0 (−1)
6
6.0 (+1)
2.0 (−1)
2.0 (−1)
4.0 (0)
7
2.0 (−1)
2.0 (−1)
4.0 (0)
2.0 (−1)
8
2.0 (−1)
4.0 (0)
2.0 (−1)
6.0 (+1)
9
4.0 (0)
2.0 (−1)
6.0 (+1)
6.0 (+1)
Validation Set
1
3.0
1.0
3.0
5.0
2
3.0
0 0
5.0
4.0
3
4.0
0 0
0
5.0
4
6.0
7.0
1.0
4.0
5
2.0
1.0
1.0
5.0
6
5.0
0
0
0
7
0
5.0
0
0
8
0
0
5.0
0
9
0
0
0
5.0
2.5 UV scanning and dyes prediction by PLS calibration
The absorbance measurements were obtained using a quartz cuvette of 1.0 cm path length, using spectrometer. The spectra of dyes were recorded over the wavelength range of 350–700 nm and the digitalized absorbance values (1.0 nm step, 351 points/spectrum) were saved in excel file which were exported to matlab® (MATLAB® (version 7.0) to run PLS calibration (Olivieri et al., 2004). Initially, analytical data were placed in matrix A, matrix C, and vector a. A is a matrix contains absorbance values of standard solutions recorded over the range (350–700 nm, 5.0 nm step), C is matrix which contains concentrations of coloring agents in standard solutions, and a is a vector that represents the spectrum of unknown solution (recorded at 250–700 nm, 5.0 nm step). The initial step in PLS calibration is started by decomposing A matrix using concentration vector c of the target dye (the one needed to be calibrated). The decomposition step is repeated for each dye to find their corresponding calibration vector b as (Brereton, 2004):
The performance of PLS-1 was assessed by estimating standard error for dyes prediction in calibration (SEC) and validation (SEP) sets as following (Hemmateenejad et al., 2007):
The goodness of fit of the model was assessed by estimating the correlation coefficient (R2) as following (Al-Degs et al., 2012):
Figures of merit of the proposed multivariate calibration method were estimated using net analyte signal (NAS) method. The basic equation that is needed to estimated figures of merit is (Yousefinejad and Hemmateenejad, 2012):
2.6 Extraction of coloring agents from foodstuffs
The following procedure was adopted for water soluble and non-fatty foodstuffs. 1.0–3.0 g was agitated with 100 mL water at pH 3.0, 25 °C, and 3.0 h stirring time. 10 mL of the supernatant was centrifuged for 10 min and filtered in preparation for spectral analysis. For liquid drinks, 10 mL portion was as sonicated and filtered before spectral analysis. For fatty foodstuffs (marshmallows and milk-coated-chocolate candies), 1.0–3.0 g sample was cut into small pieces and extracted with 50 mL petroleum ether to remove fatty acids. The organic layer was filtered and 100 mL of water was added and the mixture was stirred for 10 min to extract food dyes. A 10.0 mL of the supernatant was centrifuged and filtered before.
2.7 Application of liquid chromatography for dyes quantification
Independently, colouring agents were detected using liquid chromatography. Separation was achieved using C18 column (25 cm × 4.6 mm) with 5 μm particle diameter. All solutions were sonicated and filtered using 0.45 mm filter. The chromatographic system consisted of a binary pump, a degasser, an automated injected, a column and DAD detector. Dyes were separated following gradient elution modes using ammonium acetate (pH 5.0) and methanol solvents. Diode-array detector was programmed to monitor dyes over the range 200–800 nm. The dyes were separated using (40% ammonium acetate pH 5.0 A and 60% methanol B) according to the following program: 0–5.0 min isocratic 100%A, 5.0–7.0 min isocratic 50%A:50%B, 7.0–9.0 min gradient elution A(50–0%)-B(50–100%), 9.0–12.0 min isocratic: 100%B, 12.0–13.0 min gradient elution A(0–100%)-B(100–0%), and 13.0–22.0 min isocratic: A 100%. For each additive, a calibration curve of five points (5.0, 15.0, 30.0, 50.0 and 75.0 mg/L) was created. Each calibration point was given as an average of three identical trials. Calibration graphs were created by plotting peak area against dye level and applying least squares analysis to find the best-fit linear equation. For food samples, the identity of detected dyes was made by comparing with the retention times of standards while the contents were estimated using the pre-constructed calibration graph.
3 Results and discussion
3.1 Matrix effect of and importance of multivariate calibration
In fact, the application of simple spectrometry for dyes quantification is not possible due to the intense spectral overlapping. In such case, solute-separate before quantification is necessary. However, application of multivariate calibration for dyes quantification in food matrices was reported as this method can handle spectral overlapping (Al-Degs et al., 2008; Botelho et al., 2014). To assess the spectral overlapping between coloring agents, the visible spectra was depicted in Fig. 1.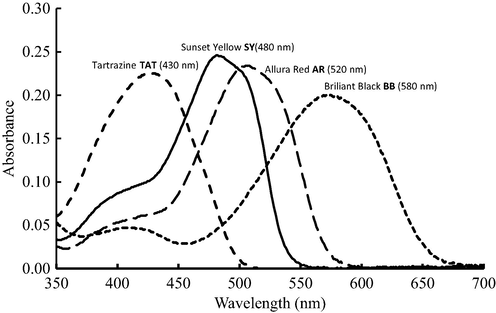
Visible spectra of coloring agents at 10.0 mg/L.
As shown in Fig. 1, a large spectral overlap was involved between dyes. The intense overlap was between SY and AR. Moreover, the spectral overlap between AR/BB and SY/TAT was rather high. For TAT/BB, the overlap was not significant and both dyes can be quantified by spectrometry but in the absence of other food interferences. Analysis indicated that the maximum overlap was between SY/AR with value of 94% as estimated by the method of Goicoechea and Olivieri (1998). On the other hand, the overlap between AR/BB, SY/BB, TAT/SY was ranged from 41% to 48%. The minimum spectral overlap was reported for TAT/BB with a value of 15%. Accordingly, application of simple spectrometry is rather a hard task in the current case due to the intense spectral overlapping. There are two options for dyes quantification, (a) running liquid chromatography (Al-Degs et al., 2012; Bonan et al., 2013; Kucharska and Grabka 2010; Ni and Gong 1997; Unsal et al., 2012) and (b) moving to multivariate calibration which proved to be an efficient analytical method but in the absence of severe matrix effect (Goicoechea and Olivieri 1998). Prediction of dyes in the validation set by PLS-1 along with other statistical parameters is presented in Table 2.
Sample
Actual concentration (mg/L)
PLS prediction (mg/L) a
TAT
SY
AR
BB
TAT
SY
AR
BB
1
3.0
1.0
3.0
5.0
3.1
0.9
3.0
4.9
2
3.0
0
5.0
4.0
3.0
0.0
4.9
4.0
3
4.0
0
0
5.0
3.8
0.0
0.1
5.0
4
6.0
7.0
1.0
4.0
6.1
7.1
0.9
3.9
5
2.0
1.0
1.0
5.0
1.9
1.0
1.1
5.0
6
5.0
0
0
0
4.9
0.1
0.0
0.0
7
0
5.0
0
0
0.0
5.1
0.1
0.0
8
0
0
5.0
0
0.1
0.0
4.9
−0.1
9
0
0
0
5.0
0.0
0.0
0.1
5.0
Statistical Criteria
PLS latent variables
4
4
5
6
SEC
0.011
0.003
0.009
0.004
Explained variance/spectral data %
99.998
99.974
99.935
99.938
Explained variance/concentration %
99.962
99.956
99.974
99.956
SEP
0.018
0.008
0.014
0.006
REP%
2.7
2.3
3.4
1.5
R2
0.9980
0.9960
0.9991
0.9995
Although the spectral overlap was very high between dyes, the performance of PLS-1 was excellent for accurate quantification of all dyes without the need for physical separation of solutes. The developed PLS-1 model was tested to predict dyes in calibration set. SEC values (0.003–0.011) indicated the high performance of PLS-1 to predict dyes in the calibration set. Moreover, the model also accounted for all spectral and concentration information as indicted from the explained variance (˃99%) for all cases. As indicated in Table 2, the dyes were quantified using different PLS-variables. In fact, more PLS-1 variables are needed in case of intense overlapping (Hemmateenejad et al., 2007). The outputs of cross-validation are presented in Fig. 2.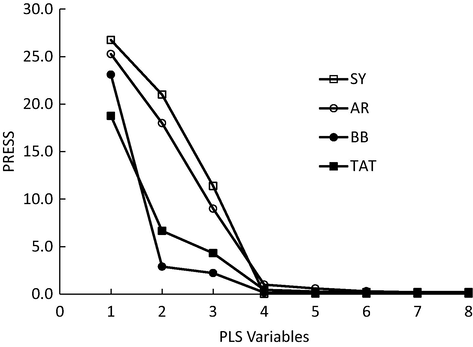
PLS latent variables needed for prediction as obtained by cross-validation technique. (SY Sunset Yellow, AR Allura Red, BB Briliant Black, TAT Tartrazine).
As indicated in Fig. 2, PRESS values for all dyes were notably reduced by adding more variables to stabilize around 4 or 5 variables. As already known, adding more variables is not necessary to end up with high prediction which is known as “over-prediction” problem. In general, calibration by PLS was excellent and the model was able to handle the intense overlapping between SY and AR (see Fig. 1). It is important to mention that PLS is a factor-based method and few factors are needed for optimum modelling. Number of PLS factors needed for optimum calibrations were 4, 4, 5, 6 for TAT, BB, SY, and AR, respectively. In fact, the optimum PLS-factors were in agreement with the spectral overlapping between dyes. Simply, dyes of intense spectral overlapping need more factors for better prediction. For example, four factors needed to calibrate TAT and BB (showed less overlap with other dyes – see Fig. 1) while SUN and AR required more factors (5 and 6) and this was necessary to account for their intense overlapping with other solutes (see Fig. 1). The developed PLS-1 model was then used to predict dyes in the validation set. SEP values (0.006–0.018) indicated the high performance of the model for dyes prediction in the validation set. Moreover REP% values also confirmed the high performance of PLS-1 for dyes quantification even in the presence of severe spectral overlapping. The best results were reported for BB with REP% value of 1.5%. R2 values were also close to 1.0 in all cases: 0.9980, 0.9960, 0.9991, and 0.9995 for TAT, SUN, AR, and BB, respectively.
3.2 Figures of merit of the developed analytical method
The estimated figures of merit of the proposed method were estimated using NAS-based methodology and the results are provided in Table 3.
Dye
SEN
SEL
Detection Limit (mg/L)
Quantification Limit (mg/L)
Dynamic Range (mg/L)
TAT
2.4
0.8
0.08
0.26
0.26–6.0
BB
1.9
0.9
0.09
0.30
0.30–6.0
SY
0.6
0.2
0.21
0.70
0.70–6.0
AR
0.4
0.3
0.26
0.86
0.86–6.0
As shown in Table 3, SEN values were 2.4, 1.9, 0.6, and 0.4 for TAT, BB, SY, and AR, respectively. The reported values indicated that the proposed method has higher sensitivity for TAT and BB compared to rest of dyes. In the same time, the higher SEN values generated better selectivities for both dyes (TAT and BB). SEL values were ranged from 0.3 (for AR) to 0.9 (for BB). Detection limits were 0.08, 0.09, 0.21, and 0.26 mg/L for TAT, BB, SY, and AR, respectively. The lowest detection was reported for TAT with a value of 0.08 mg/L in solution and in the presence of other overlapping dyes. Using PLS calibration, dyes were quantified in the mixture down to: 0.26, 0.30, 0.70, and 0.86 for TAT, BB, SY, and AR, respectively. The intense spectral overlapping between SY and AR was negatively affecting on their QL values.
3.3 Assessment of PLS-1 and HPLC for dyes quantification
To assess the analytical performance of PLS-1, the coloring agents were quantified in different commercial samples by both analytical methods. The final results along with statistical parameters are summarized in Table 4. t: t-test. F: F-test.
Food Item
SY
AR
TAT
BB
PLS
HPLC
t
F
PLS
HPLC
t
F
PLS
HPLC
t
F
PLS
HPLC
t
F
Lollypop
ND
ND
–
–
92.3 (±3.1)
89.5(±2.4)
1.14
1.66
123.6(±4.2)
128.3(±2.4)
3.12
3.06
ND
ND
–
–
Marshmallow
68.4(±1.5)a
71.4(±2.3)
2.17
3.51
87.4(±4.2)
88.6(±4.1)
2.55
1.02
54.2(±4.5)
51.3(±3.2)
2.56
2.00
ND
ND
–
–
Jelly
103.6(±1.8)
101.3(±2.3)
2.21
1.62
119.3(±3.1)
120.6(±4.2)
2.34
1.84
74.5(±3.1)
77.6(±5.1)
2.78
2.71
ND
ND
–
–
Soft drink
97.8(±3.3)
95.6(±3.1)
3.11
1.13
88.3(±2.1)
89.7(±4.1)
3.02
3.81
56.4(±1.5)
53.8(±2.3)
1.98
2.35
38.4(±3.1)
35.4(3.2)
2.78
1.07
For chromatographic methodology, the dyes were detected at 408 nm with retention times of 3.55, 5.72, 7.61, and 13.24 min for TAT, BB, SY and AR, respectively. Moreover, the calibration equations used for dyes quantification were: Speak area = 52504Cdye + 19884 (r2 = 0.9986), Speak area = 19365Cdye-35504 (r2 = 0.9911), Speak area = 27776Cdye + 71694 (r2 = 0.9958), and Speak area = 19667Cdye-39258 (r2 = 0.9975) for TAT, BB, SY and AR, respectively. The dyes were simultaneously quantified down to 0.76, 1.45, 2.0, and 2.2 mg/L for TAT, SY, BB, and AR, respectively. It was interested to notice that PLS-1 was more sensitive than HPLC as it achieved lower detection limits for all dyes. As indicated in Table 4, PLS method was of comparable performance compared HPLC for detecting dyes and in different food matrices. For example, PLS calibration was effective to detect SY, AR, TAT and BB in a soft drink containing the four agents. In all cases, experimental t values do not exceeded the tabulated one at 95% confidence level and this indicated that the difference between both methods is not significant. Comparing the precisions of different methods is often carried out using F-test and the precisions of both methods were comparable. Statistically, the performance of both methods is comparable and PLS seems to be a reasonable substitute for HPLC considering the high running costs of the later technique. Generally, PLS was workable for eliminating spectral overlapping between dyes and also the uncalibrated food interferences. All dyes were predicted by PLS with REP% values of 1.5, 2.3, 2.7, and 3.4 for BB, SY, TAT, and AR, respectively. The proposed method was validated against liquid chromatography and the statistical t and F tests indicated that both PLS and chromatography were of comparable performance.
3.4 Pattern usage of food dyes in different foodstuffs
Before discussing the experimental results, it was essential to investigate dyes usage over the tested candies. In fact, usage pattern of dyes would be discussed in terms of commodity and dyes as well. To achieve this aim, two plots were generated which can explain dyes usages in foodstuffs. The application of food dyes in different foodstuffs is provided in Figs. 3 and 4.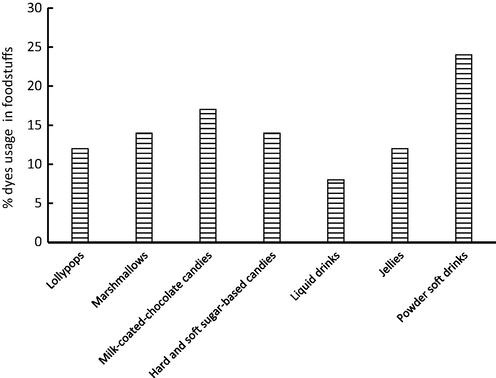
Commodity-based usage pattern of coloring agents.
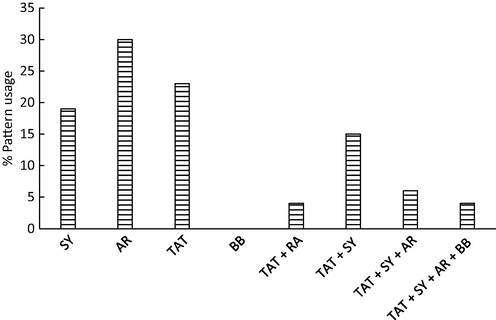
Colored-based usage pattern of coloring agents. (SY Sunset Yellow, AR Allura Red, BB Briliant Black, TAT Tartrazine).
Among tested candies, the application of dyes was notability high in powdered soft drinks with overall usage of 25%. Application of food dyes in lollypops, marshmallows, milk-coated-chocolate candies, jellies, and sugar-based candies was comparable and ranged from 10% (for lollypops and jellies) to 17% (for milk-coated-chocolate candies). As noted in Fig. 3, dyes usage in liquid drinks was not high (8%) and this was attributed to the using of one single dye (AR) in this item. On the other hand, the high usage in powered soft drinks was attributed to the application of more than dye to get the proper shades. It is common to apply two, three and four dyes to get the desired shade of cockatiel blends. Among tested items, the application of mixes was observed in powdered soft drinks, sugar-based-candies, and milk-coated-chocolate candies which need more than color to impart attractive shades. However, other candies like jellies, liquid drinks, and lollypops were often contain one dye to impart the desire color like orange, lemon or strawberry. Application of coloring agents for lollypops, marshmallows, milk-coated-chocolate candies, jellies, and sugar-based candies, fruit bars, chewing gums, and cake decorations was reported in many research papers (Rao and Bhat, 2003; Rao and Sudershan, 2008). The pattern usage of dyes (i.e., either alone or in combination) in the tested candies is presented in Fig. 4. As shown in Fig. 4, application of one single dye is high and application of TAT/SY mix has also a high usage among other combinations. The results indicated that 30, 22, and 18% of tested items were containing only AR, TAT, and SY, respectively, and this indicated that 70% of candies containing one dye only. Adding AR, TAT, and SY to candies is expected as these additives impart the natural shades of orange, mango, and strawberry. Application of BB was not observed as this color is often combined with other agents to impart “mint-flavor” in liquid drinks. The mix TAT/SY was applied in candies with a usage of 15%. Jellies, sugar-based candies, and powdered soft drinks were reported to contain TAT/SY mix (Dixit et al 2010). The mix TAT/SY/AR was applied to color certain food items with usage of 6% and mainly observed in powdered drinks and sugar-based candies. The combination (TAT/SY/AR/BB) was observed in only few soft drinks (less than 5%). Again, BB is often added to simulate the natural shade of mint which is necessary for soft drinks. Comparable results for the same dyes were observed in the literature (Rao and Bhat, 2003; Rao and Sudershan, 2008).
3.5 Detection of coloring agents in different candies
The concentration of dyes that detected in the collected food items are provided in Table 5.
Dyes level (mg/kg or mg/L)a
Food commodities
YS
AR
TAT
BB
Liquid drinks
–
67–128 (96)
–
–
Lollypops
–
77–120 (103)
56–166 (87)
–
Milk and chocolate candies
67–134 (95)
66–133 (101)
58–109 (76)
–
Hard and soft sugar-based candies
87–123 (97)
88–109 (92)
72–133 (93)
–
Marshmallows
14–112 (82)
79–95 (87)
16–108 (83)
–
Jellies
66–107 (83)
88–122 (97)
69–112 (91)
–
Powder soft drinks
45–123 (83)
66–120 (86)
52–122 (84)
28–54 (41)
Indeed, determination of coloring agents by PLS-1 was practical and cost effective as large number of samples was measured with minimum experimental efforts especially when compared with liquid chromatography. As summarized in Table 5, lollypops (a common candy often consumed by children) were containing two colorants: AR (77–120 ppm) and TAT (56–166 ppm) with average contents of 103 and 57 ppm, respectively. Both AR and TAT were added to color lollypops to simulate the natural shades of orange and strawberry fruits. As already known, food dyes would be added to hide the color of other food ingredients like fatty acids in processed meats (Pagáčiková and Lehotay, 2015). For tested foods, the main goal of adding dyes was to expose the natural colors of fruits including orange, strawberry, mango, and lemon or to prepare a cocktail of these fruits which is also appealing for young consumers particularly in the summer time. The usage of SY/AR/TAT (alone or in combination) was reported in jellies, marshmallows, sugar-based candies, and Milk-coated-chocolate candies. The average contents of the SY/AR/TAT in foods were (83–97 ppm), (87–101 ppm), and (76–91 ppm) for SY, AR, and TAT, respectively. Interestingly, AR was applied in liquid drink with average level of 96 ppm. Finally, the mix TAT/SY/AR/BB was observed in 5% of tested samples. The level of dyes was variable but within the safe limit 41, 83, 84, and 86 ppm for BB, SY, TAT, and AR, respectively. Powdered soft drinks are popular stuff in our country and available in many tastes with reasonable prices, therefore, mixes of dyes were needed to get the desired shades. The reported levels were much lower than those reported in Indian candies (Dixit et al., 2010, 201) and this was attributed to the stringent governmental control on local food industry. In the current study, 100 mg/kg or mg/L will be adopted as the “safe-limit” for coloring agents either applied alone or in the mix form. Table 6 summarizes the violation of 100-ppm safe limit among tested items.
Item
Analyzed samples
Samples adhered with 100 ppm limit
Adulterated Samples > 100 ppm limit
Number
Percentage
Number
Percentage
Lollypops
12
6
50%
6
50%
Marshmallows
14
9
65%
5
35%
Milk-coated-chocolate candies
17
9
53%
8
47%
Hard and soft sugar-based candies
14
7
50%
7
50%
Liquid drinks
8
5
63%
3
37%
Jellies
12
8
67%
4
33%
Powder soft drinks
24
18
75%
6
25%
Before discussing the results, it was necessary to explain the meaning of “food adulteration” by colorants. In this context, food adulteration falls under three items (Dixit et al., 2010; Rao and Bhat, 2003): (a) using unauthorized dyes in food industry and application of rhodamine B, metanil yellow, orange II, and malachite green is a good example, (b) adding permitted dyes to foods that not allowed to be colored, and (c) using permitted dyes in rates exceeding the safe limit which often set at 100 ppm in many countries (Dixit et al., 2013). In the current study, none of unpermitted food dyes were detected in our local foodstuffs and this would underline the effective application of governmental legislations in food industry. Moreover, coloring sugar-based candies, marshmallows, milk-chocolate candies, and liquid or powdered soft drinks is allowed as proposed in many international laws and regulations (Official Journal, 2011; Dixit et al., 2010). Accordingly, adulteration will be discussed in terms of the added concentration and this strategy was adopted in the literature (Rao and Bhat, 2003; Rao et al., 2004; Rao and Sudershan, 2008). In fact, 100 ppm level was assumed to be reasonable of all dyes that used in food industry (Rao and Bhat, 2003). In our discussion, the safe level of dyes will be considered as 100 mg per kg (for solid eatables) and per liter (for liquid drinks). For lollypops, half of the collected samples was found adulterated with dyes. The maximum concentration was detected in one of lollypops which found to contain 166 ppm TAT and this represent a serious volition for the regulations. For marshmallows, 64% of samples was adhered with the 100-ppm limit while the rest of samples were exceeded the limit. A 28% of collected samples was found to contain TAT/SY mix and the rest of samples was containing one dye only. One of marshmallows was found to contain 102 ppm (TAT) and 66 ppm (SY) and this sample was considered seriously adulterated with dyes as TAT level exceeded 100 ppm safe limit.
In the previous sample, although SY level was within the safe level the sample was considered adulterated as TAT exceeded the 100 ppm limit. Although 90% of milk-chocolate candies were imported stuff, 47% of the samples were found adulterated with dyes. It was reported that 17% of milk-chocolate candies containing SY/TAT/AR mix. In one of the tested samples, the contents were 66, 102, and 103 ppm for TAT, SY and AR, respectively, and this sample was highly adulterated with dyes as the level of TAT and AR was exceeded the 100 safe limit. The same discussion was hold true for sugar-based candies, all samples were imported stuff and half of the commodities were found adulterated with dye. Among tested samples, 42% were containing either two or three dyes and this was necessary to impart the appealing shades of this stuff. Only one of tested samples was reported to be adulterated and found to contain 108 ppm SY. For liquid drinks, adulteration was not high and one dye (AR) was applied in all samples. The level of AR was 128 ppm in one of the tested samples. For jellies, 67% of samples found to be adhered with the 100 ppm-safe limit and 16% reported to contain two-dye mix and the maximum dye level was for AR (which needed to impart strawberry shade) with a value of 122 ppm. The minimum adulteration was reported for powdered soft drinks as 75% of samples was adhered with 100-ppm limit. In this stuff, the quaternary mix TAT/SY/AR/BB was reported. In one of the tested samples, the contents were 45, 73, 78, and 88 ppm for BB, TAT, SY, and AR, respectively. Although the levels of dyes were within the safe limit, the total content was high (248 ppm) and this may end up with negative health consequences.
4 Conclusions
The rate of application of synthetic coloring agents in food industry is steadily increased in Jordan. Moreover, the application of natural colors seems to be not practical due to their high cost. Four popular coloring agents were quantified in 100 candies using PLS-1 calibration without the need to run liquid chromatography. PLS-1 was workable for eliminating spectral overlapping between dyes and uncalibrated food interferences. All dyes were predicted by PLS-1 with REP% values of 1.5, 2.3, 2.7, and 3.4 for BB, SY, TAT, and AR, respectively. The proposed method was validated against liquid chromatography and the statistical t and F tests indicated that PLS and liquid chromatography were of comparable performance. Adulteration practice was high in milk-coated-chocolate and sugar-based candies as 50% of samples were found to contain high level of dyes. For milk-chocolate candies, the content of AR was over the range 66–133 mg/kg while SY was within the range 67–134 mg/kg. Lollypops were reported to contain high level of AR (77–120 mg/kg) and TAT (56–166 mg/kg). Many of the tested samples were found to contain permitted dyes but in amounts exceeded the 100-ppm-safe-limit. The minimum adulteration practice was observed in powdered soft drinks as 75% of the samples were adhered with 100-ppm safe limit
Acknowledgement
The authors express their deep appreciation to the School of Graduate Studies of the Hashemite University (Zarqa, Jordan) for supporting this work.
Declaration of Competing Interest
The authors whose names are listed in the paper certify that they have no any conflict of interest.
References
- Determination of three dyes in commercial soft drinks using HLA/GO and liquid chromatography. Food Chem.. 2009;117:485-490.
- [Google Scholar]
- Solid phase extraction and simultaneous determination of trace amounts of sulphonated and azo sulphonated dyes using microemulsion-modified-zeolite and multivariate calibration. Talanta. 2008;75:904-915.
- [Google Scholar]
- A simple and accurate analytical method for determination of three commercial dyes in different water systems using partial least squares regression. Wat. Sci. Technol.. 2012;66:1647-1655.
- [Google Scholar]
- Influence of color on perception of sweetness and fruit flavor of fruit drinks. Food Sci. Technol. Inter.. 2001;7:399-404.
- [Google Scholar]
- Simultaneous determination of synthetic dyes in foodstuffs and beverages by high-performance liquid chromatography coupled with diode-array detector. Dyes Pigm.. 2013;99:36-40.
- [Google Scholar]
- Development and analytical validation of a simple multivariate calibration method using digital scanner images for sunset yellow determination in soft beverages. Food Chem.. 2014;159:175-180.
- [Google Scholar]
- Multilevel multifactor designs for multivariate calibration. Analyst. 1997;122:1521-1529.
- [Google Scholar]
- Chemometrics: Data Analysis for the Laboratory and Chemical Plant. Weily Press; 2004.
- All India survey for analyses of colors in sweets and savories: exposure risk in Indian population. J. Food Sci.. 2013;78:642-647.
- [Google Scholar]
- Usage pattern and exposure assessment of food colours in different age groups of consumers in the State of Uttar Pradesh. India. Food Additi. Contamin. A. 2010;27:181-189.
- [Google Scholar]
- Usage pattern of synthetic colors in different states of India and exposure assessment through commodities preferentially consumed by children. Food Additi. Contamin.. 2011;28:966-1005.
- [Google Scholar]
- Exposure estimate for FD&C colour additives for the US population. Food Additi. Contamin - A Chem. Anal. Contr. Expos. Risk Assess.. 2016;33:782-797.
- [Google Scholar]
- Colouring our foods in the last and next millennium. Inter. J. Food Sci. Technol.. 2000;35:5-22.
- [Google Scholar]
- Simultaneous determination of phenobarbital and phenytoin in tablet preparations by multivariate spectrophotometric calibration. Talanta. 1998;47:103-108.
- [Google Scholar]
- Comparative study between PCR and PLS in simultaneous spectrophotometric determination of diphenylamine, aniline, and phenol: effect of wavelength selection. Spectro. Chem. Acta. Part A. 2007;67:958.
- [Google Scholar]
- A review of chromatographic methods for determination of synthetic food dyes. Talanta. 2010;80:1045-1051.
- [Google Scholar]
- Effects of chronic consumption of metanil yellow by developing and adult rats on brain regional levels of noradrenaline, dopamine and serotonin, on acetylcholine esterase activity and on operant conditioning. Food Chem. Toxicol.. 1993;31:41-44.
- [Google Scholar]
- Simultaneous spectrophotometric determination of mixtures of food colorants. Anal. Chim. Acta. 1997;354:163-171.
- [Google Scholar]
- Official Journal of the European Union L295, 2011. Legislations, vol. 54.
- MVC1: an integrated MatLab toolbox for first-order multivariate calibration. Chemometr. Intellig. Lab. Sys.. 2004;73:189-197.
- [Google Scholar]
- Determination of synthetic colors in meat products using high-performance liquid chromatography with photodiode array detector. J. Liquid Chroma. Related Technol.. 2015;38:579-583.
- [Google Scholar]
- A comparative study on the synthetic food colours usage in foods procured from urban and rural areas of Hyderabad. Nutri. Food Sci.. 2003;33:230-234.
- [Google Scholar]
- Exposure assessment to synthetic food colours of a selected population in Hyderabad. India. Food Addit. Contamin.. 2004;21:415-421.
- [Google Scholar]
- Risk assessment of synthetic food colours: a case study in Hyderabad, India. Int. J. Food Saf. Nutri. Public Health.. 2008;1:68-87.
- [Google Scholar]
- The functional relationship between artificial food colors and hyperactivity. J. Appl. Behav. Anal.. 1978;11:439-446.
- [Google Scholar]
- Evaluation of antibacterial, antifungal, and antioxidant properties of some food dyes. Food Sci. Biotechnol.. 2011;20:7-13.
- [Google Scholar]
- Surveillance on use of synthetic colors in eatables vis a vis Prevention of Food Adulteration Act of India. Food Control. 2007;18:211-219.
- [Google Scholar]
- Column solid-phase extraction of sunset yellow and spectrophotometric determination of its use in powdered beverage and confectionery products. Inter. J. Food Sci. Technol.. 2012;47:1253-1258.
- [Google Scholar]
- Simultaneous spectrophotometric determination of paracetamol and para-aminophenol in pharmaceutical dosage forms using two novel multivariate standard addition methods based on net analyte signal and rank annihilation factor analysis. Drug Test Anal.. 2012;4:507-514.
- [Google Scholar]


