

Translate this page into:
Rapid analysis of flavonoids based on spectral library development in positive ionization mode using LC-HR-ESI-MS/MS
⁎Corresponding authors at: Department of Pharmaceutical Chemistry, College of Pharmacy, Abha 62529, Saudi Arabia (J. Uddin). H.E.J. Research Institute of Chemistry, International Center for Chemical and Biological Sciences, University of Karachi, Karachi 75270, Pakistan (S.G. Musharraf). jalaluddinamin@gmail.com (Jalal Uddin), musharraf1977@yahoo.com (Syed Ghulam Musharraf)
-
Received: ,
Accepted: ,
This article was originally published by Elsevier and was migrated to Scientific Scholar after the change of Publisher.
Peer review under responsibility of King Saud University.
Abstract
Natural product screening in plants has always been a difficult task due to the complex nature of the plant material and diverse structures of the compounds present in them. Flavonoids are important and diverse class of plant secondary metabolites with numerous medicinal activities. The present study focuses on the development of a high-resolution tandem mass spectral library for the rapid and authentic identification of common flavonoids. A total of forty flavonoid standards belong to class flavones, isoflavones, flavanones, flavanols and anthocyanins were pooled into two solutions applying logP-based strategy. The flavonoids were analyzed using LC-QTOF-MS high-resolution mass spectrometer with optimization of different instrumental parameters to achieve good sensitivity. The library was built by incorporating names, molecular formulae, exact masses, and MS, and MS/MS spectra of analyzed flavonoids using Bruker Library Editor tool. The fragmentation pattern observed for the standard compounds were compared to the fragments reported in the literature. To assess the practical implications, an extract of tea sample was analyzed and screened using the developed library, which resulted in the identification of three common flavonoids based on their HR-ESI-MS/MS spectral features. The established LC-HR-MS/MS method can be used for the targeted identification of flavonoids in complex samples like food material from different botanical families.
Keywords
Flavonoids
High resolution mass spectral library
Tea sample
MS/MS features
Medicinal values

- LC-QTOF-MS/MS
-
Liquid chromatography time of flight tandem mass spectrometry
- MS/MS
-
Tandem mass spectrometry
- MS
-
Mass spectrometry
- LC-HR-ESI-MS/MS
-
Liquid chromatography high resolution electrospray ionization tandem mass spectrometry
- ESI
-
Electrospray Ionization
Abbreviations
1 Introduction
Flavonoids are diverse group of bioactive polyphenolic compounds, present in a variety of medicinal and food plants. Overall about 6000 different flavonoid molecules have been reported from different plant sources (Panche et al., 2016). Flavonoids have shown a large number of biological activities including antioxidant, anti-inflammatory, anti-allergic and anti-carcinogenic. In addition to these, flavonoids also exhibit protective properties against coronary heart disease, strokes, and other cardiovascular risk (David et al., 2016). Flavonoids are now considered as an indispensable constituent in variety of pharmaceutical, nutraceutical and cosmetic goods (Panche et al., 2016).
Natural product screening and identification have always been a time and resource consuming task (Kumar et al., 2015). Many plant species are constantly screened for drug development and dereplication purpose. Due to complex nature of plant material and wide structural diversity of natural products, the targeted screening of these molecules is a problematic task. In past few years, several advance integrated techniques have been used in order to develop methods for the rapid and high-throughput analysis of natural products in plant materials (Kumar et al., 2015). Due to such a vast biological importance, a large number of studies have been carried out for the analysis and characterization of flavonoids. Until now, numerous analytical techniques have been employed for the identification and characterization of flavonoids from plants sources including TLC, HPLC, GC, GC–MS, LC, LC-MS, and other classical and advance techniques (Bilbao et al., 2007; Sasidharan et al., 2011).
In the present study, liquid chromatography-high resolutiontandem mass spectrometry (LC-HRMS/MS) technique is used due to its simplicity, sensitivity, specificity, and ability to couple with other analytical techniques (Aaby et al., 2007; Maity et al., 2013). Rapid screening and high resolving power of LC-HRMS makes it an ideal choice for the analysis and identification of flavonoids and other metabolites in plant extracts (Kumar et al., 2015). Although, several mass spectral databases are freely or commercially available for identification of plant metabolites such as NIST, MassBank, mzCloud, MoNA, ReSpect, HMDB and METLEN, however, high resolution mass spectral data of flavonoid is limited (Guijas et al., 2018; Maria et al., 2010; Sawada et al., 2012; Wang et al., 2013; Wang et al., 2016; Wishart et al., 2013). In this study, a flavonoid-specific high-resolution mass spectral database is developed of forty flavonoids analysed in positive ionization mode. Different spectral and chromatographic features like monoisotopic masses, retention times and fragmentation patterns were incorporated in the developed database for the targeted identification of flavonoids.
2 Experimental
2.1 Chemicals and reagents
Forty flavonoid reference standards were obtained from Molecular Bank, Dr. Panjwani Center for Molecular Medicine and Drug Research, University of Karachi, Pakistan. All the standard compounds were >98% pure. The names, molecular formulae and exact masses of the selected flavonoids are listed in Table 1. HPLC-grade formic acid and acetonitrile were purchased from DaeJung Chemicals and Metals, Co. Ltd, Korea. HPLC-grade methanol was purchased from Merck KGaA, Darmstadt, Germany. Ultrapure Type I water, (ISO 3969) for mobile phase was collected from Barnstead™ GenPure™ ultrapure water purification assembly, Thermo Fisher Scientific Inc., USA.
S. No
Name
Formula
Exact Mass
Observed Mass
Error (ppm)
RT
MS/MS
01
Cirsimaritin
C17H14O6
315.0863
315.0876
2.6
9.13
300.0633, 155.0470
02
Luteolin
C15H10O6
287.0550
287.0554
1.3
7.20
160.3882
03
Rhoifolin
C27H30O14
579.1708
579.1736
4.8
7.10
271.0606
04
Scandenone
C25H24O5
405.1699
405.1715
3.9
10.5
349.1087, 331.0996, 295.0622, 229.1004, 159.0600
05
Tecterigenine
C22H22O11
301.0707
301.0715
2.6
8.46
268.0421, 168.0026
06
2-Phenyl chromone
C15H10O2
223.0754
223.0752
0.8
8.8
178.0774, 167.0849, 152.0617
07
Rotenone
C23H22O6
395.1489
395.1487
0.5
9.1
335.1302, 241.0860, 213.0911, 192.0716, 147.0448
08
Conferol A
C19H16O7
357.0969
357.0967
0.5
8.8
329.0660, 311.0548, 296.0323, 268.0369, 240.0411, 212.0465, 184.0513
09
Conferol B
C21H18O8
399.1074
399.1068
1.5
7.00
353.1057, 398.1561, 335.0945, 282.8268, 223.8268, 170.8842, 124.3520
10
Atripliside B
C28H34O15
611.1970
611.1962
1.3
5.9
465.1392, 303.0879, 153.0187
11
Lawsonaringenin
C20H20O5
341.1384
341.1386
0.5
6.5
291.1000, 270.0879, 219.0777
12
Erythrivarone C
C25H24O6
421.1646
421.1665
4.5
9.24
403.1536, 385.1384, 349.1054, 292.0702, 220.9332
13
7-Hydroxyflavone
C15H10O3
239.0700
239.0704
1.6
9.0
163.0550
14
7-O-Gluco-luteolin
C21H20O12
465.1028
465.1036
1.7
5.7
303.0498, 229.0491
15
Rutin
C27H30O16
611.1607
611.1611
0.6
5.8
303.0498
16
Kaempferol
C15H10O6
287.0550
287.0553
1
7.00
257.0444
17
Baicalin
C15H10O5
271.0602
271.0602
0
7.1
243.0664, 215.0695, 153.0177
18
Silymarin
C25H22O10
483.1286
483.1283
0.6
7.3
343.0791, 221.0427
19
Atlantaflavone
C20H16O5
377.0991
377.0989
0.5
8.8
374.3630, 312.3264
20
Catechin hydrate
C15H16O7
309.0945
309.0969
7.7
3.4
182.9012
21
Lawsochrysinin
C25H30O4
323.1278
323.1274
1.2
10.2
255.0650,
22
Lawsochrysin
C25H30O4
395.2217
395.2192
6.3
10.1
377.2087, 259.1976, 327.1849, 304.1976
23
6,7,4′-Trihydroxy-3′-methoxy-isoflavone
C16H12O6
301.0707
301.0715
2.6
8.5
286.0471, 168.0026,
24
Kaempferol-4′-O-alpha-L-rhamnopyranoside
C21H20O10
433.1129
433.1129
0
8.13
287.0547
25
3′,4′-Dimethoxy-flavones
C17H14O4
283.0965
283.0969
1.4
8.0
267.0655, 222.0674, 209.0602, 152.0621, 239.0708, 165.0703, 181.0656
26
7-O-E-p-Coumoryl kaempferol 4′-O-L-arabinopyranoside
C29H24O12
565.1341
565.1309
5.6
7.2
547.1225, 521.1417, 429.1168, 299.0492
27
5-Methyl-flavonone
C16H12O2
237.0910
237.0909
0.4
9.2
178.0779
28
8-(3″-Methylbut-2″-enyl)-7,3′4′-trihydroxy-flavanone
C20H20O5
341.1384
341.1386
0.5
9.3
303.3058, 273.0758, 221.0802, 153.0172
29
Kaempferol 3-O-rutinoside
C27H30O15
287.0550
287.0557
2.4
7.22
593.2341, 449.1089, 287.0557
30
Abutulin
C24H24O12
505.1446
505.0441
7.1
301.0708, 258.0523
31
3,8,13,14-Tetra hydroxy-flavanone
C15H12O6
289.0686
289.0707
7.2
5.3
257.0427, 204.9811
32
Salvigenin
C18H16O6
329.1020
329.1019
0.3
8.2
297.0752, 279.0652, 254.0576, 223.0750, 195.0444, 165.0697, 139.0538, 152.0629
33
5,7-Dihydroxy-4′-methoxy-isoflavone
C16H12O5
285.0750
285.0741
3.1
6.7
270.0554, 253.0494, 225.0529, 213.0552
34
Apigenin glucoside
C21H20O10
433.1129
433.1154
5.7
429.1171, 271.0601
35
Hispidone
C18H18O7
347.1125
347.1123
0.5
7.9
207.0654, 193.0505, 175.0382, 167.0337, 147.0421
36
2-(4-Hyroxyphenyl) 3,5 dihyroxy-7-rhamnosyl-4H-1-benzopyran 4-one
C21H20O10
433.1129
433.1147
4.1
7.13
287.01545, 153.0182
37
8-Methoxy-6,7-methylene-dioxycoumarano-chromone
C17H10O6
311.0550
311.0550
0
9.09
255.0650, 160.0148
38
2-Phenyl 4H naphtha [1,2-b]pyran 4-one
C19H12O2
273.0912
273.0910
0.73
9.7
171.0444, 226.0772
39
(3R, 4R) 3-(4-Hyroxy-2-methoxyphenyl)- 3,4-dihydro-2H-chromene-4,7-diol
C16H16O5
289.1071
289.1056
5.18
9.01
243.0986, 214.9i159
40
(3S,6S)-3,4,5-Trihydroxy-6-{[5-hydroxy-2-(4-hydroxyphenyl)-4-oxo-4H-chromen-7-yl]oxy} tetrahydro-2H-pyran-2-yl)methyl (E)-3-(3,4-dihydroxyphenyl)-2-propenoate
C30H26O13
595.1444
595.1443
2.6
7.0
287.0546, 147.0439
2.2 Standards preparation
Forty standard compounds were accurately weighed as 1 mg each and were dissolved in 1 mL of methanol with few exemptions. All the standard stock solutions were stored below 0 °C. The standard stock solutions were grouped into 2 pools by mixing 10 μL of each. The grouping of standards was performed on the basis of the logP value of each compound which were calculated using ACD Lab software (ver: 2081.1). These pooled stock solutions were then further diluted 100 and 1000 times for LCMS analyses.
2.3 Sample preparation of tea extracts
Tea sample was collected from local shop, Karachi, Pakistan. Sample was shade dried and crushed into powder using dry mill, then weighted exactly 1 g each and transferred into 15 mL falcon tube along with 10 mL methanol. The process of extraction was done at room temperature through sonication for 20 min. The extracted solution was centrifuged for 20 min at 12,000 RPM to settle large particles and then 1 mL of supernatant was filtered using 0.22 µm PTFE filters. The filtered solution was then diluted 20 times by taking 50 µL of sample extract and 950 µL of methanol in HPLC vial. The prepared solution was then subjected to LCMS analyses.
2.4 Instrumentation and experimentation
LC-MS/MS analysis was performed on Bruker maXis II™ high-resolution ESI-QTOF mass spectrometer (Bremen, Germany) coupled to HPLC Dionex UltiMate™ 3000 series (Thermo Fisher Scientific, Waltham, MA., USA). The HPLC system was fitted with an auto-sampler, binary pump, temperature-controlled sample, and column compartments. Macherey-Nagel Nucleodur® C18 Gravity column (2.0 × 100 mm, 1.8 µm) was used to perform chromatography and kept at 40 °C. Injection volume for plant samples was 4 µL while for standards it was 5 µL. Mobile phase solvent system was composed of solvent A (H2O) and solvent B (MeOH) with 0.1% formic acid as additive in both. The runtime for the analysis of plant samples was 10 min including 1 min holding time at the start and 1 min equilibrium time at the end of the linear solvent system. Gradient solvent system was used with a constant flow rate of 0.7 mL/min and its composition was: 20% of B for 0–1 min, 70% of B for 2–3 min, 90% of B for 4–8 min and at the end 20% B for 9–10 min. For standards flow was set at 0.5 µL and linear gradient system was started at 0.5% of B for 0–1 min holding time, raised to 90% in 2–9 min, kept constant for 10 min, and returned to 0.5 % in 11–13 min equilibrium time.
To achieve good fragmentation with better sensitivity, MS/MS experiments were performed using two different modes: the auto MS/MS mode and targeted MS/MS mode. In auto MS/MS mode, fragmentor voltages (collision energies) were swept ranging from 25 to 60 eV. In the targeted MS/MS mode, a scheduled precursor list was provided with 10, 20, 30, and 40 eV fragmentor voltages assigned based on mass and retention time of each flavonoid. MS and MS/MS experiments were recorded in positive ionization mode using ESI ion source. Ion source parameters were optimized and set as: capillary voltage in positive ion mode at 4500 V and in negative ion mode at −3500 V; drying gas (N2) at flow rate 12.0 L/min with 300 °C temperature; end plate offset at 500 V and nebulizer gas pressure at 45.0 psi. Mass range was selected from m/z 50 to 2000 amu while scan speed for MS and MS/MS was set at 5 Hz and 12 Hz respectively. The active exclusion number was set at 3, and the precursor reconsideration time was set at 30 sec. All the ion source parameters were kept same for plant extracts and standard compounds except for mass range for these samples which was selected from 100 to 1200 amu.
3 Results and discussion
3.1 LC-ESI-MS/MS analysis of standards
Forty flavonoids were divided into 2 pools based on their LogP values for efficient chromatographic separation. The flavonoids with same monoisotopic masses were added in separate pools. LogP values were used to make sure that the compounds with similar hydrophilicity added in different pools to prevent chromatographic co-eluion. The logP values of all the flavonoids were calculated using computational tool ACD Lab (version 2081.1). The pooling strategy was followed from a published article with some modifications according to the number of standards (Shahaf et al., 2016). Each flavonoid in these pools were detected within the analysis time. The extracted ion chromatograms of all flavonoids analyzed in two pools are showed in Fig. 1. Flavonoids observed in each pool with their names, exact masses, molecular formula, ppm error < 5, and retention time values are enlisted in Table 1 and their structures and spectra are shown in Supplementary Table 1. Based on structure compatibility, alpha-cyano 4-hydrocycinnamic acid (HCCA) was selected as an internal standard. This selected internal standard was cost-effective, easily available and lie at the specific range of chromatogram with relative ionization conditions. The effective pooling strategy based on logP values and ultimately on retention times of analytes has led to much efficient and less time-consuming analysis as compared to individual analysis of each analyte.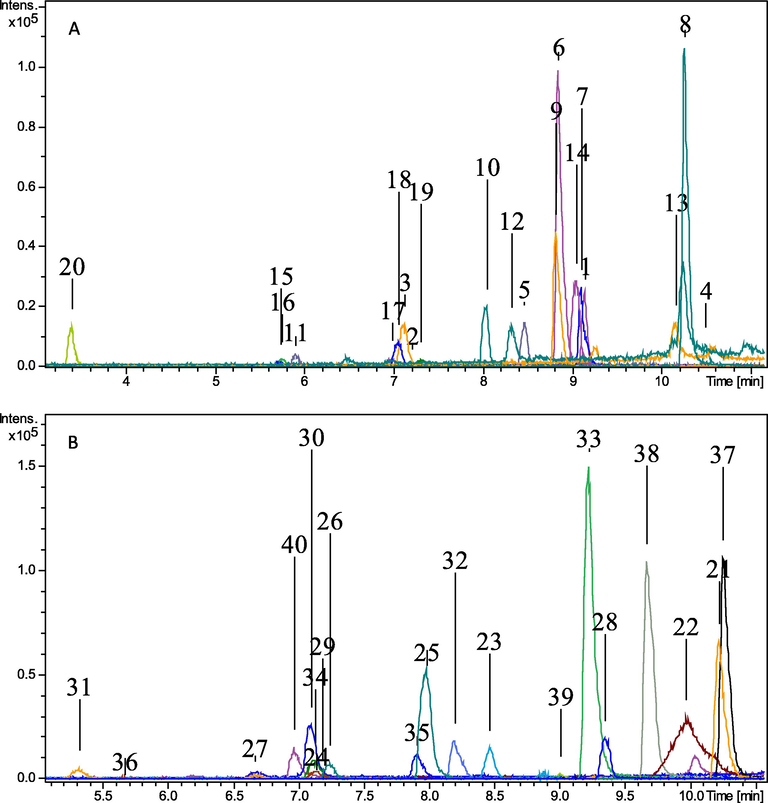
Extracted ion chromatogram of pool A and pool B.
3.2 Features optimization using LC-MS/MS
Flavonoids are most readily ionized in negative ion mode due to their acidic sites (hydroxyl groups) (Gates and Lopes, 2012), but this require higher collision energy to give adequate fragmentation as compare to positive ion mode. Furthermore, the fragmentation pattern in negative ion mode is also more difficult to interpret. In addition, positive ion spectra is helpful in structure determination and can be used complementary with negative ion spectra. Therefore, in the present study the positive ion mode is used for the identification of forty flavonoids. In positive ion mode, protonated [M+H]+ ions were abundant while some sodium adducts [M+Na]+ were also detected. Both pools were analyzed on four different collision energies. An example is shown in Fig. 2 to describe the behavior of applied collision energies on a flavonoid conferol A. At 10 eV collision energy, precursor ion was the most prominent and intense peak but as the given energy was raised to 20 eV, some low intense fragments were also observed along with the precursor ion peak. At 30 eV energy, fragments count, and intensity were increased and the precursor ion intensity was very low while at 40 eV spectra showed maximum fragments with no precursor ion peak.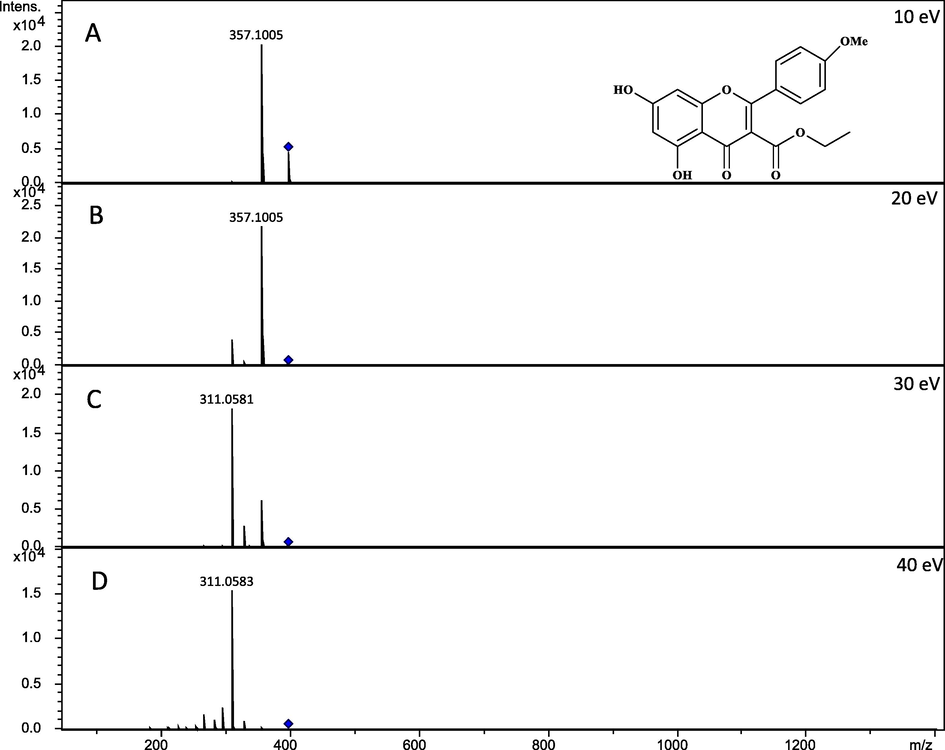
MS2 spectra of conferol B at (A) 10 eV, (B) 20 eV, (C) 30 eV and (D) 40 eV shows the effect of collision energies.
Using TargetAnalysis, all forty flavonoids were detected by applying strict analyzing criteria. Different collision energies were applied to get good intensity parent ions as well as significant fragment ions. Accurate and reproducible spectra with high mass accuracy helped in the identification process. The acquired data was processed using three acquisition software including Compass Data Analysis 4.4, Compass TargetAnalysis and Compass Library Editor (Bruker GmbH, Bremen, Germany). The MS intensity threshold was set at > 1000, MS2 intensity > 500, base peak intensity 1000 counts (minimum), ppm error > 5, and mSigma values > 50. Flavonoids that followed these criteria were selected for generating spectral database. Every MS and MS/MS spectra of flavonoids observed at different collision energies were added to Bruker Library Editor tool with their names, exact masses, and molecular formulae. In this manner, 40 flavonoids spectral library was developed in positive ionization mode.
3.3 Tandem mass spectral features of analyzed flavonoids
Flavonoid’s basic skeleton is composed of A, B and C rings as C6, C3, and C6, respectively. The analyzed flavonoids belonged to five main classes namely flavones, flavanones, iso-flavones, flavanols and anthocyanidins. These classes are differing from each other by substitution of hydroxyl moiety and methyl group substitution. Supplementary Table 1 shows the structures and MSMS spectra of identified flavonoids. Fig. 3 shows the structure of main analyzed classes and glycosidic linkages (Cuyckens and Claeys, 2004; Kachlicki et al., 2016). The flavonoids showed a combination of distinct neutral losses from the parent ions i.e. removal of H2O molecule. Removal of glycosidic moieties was also observed commonly. Compound 1 showed the removal of methyl group which appeared as [M+H-15]+. Compound 2 fragment was observed with the loss of phloroglucinol moiety appeared as [M+H-126]+. Compound 4 observed at [M+H-56]+ indicates the loss of dimethyl ethene moiety. Compound 8 showed the neutral loss of ethanol molecule appeared at [M+H-46]+. Compounds 23 and 32 showed the loss of methanol raised to [M+H-32]+ while compound 39 showed the removal of methanol with H2O molecule raised to [M+H-47]+. Compound 10 showed the removal of para-hydroxy benzaldehyde moiety appeared at [M+H-122]+. Compound 14 showed the loss of ring C observed as [M+H-78]+. Compound 21 appeared at [M+H-68]+ showed the removal of 1,4 pentadiene. Compound 22 showed the loss of 2-pentene appeared at [M+H-70]+. Compound 28 showed the removal of single isoprene unit raised to [M+H-68]+. Compound 37 showed cleavage of ring B appeared as [M+H-150]+. Compound 20 observed at [M+H-127]+ showed the removal of catechol hydrate. Compounds 6 and 38 appeared at [M+H-102]+ with the removal phenylacetylene moiety. Compounds 7 and 35 showed the loss of dimethoxy phenol moiety observed at [M+H-102]+. Compounds 3, 9, 16, 24, and 29 showed the removal of two glycosidic moieties appeared at [M+H-308]+. The fragmentation behavior in most of the flavonoids was found to be similar as reported in the literature (Fabre et al., 2001).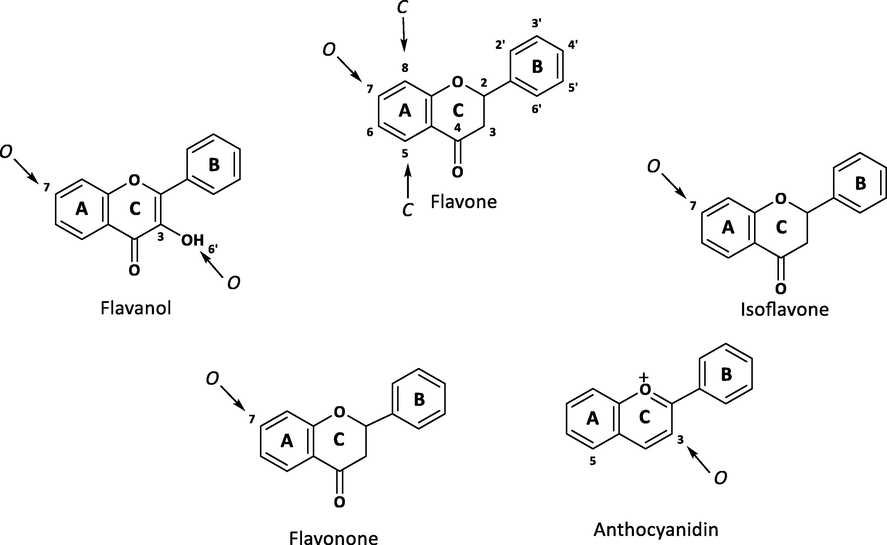
Basic skeleton and glycosidic linkages of flavonoids.
3.4 Targeted analysis of tea sample using spectral database
The developed strategy was adopted for the LC-ESI-MS based targeted identification of flavonoids in tea sample. Chromatographic conditions were optimized to obtain efficient resolution and clean peaks. Results showed that 3 flavonoids were targeted identified using developed flavonoids spectral database namely 7-O-gluco luteolin, kaempferol-4-O-alpha L-rhamnopyranoside, and scandenone showed in Fig. 4, respectively.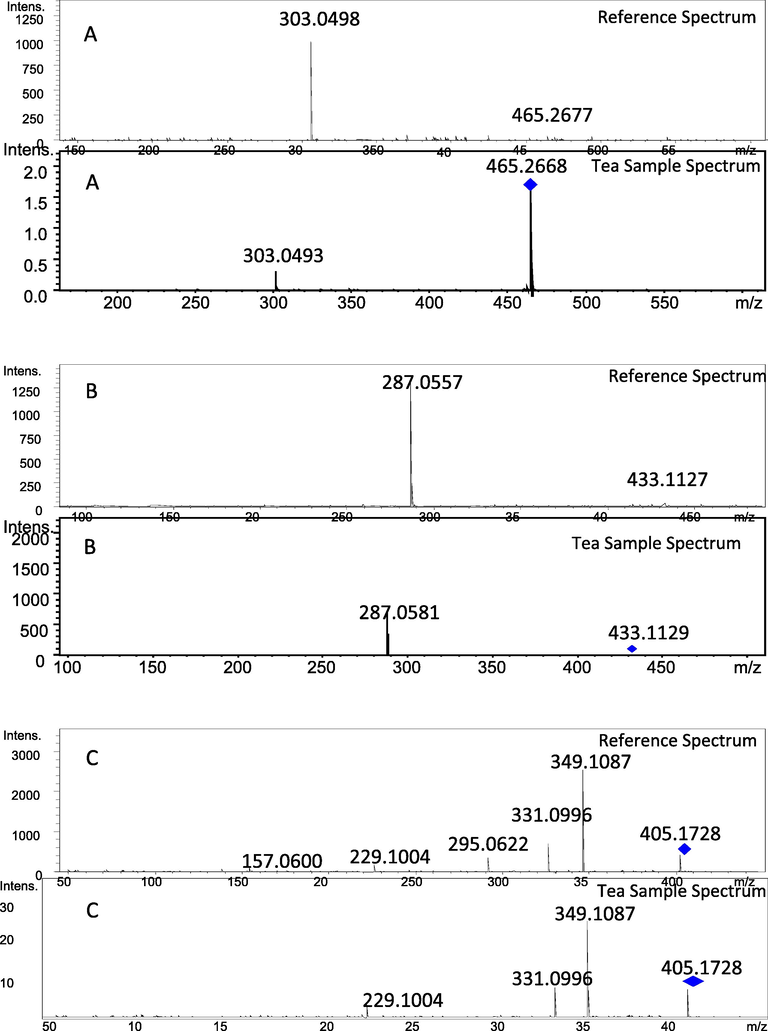
Spectra from library (Top) and in tea sample (Bottom) of flavonoids A) 7-O-Gluco luteolin, B) Kaempferol-4-O-aplha-L-rhamnopyranoside and C) Scandenone.
4 Conclusion
Like EI-MS, ESI-MS/MS-based mass spectral database and libraries are also gaining interest nowadays as it provides rapid and high-throughput identification of unknown compounds in complex mixtures. In the present study, a rapid, accurate, and sensitive approach is developed for the detection of some common flavonoids in complex samples based on high-resolution mass spectral database. An in-house database is generated comprising data of forty common flavonoids from positive ion electrospray high-resolution mass spectrometry. The selected flavonoids were pooled in two solutions based on logP values and were successfully detected with acceptable mass accuracy (under 5 ppm error). The strategy was applied to identify three flavonoids 7-O-gluco luteolin, kaempferol-4′-O-alpha-L-rhamnopyranoside and scandenone in tea samples based on comparison of retention times, accurate masses (under 5 ppm error), isotopic pattern (under 100 mSigma error) and fragmentation data.
Funding
Authors would like to gratefully acknowledge the support from the Deanship of Scientific Research at King Khalid University (Grant No. RGP.1/259/42).
Declaration of Competing Interest
The authors declare that they have no known competing financial interests or personal relationships that could have appeared to influence the work reported in this paper.
References
- Characterization of phenolic compounds in strawberry (Fragaria× ananassa) fruits by different HPLC detectors and contribution of individual compounds to total antioxidant capacity. J. Agric. Food Chem.. 2007;55(11):4395-4406.
- [Google Scholar]
- Determination of flavonoids in a Citrus fruit extract by LC–DAD and LC–MS. Food Chem.. 2007;101(4):1742-1747.
- [Google Scholar]
- Mass spectrometry in the structural analysis of flavonoids. J. Mass. Spectrom.. 2004;39(1):1-15.
- [Google Scholar]
- Overviews of biological importance of quercetin: a bioactive flavonoid. Phcog. Rev.. 2016;10(20):84.
- [Google Scholar]
- Determination of flavone, flavonol, and flavanone aglycones by negative ion liquid chromatography electrospray ion trap mass spectrometry. J. Am. Soc. Mass Spectrom.. 2001;12(6):707-715.
- [Google Scholar]
- Characterisation of flavonoid aglycones by negative ion chip-based nanospray tandem mass spectrometry. Int. J. Anal. Chem.. 2012;2012:259217
- [Google Scholar]
- METLIN: a technology platform for identifying knowns and unknowns. Ana. Chem.. 2018;90(5):3156-3164.
- [Google Scholar]
- Structural characterization of flavonoid glycoconjugates and their derivatives with mass spectrometric techniques. Molecules. 2016;21(11):1494.
- [Google Scholar]
- Rapid qualitative and quantitative analysis of bioactive compounds from Phyllanthus amarus using LC/MS/MS techniques. Ind. Crops Prod.. 2015;69:143-152.
- [Google Scholar]
- Evaluation of antioxidant activity and characterization of phenolic constituents of Phyllanthus amarus root. J. Agric. Food Chem.. 2013;61(14):3443-3450.
- [Google Scholar]
- Metabolomic profiling for identification of novel potential biomarkers in cardiovascular diseases. J. Biomed. Biotech. 2010:2011.
- [Google Scholar]
- Extraction, isolation and characterization of bioactive compounds from plants’ extracts. Afr. J. Tradit. Comp. AlternMed.. 2011;8(1)
- [Google Scholar]
- RIKEN tandem mass spectral database (ReSpect) for phytochemicals: a plant-specific MS/MS-based data resource and database. Phytochemistry. 2012;82:38-45.
- [Google Scholar]
- The WEIZMASS spectral library for high-confidence metabolite identification. Nat. Commun.. 2016;7(1):12423.
- [Google Scholar]
- Sharing and community curation of mass spectrometry data with Global Natural Products Social Molecular Networking. Nat. Biotechnol.. 2016;34(8):828-837.
- [Google Scholar]
- A platform to identify endogenous metabolites using a novel high performance Orbitrap MS and the mzCloud Library. Blood. 2013;4:2-8.
- [Google Scholar]
- HMDB 3.0-the human metablome database in 2013. Nucleic Acids Res.. 2013;41:D801-D807.
- [Google Scholar]
Appendix A
Supplementary data
Supplementary data to this article can be found online at https://doi.org/10.1016/j.arabjc.2022.103734.
Appendix A
Supplementary data
The following are the Supplementary data to this article:Supplementary data 1
Supplementary data 1


