

Translate this page into:
Refractometric study of systems water-poly(ethylene glycol) for preparation and characterization of Au nanoparticles dispersion
⁎Corresponding author. Fax: +420 475 283 563. zdenka.kolska@ujep.cz (Zdeňka Kolská)
-
Received: ,
Accepted: ,
This article was originally published by Elsevier and was migrated to Scientific Scholar after the change of Publisher.
Peer review under responsibility of King Saud University.
Abstract
Refractive index of binary systems water-poly(ethylene glycol) of different molecular weights at several temperatures from 283.15 to 363.15 K was measured. Refractive index strongly depends on molecular weight, mole fraction and temperature. Experimental data were correlated by four parameters’ relationship for dependence of refractive index on mole fraction of poly(ethylene glycol) and by three parameters’ relationship for dependence on molecular weight of poly(ethylene glycol). Obtained data can serve as an input data for subsequent study of these binary systems and especially for study of colloidal systems of metal nanoparticles in dispersion surrounding consisting of water and poly(ethylene glycol). Especially these data on refractive index are important for determination of nanoparticle size and zeta potential by dynamic light scattering. Obtained data on refractive index have been employed for correct and accurate determination of nanoparticle size and zeta potential. The size of Au nanoparticles was determined by dynamic light scattering. For comparison of this determination also a transmission electron microscopy and UV–vis spectroscopy have been employed in very good agreement. The optical properties of Au nanoparticles’ colloidal solutions were analyzed with UV–vis spectroscopy and showed a significant absorption peak maximum at 530 nm.
Keywords
Water-poly(ethylene glycol)
Refractive index
Temperature dependence
Data correlation
Au nanoparticles
Dynamic light scattering

1 Introduction
Poly(ethylene glycol), PEG, is a neutral, nonionic, linear polymer that has a well-defined molecular structure and consists of hydrophilic oxygen and hydrophobic ethylene units (Zulauf and Rosenbusch, 1983; Mitchell et al., 1983; Sasahara et al., 1998). PEG of molecular weights of 200–600 g mol−1 is transparent or slightly yellow liquids at room temperature. PEG of molecular weights 1000 and more g mol−1 is white or almost white solids of a wax or paraffin appearance or as a dry powder. They exhibit a high solubility over a wide range of temperatures in water as well as in different types of organic solvents (Aucouturier et al., 1999). Liquid PEG is very hygroscopic, and a hygroscopicity decreases with increasing molecular weight. Density of liquid PEG at 25 °C is in the range from 1.11 to 1.14 g cm−3 and density of solid PEG at 25 °C is 1.15 to 1.21 g cm−3 (Rowe et al., 2006). Liquid PEG is an important industrial organic solvent and in medical usage because of its favorable properties, such as low vapor pressure, low toxicity, high chemical stability, and low melting temperature (Zhang et al., 2012). PEG has found a wide variety of applications in numerous industrial processes from petroleum, textiles to pharmaceutical and biochemical technologies (Moosavi et al., 2013; Rajulu and Sab, 1998; Yasmin et al., 2011). The possibility of having a wide range of polymers of increasing molar mass makes these compounds particularly interesting for the correlation of thermodynamic properties of polymer solutions or mixtures and the prediction of phase diagrams (Aucouturier et al., 1999). PEG has an important clinical usage due to their low toxicity, too. They are stable, hydrophilic substances that are essentials and nonirritant to the skin. Due to this they are widely used in a variety of pharmaceutical formulations including parenteral, topical, ophthalmic, oral and rectal preparations (Rowe et al., 2006).
Solutions of PEG in water have been used in biochemistry and biochemical engineering to separate and purify biological products, biomaterials, proteins, and enzymes from the complex mixtures in which they are produced (Albertsson, 1986; Hariri et al., 1989; Soane, 1992; Laurence, 1994). PEG of different molecular weights, especially its binary systems with water, is also applied in tissue engineering (Kim et al., 2016; Neumann et al., 2016). They are used as grafting solutions for grafting of new chemical functional groups to surfaces of plasma modified polymer foils (Švorčík et al., 2012). This modification significantly changes surface properties of polymer foils, as a surface chemistry, wettability, polarity, roughness and morphology, which can improve a subsequent adhesion and proliferation of rat vascular smooth muscle cells (Švorčík et al., 2012). Binary systems such as water-glycerin or water-PEG can serve as a dispersion surrounding for preparation of colloidal solution of gold or silver nanoparticles (Siegel et al., 2012; Slepička et al., 2015a).
Some studies of these systems have been already presented (Maisano et al., 1993; Jannelli et al., 1994; Muller and Rasmussen, 1991; Douheret et al., 1997) but only for limited range of temperature or mole fraction. The physical and transport properties of liquid mixtures are very important in understanding the nature of molecular interactions between the molecules of mixtures (Zafarani-Moattar and Tohidifar, 2008) and also affect most separation procedures, such as liquid-liquid extraction, gas adsorption/absorption, and distillation (Zhang et al., 2011; Deng et al., 2006).
Refractive index of binary system water-PEG was studied only sporadic up to now, either for only one molecular weight of PEG, or for only one temperature (Moosavi et al., 2013; Rajulu and Sab, 1998; Silva et al., 2007). But in fact refractive index is an important parameter which can serve as input data for calculation of other physico-chemical properties, like reflectivity or polarizability and molar refraction (Tariq et al., 2009; Jeong et al., 2015). Some parameters of binary systems water-PEG, as refractive index, are important input data for analysis of nanoparticles’ colloidal systems, e.g. for dynamic light scattering (DLS) of dispersion systems, for zeta potential determination and for determination of size and distribution of metal nanoparticles dispersed in solution composed from water and PEG.
Therefore in this work we have studied binary systems of water-PEG of different molecular weights (200, 300, 400, 600, and 1000 g mol−1) and present new data of refractive index as a function of PEG mole fraction and molecular weight in temperature range 283.15–363.15 K. Obtained data were used as a basis for zeta potential analysis and size and distribution determination of gold nanoparticles (AuNPs) dispersed in water-PEG system. The optical properties of AuNPs have been studied by UV–vis spectroscopy (UV–vis), and dimensions of the nanoparticles were studied with transmission electron microscopy (TEM) for comparison of nanoparticle size obtained by DLS method.
2 Material and methods
2.1 Materials
The following analytical grades of PEG (supplied by Merck, Czech Republic) were studied: PEG 200 with the average molecular weight (M) of 200 g mol−1 (quoted distribution of molecular weights of 190–210 g mol−1); PEG 300, M = 300 (285–315) g mol−1; PEG 400, M = 400 (380–420) g mol−1; PEG 600, M = 600 (570–630) g mol−1 and PEG 1000, M = 1000 g mol−1 (distribution is not presented by supplier) was purchased from Alfa Aesar GmbH & Co KG A Johnson Matthey Company, Germany. The substances were used without further purification. The solutions of binary mixtures were prepared with distilled water at room temperature using an analytical balance (XS205DU/M by Mettler-Toledo) with an accuracy of 1 · 10−5 g (for mass maximum of 81.0 g) or 1 · 10−4 g (mass maximum of 210.0 g). The experimental uncertainty in composition (the mole fraction) is less than ± 5 · 10−5 (Kolská et al., 2011, 2016).
Binary systems water-PEG of molecular weights 200–600 g mol−1 were studied in all range of mole fraction of PEG (x1) and temperature range 283.15–363.15 K. System water-PEG of molecular weight of 600 g mol−1 was studied at narrower range of mole fraction x1 for T = 283.15 K and system water-PEG of molecular weight of 1000 g mol−1 was studied at narrower range of mole fraction due to a solidification of system water-PEG of higher PEG mole fraction in measuring cell. For other all binary systems 14 solutions of different mole fraction of PEG, x1, covering all concentration range (x1 ∈ (0; 1)) were prepared, inclusive of 2 pure compounds, PEG (x1 = 1) and distilled water (x2 = 1).
2.2 Apparatus and measuring procedures
Refractive index of pure compounds and all binary systems was measured by Refractometer RM40 by Mettler Toledo. This apparatus yields the refractive index values of liquids within a range from 1.3200 to 1.7000, reproducibility of the refractive index measurement is 1 · 10−4 and accuracy is 5 · 10−4. The temperature range of the apparatus is 273.15–363.15 K, reproducibility of temperature is 0.01 K and accuracy is 0.03 K. The constant temperature is maintained by Peltier thermostat (Kolská et al., 2011, 2016). Refractive index is measured at λ = 589.3 nm (LED as a light source), because this refractive index of materials varies with the wavelength. Therefore we signed it as n589.3. For calibrations of refractometer the redistilled water, dodecane and 2,4-dichlorotoluene (supplied by Mettler Toledo) were used as standards. These compounds covered refractive index within the range sufficient for all measured samples.
All samples were measured five times. For new measurement the new sample has been placed in a measuring cell due to volatility and possible changes in concentration during longer measurement and increasing temperature. For all measurements an average value of refractive index (n589.3) and an average error (AE) were calculated by Eqs. (1) and (2) (Peters, 2001), respectively:
Before measurement of new samples the measuring cell was cleaned by distilled water, by acetone and dried. Experimental data of refractive index (n589.3) were correlated by the following Eq. (3) (Valha, 2013) to describe a dependence of refractive index as a function of PEG mole fraction x1:
Dependence of refractive index (n589.3) on molecular weight of PEG (M) was described by Eq. (4) (Valha, 2013):
Colloidal samples of AuNPs in binary systems glycerin-water were prepared by sputtering from Au target into PEG of individual molecular weight followed by mixing this dispersion with water described in detail previously (Siegel et al., 2012, 2013; Slepička et al., 2015a). Au deposition was carried out in a sputtering device SputterCoater SCD 050 (BAL-TEC) using an Au target (Goodfellow Ltd., purity 99.999%). The sputtering was accomplished at 20 °C, current of 30 mA, voltage of 410–430 V, total argon pressure of 8 Pa, an electrode distance of 50 mm, and deposition time of 300 s. Immediately after deposition of the AuNPs into PEG the mixture was diluted with water in various proportions (Siegel et al., 2012, 2013; Slepička et al., 2015a).
DLS is an analytical method commonly used for determination of the hydrodynamic size, its distribution, and zeta potential of the nanoparticle colloids in a liquid medium. The basis of this method is to measure the fluctuation of the intensity of scattered light from a light source. Gold nanoparticles are extraordinary light diffuser at or near the wavelength of a so-called localized surface plasmon resonance (LSPR). The analyses of the samples were performed with a Zetasizer Ver. 6.32 device, and Malvern software was used for data evaluation. As a light source, a laser with 366 nm wavelength was used. All samples were analyzed after 24 h from the preparation (Slepička et al., 2015a).
UV–vis spectroscopy was used to characterize the optical properties of the samples. Absorbance was measured in a 10 mm cell (Hellma Analytics cell, Quartz SUPRASIL, Type No. 100-QS) using a Perkin-Elmer Lambda 25 spectrophotometer. Spectra were recorded at room temperature in the range 200–800 nm (Slepička et al., 2015a).
TEM analysis of the samples was performed on a JEOL JEM-1010 transmission electron microscope. The images were taken with SIS MegaView III digital camera (Soft Imaging Systems, acceleration voltage 80 kV) and analysis was performed by AnalySIS Software 2.0 (Slepička et al., 2015a).
3 Results and discussion
Obtained results are presented in Figs. 1–4 and Tables 1–6. Fig. 1 represent dependence of average refractive index (n589.3) for binary systems water-PEG of molecular weights 200 g mol−1 (left) and 600 g mol−1 (right) on the mole fraction of PEG (x1) in temperature range 283.15–363.15 K as a representative of the lowest and the highest molecular weights measured in all concentration and temperature range. Empty points represent experimental data obtained in this work. The curves in Fig. 1 are correlations of these experimental data by Eq. (3). From Fig. 1 it is clear that the refractive index increases with increasing mole fraction of PEG. It is evident that the dependence is not linear, which proves a strongly non-ideal behavior of this system. This non-ideal behavior of system water-PEG can be caused by the following four effects (Chen et al., 2013; Moosavi et al., 2013; Rajulu and Sab, 1998): (i) approaches during solving, which is for these systems accompanied with volume and enthalpy changes (excess molar volume and excess molar enthalpy); (ii) hygroscopicity of PEG; (iii) interactions between molecules of PEG and water, especially due to the strong H-bond and (iv) molecules of water are “much” smaller in comparison with molecules of PEG because the polymer chains do not stay as linear and strain but it is flexible and creates the “ball” and the water molecules can be placed in cavity in PEG structure (Chen et al., 2013; Moosavi et al., 2013; Rajulu and Sab, 1998). It is also clear from Fig. 1, that the curve for a dependence of refractive index on the mole fraction of PEG (x1) varies for individual molecular weight of PEG, the higher molecular PEG weight, and the steeper curve. Refractive index (n589.3) of individual samples decreases with increasing temperature. The curve for system water-PEG 600 for T = 283.15 K does not cover all the concentration ranges due to solidification of samples of higher mole fraction of PEG in measuring cell.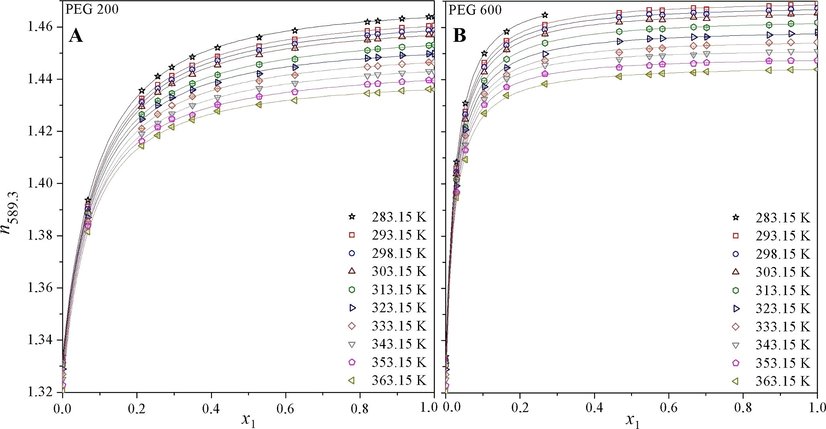
Dependence of refractive index (n589.3) of system water-PEG of molecular weight (A) 200 g mol−1 (PEG 200) and (B) 600 g mol−1 (PEG 600) on concentration (x1 means the mole fraction of PEG) in temperature range of 283.15–363.15 K. Individual points are experimental data, and the curves present correlation obtained by Eq. (3).

Dependence of refractive index (n589.3) of systems water-PEG of molecular weights 200 g mol−1 (PEG 200), 300 g mol−1 (PEG 300), 400 g mol−1 (PEG 400), 600 g mol−1 (PEG 600) and 1000 g mol−1 (PEG 1000) on concentration (x1 means the mole fraction of PEG) at temperature 298.15 K. Individual points are experimental data, and the lines present curve obtained by Eq. (3).
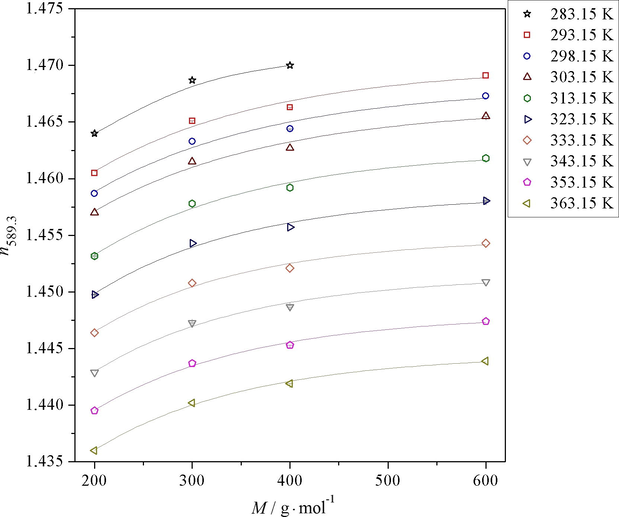
Dependence of refractive index (n589.3) of systems water-PEG of molecular weight 200 g mol−1 (PEG 200), 300 g mol−1 (PEG 300), 400 g mol−1 (PEG 400) and 600 g·mol−1 (PEG 600) on molecular weight of PEG (M) in temperature range of 283.15–363.15 K. Individual points are experimental data, and the lines present curve obtained by Eq. (4).
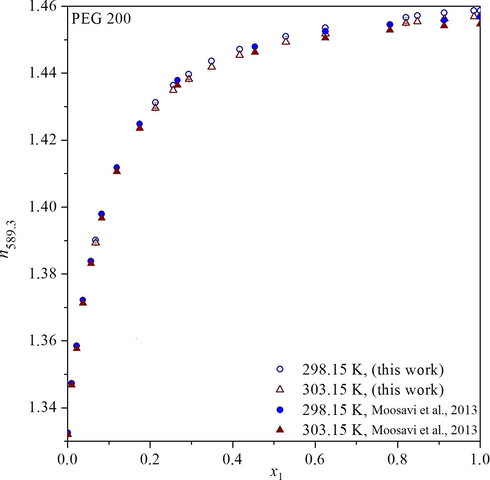
Comparison of refractive index (n589.3) of system water-PEG of molecular weight 200 g mol−1 for T = 298.15 and 303.15 K. Empty symbols are dated from this work, and full symbols are previously published data (Moosavi et al., 2013).
T/K
A
STD
B
STD
C
STD
D
STD
R2
283.15
1.4696
0.0005
0.0072
0.0004
0.1462
0.0076
1.5307
0.0632
0.99995
293.15
1.4660
0.0005
0.0071
0.0003
0.1480
0.0074
1.5355
0.0611
0.99995
298.15
1.4641
0.0005
0.0069
0.0004
0.1504
0.0086
1.5547
0.0701
0.99994
303.15
1.4626
0.0005
0.0071
0.0004
0.1439
0.0075
1.5023
0.0617
0.99995
313.15
1.4599
0.0005
0.0081
0.0004
0.1141
0.0049
1.2794
0.0432
0.99996
323.15
1.4553
0.0009
0.0068
0.0007
0.1201
0.0113
1.3822
0.1011
0.99981
333.15
1.4524
0.0006
0.0070
0.0005
0.1118
0.0071
1.3188
0.0646
0.99991
343.15
1.4497
0.0003
0.0075
0.0002
0.0968
0.0028
1.2026
0.0262
0.99998
353.15
1.4469
0.0010
0.0079
0.0008
0.0786
0.0071
1.0833
0.0729
0.99982
363.15
1.4418
0.0004
0.0063
0.0003
0.0863
0.0041
1.2052
0.0424
0.99995
T/K
A
STD
B
STD
C
STD
D
STD
R2
283.15
1.4721
0.0007
0.0044
0.0005
0.0844
0.0064
1.3992
0.0803
0.99985
293.15
1.4685
0.0007
0.0043
0.0004
0.0849
0.0065
1.3996
0.0804
0.99985
298.15
1.4668
0.0006
0.0043
0.0004
0.0840
0.0060
1.3896
0.0742
0.99987
303.15
1.4649
0.0006
0.0042
0.0004
0.0846
0.0063
1.4046
0.0783
0.99985
313.15
1.4612
0.0008
0.0042
0.0006
0.0798
0.0077
1.3575
0.0978
0.99975
323.15
1.4572
0.0007
0.0038
0.0005
0.0803
0.0075
1.3918
0.0979
0.99976
333.15
1.4531
0.0005
0.0031
0.0003
0.0843
0.0063
1.4928
0.0836
0.99985
343.15
1.4499
0.0005
0.0033
0.0003
0.0760
0.0052
1.4121
0.0717
0.99987
353.15
1.4458
0.0007
0.0028
0.0004
0.0775
0.0076
1.4814
0.1077
0.99973
363.15
1.4422
0.0006
0.0026
0.0004
0.0631
0.0059
1.3959
0.0957
0.99973
T/K
A
STD
B
STD
C
STD
D
STD
R2
283.15
1.4731
0.0005
0.0031
0.0003
0.0597
0.0035
1.3527
0.0613
0.99989
293.15
1.4694
0.0005
0.0030
0.0003
0.0599
0.0035
1.3511
0.0603
0.99989
298.15
1.4675
0.0005
0.0030
0.0003
0.0609
0.0033
1.3638
0.0567
0.99991
303.15
1.4658
0.0004
0.0031
0.0002
0.0591
0.0026
1.3362
0.0456
0.99994
313.15
1.4622
0.0007
0.0032
0.0004
0.0535
0.0041
1.2720
0.0737
0.99981
323.15
1.4587
0.0011
0.0033
0.0007
0.0498
0.0062
1.2200
0.1143
0.99950
333.15
1.4539
0.0008
0.0023
0.0004
0.0587
0.0064
1.4138
0.1167
0.99964
343.15
1.4498
0.0006
0.0016
0.0003
0.0687
0.0067
1.6384
0.1224
0.99973
353.15
1.4466
0.0004
0.0016
0.0002
0.0648
0.0047
1.5964
0.0882
0.99985
363.15
1.4438
0.0005
0.0022
0.0003
0.0511
0.0040
1.3596
0.0791
0.99981
T/K
A
STD
B
STD
C
STD
D
STD
R2
283.15
1.4717
0.0010
0.0013
0.0003
0.0416
0.0034
1.4743
0.0994
0.99999
293.15
1.4707
0.0003
0.0021
0.0002
0.0340
0.0016
1.2331
0.0410
0.99994
298.15
1.4688
0.0004
0.0021
0.0002
0.0342
0.0020
1.2367
0.0500
0.99991
303.15
1.4672
0.0003
0.0023
0.0002
0.0323
0.0014
1.1890
0.0346
0.99995
313.15
1.4638
0.0002
0.0024
0.0001
0.0306
0.0009
1.1484
0.0227
0.99998
323.15
1.4596
0.0005
0.0021
0.0003
0.0306
0.0026
1.1821
0.0681
0.99982
333.15
1.4557
0.0005
0.0018
0.0003
0.0320
0.0031
1.2415
0.0814
0.99977
343.15
1.4519
0.0003
0.0013
0.0001
0.0362
0.0021
1.3831
0.0566
0.99991
353.15
1.4489
0.0005
0.0017
0.0003
0.0274
0.0027
1.2039
0.0784
0.99977
363.15
1.4458
0.0008
0.0019
0.0005
0.0244
0.0034
1.1251
0.1040
0.99953
T/K
A
STD
B
STD
C
STD
D
STD
R2
283.15
1.4639
0.0107
0.0000
0.0001
0.0531
0.0395
2.9759
2.1838
0.99993
293.15
1.4579
0.0086
0.0000
0.0000
0.0612
0.0447
3.4661
2.4598
0.99995
298.15
1.4639
0.0052
0.0001
0.0002
0.0375
0.0124
2.0659
0.6546
0.99990
303.15
1.4689
0.0106
0.0007
0.0013
0.0263
0.0114
1.4346
0.6251
0.99976
313.15
1.4608
0.0053
0.0003
0.0004
0.0308
0.0087
1.7210
0.4747
0.99991
323.15
1.4572
0.0073
0.0003
0.0006
0.0300
0.0118
1.6957
0.6501
0.99982
333.15
1.4541
0.0081
0.0004
0.0007
0.0280
0.0121
1.6404
0.6909
0.99976
343.15
1.4519
0.0104
0.0004
0.0009
0.0264
0.0146
1.5981
0.8581
0.99959
353.15
1.4591
0.0110
0.0016
0.0022
0.0195
0.0072
1.1292
0.4262
0.99979
363.15
1.4684
0.0072
0.0045
0.0024
0.0147
0.0024
0.8290
0.1449
0.99995
T/K
a
STD
b
STD
c
STD
R2
293.15
1.4699
0.0018
0.0282
0.0106
0.9945
0.0024
0.9837
298.15
1.4682
0.0020
0.0275
0.0110
0.9946
0.0026
0.9806
303.15
1.4664
0.0018
0.0273
0.0099
0.9946
0.0024
0.9840
313.15
1.4625
0.0013
0.0300
0.0098
0.9941
0.0020
0.9891
323.15
1.4586
0.0011
0.0309
0.0098
0.9937
0.0019
0.9909
333.15
1.4548
0.0010
0.0305
0.0104
0.9935
0.0020
0.9903
343.15
1.4514
0.0009
0.0302
0.0087
0.9937
0.0017
0.9927
353.15
1.4480
0.0007
0.0293
0.0062
0.9938
0.0013
0.9959
363.15
1.4445
0.0006
0.0301
0.0052
0.9937
0.0010
0.9974
Tables 1–5 include parameters A, B, C and D of Eq. (3) which enable to calculate refractive index of tested binary systems at any mole fraction of PEG (x1) in temperature range of 283.15–363.15 K. The accuracies of these descriptions are presented by their standard deviation (STD) and determination coefficient R2 for individual temperatures. Due to the solidification of system water-PEG 1000 in the measuring cell only parameters A, B, C and D of Eq. (3) are presented for interpolation of refractive index (n589.3) in a very narrow concentration range. All these results confirmed the trend that refractive index increases with increasing concentration of PEG and decreases with increasing temperature.
Study of dependence of refractive index (n589.3) on molecular weight of PEG (M) was also performed. Fig. 2 shows dependence of refractive index of systems water-PEG of molecular weights of 200 g mol−1 (PEG 200), 300 g mol−1 (PEG 300), 400 g mol−1 (PEG 400), 600 g mol−1 (PEG 600) and 1000 g mol−1 (PEG 1000) on mole fraction of PEG (x1) at temperature 298.15 K. Individual points are experimental data, and the line presents curve obtained by 3-parameter Eq. (4) (x1 means the mole fraction of PEG). Fig. 2 clearly shows the strong dependence of refractive index on molecular weight of PEG. Refractive index increases with increasing PEG molecular weight. From Fig. 3 it is clear that dependence is not linear. Parameters a, b and c of Eq. (4) for individual temperatures are summarized in Table 6.
We have also compared experimental data on refractive index obtained in this work with data presented earlier (Moosavi et al., 2013). Fig. 4 shows a very good agreement of the data (empty points) with those published previously by other authors (Moosavi et al., 2013, full points).
Obtained data on refractive index have been employed for determination of size and zeta potential AuNPs dispersed in systems water-PEG by DLS method. When we have inputted the correct and accurate experimental data on refractive index (obtained in this work), we obtain the following data on AuNPs size, d (nm) and zeta potential, ζ (mV): for water-PEG 200: d1 (first fraction) = 0.86 ± 0.04 nm and d2 (second fraction) = 10.07 ± 0.21 nm, ζ1 (first fraction) = −10.84 ± 0.56 mV and ζ2 (second fraction) = −54.40 ± 1.38 mV; for water-PEG 300: d = 13.62 ± 5.67 nm, ζ1 (first fraction) = −11.35 ± 1.88 mV and ζ2 (second fraction) = −55.57 ± 9.38 mV; for water-PEG 400: d1 (first fraction) = 0.98 ± 0.28 nm and d2 (second fraction) = 7.97 ± 2.92 nm, ζ1 (first fraction) = −15.61 ± 5.14 mV and ζ2 (second fraction) = −42.40 ± 3.26 mV. These data correspond with data presented earlier (Slepička et al., 2015a). When the correct and accurate data on refractive index are not input, values for zeta potential are also incorrect and inaccurate, they vary from correct data and have a higher error: for water-PEG 200: ζ = −9.65 ± 6.99 mV; for water-PEG 300: ζ = −6.64 ± 1.28 mV and for water-PEG 400: ζ = −10.36 ± 10.44 mV. These data do not correspond with data presented earlier (Slepička et al., 2015a). Therefore, it is necessary to operate only with correct and accurate input data for determination of properties of AuNPs dispersions.
As stated above, the physico-chemical behavior of water-PEG solutions has a significant influence on the consequent properties of metal nanoparticles (NPs) solutions (Slepička et al., 2015a) and accurate input data are very important for the solution preparation. Therefore after detailed physico-chemical analysis of water-PEG solution we have continued with particular application, the preparation of noble metal-PEG-water solutions and their optical and morphological analysis. For the series of experiments the system of water-PEG 400 was chosen and the direct sputtering into PEG with consequent dilution into water with different ratio water-PEG was applied. The colloidal solutions of prepared gold NPs (AuNPs) showed a significant absorption peak maximum in UV–vis spectra. Noble metal nanoparticle solutions may have a significant application in tissue engineering (Slepička et al., 2015b; Kim et al., 2016; Neumann et al., 2016), as promoters of cell growth (Slepičková Kasálková et al., 2012) or as antibacterial substrates for inhibition of bacteria growth (Slepička et al., 2016; Siegel et al., 2013).
For all prepared samples the changes of absorption peaks (position and size) were observed and analyzed (see Fig. 5). Particle size distribution was increased as it is obvious from the increasing width of the peak. The height of the peak depends on the solution concentration and the characteristics of AuNPs (Slepička et al., 2015a). The optical properties of AuNPs in water-PEG solutions determined with UV spectroscopy for different PEG (200, 400 and 600 g mol−1) are introduced in Fig. 5. The colloidal solutions of prepared AuNPs showed the significant absorption peak maxima in UV–vis spectra by ca 530 nm. The height of the peak depends on the solution concentration (Slepička et al., 2015a). It was proved that the water-PEG concentration affects the size of NPs immediately after preparation (during preparation resp. mixing) significantly, even at the beginning the solutions exhibit similar UV–vis absorbances (Slepička et al., 2015a). As it can be seen from Fig. 5, peak positions for solutions with ratio PEG:H2O = 1:9 remain stable, and the value of absorbance increases as expected with increasing concentration of AuNPs. The AuNPs concentration increases with increasing exposure (sputtering) time. In this case we have also tried to find the correlation between molecular weights of PEG and sizes of nanoparticles. But our previous and also current results show there is no effect of molecular weight of PEG on nanoparticle size. As we can see the same size of nanoparticles in system water-PEG independently of molecular weight of PEG (Slepička et al., 2015a) has been prepared. It can be caused by two effects: (i) firstly, PEG serves as a steric stabilizer of nanoparticles (Zhang et al., 2016) and its chain length does not play role on nanoparticle size because this chain does not stay straight but they create the ball or clusters around NPs and coated them and these clusters (coatings) seem to be independent on molecular weight of PEG; (ii) the second effect is a concentration of PEG in water which play much important role, because molecules of water play role for electrostatic stabilization of nanoparticles. When water is not present, the colloidal samples of nanoparticles (in only PEG) have got a violet color which presents much more particle size (Slepička et al., 2015a).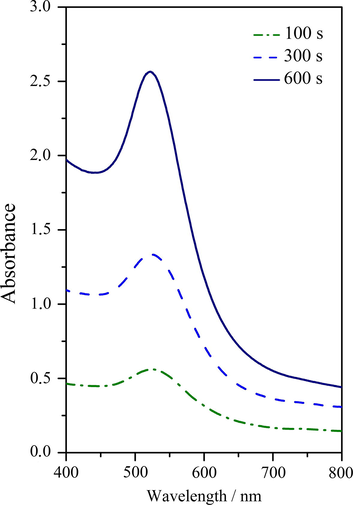
The UV–vis absorption spectra for AuNPs dispersion in water-PEG of molecular weight 400 g mol−1 at a ratio of 1:9. Sputtering times varied in the interval 100–600 s and the samples were prepared at 30 mA.
The NPs size may be altered by changing of input parameters of plasma device as has been demonstrated earlier (Hatakeyama et al., 2011; Kaneko et al., 2014). Hatakeyama et al., 2011 reported that the working distance does not affect the size and size distribution of AuNPs generated in the capture medium (Hatakeyama et al., 2011). Different approaches for noble metal nanocluster deposition were applied as discussed earlier (Slepička et al., 2015a). Selected TEM images of the NPs prepared under different conditions are shown in Fig. 6. We have chosen two different ratios of water-PEG (1:1, see Fig. 6A and 1:9, Fig. 6B). It is obvious that water-PEG ratio has a significant influence of stability of AuNPs-water-PEG solution and the number of larger agglomerates. These agglomerates of AuNPs larger than 100 nm can be seen in Fig. 6A (ratio 1:1). In Fig. 6B, on the contrary, AuNPs have a spherical shape with uniform distribution. As it is clear from Fig. 6, size of AuNPs prepared in system water-PEG 400 determined by DLS (discussed above) and TEM is in a very good agreement.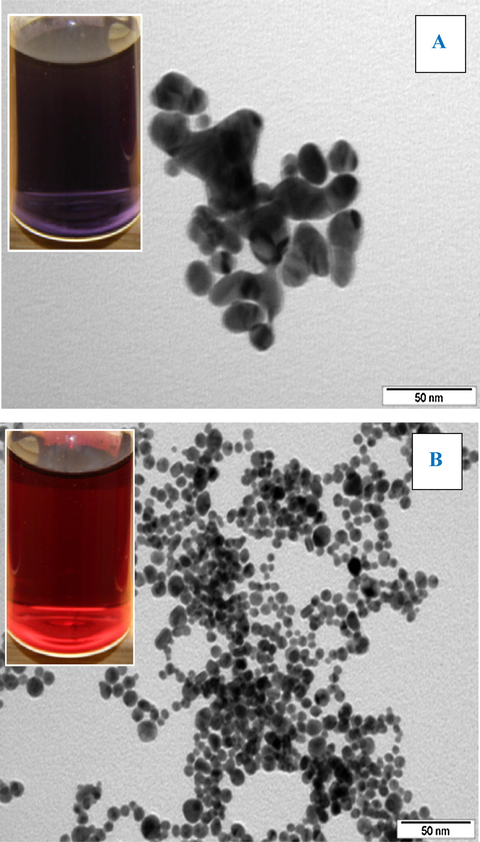
TEM images of AuNPs dispersion in the water-PEG of molecular weight 400 g mol−1 obtained by sputtering, prepared at 30 mA and 300 s with ratio of water-PEG: (A) −1:1 and (B) −1:9.
4 Conclusions
Refractive index of several systems of water-PEG of different molecular weights (M = 200, 300, 400, 600, 1000 g mol−1) was measured. Experiments were performed in temperature range from 298.15 to 363.15 K at atmospheric pressure and at all mole fraction range except PEG of M = 1000 g mol−1. Refractive index increases with increasing mole fraction and with increasing molecular weight of PEG. Refractive index decreases with increasing temperature. Data have been also described by (i) four parameters’ relationship for dependence of refractive index on mole fraction of PEG and (ii) three parameters’ relationship for dependence on molecular weight of PEG. Experimental data obtained in this work were compared with data published previously with a very good agreement. Binary systems of water-PEG show non-ideal behavior. The dependence of refractive index on molar fraction is not linear. This non-ideal behavior of this system can be caused by approaches during solving, by interactions between molecules of water and PEG, especially due to the strong H-bond. Obtained data on refractive index served as an input data for subsequent study of the colloidal systems of AuNPs in dispersion surrounding inclusive water and PEG. It was confirmed that only correct and accurate experimental data on refractive index can yield the correct determination of size and zeta potential of AuNPs in dispersion. The colloidal solutions of prepared AuNPs showed a significant absorption peak maximum in UV–vis spectra by ca 530 nm. The height of the peak depended on the solution concentration and ratio of water-PEG. The size of AuNPs determined by DLS method was confirmed by TEM measurement with very good agreement and for water-PEG ratio 1:9 did not exceed 11 nm. Nanoparticle size is independent of molecular weight of PEG but it is strongly depended on PEG concentration.
Acknowledgment
This work was supported by Grant Agency of Czech Republic under project no. 13-06609S and Grant Agency of Health Ministry no. 15-33018A.
References
- Partition of Cell Particles and Macromolecules. New York: John Wiley and Sons; 1986.
- Excess molar volumes and excess molar heat capacities of (polyethylene glycols + water) at temperatures between T = 278 K and T = 328 K. J. Chem. Thermodyn.. 1999;31:289-300.
- [Google Scholar]
- Effect of an anionic surfactant upon the viscosity of poly(ethylene glycol) in dilute solution. e-Polymers. 2013;002:1-5.
- [Google Scholar]
- Densities and surface tensions of trimethylbenzene + dimethyl carbonate or + diethyl carbonate at 298.15 and 313.15 K. J. Chem. Eng. Data. 2006;51:1464-1468.
- [Google Scholar]
- Ultrasonic speeds and volumetric properties of binary mixtures of water with poly(ethylene glycol)s at 298.15 K. J. Chem. Soc., Faraday Trans.. 1997;93:1943-1949.
- [Google Scholar]
- Bioseparation: design and engineering of partitioning systems. Bio-Technology. 1989;7:686-688.
- [Google Scholar]
- Effects of sputtering conditions on formation of gold nanoparticles in sputter deposition technique. RSC Adv.. 2011;1:1815-1821.
- [Google Scholar]
- Nonideal compressibility in poly(ethylene oxide) water solutions induced by H-bond interactions. J. Mol. Struct.. 1994;322:337-343.
- [Google Scholar]
- High-pressure acoustic properties of glycerol studied by Brillouin spectroscopy. Phys. B: Condens. Mat.. 2015;478:27-30.
- [Google Scholar]
- Kaneko, T., Takahashi, S., Hatakeyama, R., Plasma Process on Ionic Liquid Substrate for Morphology Controlled Nanoparticles, In: Ionic Liquids - New Aspects for the Future, InTech, 2014, pp. 617–632. http://dx.doi.org/10.5772/52095.
- Highly conductive and hydrated PEG-based hydrogels for the potential application of a tissue engineering scaffold. React. Funct. Polym.. 2016;109:15-22.
- [Google Scholar]
- Volumetric behavior of the binary systems benzene–cyclohexane and benzene–2,2,4-trimethyl-pentane at temperatures 293.15–323.15 K. Fluid Phase Equilibr.. 2011;303:157-161.
- [Google Scholar]
- J. Mol. Liq.. 2016;218:363-372.
- Engineering Processes for Bioseparations. Woburn: Butterworth-Heinemann Ltd; 1994.
- Sound-velocity and hydration phenomena in aqueous polymeric solutions. Mol. Phys.. 1993;78:421-435.
- [Google Scholar]
- Phase-behavior of polyoxyethylene surfactants with water - mesophase structures and partial miscibility (cloud points) J. Chem. Soc. Faraday Trans. I. 1983;79:975-1000.
- [Google Scholar]
- Investigation on some thermophysical properties of poly(ethylene glycol) binary mixtures at different temperatures. J. Chem. Thermodyn.. 2013;58:340-350.
- [Google Scholar]
- Densities and excess volumes in aqueous poly(ethylene glycol) solutions. J. Chem. Eng. Data. 1991;36:214-217.
- [Google Scholar]
- Nondestructive evaluation of a new hydrolytically degradable and photo-clickable PEG hydrogel for cartilage tissue engineering. Acta Biomater.. 2016;39:1-11.
- [Google Scholar]
- Peters, C.A., 2001. Statistics for Analysis of Experimental Data. In: Environmental Engineering Processes Laboratory Manual (Ed. Powers, S.E.). AEESP, Champaign, IL. <https://www.princeton.edu/∼cap/AEESP_Statchap_Peters.pdf> (30.6.2012).
- Refractometric studies in water/polyethylene glycol-300 mixtures. Eur. Polym. J.. 1998;34:31-32.
- [Google Scholar]
- Handbook of Pharmaceutical Excipients. Billingham: Pharmaceutical Press and American Pharmacists Association; 2006.
- Volume and compressibility changes for short poly(ethylene glycol)±water system at various temperatures. Colloid Polym. Sci.. 1998;276:643-647.
- [Google Scholar]
- Progressive approach for metal nanoparticle synthesis. Mater. Lett.. 2012;89:47-50.
- [Google Scholar]
- Antibacterial properties of green-synthesized noble metal nanoparticles. Mater. Lett.. 2013;113:59-63.
- [Google Scholar]
- Density, electrical conductivity, kinematic viscosity, and refractive index of binary mixtures containing poly(ethylene glycol) 4000, lithium sulfate, and water at different temperatures. J. Chem. Eng. Data. 2007;52:1567-1570.
- [Google Scholar]
- Stabilization of sputtered gold and silver nanoparticles in PEG colloid solutions. J. Nanopart. Res.. 2015;17:11-25.
- [Google Scholar]
- Nano-structured and functionalized surfaces for cytocompatibility improvement and bactericidal action. Biotechnol. Adv.. 2015;33:1120-1129.
- [Google Scholar]
- Antibacterial properties of modified biodegradable PHB non-woven fabric. Mater. Sci. Eng., C. 2016;65:364-368.
- [Google Scholar]
- Cell adhesion and proliferation on polyethylene grafted with Au nanoparticles. Nucl. Instrum. Method B. 2012;272:391-395.
- [Google Scholar]
- Polymer Applications for Biotechnology. Englewood Cliffs: Prentice Hall; 1992.
- Plasma-modified and polyethylene glycol-grafted polymers for potential tissue engineering applications. J. Nanosci. Nanotechnol.. 2012;12:6665-6671.
- [Google Scholar]
- Densities and refractive indices of imidazolium-and phosphonium-based ionic liquids: Effect of temperature, alkyl chain length, and anion. J. Chem. Thermodyn.. 2009;41:790-798.
- [Google Scholar]
- Valha, P., 2013. Determination of the refractive index of liquid binary mixtures of polyethylene glycol-water in the temperature range. Diploma Thesis, J. E. Purkyně University, Ústí nad Labem, Czech Republic, pp. 1-61.
- Experimental and computational study on viscosity and optical dielectric constant of solutions of poly (ethylene glycol) 200. J. Mol. Liq.. 2011;160:22-29.
- [Google Scholar]
- Vapor-liquid equilibria, density, speed of sound, and viscosity for the system poly(ethylene glycol) 400 + ethanol at different temperatures. J. Chem. Eng. Data. 2008;53:785-793.
- [Google Scholar]
- Densities and viscosities for binary mixtures of poly(ethylene glycol) 400 + dimethyl sulfoxide and poly(ethylene glycol) 600 + water at different temperatures. J. Chem. Eng. Data. 2011;56:3083-3088.
- [Google Scholar]
- Excess molar volumes and viscosities of poly(ethylene glycol) 300 + water at different temperatures. Fluid Phase Equilibr.. 2012;313:7-10.
- [Google Scholar]
- Synthesis and characterization of PEGylated bolaamphiphiles with enhanced retention in liposomes. J. Colloid. Interface Sci.. 2016;482:19-26.
- [Google Scholar]
- Micelle clusters of octylhydroxyoligo (oxyethylenes) J. Phys. Chem.. 1983;87:856-862.
- [Google Scholar]


