

Translate this page into:
Robust curcumin-mustard oil emulsions for pro to anti-oxidant modulation of graphene oxide
⁎Corresponding authors. parthmalik1986@gmail.com (Parth Malik), mansingh50@hotmail.com (Man Singh)
-
Received: ,
Accepted: ,
This article was originally published by Elsevier and was migrated to Scientific Scholar after the change of Publisher.
Peer review under responsibility of King Saud University.
Abstract
The compositional flexibility of emulsions, via surfactant and additive choice, has been the major reason for their recognition as tuneable delivery sources for a variety of drugs. In particular, the kinetically stable nanoemulsions (NE) are preferred to minimize the toxicity extents of several poorly hydrophobic drugs through variation in their delivered extents. Inspired by these specialties, we have optimized our curcumin (curc) loaded sodium dodecylsulpahte (SDS) and dodecyl trimethylammonium bromide (DTAB) stabilized mustard oil microemulsions (ME) which catalyzed the pro-oxidant (with ethanol only) to antioxidant graphene oxide (GO) structural expression. The GO was synthesized using wet chemical approach, using ubiquitous graphite flakes as raw material. GO was loaded into 1:1 mixtures of (separately made) SDS and DTAB curc loaded formulations (CLFs). Henceforth, the resultant formulation contained 60% (1:1 SDS and DTAB) CLF mixture and ethanol dispersed GO (@ 1 mg/mL) as the other component. Compared to an insignificant (∼47%) free state (while being dispersed in ethanol) DPPH free radical scavenging, the GO dispersed in CLFs enabled (62.47–100.96)% increments in DPPH• scavenging, with 94.45% as maximum neutralization extent. The (493.57–3154.95)% particle size increments and (40.64–92.70)% PDI decrements for GO supplemented formulation over SDS and DTAB CLF mixtures, have inferred a wider curc distribution, through the larger GO surface area (SA) and its augmented oxygen enhanced chemical controls. In support, the physicochemical variations, characterized by (1.77–21.23)% γ decrements, (63.56–98.08%) and (68.90–163.22)% η and σ increments, have complemented the dispersion enhancing GO activities. Considering the bioactive nature of curc, these observations predict a prevalence of native curc structure or its enhanced non-covalent interaction controls with GO. Edible nature of mustard oil alongwith frequent inclusion of SDS and DTAB in routine gadgets, propel our formulations as robust media for attaining desired structural activities of functionalized GO derivatives.
Keywords
Curcumin
Nanoemulsions
Microemulsions
Graphene
Graphene oxide
Free radical scavenging

1 Introduction
Accountable to natural origin and significant immunomodulatory potentials of multifunctional nature, secondary metabolites of plant domain have been the consistent focus of scientific interest for the past several years (Jantan et al., 2015; Seca and Pinto, 2018; Newman and Cragg, 2016). Most of the bioactive compounds in this class are polyphenolic, manifested in their substantial antioxidant expressions (Tungmunnithum et al., 2018; Altemini et al., 2017). However, the inherent hydrophobicity of these bioactive species has been an issue of persistent concern regarding their long term usage suitability. Nevertheless, encouraged by their natural origins and reliable expectations of preventing the raising systemic toxicities, these bioactive plant fractions are being delivered through several alternative routes (Katiyar et al., 2012; Pan et al., 2013; Atanasov et al., 2015). The unanimous aim of such attempts is to maximize the structural stability of encapsulated bioactive(s) so that they reach their respective target sites in an unaltered manner. Apart from this, the delivery through modified carriers often overcomes the redundant risks of elevated systemic toxicities caused by their conventional oral intake. This is due to the fact that conventional intake route is much more prudent to chemical changes owing to which the delivered drug is often lost to a major extent before reaching its target site and consequently, patients are compelled to consume larger dosages, making them vulnerable to toxic side-effects (Liu et al., 2016; Florence and Jani, 1994).
A highly documented member of this group, curc belongs to ginger family (sp. Zingiberaceae) and is the major polyphenolic fraction (∼77%) of turmeric (Lee et al., 2013; Priyadarsini, 2014). Intensive research on curc has revealed its multiple interaction activities, making it feasible to initiate manifold biological activities at the same instant (Aggarwal et al., 2003; Chainani-Wu, 2003). From the healthcare viewpoint, this natural polyphenol is one of most well known traditional remedies stemming from its extraordinary antioxidant, anti-inflammatory, anticancer and antidiabetic characteristics (Chainani-Wu, 2003; Sharma, 1976). Multiple studies exploring the structure-functional correlations of curc have established its pH dependent chemical activities, leading to its concentration and medium dependent prooxidant or antioxidant responses (Kharat et al., 2017; Malik and Mukherjee, 2014). Interesting aspect of curc chemistry is its non-toxicity (reported in several animal models, such as rats, guineapigs, rabbits etc.) even when consumed at as high as 12 g/kg blood levels (Anand et al., 2008; Kharat et al., 2018). Studies have elucidated that even if consumed at higher (more than recommended extents of traditional medicines) quantities rarely cause any serious, with maximum aftermaths accounting for minor level diarrhoea and it is often left unabsorbed in intestinal locations, ultimately being gradually excreted (Kharat et al., 2018; Anand et al., 2007). Considering the routine food inclusion of turmeric as well its time immemorial aesthetic beliefs, research investigations towards improving curc physiological expression have recently been on an exponential rise.
Toxicity and dosage control have emerged as most critical factors affecting the accuracy of drug delivery approaches owing to which co-delivery of low bioavailability drugs with biocompatible polymers and surfactant like structurally dynamic moieties is being attempted with significant interest (Patra et al., 2018; Zhou et al., 2018). Amongst many such options, surface active nature of graphene (conferred by the archetypal monolayer framework of carbon atoms) has aided drug delivery through controlled self interactions and modulating gradual release of encapsulated drugs (Zhou et al., 2018; Nicolosi et al., 2013). Tuneable features of graphene based materials (having extraordinary structural dynamicity noted in pristine graphene, GO, reduced GO, graphene nanoribbons, graphene nanoplatelets, three dimensional graphene foam and several others) incur manifold interesting possibilities in medical interventions, where its high SA, exceptional electronic properties and high mechanical strength offer a boon for drug delivery (Zhu et al., 2010; Lee et al., 2008). Owing to the hydrophobicity restricted biomedical usage, graphene is frequently converted to GO which is hydrophilic due to surplus oxygen-containing functionalities. Research on GO have revealed a key role of its (HO—C⚌O) functionality along the edges with hydroxyl (—OH) and epoxide (C—O—C) on the basal planes in close proximity to each other (Stankovich et al., 2007; Sun et al., 2011). Similarly, extensive therapeutic response of GO has also been stupendously documented, particularly towards lung and breast tumours. Despite this, the synthetic preparation route of GO makes it vulnerable towards instantaneous toxic expression, arising substantially from its deleterious effect on normal cells (Yin et al., 2015; Tabish, 2018). So, strategies aimed at co-delivery of GO with stoichiometrically adequate contents of non-toxic but low bioavailability drugs could be materialized to attain their target specific expressions. The high SA of GO aided with the rapidity of functionalization incurs well for its pro-surfactant like activities, propelling interest towards exploitation in delivering low bioavailability drugs, amicably resolving the need of toxic synthetic surfactants.
Utility of emulsions as efficient carriers of food ingredients (in particular nutraceuticals and others) is witnessing an overwhelming rise, by virtue of the non-covalent interacting forces in the emulsions. Surfactants form the major constituents of emulsions because of their abilities to control the interactions of hydrophilic and hydrophobic phases. Typically, two regimes of emulsions are recognized on the basis of dispersed phase in dispersion medium droplet sizes, namely, micro and nano. With consistent conflicts in defining size limits for each specific type, there remains an ambiguity in clear definition of these systems (McClements, 2012; Mason et al., 2006). Nevertheless, the unquestionable fact of ME spontaneous formation have always been an edge compared to NE, that always require some external energy (as shear) to homogenize the hydrophobic and hydrophilic phases (Mason et al., 2006). Interestingly, a less discussed prospect of NE is their thermodynamic instability due to which these systems always have inherent high energy content than ME. The ME on the other hand, is comprised of low energy facilitated molecular alignments, evolving a dominant role of self-assembly in these systems (Han et al., 2018). These characteristics imply that if ME are made with supposedly <200 nm particle diameters, the possibility of obtaining synergistic molecular expressions are quite ample. This is because the self-assembly interactions are driven by weaker non-covalent controls and therefore can self-adjust according to operational temperature and pH. So, if ME of low sizes are made after a thorough consideration of injurious organ or tissue temperature, chances of thermodynamic and kinetic stability of dispersed phase distribution could be manifolded (Anton and Vandamme, 2011). The simultaneous attainments of thermodynamic and kinetic stability is facilitated through sustained intra and inter molecular activities making way for Boltzmann energy conferred discrete energy domains that are maintained in constant molecular motions via intramolecular multiple force theory (IMMFT) (Sari et al., 2013).
Keeping in mind above mentioned curc and GO aspects, the present study describes the prooxidant to antioxidant transformation of GO in 1:1 mixtures of SDS and DTAB stabilized CLFs, whereby the (62.47–100.96)% improvements in DPPH free radical scavenging activities (FRSA) were noted. The combined SDS and DTAB activities improved the curc dispersion with either of them, with presumably higher improvements in DTAB formulations. The inclusion of 40% (v/v) GO further improved the simultaneous SDS and DTAB activities, via (1.77–21.23)% γ decrements, (63.56–98.08%), (68.90–163.22)% η and σ increments, alongside the (62.47–100.96)% PDI decrements and (40.64–92.70)%, (6.69–76.31)% GO and curc FRSA increments.
2 Experimental
2.1 Experimental section
2.1.1 Materials
SDS, DTAB, curc and glycerol were purchased from Sigma Aldrich (St. Louis, MO, USA). Bangalore, India) while absolute alcohol was procured from Scvuksmandli Ltd. India. Fresh and fit to use cooking grade mustard oil was purchased from the Govt. certified and licensed shop. GO was synthesized in the laboratory using the modified Hummer’s method. Concentrated sulphuric acid (95–98%), phosphoric acid (>85 wt% in aqueous) and hydrogen chloride, used for GO preparation were procured from Sigma-Aldrich while 30% hydrogen peroxide and potassium permanganate were provided by S.D Fine chemicals and Rankem (Maktedar et al., 2016). The procured chemicals were of analytical grade and were used as such, without any further purification. All solutions were made in Milli-Q water (Millipore SAS 67/20 Mosheim) of 10−7 S cm−1 conductance. Glassware was cleaned and dried in accordance with established standards (checked using anhydrous CuSO4). To ensure thorough cleaning, a bit of CuSO4 was spread inside the flasks, beakers and other containers which developed no colour change due to an absolute darkness.
2.2 Curc solubility optimization in oil
Varying curc quantities (0.5–2.0 mg) were mixed in 5 mL oil (heated to ∼343.15 K), via 45 min of magnetic stirring at 1000 rpm, during which 1.5 mg curc was thoroughly solubilized. The heating to ∼343.15 K was done to maximize curc solubility, in agreement with earlier studies. Melting point of 456.15 K ensured no damage to curc structure in this process (Sari et al., 2013). The efficiency of mixing was ascertained through visual inspection and ρ measurements for oil and oil-curc mixture at (298.15, 303.15 and 308.15) K. Fig. 1 depicts the snapshots of mustard oil (a) and oil-mixed curc (b), where slightly concave meniscus is noted for oil-curc mixture. Since both oil and oil-curc mixture were taken in high quality, well-cleaned and dried Borosil made sample vials, so this difference in meniscus is due to interactions of oil triglyceride and curc. The pulling down of curc (having fragmented pi-conjugation) by the oil molecules disrupts the phobic-phobic interactions of oil molecules in the bulk with proportionate development of philic-phobic forces (Fig. 1(c)). Such a scenario demarcates the progressive shifts in interaction regime just immediately after curc addition to oil, with surface oil molecules wanting come in contact with bulk counterparts but added curc holds the oil molecules in the bulk with different IMFs. This is so as curc molecules developed delocalized states alongwith active —CH2- group and the fragmented π-conjugation. Therefore, now the downfall is generated and hence the ρ for oil-curc were also lower than for oil, with the gradual weakening of stronger phobic-phobic oil IMFs.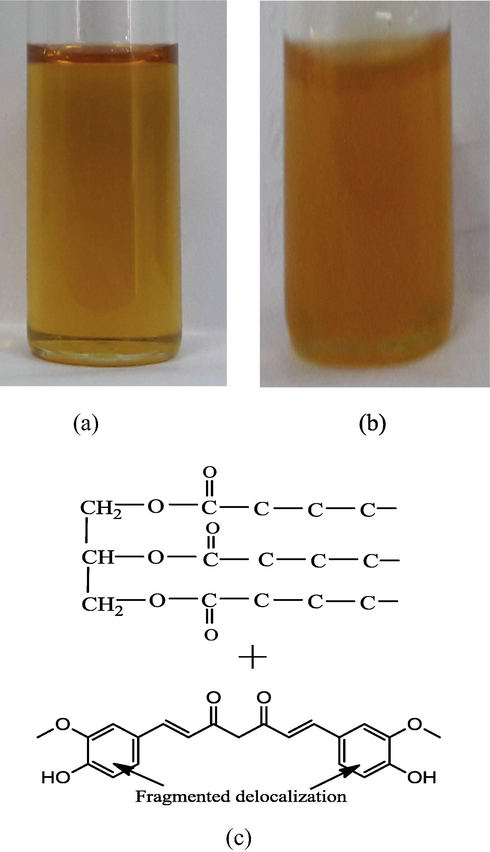
Snapshots of mustard oil in (a) neat and (b) curc mixed configurations. The denser physical appearance confirms curc mixing in stage (b) contrary to blank oil state. The depiction of oil triglyceride and curc interactions (c) is responsible for concave meniscus of oil-curc mixture contrary to oil.
2.3 Preparation of curc loaded nanoemulsions (CLNs) and combined samples
The 0.027, 0.054, 0.081, 0.108 and 0.135 (w/v%) oil-curc mixture was separately mixed with (2 mmol·kg−1 aq SDS or DTAB + 1.22 mol·L−1 ethanol + 0.021 mol·L−1 glycerol) comprising solvent phase, in a 100 mL round bottomed flask (RBF). The total volume was made up to 35 mL using 2 mmol·kg−1 aq SDS and 2 mmol·kg−1 aq DTAB, separately for SDS and DTAB stabilized CLFs respectively. Resulting mixture was subjected to 2 h magnetic stirring (@ 650 rpm) at room temperature (RT) and normal atmospheric pressure, before collecting each formulation in a 50 mL volumetric flask. For combined samples, 1.5 mL of SDS and DTAB CLNs and 2 mL of ethanol dispersed GO were mixed together in a 10 mL volumetric flask, via magnetic stirring at 350 rpm for 30 min. Prior to this mixing, the GO-ethanol mixture was sonicated for 3 min, providing a uniform dispersion.
2.4 Synthesis of GO
Easily available, cheapest graphite flakes (GF) were used as raw material for wet chemical GO synthesis. The GF were oxidized in the presence of 9:1 concentrated H2SO4/H3PO4 mixture, housed in a 500 mL RBF containing (1.5 and 9 g) GF and KMnO4 respectively. The reaction contents yielded an exothermic product within (35–40)°C which was cooled till RT attainment. Subsequently, the RBF was heated to 50 °C in an oil bath before being put on a magnetic stirrer till 12 h. After 12 h, the reaction mixture was cooled at RT using ∼200 mL ice-cold water having 30% H2O2, till the termination of oxidation. Henceforth, harvested reaction contents were centrifuged at 6000 rpm for 30 min, eliminating the non-reacted aggregates and making way for supernatant (consisting of inorganic salts) decantation. Remaining solid was thoroughly washed at least three times, using 4:3:2 water, HCl and ethanol mixture. After each washing, the filtrate was centrifuged and supernatant was decanted. Post multiple-washing, the reaction mixture was coalesced using 100 mL ether. Harvested brownish solid cake was vacuum dried overnight at 50 °C, providing well-oxidized GtO. As harvested GtO was subjected to ∼3 h ultrasonication, yielding exfoliated homogeneous GO dispersion.
2.5 Structural and morphological validation for GO formation
Before the inclusion of as made GO in CLNs, it was subjected to rigorous structural characterizations, which are adequately discussed in our earlier work (Maktedar et al., 2016). Correctness of structural integrity was done through XRD spectrum comparison of GO with graphite. The functional groups on GO surface were identified through a PerkinElmer Spectrometer 65 FTIR. The compositional confirmation was ascertained via UHV X-ray photoelectron spectroscopy (XPS) and Omicron ESCA+. Throughout the measurements, the Al Kα radiation of 1486.7 eV was operated at 15 kV and 20 mA. High resolution XPS spectrum of GO was measured within (283–293) eV, with pass energy of 20. Morphological investigations were conducted with Carl Zeiss Evo-18 SEM. Double sided carbon tape was used to cover the stub over which powdered GO was uniformly adhered, Subsequently, the GO surface was exposed to plasma sputtering inside the coater chamber, where the target containing Au and Pd in 80:20 proportion was used for coating. The GO surface was exposed to 20 kV beam voltage to excite the secondary electrons. The morphological image of GO was captured using a 200 nm scanning provision.
2.6 pH measurement of CLFs, ethanol dispersed GO and combined samples
Owing to pH sensitive curc structural expression and assess the comparative free H+ generation, the pH of 1:1 SDS and DTAB CLF mixtures, ethanol dispersed GO and combined samples were measured at RT, just after the completion of stirring and sonication durations. The measurements were made, using SV4 Digital pH meter, having a built-in power source of 50 Hz, 230 V, 0.01 and 0.05 unit accuracy and resolution, respectively (Riddle, 2013; pH measurement Handbook, 2017). The pH meter was calibrated with standard buffers of pH 4 and 7 as well as with KCl solution. The pH was noted as average of triplicate measurements, after 2–3 min of electrode insertion. The pH data for 1:1 SDS and DTAB CLF mixtures, ethanol dispersed GO and combined samples were mutually compared using Eqs. (1) and (2), to retrieve the modulated H+ generation by (SDS + DTAB) and GO respectively.
2.7 Particle size, textural homogeneity and dispersion assessment
Curc dispersion patterns were screened using Dynamic Light Scattering (DLS, Microtrac, Zetatrac, U2771). For monitoring the effects of increasing curc contents, a mixture of aq surfactants, ethanol, glycerol and surplus ethanol (in similar quantity as used for GO dispersion) was used as blank. The calibration was made using Millipore water dispersed polystyrene (100 ± 2 nm) suspension at 25 °C. Before each measurement, the sample column was cleaned with distilled water and dried using a neat, thin tissue paper swab. All formulations were analysed at 25 °C with 173° backscattering angle.
2.8 Free radical scavenging activities (FRSA)
The FRSA of ethanol dispersed GO, CLFs and combined samples were separately evaluated using little modified reported DPPH• scavenging method (Patel and Patel, 2011; Enujiugha et al., 2012). A 0.006% DPPH• solution in ethanol, was prepared as a stock solution. To prepare samples, 1 mL of this stock solution was added into 1 mL of each test samples (GO, CLF and combined samples), followed by vigorous shaking and incubation in dark at 25 °C for 45 min. Henceforth, UV/Vis absorbance of each sample was measured at 520 nm with Spectro 2060 plus model UV/Vis spectrophotometer. FRSA were calculated with following equation (eqn),
2.9 Physicochemical characterizations
Densities were measured using Anton Paar DSA 5000 M Densimeter, having ±1.10−3 K temperature control, controlled using a built-in Peltier device. Calibration was made using Milli-Q water and dry air (DMA, Anton Paar, Graz, Austria). Before and after each measurement, the sample tube was washed with acetone before being dried uninterruptedly till a constant oscillation period was obtained on passing dry air through the tube, using an air pump. The measurements were made in triplicate before being recorded as mean ± SD.
Surface tensions, γ and viscosities, η of CLFs and combined samples were estimated via pendant drop number (PDN) and viscous flow time (VFT) methods, using Borosil Mansingh Survismeter (calibration no. 06070582/1.01/c-0395, NPL, New Delhi) (Singh, 2006; Singh and Singh, 2019). The PDN was counted using a digitalized counter while the VFT was determined using a stopwatch having ±0.1 s accuracy. The temperature of survismeter was maintained via Labtech thermostat within ±0.05 K limit. For each measurement, the Survismeter was properly washed with pure acetone before being completely dried. The calibration was done to ensure the accuracy of the data. Ten PDN and VFT readings were taken to ensure reproducibility and precision. The γ and η uncertainties were ∼0.35 mN/m and 2 · 10−4 mPa-s. The accuracy and comparison with literature data are reported in Table S1.
2.10 Structure breaking and making (SDS + DTAB) and GO influences on curc dispersion
The impact of simultaneous (SDS and DTAB) and GO (vis-à-vis —COOH and —OH group interactions) surfactant like activities, on curc distribution within SDS, DTAB and oil FA hydrophobic domains was ascertained via ρo, γo, ηo and σo comparisons of 1:1 SDS and DTAB CLF mixtures with individual SDS and DTAB CLFs and for combined samples with ethanol dispersed GO, using Eqs. (4)–(7). The values obtained from these comparisons are assessed as % binding efficacy (BE), surface segregation (SS), CF to IMF and CF to FF conversion, extents respectively (Malik et al., 2014; Malik and Singh, 2017; Maktedar et al., 2017).
2.11 Oxidative stability determination
The expression of medium dependent anti or pro oxidant activities for curc along with the FA rancidity likelihood were the reasons to determine the interfacial stability of curc dispersed oil-in-water droplets, through hydrodynamic radii calculation. The determination of hydrophobic or hydrophilic stability of interfacial region is crucial since the oil-water interfacial region is the major site for the activity of antioxidants (Liang et al., 2017). Thus, hydrophobic stability of oil-water interface in an emulsion accounts for curc existence in this region, forbidding the rancidity accounted loss of oil FA through opportunistic free radicals. To ascertain this, hydrodynamic radii of all samples were determined using Einstein eqn (Einstein, 1906) (Eq. (8)).
Here, is the volume fraction, NA is Avogadro’s number and C is the oil concentration. The volume fraction, was computed using relative viscosity, where blank formulations were considered as reference/solvent phase. The Rhyd determination also assumes significance for ascertaining the droplet shape that could be used to compare their respective curc loading efficacy.
2.12 FT-IR spectroscopy
FT-IR spectra were recorded on a Perkin Elmer spectrum 65 FT-IR spectrophotometer. For analysis, a drop of CLF was placed in between two acetone cleaned KBr plates. The CLFs, ethanol dispersed GO and combined samples were examined for their native chemical functionalities and the wavenumbers are given in cm−1. The shifted (1500–2000) cm−1 (>C⚌O) and ∼ 3500 cm−1 (—OH) SF (peculiar curc peaks) in the CLFs and combined samples have inferred their interactions with curc and GO (Fig. S6).
2.13 Physical stability and structural homogeneity assessment
The stability of CLFs, ethanol dispersed GO and combined samples was monitored via repeated pH measurements for 7 days, where <0.2 units of variation was noted. Furthermore, no visual precipitation was observed for the CLFs kept at RT in the laboratory premises, ensuring a retainment of kinetic stability and prevention of time dependent coalescence risk. All pH readings were noted as <7, inferring an intact prevalence of curc structure. Thus, our screening confirmed the stable curc activities, in agreement with the previous studies (Schneider et al., 2015; Silva et al., 2015).
2.14 Statistical analysis
All experiments were performed in triplicate and the results are reported as mean ± standard deviation (SD). The concentration independent PCPs were cautiously retrieved from the >0.98 correlation coefficient trends in the parameter versus oil-curc (w/v)% plots. The reported values meet 0.68 (standard) and 0.95 confidence levels (combined expanded uncertainties).
3 Results and discussion
3.1 X-ray photoelectron spectroscopy of GO
The composition of GO was confirmed with XPS (Fig. 2(a)). The survey spectra of graphite and GO have been measured within (0–1000) eV range. A comparison of GO survey spectrum (SS) with that of graphite revealed the latter as mainly comprised of C. (Fig. 5a). In addition to carbon, the GO SS comprised oxygen, confirming a significant graphite oxidation. The double peaks in the high resolution C 1s spectrum of GO confirm GO formation, on extreme oxidation (Fig. 5b). The high-resolution C 1s spectrum of GO was measured with pass energy of 20. The de-convoluted C 1s spectrum of GO produced four peaks of distinct binding energies. These four different carbons were observed at 283.2 (C] C), 284.3 (CO), 286.4 (C] O), and 288.1 eV (O—C]O). The % concentrations of these carbons are 11.08, 30.11, 50.03 and 8.78, respectively. The decreasing order of binding energies for GO carbons is
O—C⚌O > C⚌O > C—O > C⚌C
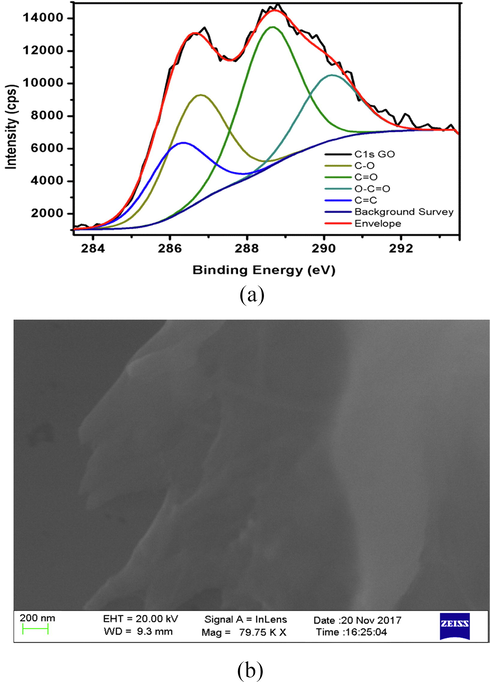
(a) X-ray photon spectrosvopy (XPS) and (b) Scanning Electron Microscopy (SEM) depicted morphology of as synthesized GO.
3.2 Structural intactness and morphology study of GO
The XRD spectra of as synthesized GO is reported in our earlier study, where the shift of (0 0 2) plane diffraction peak from 26.28° (in graphite) to 10.54° alongside no abrupt peak formation at any other spectral location confirmed the graphite to GO transformation (with no trace impurities) in entirety. Corresponding to this structural conversion, the interlayer spacing enhanced to 8.38 Å (in GO), contrary to 3.38 Å for graphite, illustrating the intercalation impact of oxide species between the constituent graphite layers. The specific surface area graphene oxide, determined using BET method (Brunauer-Emmett–Teller), was 104.41 m2 g−1. High value of surface area corroborated the GO postulated significance towards enhanced adsorption. Fig. 2(b) presents the FE-SEM image of as synthesized GO, depicting the layered morphology and inherent GO surface roughness. These features are partially attributed to the presence of multiple functional groups on GO surface. Adequate surface roughness is a pre-requisite to initiate the needful interactions since surface geometry plays a decisive role in conferring specified inter and intra molecular orientations. Furthermore, the rough surface is also known to confer the shear motilities which are not expressive if the binding is inhibited due to inadequate surface contact. In the present study, rough surface of GO argues well for curc encapsulation and linkages through edge placed —OH groups on GO surface. These multiple linkages create additional sites for furnishing H+ through entropic shift of GO-curc networks. Additionally this characteristic incurs well for avoiding the enthalpic mode of interactions, whereby there could be an irreversible damage to native structure. So, the rough morphology of GO favours an equilibrated distribution of cohesive energies of ethanol dispersed GO and (SDS + DTAB) dispersed curc populations.
3.3 Impact of additive molecular interactions on pH
Table S2 comprises the RT pH of ethanol dispersed GO, 1:1 (SDS and DTAB) CLF mixtures and combined samples, having CLF mixtures and GO in 3:2 proportion. The comparisons for mutual H+ generating potencies of combined (SDS + DTAB) controls and GO over their respective reference samples are listed in Table 1, as per the algorithms of Eqs. (1) and (2). w.r.t: with respect to.
T/K
298.15 K
303.15 K
308.15 K
1:1 (SDS + DTAB CLF mixtures)
Combined samples with reference to ethanol dispersed GO
Oil-curc (w/v)%
w.r.t. SDS CLFs
w.r.t. DTAB CLFs
0.026
17.378
27.637
33.395
0.052
−3.079
7.692
44.497
0.078
7.007
0.313
44.741
0.104
8.006
−2.025
47.176
0.130
13.649
−2.211
40.932
Only distinction in 1:1 (SDS + DTAB) CLF mixtures and combined samples was the inclusion of GO in the latter, so comparison of these two combinations revealed the H+ furnishing GO activities. Least pH (1.90) for ethanol dispersed GO alone inferred its highest acidic nature Table S2). Contrary to this, the 1:1 CLF mixtures developed all pH > 5. The impact of acidified GO influence on simultaneous SDS and DTAB dispersion controls seems expressive as the combined samples developed all pH < 4. Still, < 7 pH in all cases and at each temperature inferred stable curc structural prevalence and also accounts for a significant FFA expression. Least pH for combined samples are due to plentiful —OH and —COOH GO functional groups that readily furnished H+ to a higher extent (Table S2) (Dreyer et al., 2010). This facilitated stable curc structural expression, supported by established studies claiming its degradation under alkaline conditions (Kharat et al., 2017).
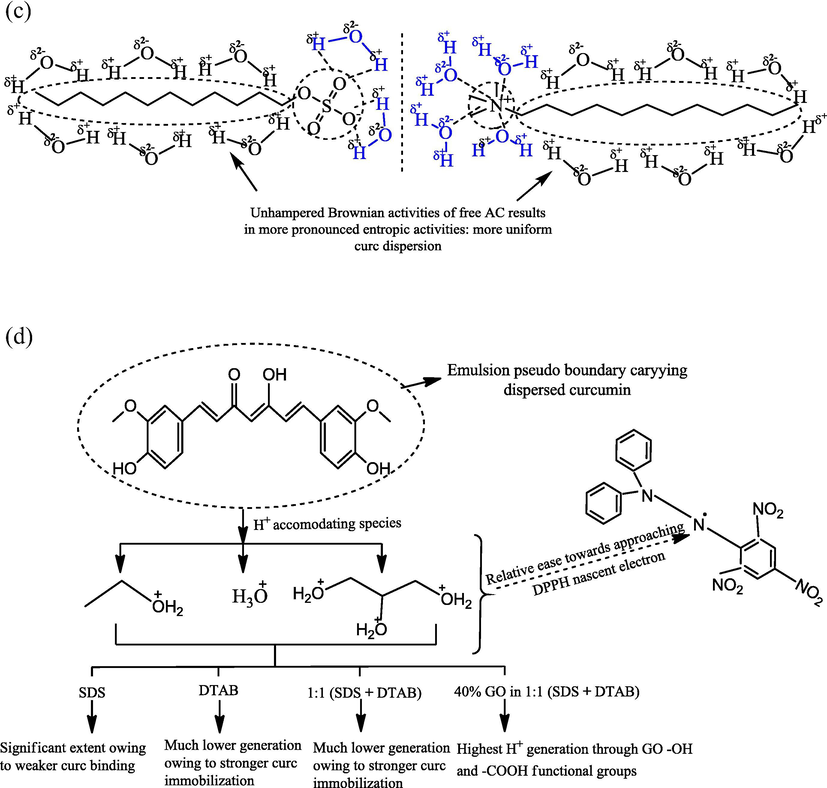
A comparison of (SDS + DTAB) and GO enhanced H+ furnishing potencies reveals a greater impact for GO, illustrated by (33.40–47.18)% pH reductions of 1:1 CLF mixtures in the combined samples. Opposed to this, the simultaneous SDS and DTAB activities caused 17.38% (for SDS) and 27.64% (for DTAB) as maximum pH decrements. Lower pH for combined SDS and DTAB CLFs infer enhanced H+ generation activities of their 1:1 mixtures. Although hydrophobicity of SDS and DTAB is similar with each having a 12-carbon alkyl chain (C-AC), yet SDS is comparatively more hydrophilic with vigorous aqueous engagements of its SO4−2 and Na+ counterions. On the other hand, DTAB has 3 —CH3 groups sterically hindered — that forbid aqueous interactions to make it comparatively more hydrophobic (Fig. 1). Thus, unlike SDS, DTAB formulations had greater unbound water molecules influencing the protonation of nucleophilic ethanol and glycerol. Since CLF mixtures carried similar SDS and DTAB concentrations, there seems a certainty of SDS and DTAB neutralizing the mutual ionic sensitivities, as also pointed out by earlier studies on SDS and DTAB mixed micelles (Favaro and Reinsborough, 1994). However, greater pH decrements with respect to (w.r.t.) only DTAB than SDS infer an acidic influence of SDS on DTAB CLF interactions. The scenario of Na+ and Br− hydration spheres approaching each other on account of electrostatic Columbic forces could be a source of accidental H+ generation, on account of kinetically stimulated molecular rearrangements caused by external stirring. Similar likelihood for — and SO4−2 hydration spheres could also be functional although — is comparatively less hydrophobicity due to 3 —CH3 groups (Fig. 4(c)). The decrements in CLF mixtures and combined samples present the befitting models for developing in situ and ex situ buffer systems, since chemical environment of GO conferred to greater ethanol contributions unlike much similar solvent phases of SDS and DTAB CLFs (Jangid et al., 2018).
3.4 Comparative dispersion potentials
Table 2 comprises the particle sizes (PS, inherently particle diameters only) and PDIs of ethanol dispersed GO, CLN mixtures and combined samples. The 118.7 nm PS and 0.642 PDI for ethanol solubilized GO infers its monodispersed configuration, compared to (0.026–0.078) oil-curc (w/v)% CLFs, having (187.90–529.00) nm ranged PS and (0.744–1.479) ranged PDIs. However, <100 nm sizes PS and 0.406, 0.0510 PDIs were noted for (0.104 and 0.130) (w/v)% oil-curc CLFs. Such PS variations infer a hydrophobicity driven curc monodispersion since only the oil-curc contents varied in the CLFs. The size and PDI trends are the implicit outcomes of 0.0152, 0.030, 0.045, 0.061 and 0.076 oil to surfactant (w/w) ratios, considering the 2 mmol kg−1 SDS and DTAB inclusions. Increasing oil-curc contents substantially affected the hydrophobicity since major FA of mustard oil (namely, erucic, linoleic and α-linolenic) have 16–21 C-AC with the last two contributing even more significantly by virtue of their constitutive C—C double bonds (Table S3). Comparing the trends with individual SDS and DTAB CLFs, it is noted that except 0.078 (w/v)% oil-curc CLF, the sizes of DTAB formulations are decreased by (56.99–78.07)% (Table 2 and S4). The PDIs also decreased by (34.70–94.18)% with the combined dispersion controls of SDS and DTAB. Contrary to DTAB, >400% increments were noted for the sizes of only SDS CLFs in the 1:1 CLF mixtures. However, PDIs decreased by ∼ (67 and 24) % for 0.026 and 0.052 (w/v)% oil-curc although from 0.078 to 0.130 (w/v)% oil-curc, (194.35–406.87)% increments were noted. These PS and PDI variations suggest a stronger dispersion promoting influence of SDS on DTAB. Despite having similar hydrophobicity as 12 C-AC, the SDS is comparatively more hydrophilic due to the missing steric hindrance around SO42−. In DTAB, the 3 —CH3 groups attached to
— weaken its hydrophilicity by their electron releasing tendencies. So, the combined SDS and DTAB activities compensated for higher ΔGo utilization by DTAB alone to disperse curc (Malik and Singh, 2017). Similar tendency could not be generalized for SDS since the PS of only SDS CLFs were lower than for 1:1 CLF mixtures. Higher PS with DTAB than SDS alone could be due to an earlier CMC attainment with DTAB since higher molecular weight of DTAB was responsible for its greater included quantity than SDS (although for both, 2 mmol kg−1 was used). This possibility is amicably supported by (69.41–371.31)% greater PDIs of DTAB than the SDS formulations. So, it seems certain that in 1:1 SDS and DTAB CLF mixtures, the more hydrophilic SDS compensated for stronger hydrophobic aggregation activities of DTAB, due to which the PS decreased from DTAB (only) CLFs but increased w.r.t. only SDS CLFs. The reason for stronger aggregation in DTAB CLFs is the dominant hydrophobic interactions with oil FA, having 16–21 C-AC. The differences in SDS and DTAB interactions are driven by the distinct head group access to water molecules, with
— remaining less hydrophilic than SO42−. Thus, the 1:1 CLF mixtures facilitated a homogenizing moderation of DTAB hydrophobicity to equilibrate the hydrophobicity with hydrophilicity. curc: curcumin, S.D. = standard deviation.
Oil-curc/(w/v)%
Particle Size (nm)
SD
PDI
SD
Ethanol dispersed GO
118.7
±1.65
0.642
±0.0005
1:1 mixture of SDS and DTAB CLFs
0.026
529.00
±1.45
0.862
±0.0008
0.052
187.90
±1.36
1.479
±0.0006
0.078
368.50
±1.54
0.744
±0.0006
0.104
75.20
±1.24
0.406
±0.0007
0.130
57.40
±1.38
0.510
±0.0009
Combined samples
0.026
3140.00
±1.45
0.497
±0.0008
0.052
2570.00
±1.36
0.108
±0.0006
0.078
2488.37
±1.54
0.357
±0.0006
0.104
2447.72
±1.24
0.241
±0.0007
0.130
1544.35
±1.38
1.985
±0.0009
For combined samples, consistently >1000 nm PS were noted although PDIs were mostly < 1, except for 0.130 (w/v)% oil-curc CLF (Table 2). The larger SA of GO aids in partitioning of SDS and DTAB stabilized oil-curc surfactants with supported linkages of hydrated ethanol and glycerol molecules (Fig. 8). The model in Fig. 8 depicts a scenario of distinctive curc existing loci in the combined samples where extensive hydrogen bonded (HB) and non-covalent interactions enabled a wider curc distribution compared to individual SDS and DTAB formulations. The GO interacted distinctly with ethanol-glycerol-water linkages and (SDS + DTAB) supported oil-curc ensembles whereby a wider fractionation of curc could be attained. These possibilities are supported by (40.64–92.70)% lower PDIs for combined samples compared to SDS and DTAB CLF mixtures. The trends suggest a utilization of GO multiple interaction potential where despite forming larger separating layers through GO involvement, the distribution of these larger superimposed networks remained uniform throughout CLF environment. In such a scenario, functional coalescence seems to be active with moderate binding forces (BF) that only energise the curc intramolecular domains but barely induce any harsh bond breaking or making activities (Malik and Singh, 2017, PS trends of DTAB CLFs with peanut oil). Since no heating or sonication was provided from outside except moderate stirring, it is likely that these macromolecular assemblies dispersed evenly at the expense of minimal energy and mitigate the instantaneously dominant hydrophobic or hydrophilic BF in CLF mixtures. The flexible and motional GO structure supports this likelihood to minimize the chances of stronger aggregation or structurally impairing coalescence activities. For example, the lone pair electrons (LPE) in GO and delocalized centrally positioned curc electron density could be a source of random orientation of positively and negatively charged hydration spheres. These possibilities assume certainty in agreement with the earlier studies claiming active π-π stacking interactions between curc and graphene. The common link of π-conjugation makes it poignant to induce distinct curc dispersal between the chemically distinct central and peripheral locations of elongated GO structure.
The elucidation of nanoscale attributes were screened through constitutive oil surfactant ratios, where combined samples having 0.015, 0.029, 0.044, 0.059 and 0.0732 extents developed higher nanoscale activations than 1:1 CLF mixtures with 3.76% lower values (McClements, 2012). These ratios are computed through the working mass fractions of oil-curc populations since curc was first solubilized in oil and then mixed in (aq surfactant + ethanol + glycerol) solvent phase. Since GO possessed hydrophilic and hydrophobic moieties which remained simultaneously functional in the CLF interactions, so its added mass is considered as surfactant contribution in combined samples. Thus, inclusion of GO in the CLF mixtures enhanced the nanoscale activities of SDS and DTAB stabilized oil-curc domains and has consequently increased the kinetic energy (KE) of formulation constituents. The electrostatic potential energies of comparatively less motile formulation constituents progressively re-expressed as kinetically active molecular domains owing to which greater molecular interactions were noted in combined samples. These kinetic activations exerted through diversified molecular motions, with discrete translational, rotational, vibrational and electronic activities.
3.4.1 Comparative molecular randomness ascertained through relaxation times
Homogeneous dispersion necessitates the existence of weak IMFs, should be more of HB, VWF or LDF kind, rather than covalent or ionic regimes, which could impair the native structure. This attribute is specifically desirous for a good drug delivery vehicle, through which uniformity in dosage extent could be assured. Such characteristics are attained through ensuring that the intermolecular holds are not unduly strong and considerable Brownian activities do avoid an instantaneous structural superimposition. To quantify such abilities, the relaxation times, τ of CLFs have been calculated using Eq. (9)
Here, η, ρ and u denote the viscosity, density and sound velocity of formulations. The τ values are given in Table 3, where SDS and DTAB exhibiting contrast variances with decreasing and increasing values as function of increasing temperature. Temperature and hydrophobicity are the two major factors affecting the time lapse between two successive molecular collisions, with a lesser time inferring uncontrolled kinetic activities while a larger time could be attributed to instantaneous aggregation. However, the aggregation is not always functionally disrupting since self-assembly or functional coalescence driven synergistic molecular activities could be operational. In the present study, the τ for CLFs generally decreased (except SDS and DTAB (alone) formulations at 303.15 K) with increasing oil-curc concentrations, inferring progressively improving kinetic stability and weakened interactions on increasing hydrophobicity. These τ variations infer a suitability of chosen oil-curc concentrations for curc delivery through CLFs, although temperature impacts on τ are contrasting for SDS and DTAB. The τ decreased for SDS while increased for DTAB from (298.15 to 308.15) K, inferring a stronger influence of external thermal energy (in SDS) on weakening of IMFs. The increasing τ from (298.15 to 308.15) K decipher a stronger curc immobilization by DTAB, with stronger interactions lasting significantly even at 308.15 K. For 1:1 SDS and DTAB CLF mixtures, decreasing τ from (298.15 to 308.15) K presents an SDS like interaction scenario, having highest disorder at 308.15 K. Such τ variations complement our earlier inferences of SDS masking the DTAB activities, creating interest towards further investigation. The dispersion differences of SDS and 1:1 (SDS and DTAB) CLF mixtures are well indicated by the higher τ for the latter at 308.15 K depicting comparatively finer curc dispersion with SDS at 308.15 K. This distinction predicts an implicit role of DTAB hydrophobicity that is affected to a much lower extent by increasing temperature and responsible for greater τ with DTAB (alone) as compared to 1:1 (SDS and DTAB) CLF mixtures.
Temp. (K) →
298.15
303.15
308.15
Relaxation times, τ 1010/(s)
Oil-curc (w/v)%
SDS stabilized CLFs
0.026
6.1921
5.4226
4.7869
0.052
6.2000
5.4112
4.8202
0.078
6.2122
5.3880
4.7771
0.104
6.1488
5.3154
4.7714
0.130
6.1719
5.4085
4.7816
DTAB stabilized CLFs
0.026
5.2118
5.4303
6.0752
0.052
4.9993
5.4279
6.0736
0.078
4.9669
5.5083
6.0877
0.104
5.0343
5.5266
6.0971
0.130
5.0026
5.4370
6.0558
1:1 (SDS + DTAB) CLF mixtures
0.026
7.5268
5.7374
5.0314
0.052
6.3692
5.5099
4.7080
0.078
6.4716
5.8211
5.0129
0.104
6.4230
5.6262
4.9716
0.130
6.4106
5.5697
4.9906
Combined Samples
0.026
11.5519
10.1009
8.7180
0.052
11.8119
10.1349
8.7189
0.078
11.7247
10.2171
9.2065
0.104
12.1589
11.1030
8.7981
0.130
12.6453
10.8958
9.3562
Interestingly, the τ were noted as highest (amongst all) for combined samples, irrespective of temperature and oil-curc concentration. The trends illustrate an involvement of multifunctional GO SA with requisite surface roughness and pore shape that proved crucial in developing synergistic biological activities through enhanced intra and intermolecular interactions. The extent of stable curc distribution through GO involvement could be gathered from the fact that τ for combined samples increased from that of 1:1 (SDS and DTAB) CLF mixtures by (97.26, 97.34 and 87.48)% at (298.15, 303.15 and 308.15) K. Contrary to this, the τ for 1:1 (SDS and DTAB) CLF mixtures were higher than for SDS (alone) by (21.55, 8.04 and 5.11)% only, while similar increments w.r.t. DTAB CLFs were (44.42 and 5.68)% at (298.15 and 303.15) K, while at 308.15 K, the τ for 1:1 CLF mixtures were thoroughly lower. These τ trends deduce a stable curc distribution within the multiple GO binding domains that inculcated a resonance through oscillatory resemblance with curc vibrational and intramolecular activities. This is so as curc binding environment is strikingly different across the multiple binding domains on the elongated GO SA. Furthermore, since curc is in much lower extent, the possibility of manifold curc binding domains on Go surface is considerable. In all such domains, the one with the weakest curc binding facilitates an earlier curc release, although such concerns vanish when solvent effect is considered. Since the chosen solvent comprise a multi-component mixture, so detailed investigation could be done through studying the binding energy variations of curc, GO separately and in combination with implicit solvent constituents.
3.5 In-vitro antioxidant study
Antioxidant or radical scavenging activities (RSA) determine the quenching or neutralizing the chemical reactivity of a radical in free or bound state. The scavenging is attained either through an H+ donor or protonated species. However, mere generation of such species is not adequate since proper identification and interaction with troubling radical moieties is must. The present study determined the RSA of CLFs with a little modification in the standard DPPH free radical method. The DPPH• is stable and intensely coloured, due to which it is deemed suitable in polymer chemistry, enhanced permeation resonance (EPR) spectroscopy and in the antioxidant ability evaluation. The stability of DPPH• is due to inherent steric crowding and stretching effect of electron donating (diphenylamino) and accepting (picryl) groups around divalent N (Foti et al., 2011). The radical has a solvent dependent UV/Vis absorption maximum (∼517 nm for ethanol), due to π-π* transition of its unpaired electron in half-filled nitrogen p-orbitals. This absorption imparts a deep violet color to DPPH• in solution which turns pale yellow, on reduction via hydrogen atom transfer from H-donors (Kedare et al., 2011).
Table 4 contains the FRSA of ethanol dispersed GO, 1:1 CLN mixtures and combined samples, as implicit functions of definitive oil-curc contents. The samples for antioxidant activity determination were prepared via 1:1 mixing of test samples and ethanolic-DPPH• (prepared separately in light protected environment). The mixtures were vigorously shaken and were given an incubation of 45 min, during which they were kept in dark. The relative scavenging activities (RSA) were then ascertained using the 520 nm UV/Vis absorbance values of ethanolic-DPPH• and the test samples in Eq. (3). The final absorbance readings were noted as the mean of three concurrent values along with the standard deviation limits. Since the scavenging differs with the interacting modes of test sample at a given time instant, so a standard 50% RSA was assumed significant (Kitawat et al., 2013). FRSA: Free radical scavenging activities, S.D.: standard deviation. All FRSA are in %.
FRSA ethanol dispersed GO
Oil-curc (w/v)%
FRSA1:1 SDS + DTAB CLFs
SD
FRSA combined samples
0.026
80.80
±0.003
94.45
0.052
51.20
±0.005
90.27
47
0.078
68.45
±0.004
78.64
0.104
68.25
±0.007
80.09
0.130
71.57
±0.006
76.36
For a simultaneous better representation, the FRSA of all samples against variable oil-curc contents are depicted in Fig. 3, where maximum FRSA were noted for combined samples (having 40% GO). The minimum and maximum FRSA for these samples were 76.36 and 94.45% obtained with 0.130 and 0.027 (w/v)% oil-curc (Table 4). The SDS and DTAB alone caused (62.25–89.44) and (55.10–79.36)% DPPH• scavenging, with SDS causing (12.70–27.26)% greater scavenging than DTAB. Correlating these FRSA variations with PS and PDIs of SDS and DTAB CLFs, it is noted that sizes with SDS were >400% lower than for DTAB. Similarly, PDI decrements ranged within (40.97–78.78)%, implying that SDS caused a higher curc monodispersion than DTAB. These observations complement the similar conclusions of DTAB activities in earlier studies (Malik et al., 2014; Malik and Singh, 2017). The 1:1 SDS and DTAB mixtures caused greater DPPH• scavenging than DTAB CLFs for most of the oil-curc contents, where maximum and minimum FRSA were noted as 51.2 and 80.8% respectively. The increments ranged within (1.78–21.17)% with only 0.054 (w/v)% oil-curc formulation developing 20.84% lower scavenging (Table 3 and S4). However, the FRSA mostly decreased from those in the SDS CLFs, except (9.20 and 2.20)% decrements for 0.078 and 0.104 (w/v)% oil-curc formulations. These FRSA variations also suggest a greater curc monodispersion with SDS than DTAB, with even 1:1 mixtures having a dominant residual effect of DTAB dispersion controls. This could be due to an earlier CMC attainment with the chosen DTAB concentration where the findings suggest that similar SDS concentration is unable to neutralize this tendency. Perhaps it seems that choosing higher SDS concentration with a lesser DTAB concentration could be a more appropriate combination to better the SDS and DTAB curc dispersion limits.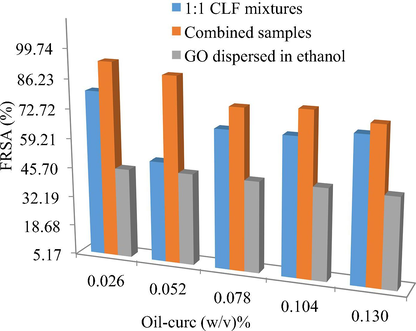
Free radical scavenging activities of 1:1 CLF mixtures, combined samples and ethanol dispersed GO, depicted as functions of increasing oil-curc concentrations.
The combined samples caused a highest DPPH• scavenging with (76.36 and 94.45)% as minimum and maximum extents. The activities bettered the scavenging extents of CLF mixtures by (6.69–76.31)%, illustrating the structural significance of GO inclusion to attain a higher uniformity in curc distribution. Interestingly, only ∼47% DPPH• scavenging was noted with GO alone, indicating the significance of 1:1 CLF mixtures as structurally compatible carrier medium for improved GO biological activities. Another surprising aspect is that although combined samples caused maximum DPPH• scavenging, their sizes were highest amongst all formulations. This proves stabilized and synergistic associations between curc and GO, with a negligible loss in native structural characteristics. The larger sizes are primarily due to GO elongated surface which created multiple binding domains to trap DPPH• (Fig. 8). The likelihood curc binding scenario to the GO surface is depicted in Fig. 5, where curc could interact with GO in three distinct modes, via (a) hydrophobically SDS and DTAB supported oil triglyceride (TG) across ethanol and glycerol periphery (b) the more aqueous vicinities, comprising SDS and DTAB with ethanol and glycerol (since curc is readily soluble in ethanol), and (c) the direct curc binding on GO surface through its π-conjugation and —OH group commonality with curc. Amongst these possibilities, there seems a least likelihood of third alternative (although it is extensively reported in the previous studies), since there was only 40% GO in the combined samples and the microgram curc content in 1:1 CLF mixtures. The consistently < 4 pH for combined samples supports a significant involvement of GO —COOH and —OH surface functionalities, as loosing H+ from these functional groups assumes certainty (Dreyer et al., 2010). Another possibility is the attenuation of GO scattered π-conjugated electron densities which overlap the β-diketonic backbone of curc structure. These structural perturbations of GO surface could steadfast the electron flow from its central electron rich site to the terminals whereby the loss of H+ from the terminal phenyl groups is facilitated with a higher rate. The first two binding modes incur significant supporting controls from oil FA, supported by the most acidic GO (pH = 1.90) that reduced the >5 pH of CLF mixtures to well under 3 in combined samples (Table S2). Correlating this pH reduction with the reported alkaline degradation of curc, it seems reasonable that only those chemical environments housed curc that restricted its interactional involvement to forbid the degradation of its β-diketonic moiety, substantially contributed by the vibrational and rotational energy exchanges permissible by Born-Oppenhaimer’s approximation (eqn (10)) (since electronic energy exchanges are energetically more rigorous and have a greater probability of reaching > 7 pH, if they are in majority) (Born and Oppenheimer, 1927).
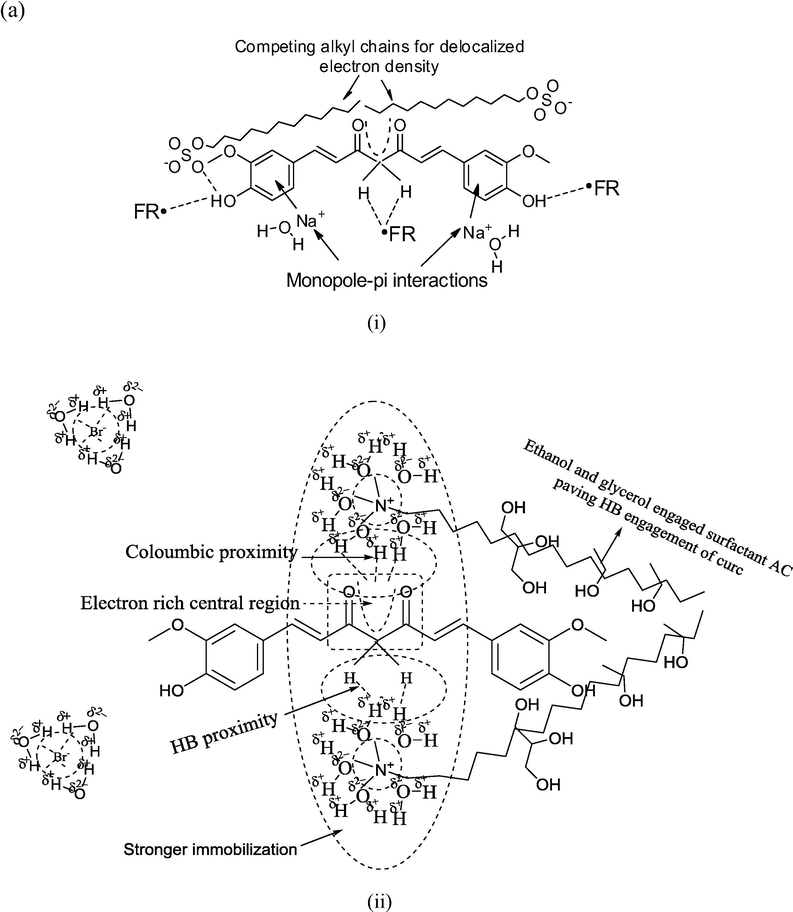
Predictive curc interaction patterns with (a) SDS, (b) DTAB. The more hydrophobic DTAB strongly immobilizes the centrally positioned diffused electron density (of curc) compared to SDS, where only a moderate binding is initiated.
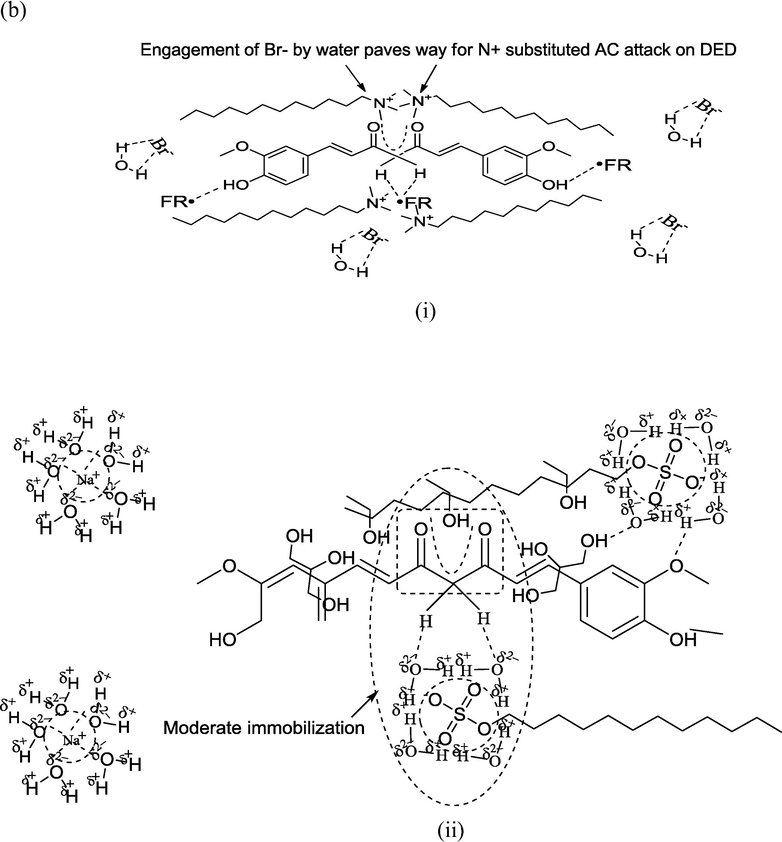
Predictive curc interaction patterns with (a) SDS, (b) DTAB. The more hydrophobic DTAB strongly immobilizes the centrally positioned diffused electron density (of curc) compared to SDS, where only a moderate binding is initiated.
Predictive curc interaction patterns with (a) SDS, (b) DTAB. The more hydrophobic DTAB strongly immobilizes the centrally positioned diffused electron density (of curc) compared to SDS, where only a moderate binding is initiated.
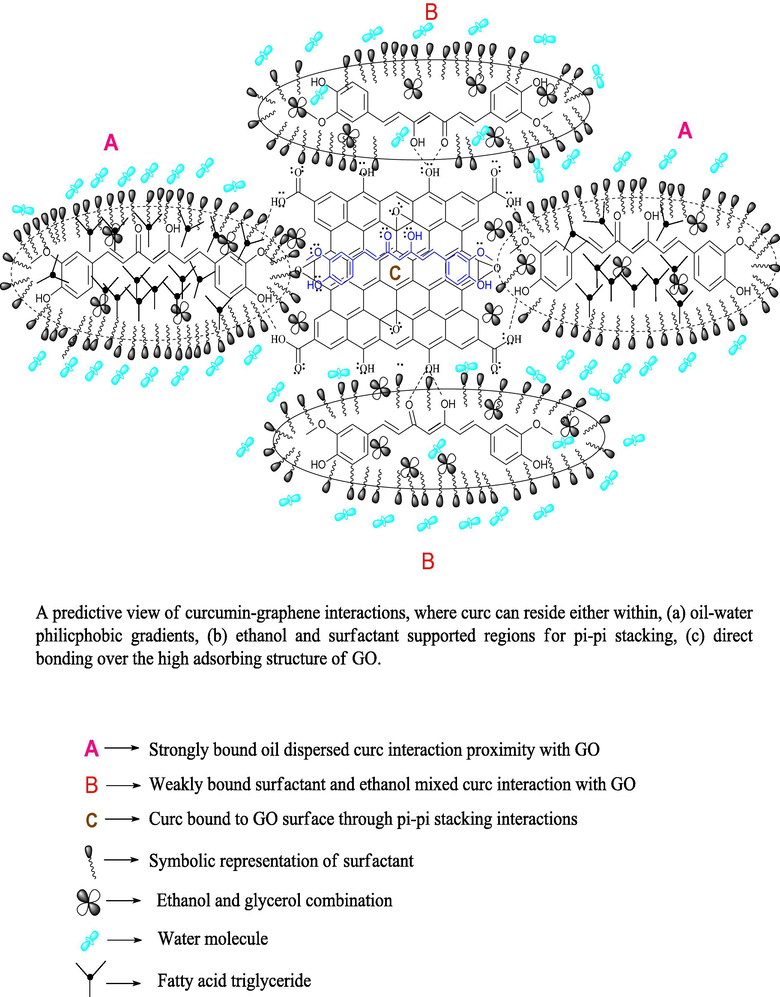
Probable interaction model for combined GO and curc activities, depicting the distinctive curc binding modes on ethanol dispersed GO flattened structure.
Apart from above discussed H+ generating likelihoods, the formation of protonated species also aids in achieving a higher DPPH• scavenging. With water, ethanol and glycerol, there are plenty of chemical sites having LPE, which could intercept the generated H+ since H+ alone has a transient existence of few milliseconds. The chances of H3O+ formation are more certain since water remains the major ingredient of screened formulations and H3O+ has more degrees of freedom than H2O. This possibility is higher for combined samples, as not only GO contributes in H+ generation but its multiple HB supported linkages create multiple hobnobbing activities (via —OH and —COOH groups involvement), owing to which FRSA emerged as highest for combined samples (Dreyer et al., 2010). The distinctive FRSA with all samples are the outcomes of specific structure-activity-relationships (SAR), depicted in Fig. 4 for SDS and DTAB. While SDS approaches the central electron rich curc locus through its AC the DTAB immobilizes the same with its positively charged quaternary ammonium ion. So, the electrostatic Columbic interactions induce a stronger curc binding in DTAB compared to SDS, could be the reason for much higher PS and greater FRSA with SDS than DTAB, consistent with our earlier findings with cottonseed and peanut oil (Malik et al., 2014; Malik and Singh, 2017). Fig. S2 portrays a schematic distinction of incremental FRSA with GO supplemented CLF mixtures, where curc is depicted as interacting with multiple GO —OH groups and partially entrapped over the elongated surface. The oil molecules are placed in the hydrophobic vicinities of surfactants with ethanol and glycerol populations sandwiched in the midst of GO —OH groups and surfactant hydrophilic domains.
3.5.1 Predictive interfaces in terms of anticancer and antimicrobial activities
The GO used in this study has been evaluated for anticancer and antimicrobial potency, in light of which its enhanced FRSA in CLF mixture could be crucial (Maktedar et al., 2016). The anticancer activity of used GO was evaluated against MCF-7 (human breast cancer) and monkey normal kidney cell lines. The solvent chosen for anticancer activity was dimethyl sulphoxide (DMSO), wherein the (10–80) μg mL−1 dosage extents effected (97.09–152.04)% growth controls. Apart from this, the chosen concentrations showed >80 GI50 values through which cytocompatibility of GO was assured. Alongside these anticancer attributes, as made GO showed insignificant (<50%) FRSA when taken within (20–100) mg mL−1 extents in ethanol, evaluated using DPPH radical assay. The results of our study could be turning point in this direction, as we have included only 1 mg mL−1 GO dispersed in ethanol. Secondly, the SDS and DTAB concentrations in combined samples were of the millimolal range, with optimal glycerol (<0.15 mL) and ethanol (2.5 mL) contents. Therefore, our formulations having GO could be considered as amicable alternatives of DMSO dispersed GO. However, it would be interesting to investigate whether the enhanced FRSA in CLF mixtures still allow significant GO anticancer activities. Another significant aspect is the change in the solvent properties as well as concentration scale, since our formulations had aq (SDS + DTAB) as major solvent. Since, DMSO, even after being a conventional organic solvent is not exerting a toxic response, so our systems carrying millimolal SDS and DTAB extents, are likely to retain the cyto-compatibility. The only concern left hereby, is whether the μg mL−1 dosage extent of GO remains equivalently capable to exhibit similar growth controls as in studied MCF-7 cell lines. Similarly, antimicrobial evaluation revealed (128 and 256) mg mL−1 as minimum inhibitory GO concentrations against fungal and bacterial pathogens. The differences in chosen concentrations (lower for anticancer evaluation) are due to higher risk of non-specific toxicity in the exclusive elimination of cancer cells. The (62.47–94.45)% FRSA increments after GO inclusion in CLFs explain the antioxidant significance of combined samples that harbours well for antibacterial and antifungal attributes as these remain the substantial sources of infectious disorders. However, the efficacy towards cancer cell treatment needs further optimization through which requisite concentration could be estimated towards the specific cancer cell-line.
3.6 Physicochemical study of GO and curc dispersion controls
The comparative dispersion efficacies of (SDS + DTAB) and GO w.r.t. individual SDS and DTAB CLFs, and 1:1 SDS and DTAB CLF mixtures were assessed through ρ, γ, η and σ comparisons, using Eqs. (4)–(7). The determination of PCPs assumes significance for estimating the constitutional hydrophilic and hydrophobic force dynamics and specific functional groups so that the stability controls ensuring a steady intracellular curc transport could be retrieved in an authentic manner. The PCPs form implicit interfaces in regulating the energy exchanges to an extent that forbids any drastic energy release or absorbance. The sole aim is to energize the molecular structures attained through distinctive contributions of constituent functional groups, lone pair and non-bonded electrons, π-conjugation, steric hindrance, philicphobic force gradient establishment and electronic delocalization (Singh, 2006). The asymmetric distribution of molecular interaction coordinates are, overall difficult to be assessed on an individual extent since distribution of above mentioned physicochemical structural initiators is not uniform in the interacting species. Under such a scenario, the kinetic stabilities are onset by combinatorial entropies of individual molecular configuration that are together summed up as tentropy (arising due to distinctive philicphobic contributions and functional group activities). To make a thorough in vitro assessment pertaining to the in vivo stability of CLFs, it is must that interactions amongst the formulation constituents are self-sustainable and require minimum energy from external agency to sustain the stabilizing interactions at a regulated pace.
Tables S5 and S6 contain the ρo, γo, ηo and σo of SDS and DTAB CLFs, 1:1 mixtures of SDS and DTAB CLFs, ethanol dispersed GO and combined samples (having 40% GO) obtained via regression analysis of concentration dependent values given in Tables S7–S9. The respective comparisons for 1:1 SDS and DTAB CLF mixtures (w.r.t. individual SDS and DTAB CLFs) and combined samples (w.r.t. ethanol dispersed GO) are listed in Tables 4 and 5, as % binding energy (BE, using ρ), % surface segregation (SS, using γ), % CF to IMF conversion (using η) and % CF to FF conversion (using σ). The positive and negative values of these comparisons could be attributed to net structure making and breaking influences of curc dispersion moieties. The oil-curc concentration specific PCP variations for a individual SDS, DTAB CLFs and 1:1 (SDS and DTAB) CLF mixtures, combined samples are depicted in Fig. S3 and Fig. 6(a–d) respectively. The ρ variations for as made CLFs illustrate a higher structural turbulence in individual SDS and DTAB CLFs contrary to their 1:1 mixtures (Fig. 6(a) and Fig. S3(a)). The ρ for latter systems almost remained unchanged despite increasing oil-curc concentrations while for individual surfactants, significant variations are noted from 0.104 to 0.130 (w/v)% oil-curc. These ρ distinctions infer a higher stability of 1:1 SDS and DTAB CLF mixtures rather than their individual formulations and are well-supported by the >0 BE values of (SDS and DTAB) CLF mixtures w.r.t. both SDS and DTAB CLFs (Table 5). So, stronger interactions in 1:1 SDS and DTAB CLF mixtures enabled a greater equilibration of hydrophilic and hydrophobic forces although higher ρ for these systems predicts an enhancement in the CF. This increment in CF could be due to intense water-water interactions since the water molecules surround the counterions in both SDS and DTAB (Fig. 4(c)). However, < 0 γ comparisons (SS values in Table 5) infer that these CF do not retard or suppress the curc dispersion and rather are caused merely via realignments of water molecules so as to acquire a state of minimum energy. Significantly positive η and σ comparisons complement this likelihood with comparatively higher CF to IMF and CF to FF conversion extents w.r.t. DTAB CLFs inferring a greater improvement in curc dispersion for DTAB CLFs. The γ trends for SDS and DTAB CLFs are depicted in Fig. S3(b), where variations in γ values from 0.026 to 0.052 (w/v)% oil-curc contents distinguish the dispersion attributes of SDS and DTAB. With DTAB, the γ consistently increased from 0.026 to 0.052 (w/v)% oil-curc (indicating aggregation) while from 0.052 to 0.130 (w/v)% oil-curc CLFs, the γ decreased unanimously till 0.078 (w/v)%, after which the decrements showed a temperature dependent variance (increasing at 298.15, decreasing moderately and significantly at (303.15 and 308.15) K respectively) (Fig. S3(b). Contrary to this, for 1:1 SDS and DTAB CLF mixtures, the γ first decreased from 0.026 to 0.052 (w/v)% oil-curc but thereafter increased till 0.130 (w/v)% oil-curc, with a maximum extent from 0.052 to 0.078 (w/v)% oil-curc (Fig. 6(b)). Although the increased γ were lower than γ for both SDS and DTAB (individual) CLFs, illustrating still finer curc dispersion and a probable separation of hydrophilic (aq surfactant + ethanol + glycerol) and hydrophobic (oil encapsulated curc + ACs of surfactants) moieties. The γ decrements from > and < 0.052 (w/v)% oil-curc contents and enhanced FRSA for 1:1 SDS and DTAB CLF mixtures (compared to SDS and DTAB CLFs) rightly establish these systems as curc protectors and function enhancers, analogous to recently reported natural deep eutectic solvents (Jelinski et al., 2019). These assertions form basis for the feasibility of 1:1 SDS and DTAB CLF mixtures to prolong the stabilized curc prevalence, via protecting its acidic or alkaline degradation (Naqvi et al., 2016). BE: Binding efficacy, SS: surface segregation, MS: Molecular synergism, FC: Force conversion.
T/K
298.15
303.15
308.15
With respect to SDS (only) CLFs
% BE
0.21465
0.22569
0.55748
% SS
−23.78081
−20.76951
−29.01212
% CF to IMF conversion
35.12313
2.41287
5.67794
% CF to FF conversion
41.321
1.633
14.356
With respect to DTAB (only) CLFs
% BE
0.0123
0.0024
0.3826
% SS
−21.4834
−19.1176
−27.1116
% CF to IMF conversion
55.0457
6.0205
−16.1197
% CF to FF conversion
124.9622
25.9732
16.1757
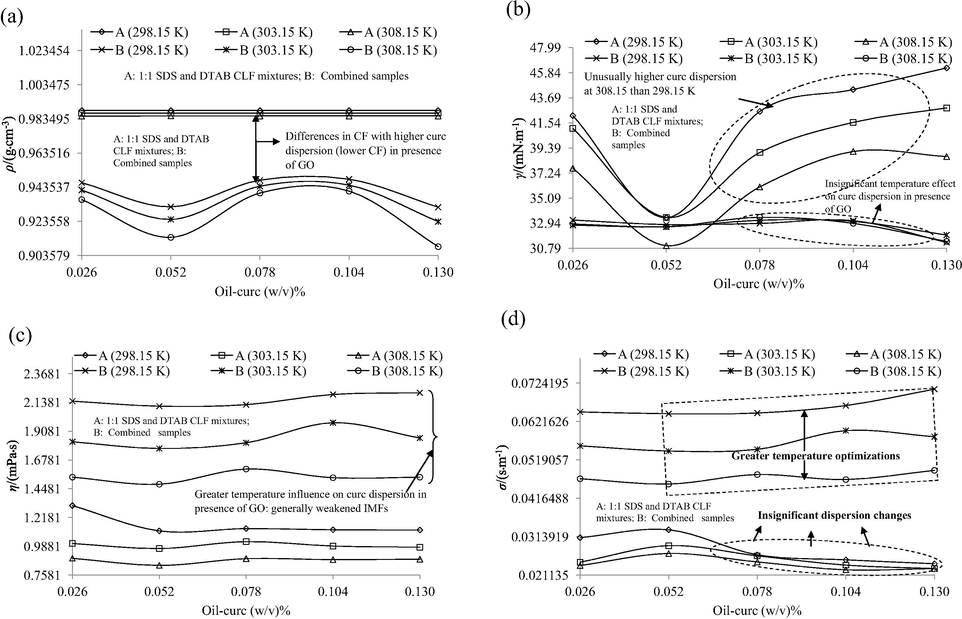
Variations of (a) ρ, (b) γ, (c) η and (d) σ physicochemical sensors as functions of increasing oil-curc concentrations. Lower ρ, γ and higher η, σ for combined samples predict a dispersion catalyzing effect of GO to facilitate curc monodispersion. A: 1:1 SDS and DTAB CLF mixtures; B: Combined samples having 40% (v/v) ethanol dispersed GO.
Similar to γ, the η variations also point out at finer curc dispersion for 1:1 SDS and DTAB CLF mixtures, with (2.41–35.12)% higher values than only SDS CLFs, although slightly lower improvements were noted w.r.t. DTAB CLFs, in particular at 308.15 K (Table 5). Interestingly, the η curves nearly overlap for SDS and DTAB CLFs at (298.15 and 308.15) K respectively, raising a possibility of similar SDS and DTAB chemical activities at the extremes of chosen temperature range (Fig. S3(c)). Such aspects provide valuable leads from thermodynamic stability point of view, with DTAB consuming greater thermal energy than SDS to achieve a similar curc monodispersion. So, here temperature driven SDS and DTAB interaction behaviours are distinguished with strongly hydrophobic DTAB taking longer to induce a similar (to SDS) binding force weakening as SDS. Similarly, the compositionally driven dispersion activities are differentiated at 303.15 K, where the η values remained nearly similar till 0.052 (w/v)% curc but subsequently became higher for DTAB. So, probably DTAB incurs a higher thermodynamic stability than SDS from 0.052 to 0.130 (w/v)% oil-curc contents. Another notable aspect is that the least η for DTAB is noted at 298.15 K while the same for SDS is noted at 308.15 K. Thus, the SDS achieves saturation in the BF with increasing temperature while DTAB initially (at 298.15 K) favours a retainment of stronger CF that moderate with increasing energies (till 308.15 K). Near constancy of η values for 1:1 SDS and DTAB CLF mixtures signifies reduction in random Brownian activities, noted in η curves of SDS and DTAB alone (Fig. 6(c)). The σ variations yet again predict vigorous Brownian activities for individual SDS and DTAB CLFs, with temperature distinguished activities indicated by similar σ changes at (298.15 and 303.15) K but at 308.15 K, the trends are altogether different. From 0.052 to 0.078 (w/v)% oil-curc contents, the σ decrease, then rise till 0.104 (w/v)% oil-curc followed again by decrements till 0.130 (w/v)% oil-curc (at 298.15 and 303.15 K). However, at 308.15 K, the first increment lasts till 0.078 (w/v)% oil-curc followed by steeper decrement till 0.104 (w/v)% oil-curc after which the decrement was much lesser till 0.130 (w/v)% oil-curc. These temperature regulated CF to FF conversion extents elucidate a higher temperature sensitivity of SDS CLFs at (298.15 and 303.15) K. Similar distinction is noted for DTAB CLFs with sharper increments and decrements from 0.052 to 0.078 (w/v)% and 0.078 to 0.104 (w/v)% oil-curc at 303.15 K, the tendency of which is much lower at 298.15 K while at 308.15 K, such variations entirely vanish (Fig. S3(d)). Comparing these σ variations with 1:1 SDS and DTAB CLF mixtures having near constant σ values from 0.078 to 0.130 (w/v)% oil-curc, it could be concluded that 1:1 CLF mixtures incur much lower Brownian motions (Fig. 6(d)). Although there appears a significant possibility of additive hydrophobicity (which could induce clustering) with both SDs and DTAB remaining functional alongside the (16–21) C-AC of oil FA, yet the higher σ values of CLF mixtures than individual CLFs infers a higher curc monodispersion with simultaneous SDS and DTAB activities. Such a possibility assumes a greater likelihood owing to the findings of better dispersion with additive activities of cationic and anionic surfactants. So, the 1:1 SDS and DTAB CLF mixtures are more suitable to preserve native curc structure with moderate BF and homogenized distribution so that its requisite structural expression is catalyzed in the environment where it is delivered than remaining hindered within the formulation constituents themselves.
To ascertain the specific influence of GO on SDS and DTAB enabled curc dispersion, the physicochemical comparisons of combined samples w.r.t. 1:1 SDS and DTAB CLF mixtures are listed in Table 6. The trends convincingly elucidate the monodispersion enhancing attributes of GO, where the BE and SS values remained < 0 at all temperatures. Contrary to this, the CF to IMF and CF to FF conversion extents were > 0 owing to higher η and σ for combined samples than 1:1 SDS and DTAB CLF mixtures. The concentration specific trends are depicted in Fig. 6, where lower ρ and γ (except for 0.052 (w/v)% oil-curc at 308.15 K) of combined samples infer their greater curc monodispersion than 1:1 SDS and DTAB CLF mixtures (Fig. 6(a and b)). In general, lower ρ argues for diminished CF and in present case, the ρ for combined samples was less than for 1:1 CLF mixtures by (5.39, 6.04 and 7.24)% respectively at (298.15, 303.15 and 308.15) K. Increments in ρ differences with increasing temperatures are due to progressively weakened CF with higher thermal energy input. The γ trends are depicted in Fig. 6(b), with higher values and larger temperature as well as concentration dependent variations for 1:1 SDS and DTAB CLF mixtures than for combined samples. The γ decrements from 0.026 to 0.052 (w/v)% oil-curc infer a concentration driven enhanced micellization after which the γ steadily increased, predicting a hydrophobicity driven aggregation. Contrary to this, the γ remained much lower for combined samples and were nearly uniform except the unanimous decrements from 0.104 to 0.130 (w/v)% oil-curc contents. Missing abrupt γ changes for combined samples signified their greater interactive stability with lower γ illustrating a dispersion promoting impact of GO. These compositional traits of combined samples explain their highest curc monodispersion ability, owing to which highest FRSA were noted for combined samples (earlier discussed) amongst all combinations. Lower and nearly similar γ for combined samples infers them as low surface energy systems (compared to 1:1 SDS and DTAB CLF mixtures) with comparatively higher molecular interactions inferring a synergistic association of curc and GO. These observations suggest an acidic and pro-surfactant like influence of GO (Table S2). An interesting aspect of η and σ variations for CLF mixtures and combined samples is the more clear temperature distinction for the latter, inferring a lower impact of increasing temperature on the curc dispersion potential of CLF mixtures (Fig. 6(c and d). Apart from this, the individual η and σ values also varied to a higher extent for combined samples, illustrating the prior weaker BF in combined samples whereas in 1:1 SDS and DTAB CLF mixtures, the increasing temperatures are not able to distinguish the individual values in similar proportions. So, the shear activities responsible for CF to FF and IMF inter conversion expressed with a higher intensity in combined samples compared to 1:1 SDS and DTAB CLF mixtures, causing more pronounced nanoscale effects.
T/K
298.15
303.15
308.15
With respect to 1:1 SDS and DTAB CLF mixtures
% BE
−5.388
−6.038
−7.241
% SS
−24.802
−27.572
−17.951
% CF to IMF conversion
49.281
76.913
66.280
% CF to FF conversion
97.547
144.071
105.093
The FRSA and PCPs correlation revealed (81.67–100.18)% lower γ for GO, still FRSA with GO remained an abysmal 47% (Table 4 and S5). So, despite being homogeneously dispersed (<200 nm PS and < 1 PDI), the GO could not induce > 50% DPPH• scavenging whereas 1:1 CLF mixtures developed (31.47–32.32) ranged γ and still caused (51.20–80.80)% DPPH• scavenging. The γ and pH decrements of combined samples compared to CLF mixtures, deduce an acidic surfactant like GO activity, not only aiding in greater curc monodispersion but also furnish additional H+ population. These predictions are well-complemented by (16.07–30.07)% σ increments of combined samples than 1:1 CLF mixtures. A significant observation is the difference in σ and γ trends, with σ developing clear distinctions at different temperatures while the γ values are not distinguished by temperature as well as increasing oil-curc concentrations (Fig. 6(b and d)). These temperature and concentration driven σ and γ distinctions elucidate the probe sensitivity of these parameters, with a higher distinction of GO dispersion activities by σ due to its stronger shear controls (Daly et al., 2016; Zilman and Granek, 1999).
Conclusive observations of physicochemical studies decipher better control of combined samples as drug delivery vehicles, evident in their greater σ and η variations with temperature compared to 1:1 CLF mixtures (Fig. 6(c and d). Such prospects are assets for industrial utility of combined samples, whereby better dosage controls could be maintained, making the curc-GO combination a toxicity moderating approach where mustard oil is already a prevailing incentive.
3.7 Particle shape and interfacial stability prediction
To assess the philicphobic dynamics of curc distribution with varying oil-water contents, the hydrodynamic radii, Rhyd for 1:1 SDS and DTAB CLF mixtures and combined samples are computed using Eq. (8). The values are given in Table 7, where contrasting variations are noted for 1:1 CLF mixtures and combined samples. The Rhyd increased with increasing oil-curc contents for combined samples (irrespective of operation al temperature) while for 1:1 CLF mixtures, these decreased with increasing oil-curc contents at all temperatures (ignoring the negative sign at 308.15 K). The Rhyd are authentic leads to determine the shear homogenization and the < 0 Rhyd values are mathematically, the consequence of lower η for samples than the reference. In our study, reference samples for 1:1 CLF mixtures and combined samples, comprised of separate SDS and DTAB CLFs, and 1:1 CLF mixtures themselves. So, it is evident that hydrophobicity of the 1:1 CLF mixtures and combined samples is aggravated by the mixing of SDS with DTAB and the inclusion of ethanol dispersed GO. The > 0 Rhyd infer enhanced hydrophobic interactions for the samples in consideration which further predicts increased curc and curc-GO interactions (Jangid et al., 2018). Since the FRSA have increased for 1:1 CLF mixtures and combined samples (compared to their reference standards), there seems a substantial possibility that native structural integrity of their bioactive ingredients is retained and only their vibrational and motional activities have increased. Such likelihoods present 1:1 CLF mixtures and combined samples as befitting self-assembled configurations with self-adjustable IMF homogenization. The increments and decrements in Rhyd with increasing oil-curc contents for combined samples and 1:1 CLF mixtures illustrate the contrasting responses of the two systems towards incremental hydrophobicity, with weaker interactions in 1:1 CLF mixtures. With a constant GO inclusion and only the oil-curc contents increasing progressively, it seems that the gradually higher extents of curc in the combined samples have enhanced the curc-GO interactions. Apart from this, the temperature variations of Rhyd also distinguished the two samples, registering (24.59–51.88) and (161.77–200.19)% decrements from 298.15 K to (303.15 and 308.15) K respectively. On the other hand, similar decrements for combined samples were only (2.76–4.21) and (2.78–8.37)% respectively. With increasing temperatures likely to weaken the IMFs, such variations definitively infer a greater shear with standing by the elongated GO surface, missing in the 1:1 SDS and DTAB CLF mixtures. These Rhyd temperature variations are probably the outcomes of stronger SDS and DTAB Brownian activities in 1:1 SDS and DTAB CLF mixtures which remained suppressed with GO on account of stronger phobic-phobic interactions. The > 0 Rhyd values suggest vibrant interfacial activities with stronger hydrophobic modulations that accounted for significant FRSA, since the interfacial locations are the probable sites for free radical scavenging activities of encapsulated antioxidant compounds (Freiría-Gándara et al., 2018; Costa et al., 2016). All values are expressed as 10−7 multiples.
Oil-curc (w/v)%
For 1:1 SDS + DTAB CLF mixtures
For combined samples
298.15 K (*10−7)
0.026
2.686918
0.98341
0.052
1.605724
1.38986
0.078
1.471004
1.57887
0.104
1.306522
1.79480
0.130
1.216973
1.94315
303.15 K (*10−7)
0.026
1.504179
1.06387
0.052
0.772675
1.35143
0.078
1.109277
1.51248
0.104
0.814287
1.81337
0.130
0.693130
1.88180
308.15 K (*10−7)
0.026
−1.659780
1.02833
0.052
−1.608701
1.32531
0.078
−1.166331
1.53493
0.104
−1.100365
1.64465
0.130
−0.968760
1.76998
3.8 Shear modulated dispersion controls: Viscosity and particle size correlations
Enhanced interactions are inquisitively facilitated through vibrant kinetic energy of constituent molecules, with a highest possibility for lower droplet sizes. To access this likelihood, the PS of CLFs (in different compositions) are plotted with viscosities (η) as a function of periodically varying oil-curc concentrations (Fig. S5(a–d)). The η data for these correlations were taken as the values at 298.15 K. In general, PS vary inversely with η, since a higher η results from an enhanced CF to IMF interconversion (interactions between two or more distinctive molecules) and infers an enhanced dispersion. These correlations deem suitability in the present study, since SDS and DTAB vigorously affect the HB aqueous networking through their distinct counterion interactions. The interactions differed significantly amongst individual formulations, with 1:1 (SDS + DTAB) CLF mixtures having additive hydrophobic force contributions alongside counterion mitigated preferential hydrophilic (for SDS) and hydrophobic (for DTAB) sensitivities. Similarly, for combined samples, the peculiar role of GO enlarged SA and its enhanced (—COOH and —OH) binding sites are illustrated. Owing to functionally distinct structural impacts of these moieties, the rheological behaviour of all formulations remains significantly distinct. Most importantly, bioactive nature of curc mandates the persistence of its native structure in each case, as any loss of this would result in the impaired antioxidant response of formulations. So, interactions comprise the most essential prospect of all CLFs, owing to which shear driven dispersion modulations become functional. Another important aspect of these considerations is the distinctive source of shear activities. Since all formulations were prepared after subjection to similar stirring durations as well as storing under similar conditions, so these factors are obviously unanimous in all CLFs. The sole factor responsible for characteristic shear regulated interactive controls is the increasing oil-curc contents, comprising a substantial proportion of hydrophobic phase. Thus, the dissimilar oil-curc concentrations have been considered as shear generating sources (owing to their residual impacts since hydrophilic contribution of each formulation is constant), that contributed to η increments or decrements, deducing the peculiar flow regimes of formulations. Ideally, a formulation is suited as drug carrier if it renders the homogeneous distribution of dispersed drug and facilitates isotropic distribution of interacting constituent moieties. However, transient thermodynamic stability of colloids (NE) necessitates that even a too small particle size could prove disadvantageous for a uniform drug distribution.
Fig. 7(a–d) depicts the oil-curc concentration dependent η and particle size correlations, where for SDS, an inverse dependence is noted till 0.078 (w/v)% oil-curc, after which both decrease till 0.104 (w/v)% oil-curc and then increase till 0.130 (w/v)% oil-curc. Increment in η till 0.078 (w/v)% deciphers the Newtonian flow regime of formulations, after which a steep the η decrement till 0.104 (w/v)% infers an adverse influence of increased oil-curc hydrophobicity, impairing the shear distribution and making the formulations well suited for shear thinning prospects. So, 0.078 (w/v)% oil-curc seems the saturated hydrophobic limit (in terms of oil-curc content) for the Newtonian flow regime of SDS formulations which vanishes afterwards (Fig. 7(a)). With DTAB, the trends are strikingly different, with both size and η decreasing till 0.078 (w/v)% oil-curc whereas from 0.078 to 0.104 (w/v)% oil-curc, both of these increased only to subsequently decrease till 0.130 (w/v)% oil-curc. Such η and size correlation distinctions infer hydrophobicity dependent micelle making and breaking activities, since except oil-curc compositions, quantities of other ingredients remained constant in all formulations. An interesting turnaround here is the differences in aqueous interactions of SDS and DTAB hydrophilic moieties, especially because the hydrophobic contributions are similar in terms of identical 12 C-AC. As earlier pointed out, DTAB with a stronger hydrophobicity captures curc with a stronger vigour in comparison to SDS, owing to which the probability of curc residing within the philicphobic ethanol-glycerol ensembles becomes significant. The scenario is depicted in slightly more detail, with distinct curc binding potencies of SDS and DTAB in Fig. 4. The positively charged
— approaches the centrally diffused electron density of curc much more rapidly compared to negatively charged SO4−2 in SDS, which interacts with its hydrophobic chain being engaged with curc central region. The strong electrostatic immobilization of electron rich central curc moiety with DTAB (
—) is the reason of higher PS and PDIs with DTAB in comparison to SDS. So, a stronger curc binding by DTAB hindered the intramolecular activities which ultimately resulted in lower FRSA with DTAB (Malik et al., 2014). So, greater PS and PDIs with DTAB restrict the shear controls (sliding of molecular structures) which are contrarily expressed on a much larger scale with SDS. Therefore, it could be concluded that SDS formulations enabled considerably greater motional controls than the more hydrophobic DTAB. These shear distinctions create an interest in their expression intensity when SDS and DTAB remain simultaneously functional. As depicted in Fig. 7(c), the size and η decrements till 0.052 (w/v)% oil-curc demarcate a DTAB masking of SDS formulations with the moderation of DTAB controls being deciphered by restricted decrements till 0.052 (w/v)% oil-curc (contrary to 0.078 (w/v)% oil-curc with DTAB alone). The influence of combined SDS and DTAB activities are more clearly distinguished by near constant η of 1:1 CLF mixtures which increased with SDS alone. This domain of 1:1 (SDS and DTAB) CLF mixtures renders fascination for their industrial utility and could make these systems peculiarly suitable for obtaining shear constancy requirements. Another critical observation is the minute size decrement from 0.104 to 0.130 (w/v)% oil-curc formulations, compared to increased and decreasing patterns with SDS and DTAB separately (Fig. 7(a and b)). Such distinctions in oil-curc concentration dependent size variations fall in agreement with earlier studies concluding nullification of ionic sensitivity in the identical concentration SDS and DTAB mixtures. However, the size decrement from 0.104 to 0.130 (w/v)% oil-curc resembles more with DTAB (alone) pattern, could be due to high molecular weight of DTAB than SDS (resulting in greater quantity of DTAB in similar concentration of aq SDS and DTAB).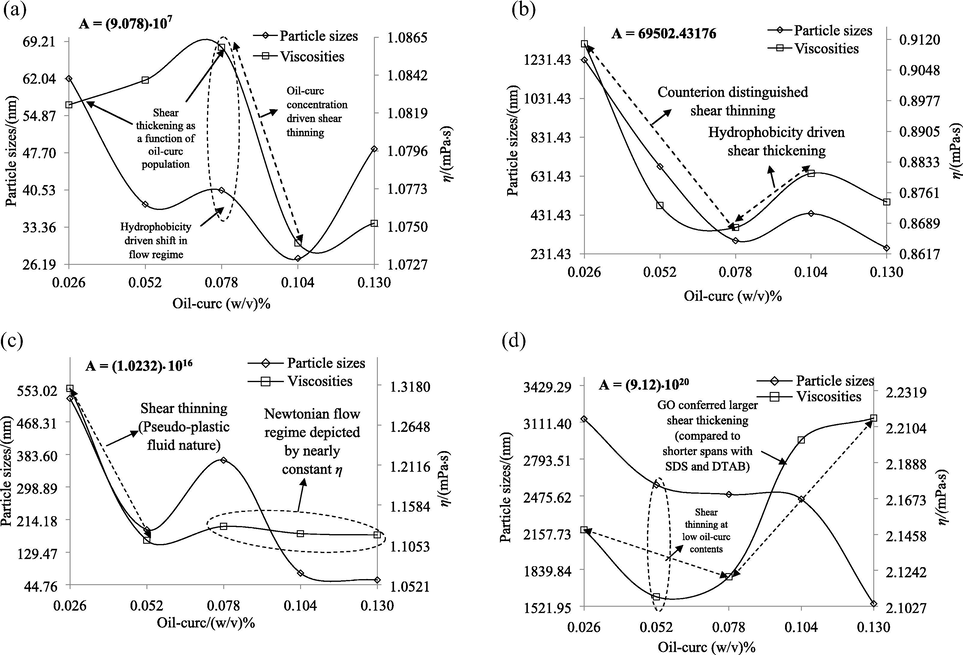
(a–d) Particle size and viscosity correlations as functions of oil-curc concentrations, deciphering the hydrophobicity affected shear thinning and thickening controls, predicting Newtonian or Non-Newtonian flow regimes with dual surfactants and GO inclusion.
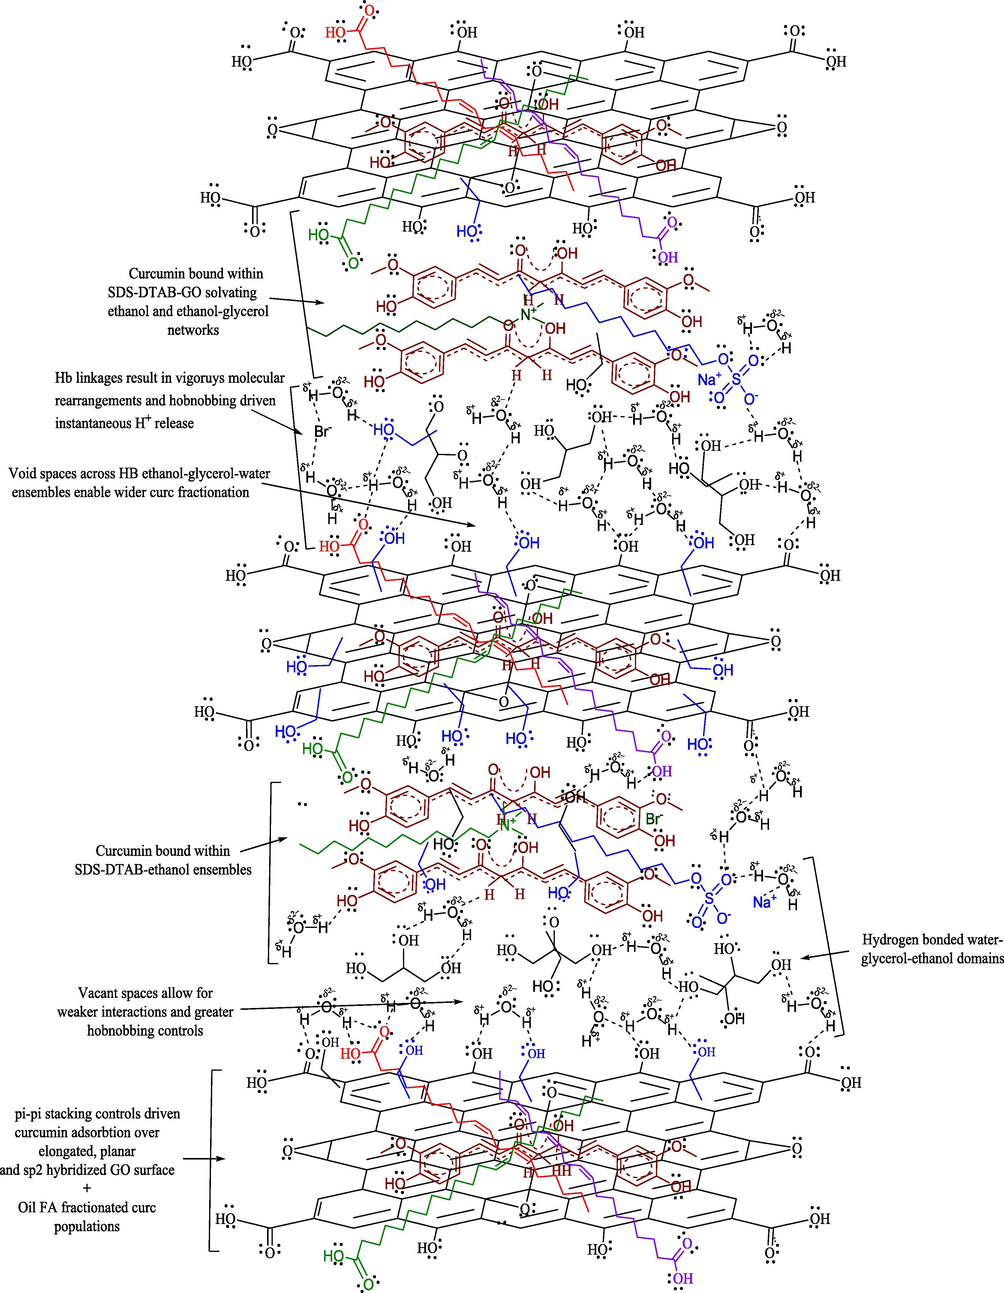
Possible curc distribution and binding patterns in GO supplemented 1:1 SDS and DTAB CLF mixtures. Curc could prevail either on GO surface (via stacking activities alongside oil FA) or remain entrapped within ethanol, glycerol and surfactant (SDS and DTAB) domains in (water + ethanol + glycerol) vicinity.
With GO, the larger SA allows a maximum interaction of molecules without random disorder since there are multiple binding domains to engage the FA bound curc and aq surfactants (Daly et al., 2016). Maximum η amongst all combinations infer highest interactions, with most sizes >2000 nm confirming a role of large GO SA augmented with multiple binding sites. With —COOH and —OH groups at the edges and water being the major ingredient of CLFs, a substantial possibility of HB interactions seems likely. With >75% FRSA, the >2000 nm sizes infer weakened coalescence controls (not damaging the native curc structure), encouraging a possibility of 1:1 SDS and DTAB CLF mixture conferred loosening of successive GO layers (Table 4). These possibilities assume significance owing to consistently <1000 nm sizes of 1:1 CLF mixtures alongwith most PDI remaining < 1 (Table 2). Apart from sizes and FRSA, the highest frequency factors, A for combined samples convincingly establishes their kinetically active nature with persistent sliding or motional activities. Thus, the kinetically active nature of 1:1 SDS and DTAB CLF mixtures has energised the intra and intermolecular activities that steadfast the curc’s H+ ejection, increasing the maximum FRSA of CLF mixtures (80.80%) by 14.45% (Table 4). Vibrant shear activities are indicated by increasing η from 0.78 to 0.130 (w/v)% oil-curc, a trend missing in all other combinations (Fig. 7). This region corresponds to shear thickening attributes of combined samples, affected by constituted oil-curc content and illustrating their suitability for solubilising toxic metabolic depositions. These abilities present an interesting interplay for bettering the anticancer potency of GO, predicted significant through biocompatibility of its DMSO solubilized form towards MCF-7 (human breast) and monkey normal monkey kidney cell line, Vero (Maktedra et al., 2016). The larger sizes of combined samples support the earlier prediction of synergistic impact of contributory factors (SICF) that enabled considerable improvements in its FRSA.
3.9 Sound velocity probed dispersion contrasts
Sound waves propagate longitudinally through a material medium, travelling as disturbance of the constitutional particles. Owing to this, sound can’t travel in vacuum and moves at highest pace through solids (owing to maximum compressibility amongst all the states of matter). In the present study, increments and decrements in sound velocity, u decipher stronger and weaker molecular interactions since closely placed molecules will be easiest to disturb. The u trends for SDS and DTAB CLFs alongwith their 1:1 mixtures are depicted in Fig. S5(a), as functions of (0.026–0.130) (w/v)% oil-curc contents. No drastic variations are noted for any of these systems, inferring little major attenuations in the constitutional activities. However, some characteristic oil-curc content dependent variations are indeed repeated, irrespective of working temperature. For instance, with DTAB, the u registered unanimous increments from 0.078 to 0.104 (w/v)% oil-curc contents, at all temperatures. This observation suggests hydrophobicity dependent enhanced molecular interactions which are not affected by increasing temperatures despite their weakening effect on IMFs. Similarly, with SDS, the u decreased in the same concentration interval, at all temperatures, predicting weakened interactions. Comparing these concentration specific u variations for SDS and DTAB, it seems that with SDS, finer curc dispersion is favoured from 0.078 to 0.104 (w/v)% oil-curc. With 1:1 mixtures of these systems, the u first increased from 0.052 to 0.078 (w/v)% oil-curc but subsequently decreased from 0.078 to 0.104 (w/v)% oil-curc, inferring concentration dependent enhanced and weakened intermolecular holds. Overall, u remained highest for SDS formulations from (0.026 to 0.078) (w/v)% oil-curc while at 0.104 (w/v)% oil-curc, the u was noted as highest with DTAB. Greater u inferred a higher internal pressure, caused by decrement in effective interactional volume, as per the Boyle’s law (inverse correlation of interactional pressure and volume) (Ameta et al., 2016). These differences reflect oil-curc concentration dependent contrasts of SDS and DTAB curc micellization abilities. Least u were noted for 1:1 CLF mixtures at each temperature, predicting farther spaced constitutional moieties and a finer curc dispersion with moderation in individual SDS and DTAB binding activities.
The differences in curc dispersion with GO inclusion are depicted in Fig. S5(b), where u decreased from (0.026 to 0.078) (w/v)% oil-curc, with sharper decrements till 0.052 (w/v)% oil-curc suggesting enhanced dispersion (or micellization) activities. A nearly similar scenario is noted from 0.104 to 0.130 (w/v)% oil-curc, with decreasing u (irrespective of operational temperature). These u variations suggest concentration dependent IMF weakening that paves way for improved curc dispersion. Near constancy of u from 0.052 to 0.104 (w/v)% depicts unaltered molecular activities which interestingly remains unaffected by temperature variations. Lower u for 1:1 CLF mixtures infers comparatively weaker interactions with combined SDS and DTAB which strengthened on GO inclusion. Greater u for combined samples infers closely spaced oil-dispersed curc droplets due to sub-linkages with ethanol (solvent used for dispersing GO) or via —COOH and —OH functionalities of GO surface. Sudden u decrements in combined samples from 0.104 to 0.130 (w/v)% presents interesting prospects of studying the characteristic impacts of increasing oil-curc concentrations that are increased by similar extents throughout. So, what the hydrophobic contribution has done after 0.104 (w/v)%, is not noted within (0.052–0.104) (w/v)%, could be caused due to unbalanced hydrophilicity and hydrophobicity as the hydrophilic contribution remained same in all formulations.
3.10 FT-IR spectroscopy
Fig. S6(a) depicts the FT-IR spectra of mustard oil and its mixture with curc, where large differences in oil and oil-curc transmittances infer a weaker curc binding. Overlapping peaks near ∼1200, 1500, 1759 and 2800 cm−1 deduce a curc binding with C—O, C⚌O and O—H functionalities with oil FA. No abrupt SF in oil-curc mixture compared to oil suggests non-covalent (VWF, LDF and HB) controlled FFA-curc binding, arguing well for our physicochemical studies. Fig. S6(b) represents the FT-IR spectrum of as synthesized GO, depicting the 3403 cm−1 (—OH), 1630 (C⚌C), 1072 cm−1 (C—O—C) and 1734 cm−1 (C⚌O) characteristic stretching frequencies (SF) involved in the formation of multifunctional GO via significant graphite oxidation (Maktedar et al., 2017).
Deviations in 3508 cm−1 (native) curc SF indicated the HB curc interactions with scattered ethanol-glycerol-water populations within SDS and DTAB AC (Chen et al., 2015). Missing (500–1500) cm−1 and appearance of ∼2100 cm−1 SF are key differences in native curc and CLFs, suggesting a curc dilution within the conjugated and non-conjugated C—C and C⚌C FFA-surfactant linkages. The shift in C⚌O and C⚌C, (1600–1700) cm−1 SFs indicated their interactions with GO and SDS and DTAB immobilized water molecules or ethanol-glycerol-water ensembles. The shoulders within (1000–1300) cm−1 and (2800–3000) cm−1 infer C—C, C⚌C and CH2 SFs of FFAs along with 24 C-SDS and DTAB ACs. Fig. S6(c) depicts the FT-IR spectrum of select combined samples, where prominent peaks near ∼1100, within (1000–1500) and (2500–3000) cm−1 depict the C—C, C⚌C and C⚌O chemical functionalities of GO. Apart from this, the peak within (1600–1700) cm−1 inferred the CH2 interactions with O-H group of ethanol. The peaks within (2800–3100) cm−1 depict the sp2 hybridized CH2 GO SF. Decreased transmittance from GO to combined samples ∼3500 cm−1 inferred non-covalent —OH (curc) interactions with GO and FFA. Appearance of shoulders at ∼2900 cm−1 infers a GO structural involvement in the combined samples owing to its absence in individual SDS and DTAB CLFs (Fig. S6(c)) (Malik and Singh, 2017).
3.10.1 Comparative C⚌O and O—H activities in curc dispersion
The 3513 cm−1 (O—H) native curc SF was noted between (3456.4–3475.7) cm−1 while the 1512.7 cm−1 (C⚌O and C⚌C) SF shifted to (1639.6–1643.7) cm−1 respectively. A similarity of these SF variations in CLFs and combined samples infers a mere dispersion enhancing role of GO (Malik and Singh, 2017). The increments and decrements in (C⚌O and C⚌C) and —OH SF elucidate stronger O—H than C⚌O interactions of dispersed curc, calculated with Eq. (11).
Here, c, υ, k and μ denote the speed of light, SF of bonds, spring-constant and reduced mass of constituent atoms in CLFs. The variations in C⚌O and O—H SF of combined samples inferred decreased and increased curc reduced mass, implying an aggregation around the C⚌O functionality since increments of reduced mass confer a wider distribution with finer curc dispersion. The unequal deviations in C⚌O and O—H curc SF are due to dissimilar FFA population, on account of increasing oil-curc populations, which also differed in philicphobic balancing with constant ethanol and glycerol quantities. The mutual complementary curc and GO activities are justified via higher σ of combined samples than CLFs and GO, making combined samples more suitable for a sustained curc expression (Table S6). Such σ differences indicate a GO facilitated higher kinetic activities to neutralize the DPPH• to a greater extent.
4 Conclusions
Room temperature stirring has been efficiently optimized as low energy approach to attain an improved curc antioxidant activity through additive SDS and DTAB dispersion controls. The kinetic stability of prepared micro/nano emulsions have transformed the suppressed antioxidant expression of GO (FRSA = 47%) to more than 90% DPPH radical scavenging. Increased viscosities and decreased surface tensions for the GO containing formulations have inferred a pr-surfactant activity of GO, where decrements in pH modulated the H+ or protonated species generation. Presence of —OH and —COOH groups in GO have conferred multiple binding sites to oil triglyceride and surfactant bound curc ensembles. Our study could be streamlined as efficient green alternative to avoid the cumbersome time consuming conventional GO functionalization strategies. Lower PDIs and enhanced PS of combined samples in comparison to 1:1 SDS and DTAB CLF mixtures have predicted stable self-assembly driven curc structural expression through balancing of oil TG and DTAB aggravated hydrophobicity. The nut shell outcome of this study establishes physicochemical properties and shear controls as pre-requisite dispersion quantifying probes for controlling in vivo dispersion stability of curc and similar polyphenols.
Acknowledgements
The authors are thankful to Central University of Gujarat for infrastructural and instrumental facilities. Financial support provided by University Grants Commission (UGC), Ministry of Human Resources Development in the form of Non-NET fellowship is also duly acknowledged.
Declaration of Competing Interest
The authors declare that they have no known competing financial interests or personal relationships that could have appeared to influence the work reported in this paper.
References
- “pH Measurement Handbook” (PDF). Thermo Scientific, Inc. Retrieved 2017.
- Anticancer Res.. 2003;23:363-398.
- Plants (Basel). 2017;6:42.
- Mol. Pharm.. 2007;4:807-818.
- Cancer Lett.. 2008;267:133-164.
- Pharm. Res.. 2011;28:978-985.
- Biotech. Adv.. 2015;33:1582-1614.
- Annalen der Physik (In German). 1927;389:457-484.
- J. Alternat. Compl. Med.. 2003;9:161-168.
- Molecules. 2015;20:14293-14311.
- RSC Adv.. 2016;6:91483-91493.
- ACS Nano. 2016;102:1939-1947.
- Chem. Soc. Rev.. 2010;39:228-240.
- Ann. Physik.. 1906;19:289.
- Food Nutr. Sci.. 2012;3:7-13.
- J. Chem.. 1994;72:2443.
- Drug Saf.. 1994;10:233-266.
- Org. Lett.. 2011;13:4826-4829.
- Food Funct.. 2018;9:4429-4442.
- ACS Cent. Sci.. 2018;4:600-605.
- J. Mol. Liq.. 2018;259:439-452.
- Front. Plant Sci.. 2015;6:655.
- Pharm. Res.. 2019;36:116.
- Ayu.. 2012;33:10-19.
- J. Food Sci. Technol.. 2011;48:412-422.
- J. Agric. Food Chem.. 2017;65:1525-1532.
- Food Res. Int.. 2018;111:178-186.
- New J. Chem.. 2013;37:2541-2550.
- Science. 2008;321:385.
- Curr. Neuropharmacol.. 2013;11:338-378.
- J. Agric. Food Chem.. 2017;65:4755-4765.
- Theranostics. 2016;6:1306-1323.
- RSC Adv.. 2016;6:114264-114275.
- Ultrason. Sonochem.. 2017;39:208-217.
- Ultrason. Sonochem.. 2017;34:67-77.
- Chem. Biol. Interactions. 2014;222:77-86.
- Malik, P., Mukherjee, T.K., 2014. Chinese J. Biol. 2014, Article ID 396708.
- New J. Chem.. 2017;41:12506-12519.
- J. Phys. Condens. Matter. 2006;18:R635-R666.
- Soft Matter. 2012;8:1719-1729.
- RSC Adv.. 2016;6:20324-20336.
- J. Nat. Prod.. 2016;79:629-661.
- Science. 2013;340:1226419.
- Evid. Compl. Alternat. Med. 2013627375
- J. Adv. Pharm. Educ. & Res.. 2011;1:52-68.
- J. Nanobiotechnol.. 2018;16:71.
- Priyadarsini, K.I., 2014. Molecules 19, 20091–20112.
- Riddle, P., 2013. The Biomedical Scientist 202–205.
- Int. J. Biotechnol. Bioengg. Res.. 2013;4:581-586.
- J. Agric. Food Chem.. 2015;63:7606-7614.
- Int. J. Mol. Sci.. 2018;19:263.
- Biochem. Pharmacol.. 1976;25:1811-1812.
- J. Food Engg.. 2015;67:89-98.
- J. Biochem. Biophys. Methods. 2006;67:151-161.
- Survismeter: Fundamentals, Aspects and Applications. Singapore: Pan Stanford Publishing Pte. Ltd.; 2019.
- Carbon. 2007;45:1558-1565.
- J. Phys. Chem. Lett.. 2011;2:2425-2432.
- Biochem. Biophys. Res. Comm.. 2018;504:686-696.
- Medicines (Basel). 2018;5:93.
- Chem. Rev.. 2015;115:2483-2531.
- Int. J. Nanomed.. 2018;13:2921-2942.
- Adv. Mater.. 2010;22(2010):3906-3924.
- Eur. Phys. J. B. 1999;11:593-608.
Appendix A
Supplementary material
Supplementary data to this article can be found online at https://doi.org/10.1016/j.arabjc.2019.10.011.
Appendix A
Supplementary material
The following are the Supplementary data to this article:Supplementary data 1
Supplementary data 1


