

Translate this page into:
Screening and characterizing the quality markers of Selaginella tamariscina (P. Beauv.) Spring using metabonomics and molecular networking
⁎Corresponding authors at: Department of Pharmacy, The Second Xiangya Hospital, Central South University, Changsha 410011, China (Yi-Kun Wang), Phase 1 Clinical Trial Center, Xiangya Hospital, Central South University, Changsha 410008, China (Gui-Shan Tan). wangyikun@csu.edu.cn (Yi-Kun Wang), tgs395@csu.edu.cn (Gui-Shan Tan)
-
Received: ,
Accepted: ,
This article was originally published by Elsevier and was migrated to Scientific Scholar after the change of Publisher.
Peer review under responsibility of King Saud University.
Abstract
Quality control of traditional Chinese medicine (TCM) should be linked with the authentication and efficacy of TCM. Selaginella tamariscina is a frequently used traditional Chinese herbal medicine. However, its quality control is still difficult due to its multiple adulterants. We established quality markers (Q-markers) of S. tamariscina by using metabolomics, molecular networking and network pharmacology to improve the authenticity study and quality control of S. tamariscina. In this study, ultra high performance liquid chromatography-mass spectrum (UHPLC-MS) coupled with multivariate statistical analyses was applied to distinguish between S. tamariscina samples and their confusing adulterants. Principal component analysis, hierarchical clustering analysis (PCA), hierarchical clustering analysis (HCA) and partial least squares discriminant analysis (PLS-DA) were employed to screen the distinguishing markers from S. tamariscina samples and their adulterants. The top-2 distinguishing markers were isolated from S. tamariscina and identified by molecular networking together with nuclear magnetic resonance spectroscopy (NMR). Network pharmacology predicted the bioactivity and cytotoxicity of the top-2 distinguishing markers. The top-2 distinguishing markers were adopted as Q-markers of S. tamariscina for content determination. Based on the results of ultra performance liquid chromatography-quardrupole-time of flight mass spectrometry (UHPLC-QTOF-MS) metabolomics, we revealed that selaginellins could only be detected in S. tamariscina samples and contributed greatly to discriminating S. tamariscina samples from their confused species. The top-2 distinguishing markers were isolated and purified from S. tamariscina extract. Then, they were further identified as selaginellin and selaginellin A by molecular networking and NMR. Network pharmacology predicted the antitumor activity of selaginellin and selaginellin A, while the cytotoxicity assay verified their bioactivity. In conclusion, selaginellin and selaginellin A were selected as Q-markers for the determination and quality evaluation of S. tamariscina based on ultra performance liquid chromatography-triple quadrupole tandem mass spectrometry (UHPLC-QQQ-MS). The ranges of the concentrations of selaginellin and selaginellin A were 41.57–44.89 μg/g and 15.09–16.75 μg/g, respectively. This study provides a novel strategy combining Ultra performance liquid chromatography mass spectrometry based (UHPLC-MS-based) metabolomics with molecular networking for rapid species identification of S. tamariscina and discovery of the Q-markers of TCM.
Keywords
UHPLC-MS-based metabolomics
Molecular networking
Quality markers
Species discrimination

1 Introduction
Selaginella tamariscina (P. Beauv.) Spring, which belongs to the family Selaginellaceae, is widely used in traditional medicine in Asia to treat multiple diseases. Modern pharmacology reveals that S. tamariscina possesses numerous activities, including hypoglycemic, anti-inflammatory, antitumor and antioxidation activities (Bailly, 2021). The phytochemical constituents of S. tamariscina include selaginellins (Li, Tang, & Yin, 2021), flavonoids , phenylpropanoids, and steroids (Bailly, 2021). Selaginellins are unique secondary metabolites featuring a tautomeric phenol-quinone methide moiety and alkynylphenol functionalities. Our research group focuses on phytochemistry research of S. tamariscina, and we have identified 40 selaginellins from S. tamariscina (K. P. Xu et al., 2011) and S. pulvinate (K.-P. Xu et al., 2011), laying the foundation for this study.
As an important medical plant, S. tamariscina is listed in the Chinese Pharmacopoeia, which can be referenced to verify the authenticity of its species and perform quality control. According to the pharmacopoeia, the amount of amentoflavone in S. tamariscina should not be<0.30 % by the calculation of dried products. However, Chinese medicinal herbs have a similar appearance and are easily confused, complicating identification via traditional methods (Lv et al., 2015). Herbs and spices in local Chinese markets have become prone to adulteration. Multiple counterfeit herbs of the Selaginella species are substituted for S. tamariscina, including Selaginella doederleinii, Selaginella uncinata, Selaginella delicatula, and Selaginella moellendorffii, and these adulterants are also from the family Selaginellaceae. The relational application of S. tamariscina in clinics has been seriously interfered with by commercial counterfeit herbs, and a specific quality control indicator of S. tamariscina is still lacking. Therefore, reasonable medication and quality control of S. tamariscina are urgently needed.
S. tamariscina contains biflavonoids (chiefly amentoflavone), phenolic compounds (selaginellin derivatives) and lignins. A previous study reported that amentoflavone is a major biflavonoid distributed in S. tamariscina, and it was selected as the quality control indicator for S. tamariscina (Wu, Zhi, He, Lei, & Kang, 2008). Subsequent research found that amentoflavone was not suitable for this role because it is widely distributed in multiple Selaginella plants (da Silva Almeida et al., 2013) and had little effect on the distinction between true S. tamariscina and false S. tamariscina. Therefore, distinguishing and identifying S. tamariscina from fraud/counterfeit species is difficult without a specific marker. Finding a specific quality control indicator for S. tamariscina is necessary.
The concept of a Q-marker was first proposed in 2016, referring to the morphological, chemical, biological, and ecological characteristics and indicators, closely reflecting the quality of Chinese herbal medicines (Zhang et al., 2018). This novel theory facilitated the quality and quality control of Chinese medicine products and further promoted the relevance of the effectiveness of TCM quality control (Ren et al., 2020; Sun et al., 2019). Among modern analytical platforms, UHPLC-MS has become an increasingly popular tool for traditional Chinese medicine analysis (Wang et al., 2014), phytochemistry analysis (Sánchez-Salcedo et al., 2016), and related quality control in recent years. As a comparative tool, metabolomics has been extensively applied for origin discrimination (Man et al., 2021; Zhao et al., 2020), comparing chemical differences from various origins or species and screening Q-markers of TCM (Cheng et al., 2021). UHPLC-MS-based metabolomics accelerated the development of the TCM quality control and phytochemistry analysis field.
Our study aimed to discover the Q-markers of S. tamariscina by using diversified mass spectrometry strategies, which provided an efficient approach to screen the significant quality control indicators of TCM and promote TCM quality evaluation. In this study, S. tamariscina and its confused adulterants were distinguished by using UHPLC-QTOF-MS-based metabolomics and molecular networking, screening the underlying Q-markers of S. tamariscina. Finally, the Q-markers in S. tamariscina were quantitatively determined for quality assessment by using UHPLC-QQQ-MS.
2 Materials and methods
2.1 Materials and chemicals
Information on the five Selaginella samples is listed in Table 1. The herbs Selaginella tamariscina, Selaginella doederleinii, Selaginella uncinata, Selaginella delicatula, and Selaginella moellendorffii were collected in 2019 from Hunan Province, China. The plant was identified by Prof. Gui-Shan Tan (Xiangya Hospital, Central South University). The voucher specimens were deposited at the Herbarium Library of Hunan Institute for Drug Control. All plant samples were dried naturally, ground into powders, and then sifted via a 40-mesh sieve to remove particles with a certain diameter. The reference standard selaginellins (purity > 98 %) were isolated from S. tamariscina by our research group. Water was purified by a Milli-Q plus purification system (Millipore, USA). LC-MS-grade acetonitrile and formic acid were purchased from Merck (Darmstadt, Germany). The other reagents were of HPLC grade. The total materials for cultureing cell were purchased from Beijing Solarbio Science & Technology Co., ltd.
Species
Batch
Origins
S. tamariscina
20,150,509
Jiuzhi Church, Changsha City, Hunan Province
20,150,410
Jiuzhi Church, Changsha City, Hunan Province
20,130,518
Lianqiao, Shaoyang City, Hunan Province
S. uncinata
20,150,801
Dasuping, Guilin City, Guangxi Province
20,150,802
Dasuping, Guilin City, Guangxi Province
20,150,803
Dasuping, Guilin City, Guangxi Province
S. doederleinii
20,150,904
Wangjialing, Shaoyang City, Hunan Province
20,150,801
Dasuping, Guilin City, Guangxi Province
20,150,802
Dasuping, Guilin City, Guangxi Province
S. delicatula
20,150,904
Wangjialing, Shaoyang City, Hunan Province
20,150,720
Wuzhi Mountain, Hainan
20,150,817
Huping Mountain, Changde, Hunan
S. moellendorffii
20,150,804
Huping Mountain, Changde, Hunan
20,150,816
Huping Mountain, Changde, Hunan
20,150,817
Huping Mountain, Changde, Hunan
2.2 Sample preparation
Five Selaginella samples were extracted according to the methods described in a previous study with minor modifications (K. P. Xu et al., 2011). The herb powder (0.3 g) was refluxed and extracted with 70 % methanol (30 mL) for 1 h. After cooling and compensating for weight loss, the mixtures were centrifuged at 15000 × g for 15 min at 4 °C. Approximately 200 μL of supernatant from each sample was stored for UHPLC-QTOF-MS/MS analysis. A quality control sample was also prepared and mixed with each sample.
2.3 Metabolic profiling of five Selaginella plants by UHPLC-QTOF-MS/MS
The metabolites extracted from five Selaginella samples were analyzed using an Agilent 1290 InfinityⅡ/6540 Q-TOF-MS system (Agilent Technologies, Santa Clara, CA, USA) in electrospray ionization positive (ESI+) mode. Chromatographic separation was achieved using an Agilent ZORBAX Eclipse Plus C18 column (2.1 × 100 mm, 1.8 μm) at a flow rate of 0.4 mL/min. The mobile phase system consisted of (A) 0.1 % formic acid in water and (B) acetonitrile. The binary gradient elution program was set as follows: 0 min-10 min, 5–15 % B; 10–20 min, 15 %-35 % B; 30–40 min, 55 %-85 % B; 40–45 min, 85–95 % B; 45–55 min, 95 % B. The injection volume was 2 μL.
The ESI source conditions were set as follows: the sheath and auxiliary gas velocities were set at 10 and 15 arb, respectively; the gas temperature was set at 325℃, with the drying gas flow rate set at 8 L/min, while the sheath gas temp was set at 350℃, with the aux gas flow rate set to 11 L/min. The scan range was from m/z 50 to 1200 at a scan rate of 1.00 spectrum/sec. The collision energy was 15/25/35/45 eV in ESI+ mode.
2.4 Screening specific markers using multivariate statistical analyses
For metabolomics, the UHPLC-QTOF-MS raw data were converted to the matrix format of metabolite peak area using MassHunter Profinder (Version 6; Agilent Technologies, Santa Clara, CA, USA). PCA and HCA were employed to visually discriminate between metabolic phenotypes, and orthogonal projections to latent structure discriminant analysis (OPLS-DA) was adopted to screen the key distinguishing markers/markers responsible for the variance in the data, which were then validated through permutation analysis (200 times). The variable importance parameter (VIP) represents the contribution of each metabolite to the OPLS-DA model. Metabolites satisfying both VIP > 1 in the OPLS-DA model and p < 0.05 in Student’s test were selected as candidate distinguishing markers/markers. MassBank (https://massbank.eu/MassBank/) and comparison of reference materials were used for annotation of distinguishing markers/markers.
The structures of differential metabolites were determined by following steps: 1) Use the exact mass to determine elemental compositions of metabolites. 2) Use MS/MS fragments to deduce the possible structural motif. 3) Use molecular networking to search the potential candidates as differential metabolites. 4) Confirm the structures of metabolites by comparing the retention time and MS/MS fragmentation of the sample with authentic standards.
2.5 Molecular networking analysis of distinguishing markers in five Selaginella plants
The raw UHPLC-QTOF-MS data were converted to.mgf format using MS Convert software ( https://www.proteowizard.sourceforge.net) and uploaded to the GNPS online platform ( https://gnps.ucsd.edu/ProteoSAFe/static/gnps-splash.jsp). The GNPS parameters were as follows: precursor ion mass and MS/MS fragment ion tolerance < 0.02 Da, matched peaks > 6, and cosine score > 0.60. The MS cluster size was set to 2 for all sample extracts. Other parameters were set as defaults. The cluster network diagram was downloaded and visualized using Cytoscape 3.8.0.
2.6 Isolation, purification and identification of the Q-markers in S. tamariscina
The top-2 distinguishing markers were isolated, purified and characterized from S. tamariscina extract. The herbs of S. tamariscina (1.0 kg) were extracted five times with 70 % ethanol (5 L) under reflux for 1 h. The 70 % ethanol extract was dried under reduced pressure, redissolved in 80 % methanol, and then centrifuged (2000 g, 5 min) to obtain the supernatant. This supernatant was subjected to polyamide chromatography using a gradient solvent system of ethanol (10%, 30%, 50%, 70%, and 100%), yielding five combined fractions. The 50 % ethanol fraction, Subfraction ST.2–2, was further purified by using a preparative Gilson HPLC system equipped with an RS Tech Optima Pak C18 column (10 × 250 mm, 10 μm particle size) with ACN-H2O mobile phase containing 0.1% formic acid (0–30 min: 38% ACN, 30–33 min: 38–100% ACN, 33–41 min: 100% ACN, 41–43 min: 100–38% ACN, 43–45 min: 38% ACN). UV detection was performed at 225 nm, and the Q-markers were identified and characterized by molecular networking and NMR.
2.7 Network pharmacology prediction and cytotoxicity assay of the Q-markers of S. tamariscina
The network pharmacology settings were as follows: PharmMapper Server (https://www.lilab-ecust.cn/pharmmapper/) was adopted to forecast the target of the Q-markers. The structural formulas of the Q-markers were saved in mol2 format and then uploaded into PharmMapper Server, and the top-50 targets were collected. All targets were subjected to pathway enrichment analysis (KEGG analysis) by using the String database ( https://cn.string-db.org/) and KEGG online database (https://www.genome.jp/kegg/).
To verify the target, the cytotoxicity of the Q-markers of S. tamariscina was measured. The cell counting kit-8 (CCK-8) approach was applied for in vitro assessment of the cytotoxicity of each tested marker toward two human liver cancer cell lines (SMMC-7721 and HepG2). Selaginellin/Selaginellin A (1 mM) was dissolved with 1 % dimethylsulfoxide (DMSO) as a stock solution at 20 °C for in vitro experiments. Briefly, cells were cultured at 37 °C under 5 % CO2 conditions in Dulbecco’s modified Eagle’s medium (DMEM) containing 1 % FBS and 0.1 % penicillin–streptomycin solution. The tested markers dissolved in dimethyl sulfoxide were diluted with DMEM to prepare gradient concentrations (100 µM, 50 µM, 25 µM, 12.5 µM, 6.25 µM, and 3.125 µM). The medium was sterilized using a 0.22µm pore-size filter. Cells were counted, and 4000 cells per well were seeded in a 96-well cell culture plate. Three replicates were made for each measurement. After continuous exposure to the tested compounds at serial concentrations for 48 h, 10 µL of CCK-8 solution was added, and the absorbance was determined at 450 nm by a microtiter plate reader. Cisplatin (purity of 98 % MCE, USA) was used as a positive control. IC50 values were calculated using GraphPad Prism version 8 for Windows (GraphPad Software, San Diego, California USA, https://www.graphpad.com).
2.8 Content determination of Q-markers of S. tamariscina samples using UHPLC-QQQ-MS in multiple reaction monitoring mode
Preparation of mixed standard solutions. Standard substances of marker 1 and marker 2 were weighed precisely and dissolved in methanol to prepare mixed stock solutions of reference standards with concentrations of 0.00123 ∼ 1.234 μg/mL and 0.01960 ∼ 0.9804 μg/mL, respectively.
Chromatographic analyses of Q-markers 1–2 were performed with an Agilent 1290 InfinityⅡ/6540 Q-TOF-MS system (Agilent Technologies, Santa Clara, CA, USA). Chromatographic separation was carried out at 30 °C on an Agilent ZORBAX Eclipse Plus C18 column (2.1 × 100 mm, 1.8 μm). The mobile phase consisted of 0.1% formic acid in water (A) and acetonitrile (B), and gradient elution was performed, introducing 20–60% B at 0–8 min, 60–95% B at 8–11 min, and 95% B at 11–18 min. The sample injection volume was 4 μL, and the flow rate was 0.4 mL/min.
The absolute contents of Q-markers 1–2 were measured on an Agilent 1290 InfinityⅡ/6470 Triple Quadrupole MS system (Agilent Technologies, Santa Clara, CA, USA) equipped with an ESI+ source. Ionization of the two markers was performed in ESI+ mode. The MS and MS/MS spectra of the two markers were acquired by direct infusion of each standard solution. The multiple reaction monitoring (MRM) transitions were m/z 513.2 → 297.1 for Q-marker 1 and m/z 483.2 → 389.1 for Q-marker 2 (Table 2.). The other parameters were as follows: drying gas: N2; flow rate: 8 L/min; drying gas temperature: 250 °C; sheath gas temperature: 325 °C; sheath gas flow: 11 L/min; capillary voltage: 3500 V; fragmentor voltage: 195/175 V for Q-markers 1–2; and collision energy: 22/28 V for Q-markers 1–2.
Markers
precursor ion m/z
Product ion m/z
Dwell
Fragmentor
Collision energy (V)
Selaginellin
513.2
297.1
80
195
22
Selaginellin A
483.2
389.1
80
175
28
The quantitative determination methodology was used to determine metrics including linearity, accuracy, precision and repeatability. The calibration curves were established by plotting the peak area (Y) against the concentrations (X) of the two marker standards. Based on signal-to-noise ratios of approximately 3 and 10, the limit of detection (LOD) and limit of quantification (LOQ) for each sample were determined, respectively. The accuracy was assessed by analysis of the recovery. The recovery study was performed by adding known concentrations of standards into certain amounts of S. tamariscina samples to achieve different concentrations of 80 %, 100 %, and 120 % (n = 9). The precision was determined by intraday and interday variations. The mixed standards were detected (n = 6) within one day for evaluation of the intraday precision. The method repeatability was determined by analyzing S. tamariscina samples for six replicates.
3 Results and discussion
3.1 Using PCA and HCA to discriminate between the metabolic phenotypes of five Selaginella plants and disguise S. tamariscina from its four adulterants
Chemometrics is an efficient method for exploring potential Q-markers of TCM (Yang et al., 2017). Principal component analysis (PCA) is an unsupervised statistical method used in chemometrics, according to dimension reduction without prior knowledge of group membership, which is useful to separate systematic variation from noise and is applied to perform pattern recognition and phenotypic differentiation of TCM (Sun et al., 2021). As displayed in Figure 1A, a PCA scatter plot was used to determine whether the chemical compound differences of the five selaginella plants were sufficiently differentiated and to screen metabolic markers responsible for the various species. The results showed that all the samples were clearly separated by species, suggesting abundant chemical diversity among species. In addition, hierarchical clustering analysis of metabolic profiling also showed that the five Selaginella species can be divided into five branched groups corresponding to their genetic or species diversity. Chemical similarity for clustering was assessed using Euclidean distance and the complete linkage method. Shorter horizontal lines in the dendrogram indicate higher similarity between samples. The S. tamariscina (JB) samples were similarly clustered with S. doederleinii (SL) samples in one minor branch, which suggested that S. tamariscina and S. doederleinii were chemically similar. The S. delicatula samples and S. uncinata (CYC) samples were aggregated into another branch. The S. nmoellendorffii (JN) samples were from another relatively independent branch, and their metabolites were significantly different from those of the other four Selaginella plants (Fig. 1B). The above results suggested that the PCA and HCA methods could differentiate between these five Selaginella plants.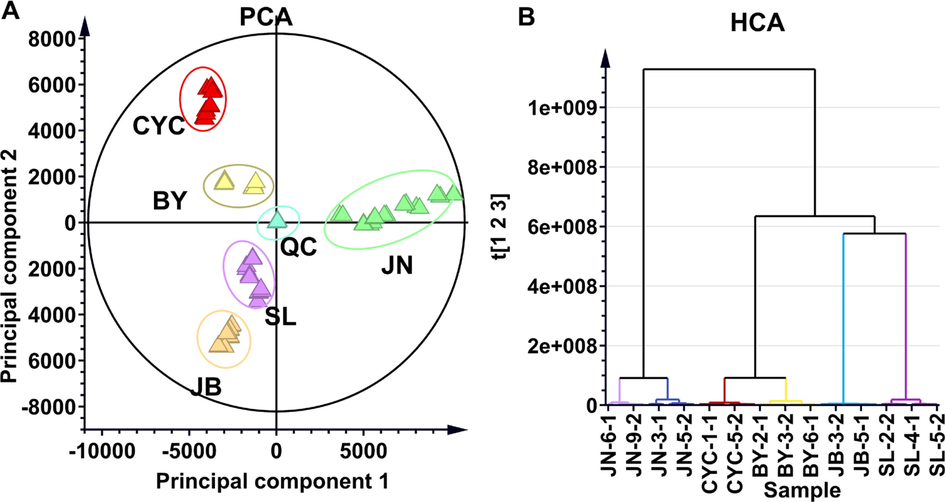
Metabolic phenotype differentiation between S. tamariscina and four non-S. tamariscina species marketed as counterfeit TCM. (A) PCA model that distinguished S. tamariscina (JB) from four counterfeit herbs and (B) HCA model that distinguished the metabolic profile of S. tamariscina (JB) and four counterfeit herbs. SL refers to S. doederleinii; BY refers to S. delicatula; CYC refers to S. uncinate; and JN refers to S. moellendorffii.
3.2 Using OPLS-DA to distinguish between markers of S. tamariscina and four species marketed as counterfeit TCM
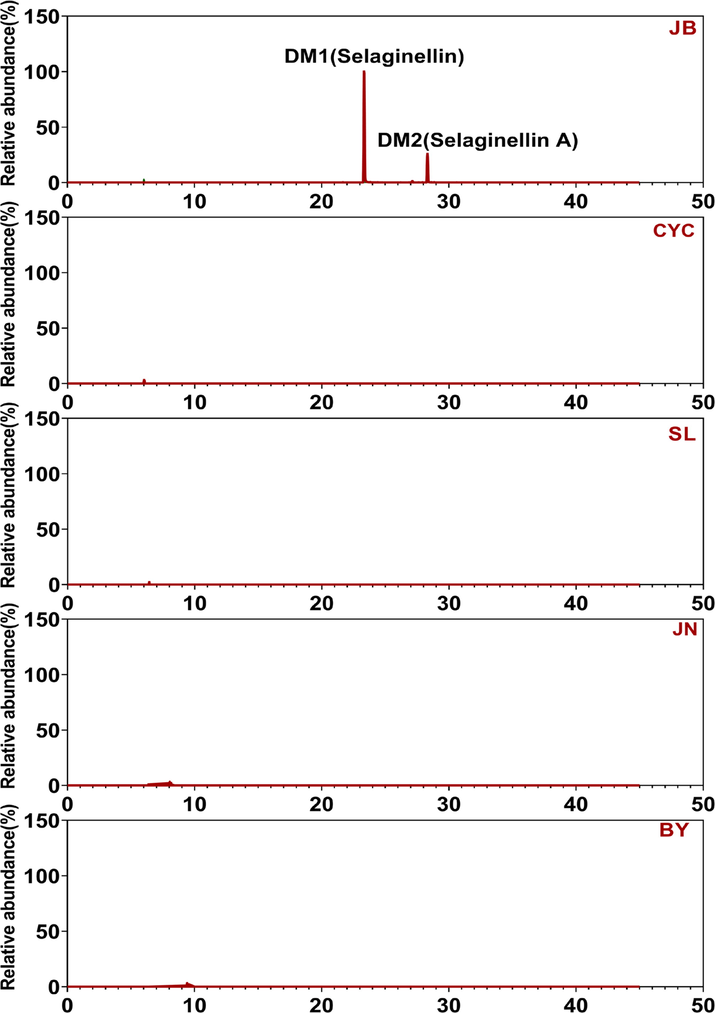
The orthogonal partial least squares discriminant analysis (OPLS-DA) model is a powerful statistical modeling tool (Huang et al., 2018). Improved discrimination of five Selaginella species by chemical markers can be achieved by fully utilizing class information in the OPLS-DA model, which maximizes covariance between measured data and response variables. As shown by the OPLS-DA scatter plot in Fig. 2, the Selaginella samples were clearly separated according to their species, and key differential metabolites contributing to the group separation included multiple selaginellins. The metabolite samples of S. tamariscina and S. doederleinii (SL) were the most similar; therefore, the OPLS-DA model between the S. tamariscina sample and SL sample was selected as a representative example for analysis. These differential metabolites belonged to selaginellins, which were only detected in S. tamariscina samples, not in other SL samples. According to the VIP rank, the top distinguishing markers, marker 1 (m/z = 513.16888) and marker 2 (m/z = 483.15842), had the greatest contribution to group discrimination and were selected as Q-markers (Fig. 2). Similarly, targeted chromatographic analysis revealed that selaginellins were not detected in JN/SL/BY/CYC samples (Fig. 3). These two metabolites were targeted, isolated and purified from S. tamariscina extracts and were further identified as selaginellin and selaginellin A by NMR (Section 3.3). Based on these analyses, OPLS-DA revealed that selaginellin and selaginellin A may be specific markers in S. tamariscina, and both could be used to distinguish S. tamariscina from the other four adulterants.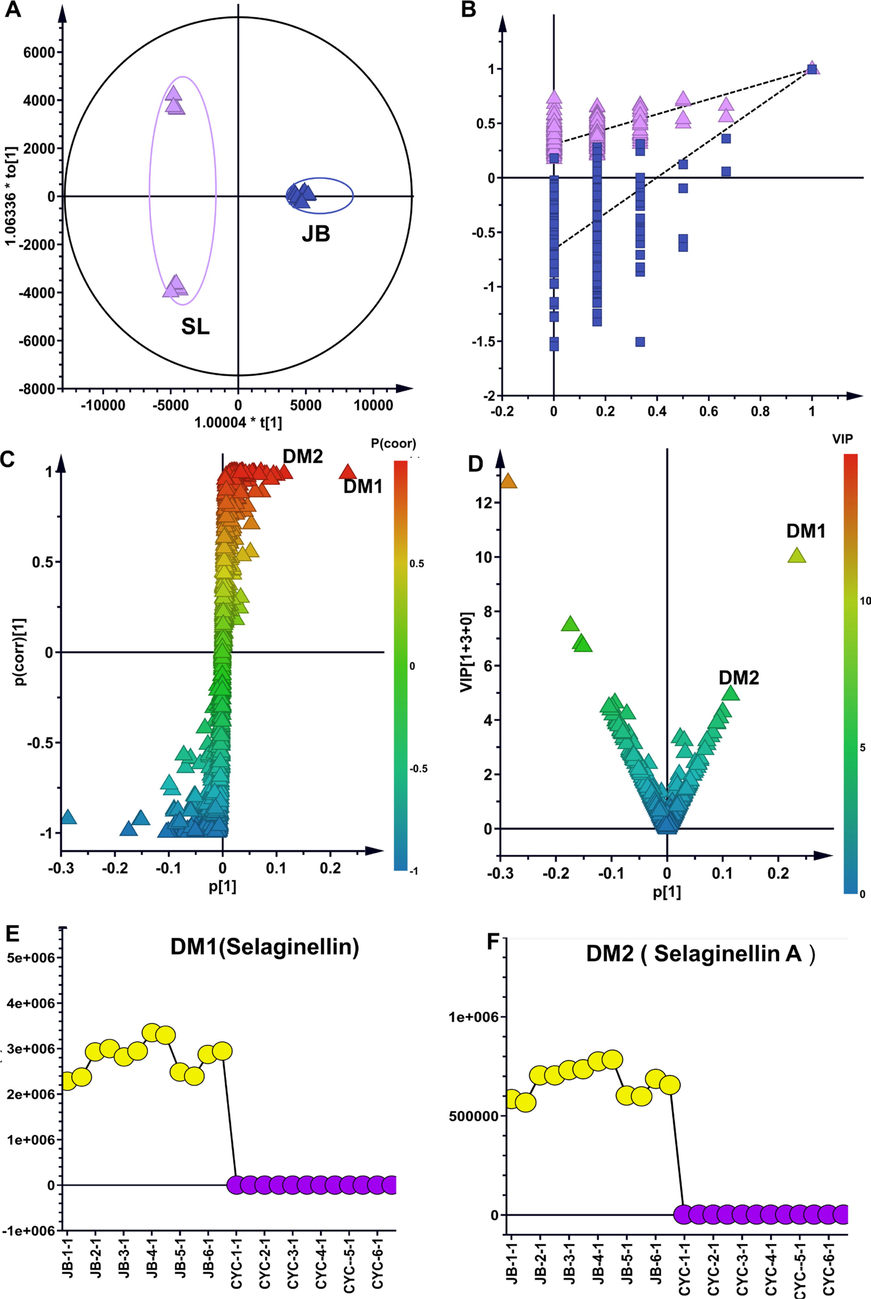
Screening the distinguishing markers between S. tamariscina (JB) and four non-S. tamariscina species marketed as counterfeit TCM. (A) OPLS-DA model scatter diagram. (B) Permutation test performed 200 times for the validation of OPLS-DA. (C) Scatter plot from the OPLS-DA model used to screen differential metabolites with p(corr) > 0.5. (D) Scatter plot from the OPLS-DA model used to screen distinguishing markers (DM) with VIP > 0.5. (E) The top-1 distinguishing marker (DM1). (F) The top-2 distinguishing marker (DM2).
The top-2 distinguishing markers were specific components, only distributed in the S. tamariscina sample.
3.3 Structural characterization of the top-2 distinguishing markers using UHPLC-QTOF-MS/MS-based molecular networking and NMR
Molecular networking is a tandem mass spectrometry (MS/MS) data organizational approach that can efficiently cluster the analysis of natural products or metabolites based on MS/MS fragment patterns and greatly assist in metabolite annotation in metabolomics or TCM analysis (Perez De Souza, Alseekh, Brotman, & Fernie, 2020). In this study, molecular network visual analysis detected numerous nodes corresponding to distinguishing markers. Each node in the molecular network represents a distinguishing marker. The cosine score was a key index for evaluating the similarity between MS/MS fragments and multiple differential metabolites (Fig. 4).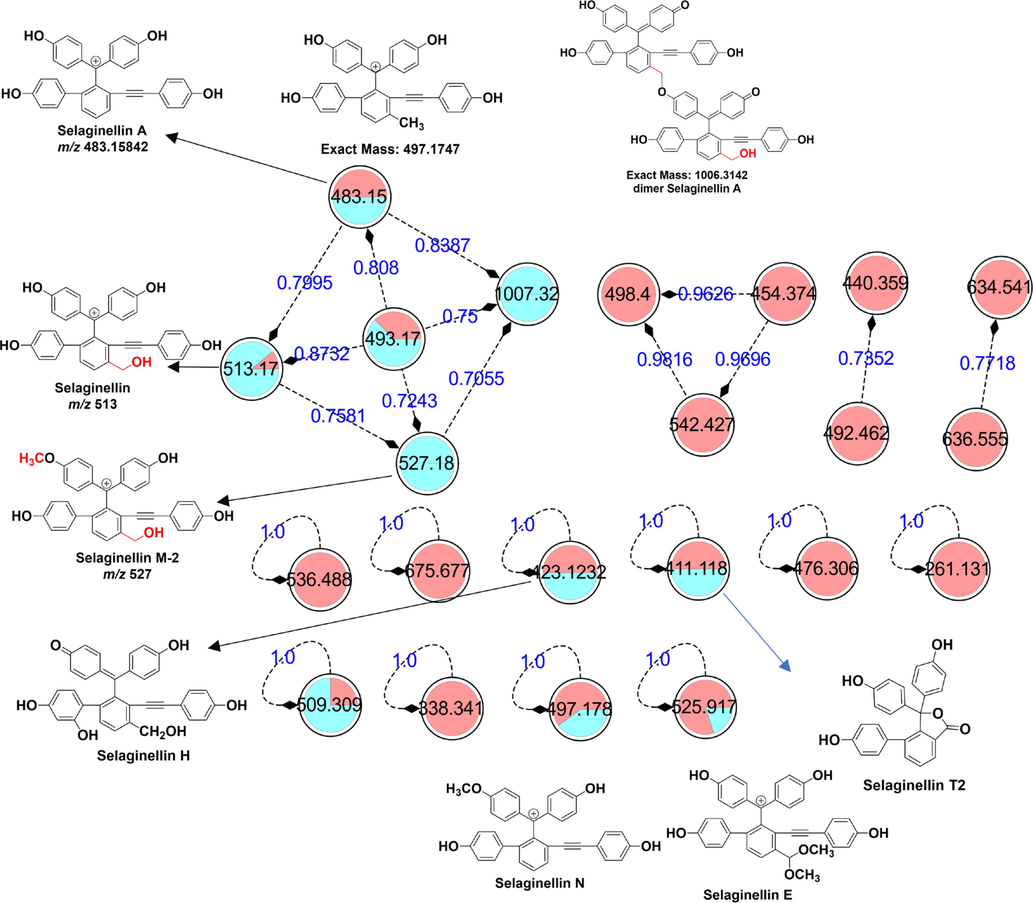
Molecular network of unique markers responsible for distinguishing S. tamariscina from four Selaginella species used as counterfeit TCM. Green nodes denote the reference standard, and red nodes denote the extract.
The molecular node with a precursor ion at m/z = 513.16888 corresponded to distinguishing marker 1. Distinguishing marker 1 showed its protonated molecular ion [M + H]+ at m/z 513.16888 in ESI+ mode, matching the molecular formula of C34H25O5 +. The MS/MS spectra showed that the precursor ion at m/z 513.16888 generated a product ion at m/z 495.15869 due to the loss of H2O. The fragment ion at m/z 495.15869 then generated fragment ions [M + H-C6H6O]+ at m/z 419.12714 and [M + H-H2O-C6H6O]+ at m/z 401.11691, owing to benzyl cleavage. The fragment ion at m/z 419.12714 formed the fragment ion [M + H-C6H6O-CH2O]+ at m/z 389.11636 because of cleavage of the primary alcohol. The fragment ion at m/z 389.11636 produced fragment ions [M + H-C6H6O-CH2O-C6H4O]+ at m/z 297.09064 and [M + H-C6H6O-CH2O-C8H4O-H2O]+ at m/z 255.07990. Distinguishing marker 1 was isolated, purified from S. tamariscina and identified by NMR (Fig. 5). 1H-NMR (500 MHz, DMSO‑d6) δH: 7.69 (1H, d, J = 6.5 Hz, H-16), 7.47 (1H, t, J = 10.0, 2.0 Hz, H-3), 7.36 (1H, d, J = 6.5 Hz, H-17), 7.18 (1H, t, J = 10.0, 2.0 Hz, H-5), 6.98 (2H,d, J = 8.4 Hz, H-28, 32), 6.80 (2H, d, J = 8.4 Hz, H-20, 24), 6.76 (2H, d, J = 7.5 Hz, H-8, 12), 6.64 (2H, d, J = 8.4 Hz, H-29, 32), 6.62 (2H, d, J = 7.5 Hz, H-9, 11), 6.55 (2H, d, J = 8.4, H-21, 24), 6.37 (1H, d, J = 10.0, H-2), 6.30 (1H, d, J = 10.0 Hz, H-6) and 4.80 (2H, t, H-34); 13C-NMR (125 MHz, DMSO‑d6) δC: 185.6 (C-1), 159.1 (C-7), 158.1 (C-30), 156.4 (C-22), 142.4 (C-13, 15), 140.2 (C-19), 140.4 (C-18), 140.2 (C-19), 130.6 (C-25), 133.0 (C-3), 132.7 (C-28, 32), 129.7 (C-8, 12), 129.5 (C-4, 17, 20, 24), 127.0 (C-16), 121.0 (C-14), 115.6 (C-2, 29, 31), 115.0 (C- 9, 11), 114.7 (C-20, 23), 112.2 (C-33), 98.6 (C-27) and 83.7 (C-26). The NMR signals of distinguishing marker 2 were consistent with selaginellin A in the literature (Zhang et al., 2012). The chromatographic behaviors and mass spectrometric fragment pattern of marker 1 were in accordance with selaginellin. Therefore, distinguishing marker 1 was identified as selaginellin.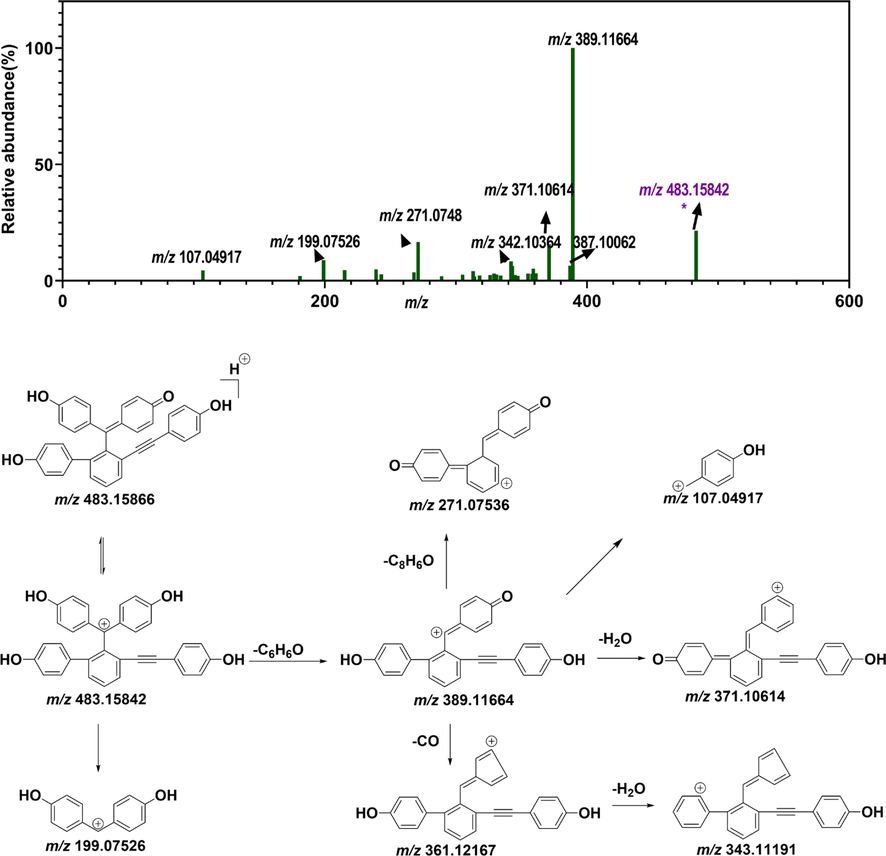
Putative fragmentation pattern of the top-1 distinguishing marker (DM1) (selaginellin). (A) MS/MS spectrum of differential metabolite 1. (B) Possible fragmentation pattern of selaginellin.
The node with a precursor ion at m/z 483.15842 corresponded to distinguishing marker 2. Distinguishing marker 2 displayed a precursor ion of [M + H]+ at m/z 483.15842 in positive mode and precisely matched the molecular formula of C34H24O3+. It generated a fragment ion [M + H-C6H6O]+ at m/z 389.11664, owing to benzyl cleavage. The fragment ion at m/z 271.07536 resulted from α-cleavage of the peak ion at m/z 389.11664. Fragment ions at m/z 371.10614, m/z 361.12167, and m/z 343.11191 were also generated from the ion at m/z 389.11664, owing to the neutral loss of H2O, CO and CO + H2O, respectively (Fig. 6). Moreover, 1H-NMR (DMSO‑d6, 500 M Hz) δ:9.91 (2H, brs, –OH), 9.43 (1H, s, –OH), 7.63 (1H, d, J = 7.3 Hz, 15-H), 7.58 (1H, t, J = 7.6 Hz, 16-H), 7.49 (1H, d, J = 7.5 Hz, 6-H), 7.35 (1H, d, J = 7.2 Hz, 17-H), 7.20 (1H, d, J = 7.4 Hz, 2-H), 6.96 (2H, d, J = 8.5 Hz, 28-H, 32-H), 6.81 (2H, d, J = 8.4 Hz, 20-H, 24- H), 6.75 (2H, d, J = 8.4 Hz, 8-H, 12-H), 6.66 (2H, d, J = 8.4 Hz, 29-H, 31-H), 6.64 (2H, d, J = 8.4 Hz, 9-H, 11-H), 6.56 (2H, d, J = 8.4 Hz, 21-H, 23-H), 6.38 (1H, d, J = 10.2 Hz, 5-H), 6.32 (1H, d, J = 10.2, 3-H) 13C-NMR (DMSO‑d6, 125 M Hz) δ:183.5 (C-1), 159.3 (C-10), 158.7 (C-7), 158.1 (C-30), 156.6 (C-22), 142.4 (C-18), 140.4 (C-19), 139.6 (C-2), 138.5 (C-6), 130.5 (C-4), 132.8 (C-28), 132.8 (C-12), 132.8 (C-32), 130.5 (C-8), 130.5 (C-25), 130.0 (C-15), 129.9 (C-20), 129.5 (C-17), 129.5 (C-16), 129.4 (C-13, C-24), 127.9 (C-3), 127.9 (C-5), 124.0 (C-14), 115.5 (C-31), 115.1 (C-9), 115.1 (C-11), 115.1 (C-29), 114.7 (C-21), 114.7 (C-23), 112.1 (C-33), 93.6 (C-27) and 86.5 (C-26). The NMR signals of distinguishing marker 2 were consistent with selaginellin A in the literature (Zhang et al., 2012). The chromatographic behavior and mass spectrometric fragment mode of distinguishing marker 2 were in line with selaginellin A. Therefore, distinguishing marker 2 was identified as selaginellin A.
Putative fragmentation pattern of the top-2 distinguishing marker (DM1) (selaginellin A). (A) MS/MS spectrum of differential metabolite 2. (B) Possible fragmentation pattern of selaginellin A.
Amentoflavone was distributed in both authentic S. tamariscina herbs and counterfeit herbs. Therefore, amentoflavone could not be applied as a Q-marker of S. tamariscina due to its lack of specificity. In contrast to amentoflavone, selaginellin A and selaginellin were also exclusively distributed in authentic S. tamariscina, clearly differentiating S. tamariscina herbs from adulterants. Therefore, selaginellin and selaginellin A were more suitable as Q-markers of S. tamariscina.
Another remaining distinguishing marker, which was clustered due to the similar structures and MS/MS fragments, also belonged to selaginellins and selaginellin analogs, including selaginellin, selaginellin A, selaginellin B and selaginpulvilin B. Most distinguishing markers in molecular networking showed similar fragment patterns in the tandem mass spectrum and molecular networking results, for example, neutral losses such as H2O, CO and phenol (C6H6O), and their characteristic fragment ions were [M- C6H6O]+ (Fig. 4).
Selaginellins are a novel class of active natural products primarily found in S. tamariscina. The unique polyphenolic skeletons in selaginellins, commonly characterized as tautomeric phenol-quinone methide, alkynylphenol, or uorene moieties, endow them with multiple bioactivities, including cytotoxicity, antimicrobial (Cao et al., 2010), hypoglycemic (Cao et al., 2010), and anti-inflammatory activities (Tuan, Thuy, Quan, & Hung, 2019). Selaginellin and selaginellin A were previously exclusively extracted from S. tamariscina(Zhang et al., 2012) and have been proven to exhibit antiapoptotic, antineoplastic, antioxidant, and antisenescence activities (Zhou et al., 2022).
3.4 Network pharmacology and cytotoxicity assessment revealing that selaginellin a and selaginellin were potential quality markers of S. tamariscina
A bioavailability-enhanced network pharmacological approach has been used to select quality markers of TCM (Duan et al., 2020). Network pharmacology predicted that selaginellin and selaginellin A possessed 65 unique targets. By using Cytoscape software, a pharmacology network was established, and the relationships between the quality markers and corresponding targets were shown (Fig. 7A). These targets were closely related to pathways in cancer, endocrine resistance, the IL-17 signaling pathway, progesterone-mediated oocyte maturation, epithelial cell signaling in Helicobacter pylori infection, the relaxin signaling pathway, pathogenic Escherichia coli infection, the estrogen signaling pathway, prostate cancer and the AGE-RAGE signaling pathway in diabetic complications (Fig. 7B). Sixteen targets were correlated with pathways in cancer, including MAPK1, CDK2, IGF1R, EGFR, PPARG, F2, CASP3, NQO1, HSP90AA1, MAPK10, CASP7, PIM1, AR, MAPK8, ESR1 and RXRA.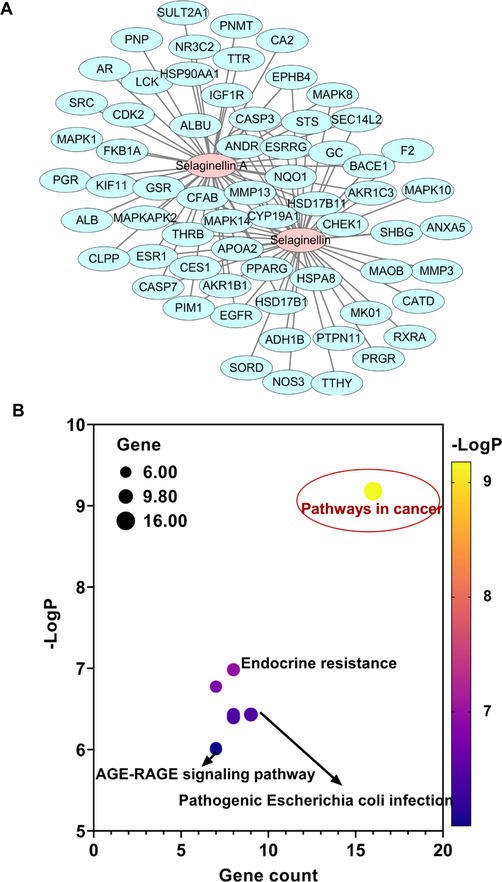
Network pharmacology used to predict the potential bioactivity of selaginellin and selaginellin A. (A) Network diagram of selaginellin and selaginellin A as well as their targets. (B) KEGG pathway annotation of the antitumor activity of selaginellin and selaginellin A.
To verify the potential antitumor activity of the quality markers, the cytotoxicity of selaginellin and selaginellin A was further assessed. Notably, our present study first reported that selaginellin and selaginellin A exhibited moderate cytotoxicity toward the human carcinoma cell line HepG2, with IC50 values of 20 and 25 μM, respectively. Additionally, selaginellin and selaginellin A showed potent cytotoxicity toward SMMC-7721 human carcinoma cells, with IC50 values of 23 and 27 μM, respectively.
Both specificity and bioactivity are essential for quality markers (Sun et al., 2021). Finally, multiple strategies have been utilized to screen compounds fulfilling the requirements of a Q-marker. Therefore, selaginellin and selaginellin A were proven to be unique and promising quality markers of S. tamariscina.
3.5 Content determination of the quality markers of S. tamariscina
To verify the measurability of the quality markers of S. tamariscina, the contents of selaginellin and selaginellin A in the S. tamariscina sample were determined with UHPLC-QQQ-MS and multiple reaction monitoring. The calibration curve, linear range, LOD and LOQ of the two markers are shown in Table 3. The two calibration curves exhibited good linearity (r > 0.999). The recoveries of selaginellin and selaginellin A were 105.2 %, 104.6 %, 101.5 %, 96.5 %, 99.0 %, 99.5 %, 98.4 %, 98.4 %, and 97.0 % and 92.9 %, 101.2 %, 97.7 %, 94.4 %, 92.1 %, 95.6 %, 92.5 %, and 93.8 %, with RSDs of 3.3 % and 3.3 %, respectively. The intraday variations in selaginellin and selaginellin A were 2.3 % and 1.4 %, respectively (Table 4). The repeatabilities of selaginellin and selaginellin A were 2.0 % and 2.3 %, respectively. These values were within the acceptable range, demonstrating that the method was accurate and precise. The content ranges of selaginellin and selaginellin A were 41.57–44.89 μg/g and 15.09–16.75 μg/g in the S. tamariscina samples, according to the corresponding calibration curves (Table 5), proving the practical measurability of the quality markers. Collectively, based on the aforementioned bioactivity and measurability, selaginellin and selaginellin A were characterized as quality markers of S. tamariscina.
Markers
Regression equations
r
Linear range (μg/ml)
LOD (ng/ml)
LOQ (ng/ml)
Selaginellin
Y = 0.0057X + 39.312
0.9999
0.00123 ∼ 1.234
0.13
0.42
Selaginellin A
Y = 0.0007X + 16.86
0.9994
0.01960 ∼ 0.9804
1.69
6.50
Markers
Precision(RSD)(n = 6)
Stability
Repeatability(n = 6)
Recovery (n = 9)
Selaginellin
2.30 %
2.30 %
2.00 %
100.2 ± 3.3
Selaginellin A
1.40 %
1.40 %
2.30 %
95.0 ± 3.3
Species
Batch
Selaginellin (μg/g)
Selaginellin A (μg/g)
S. tamariscina
20,150,509
44.89
16.75
20,150,410
41.13
15.09
20,130,518
41.57
15.42
4 Conclusion
In summary, this study demonstrated that the integrated mass spectrometry strategy of LC-MS-based metabolomics plus molecular networking was an effective approach for differentiating S. tamariscina from four counterfeit herbs and facilitated the discovery of specific Q-markers in S. tamariscina. The OPLS-DA model revealed that selaginellins were major differential metabolites, while selaginellin and selaginellin A predominantly contributed to distinguishing the species. Moreover, selaginellin and selaginellin A isolated from S. tamariscina were characterized by molecular networking and NMR, proving to be the exclusive Q-markers. Network pharmacology and in vitro bioactive assays confirmed the antitumor activity of the Q-markers. UHPLC-QQQ-MS-based multiple reaction monitoring was applied for further content determination and quality control of S. tamariscina. Integrated strategies combining UHPLC-QTOF-MS-based metabolomics, molecular networking and UHPLC-QQQ-MS-based multiple reaction monitoring were a valuable approach for screening, characterizing and determining the quality markers of TCM responsible for disguising S. tamariscina from counterfeit herbs.
Acknowledgment
This work was financially supported by the Key Project of Changsha Science and Technology Plan (No. kq1801072, Changsha Science and Technology), Changsha Natural Science Foundation (No. Kq2014143, Changsha Science and Technology), Hunan Natural Science Foundation (No. 2020JJ9003, Hunan Science and Technology) and the Construction Program of Hunan’s Innovative Province (CN) - High-tech Industry Science and Technology Innovation Leading Project (2020SK2002, Changsha Science and Technology.. In addition, we are very grateful to Prof. Guo-Gen Liu (Modern Analysis and Testing Centre of Central South University) for the NMR measurement.
CRediT authorship contribution statement
Gui-Shan Tan and Yi-Kun Wang conceived and designed the study. Wei Zhang performed the experiments and analyzed the data. Wen-Bo Li, Hui Zou, and Kang-Ping Xu analyzed the data and supported the planning and interpretation of the experiments. Hong-Ping Long and Jing Li visualized the figure and provided resources. Qi Huang and Zhen-Xing Zou drafted the manuscript. All authors revised and approved the final manuscript.
Declaration of Competing Interest
The authors declare that they have no known competing financial interests or personal relationships that could have appeared to influence the work reported in this paper.
References
- The traditional and modern uses of Selaginella tamariscina (P.Beauv.) Spring, in medicine and cosmetic: applications and bioactive ingredients. J. Ethnopharmacol.. 2021;280:114444
- [CrossRef] [Google Scholar]
- Quantification and discovery of quality control chemical markers for Ba-Bao-Dan by UPLC–MS/MS combined with chemometrics. J. Pharmaceuti. Biomed.. 2021;204:114273
- [Google Scholar]
- Phytochemistry of the genus Selaginella (Selaginellaceae) J. Medi. Plants Res.. 2013;7(25):1858-1868.
- [Google Scholar]
- A novel strategy for screening bioavailable quality markers of traditional Chinese medicine by integrating intestinal absorption and network pharmacology: application to Wu Ji Bai Feng Pill. Phytomedicine. 2020;76:153226
- [CrossRef] [Google Scholar]
- Discovery of markers for discriminating the age of cultivated ginseng by using UHPLC-QTOF/MS coupled with OPLS-DA. Phytomedicine. 2018;45:8-17.
- [CrossRef] [Google Scholar]
- Selaginellins from the genus Selaginella: isolation, structure, biological activity, and synthesis. Nat. Prod. Rep.. 2021;38(4):822-842.
- [CrossRef] [Google Scholar]
- DNA barcodes for the identification of Anoectochilus roxburghii and its adulterants. Planta. 2015;242(5):1167-1174.
- [CrossRef] [Google Scholar]
- Network-based strategies in metabolomics data analysis and interpretation: from molecular networking to biological interpretation. Exp. Rev. Proteomics. 2020;17(4):243-255.
- [CrossRef] [Google Scholar]
- (Poly) phenolic fingerprint and chemometric analysis of white (Morus alba L.) and black (Morus nigra L.) mulberry leaves by using a non-targeted UHPLC–MS approach. Food Chem.. 2016;212:250-255.
- [Google Scholar]
- Quality markers based on phytochemical analysis and anti-inflammatory screening: an integrated strategy for the quality control of Dalbergia odorifera by UHPLC-Q-Orbitrap HRMS. Phytomedicine. 2021;84:153511
- [CrossRef] [Google Scholar]
- Determination of amentoflavone in Selaginella tamariscina from Guizhou and Hunan by RP-HPLC. Chin. Pharm.. 2008;19:1169-1170.
- [Google Scholar]
- Selaginellin M, a new selaginellin derivative from Selaginella pulvinata. J. Asian Nat. Prod. Res.. 2011;13(11):1051-1055.
- [Google Scholar]
- Two new selaginellin derivatives from Selaginella tamariscina (Beauv.) Spring. J. Asian Nat. Prod. Res.. 2011;13(4):356-360.
- [CrossRef] [Google Scholar]
- Approaches to establish Q-markers for the quality standards of traditional Chinese medicines. Acta Pharmaceutica Sinica B. 2017;7(4):439-446.
- [Google Scholar]
- Isolation and cytotoxic activity of selaginellin derivatives and biflavonoids from Selaginella tamariscina. Planta Medi.. 2012;78(04):390-392.
- [Google Scholar]
- Selaginellin inhibits melanogenesis via the MAPK signaling pathway. J. Nat. Prod.. 2022;85(4):838-845.
- [Google Scholar]
Appendix A
Supplementary material
Supplementary data to this article can be found online at https://doi.org/10.1016/j.arabjc.2022.104281.
Appendix A
Supplementary material
The following are the Supplementary data to this article:Supplementary data 1
Supplementary data 1


