

Translate this page into:
Self assembly in an aqueous gemini surfactant containing sugar based (isosorbide) spacer
⁎Corresponding author at: Applied Chemistry Department, Faculty of Technology & Engineering, The Maharaja Sayajirao University of Baroda, Vadodara 390 002, Gujarat, India. drksanjeev@gmail.com (Sanjeev Kumar)
-
Received: ,
Accepted: ,
This article was originally published by Elsevier and was migrated to Scientific Scholar after the change of Publisher.
Peer review under responsibility of King Saud University.
Abstract
Effect of various stimuli (concentration, pH, temperature and salt) have been investigated, in aqueous isosorbide (sugar based) spacer based cationic gemini surfactant with hexadecyl chain (16-Isb-16), using spectroscopic and physico-chemical techniques (dynamic light scattering, DLS; nuclear magnetic resonance, NMR; transmission electron microscopy, TEM; polarizing optical microscopy; POM; zeta (ζ)-potential; count rate; pH and conductometry). An interesting phenomenon of micelle to vesicle transition (MVT) has been observed upon dilution. pH sensitive systems, including micelles and vesicles, are found in the solution without changing the pH externally. For external pH change (in the acidic range), DLS data revealed that vesicles are present near the neutral pH. The morphological transitions were confirmed by TEM and POM. ζ data show the conversion of positively charged aggregates to neutral ones. MVT has also been checked by increasing the temperature or adding a salt (NaCl, NaBr, NaNO3 or sodium salicylate; NaSal). Heating induces a transition from micelles to vesicles near ∼40–45 °C while salt addition causes a reverse effect (vesicle to micelle). The transition has been found to be dependent on concentration/nature of salt. The study provides a simple and effective way of tuning the micellar morphology.
Keywords
Isosorbide
Cationic gemini surfactant
Micelle-Vesicle-Micelle Transition (MVMT)
1H NMR
TEM
Dynamic light scattering

1 Introduction
Among surfactant morphologies (spherical micelle, elpsoidal micelle, rod shape micelle, worm like micelle, vesicle, helical structure or tubelar shape) that have been obtained so far, micelle/ vesicle has attracted much attention because they can serve different purposes such as biological model membrane, containers for encapsulation and eventual release of drugs, microreactor, solubilization facilitator and template for inorganic nanoparticles synthesis (Rosoff and Dekker, 1995; Lipowsky et al., 1995; Zheng et al., 2017; Parikh et al., 2015; Lasic, 1994; Yaacob et al., 1995; Yark and Dimova, 2011, Hanwu et al., 2013; Sun et al., 2017; Singh et al., 2017). In particular, structural transitions between vesicles and micelles are of great importance (Yin et al., 2003; Jiang et al., 2009), for the reason that such phenomenon (micelle to vesicle transitions, MVT/vesicle to micelle transitions, VMT) offers an easy way of encapsulating active agents (like drug) by dissolving them in micellar solution prior to vesicle formation. This is important from both practical (Russell, 2003; Martinez et al., 2000) and fundamental (Hanczyc et al., 2003; Laurent et al., 2008) points of view. Generally, MVT/VMT can be induced by changing the environmental factors like concentration (Russell, 2003; Hu et al., 2005; Speers and Wu, 2007; Mohanty et al., 2007; Verma et al., 2011; Zhang et al., 2012), temperature (Yin et al., 2003; Yin et al., 2006; Ryhanen et al., 2006; Kim et al., 2008; Ke et al., 2014), pH (Johnsson et al., 2003; Scarzello et al., 2006; Yang et al., 2012; Singh et al., 2013; Jiang et al., 2014; Maiti et al., 2015), light (Jia et al., 2015), CO2 (Li et al., 2014) or additive (Filipovic-Vincekovic et al., 1998; Zhai et al., 2005; Renoncourt et al., 2007; Tung et al., 2008; Jiang et al., 2008; Yu et al., 2010; Song et al., 2005; Thapa et al., 2013; Li et al., 2007; Rao et al, 2015).
Most of the studies on MVT/VMT or vesicular structure formation deal with mixed cationic-anionic surfactant (Yin et al., 2003; Kresge et al., 1992; Rosoff, 1996; Birdi, 1997; Evans and Wennerstrom, 1999; Makai et al., 2003) systems because they can easily be form stable structures. Vesicle (or VMT) formation in a single conventional cationic/anionic surfactant solution has rarely been found (Mohanty et al., 2007; Yang et al., 2012; Wu et al., 2010). There are few reports available on MVT in an aqueous gemini surfactant or their mixtures under various experimental conditions (concentration, temperature or pH) (Ryhanen et al., 2006; Johnsson et al., 2003; Jiang et al., 2014; Pei et al., 2011). However, mechanism of the MVT/VMT is yet to be settled (Tehrani-Bagha et al., 2007).
In the present work, we have studied the effect of different stimuli (concentration, pH, temperature and additive as organic and inorganic salts) on morphological transitions (MVT/VMT) of an aqueous isosorbide spacer based cationic gemini surfactant with hexadecyl chain length (16-Isb-16, Fig. 1) system using different spectroscopy and other techniques (dynamic light scattering (DLS), 1H NMR (nuclear magnetic resonance), Zeta (ζ) potential, transmission electron microscopy (TEM), polarizing optical microscopy (POM), pH and conductometry) at 25 °C.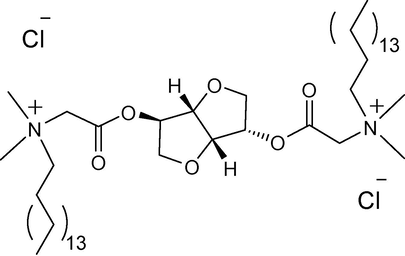
Representative chemical structure of isosorbide spacer based cationic gemini surfactant with hexadecyl chain length (denoted as 16-Isb-16).
2 Materials and methods
2.1 Materials
Sodium chloride (NaCl, 99.5%, Merck), sodium nitrate (NaNO3, 99.80%, Merck), sodium bromide (NaBr, 99.50%, Sigma Aldrich) and sodium salicylate (NaSal, 99.5%, Merck) were dried in vacuum oven for 3–4 h before use sodium hydroxide (NaOH, 99.50%, Merck), chloroform (CHCl3, 99.80%, Spectro-chem), were used as received. D2O (99.9%, atomic percentage Deuterium, Sigma Aldrich) and standard NMR tubes have been used for 1H NMR study and kept in a moisture free environment (in acrylic box with continuous N2 supply). Sodium dihydrogen phosphate (0.477 mol/L) and sodium hydrogen phosphate (0.523 mol/L) have been used to prepared buffer of 7.0 pH. Water has been demineralized by double distillation in glass assembly. The specific conductivity of distilled water was 1–2 µS·cm−1.
Isosorbide spacer (biocompatible) based cationic gemini surfactant with hexadecyl chain length (16-Isb-16, Fig. 1) have been synthesized and characterized as reported earlier (Parikh et al., 2015).
2.2 Methods
2.2.1 Sample preparation
All the samples of 16-Isb-16 with and without salt are prepared in double distilled water using requisite amount of the surfactant (or salt). For the purpose, 10 mM stock solution was prepared and used for getting 16-Isb-16 solution of lower concentrations (by dilution). For NMR measurements the 16-Isb-16 solutions are prepared in D2O. The sample so obtained (in H2O) are used for conductometric, microscopy and DLS measurements. Samples, to see the salt effect, are prepared in various solutions of salt using them as solvent to prepare 16-Isb-16 solutions. Samples with required pH were prepared by either using buffer solution (pH = 7) (vide supra) or adjusted by addition of an appropriate volume of sodium hydroxide (NaOH) solution. It may be mentioned that sample sizes were different for different measurements and mentioned at an appropriate place.
2.2.2 Dynamic Light Scattering (DLS) and Zeta (ζ) potential measurements
Dynamic light scattering measurements were performed with a Brookhaven 90 plus spectrometer equipped with built in temperature controller (±0.5 °C). Light of λ of 633 nm (from 15 mW solid state He-Ne laser) was used as the incident beam. The scattering angle was 90° and the intensity auto-correlation functions were analyzed by using the methods of Cumulant and non-negatively constrained least-squares (NNLS) algorithm (software available with the instrument). The hydrodynamic diameter (Dh) was calculated according to Stokes-Einstein equation, Dh = kBT/(3πηD) where, D is diffusion coefficient, kB is the Boltzmann constant, T is the absolute temperature, and η is the solvent viscosity. For particle size measurements, a 2.5 ml of surfactant solution of appropriate concentration was filtered through 0.22 μm nylon membrane filter to remove dust particle from the solution. Filtered solution was directly transferred into the 10 mm plastic cuvette (washed each time (before use) with fresh double distilled water to avoid dust particles). Sample cuvette was placed in the sample chamber after the initialization of the instrument (15 min). The data obtained in each case are the average of 10 runs, each run of 30 s duration.
Zeta (ζ) – potential was also obtained by the zeta analyzer on the same instrument (Brookhaven 90 plus spectrometer) at 25 °C as well as at various temperatures. To obtain zeta and count rate, pH, particle size and concentration were fitted in the software. About 1.5 ml of surfactant solution was transferred into dipped (Uzgiris type) electrode plastic cuvette through nylon membrane filter (0.22 μm) and placed in a sample chamber. Data are average of 5 decay cycles (each decay cycle is of 5 runs with a 5 s interval).
2.2.3 1H NMR measurements
1H nuclear magnetic resonance (NMR) measurements were recorded on a Bruker spectrometer operating at 400 MHz. All gemini surfactant solutions were prepared in Deuterium oxide (D2O). Each surfactant solution (0.6–0.7 ml) was transferred to a 5 mm NMR tube for measurements. In all experiments, numbers of scans was adjusted to achieve good signal to noise ratio.
2.2.4 Microscopy
Transmission electron microscopy (TEM) images were obtained with a Philips Tecnai F 20 electron microscope, accelerating at a working voltage of 200 kV with CCD camera. A drop of gemini surfactant solution was placed on to the carbon-coated copper grid (200 mesh). Excess of water was blotted off with soft filter paper to form a thin film on the grid.
Polarizing optical microscopy (POM) of Leica (DM2500) having differential interference contrast (DIC) lenses was also used for visualization of aggregates. Image was captured with an inbuilt Leica camera. Samples solution was applied on a Linkem heating chamber with quartz crucible. The Linkem chamber, with inbuilt heating sensor, was heated gradually (1°C/min) with the help of digital monitoring controller. The images with scale bar were obtained from the Leica software which is come inbuilt.
2.2.5 pH measurements
The pH measurement has been performed on calibrated digital Equip Tronics (EQ-614A) pH meter with an attached temperature controller.
2.2.6 Conductivity measurements
Conductometric measurements were performed by using a conductivity meter (EUTECH cyberscan CON510, cell constant 1 cm−1) with an inbuilt temperature sensor to obtain the micellar morphology. A pre-calibrated (calibration done by 100 µS/cm KCl NIST traceable standard solutions) conductivity cell was used to obtain a specific conductance (κ) at relevant temperature range. The stated uncertainty of the measurements was ±0.01 μS·cm−1. All the experiments were carried out in a water bath (SCHOTT CT1650) with an accuracy of ±0.05 K. The cell dipped in 30 ml of 5 mM solution of 16-Isb-16 and placed in a thermostat for at least 30 min before the measurement. The temperature was varied (20–65 °C) and conductance has been noted at each temperature.
3 Results and discussion
3.1 Effect of concentration
Effect of [16-Isb-16] on morphological transitions has been studied using various techniques. The 16-Isb-16 concentration (critical micelle concentration (CMC) = 3.5 µM) (Parikh et al., 2015) was varied from 0.005 to 20 mM. The most dramatic changes are observed between 1 and 5 mM.
1H NMR has been used to get an idea about the environmental change of different protons during the aggregation process as well as micellar morphological transition (Fan et al., 2011). From Fig. 2 and S1, one can see that changes of proton chemical shift with decrease in [16-Isb-16] do not follow a regular transition profile. Interestingly, proton of −N+(CH3)2 shows splitting and shifting towards up field at lower concentration (1 mM). It may be due to the presence of −N+(CH3)2 groups in two different environments hinting towards the coexistence of two different morphologies in the solution (Kumar et al., 2012). If vesicles are present with the micelles in the sample, they cannot exchange fast with each other because of the stability of the former leading to a signal splitting (Wu et al., 2010; Villeneuve et al., 2006).
Part of 1H NMR spectrum of 16-Isb-16 as a function of concentration in D2O at ∼25 °C. NMR spectra showing the splitting of −N+(CH3)2 peak at lower concentration.
The NMR study hint about the morphological transition upon dilution. To further investigate the process, dynamic light scattering (DLS) studies are performed to measure the size of the aggregate at different concentrations of the 16-Isb-16 (Fig. 3a). Aggregates have an average hydrodynamic diameter (〈Dh〉) of 3.9 nm with narrow bimodal size distribution (SD) at 5 mM of 16-Isb-16 with low polydispersity index (PDI = 0.193, calculated by the Cumulant method). The low PDI value indicates that micelles are the dominant aggregates in the system (Fig. 3b). PDI grew from 0.193 (5 mM) to 0.466 (3 mM), which is indicative of the increase in the vesicle micelle ratio in the system on dilution (Egelhaaf and Schurtenberger, 1994). However, the PDI value again decreases to 0.223 (1 mM), indicating the predominance of one type of aggregates in the solution. It should be mentioned here that PDI values are high, and, therefore, the meaning of Dh is not state forward (Richards, 1995). The variation of relative scattering intensity against the diameter of the 16-Isb-16 aggregates (Dh) shown in Fig. 3. At 5 mM 16-Isb-16, two small size distributions at ∼1 nm and ∼20 nm co-exist. When the 16-Isb-16 concentration decreases (3 mM), the two distributions change significantly (∼5 nm and ∼200 nm). On further dilution (1 mM), a single broad SD of large size (∼400 nm) appears. DLS data show a morphological transition which is initiated by only dilution. Since, DLS does not give the aggregates size directly but the diffusion coefficient can be correlated with Dh (strong micellar attraction can result a large size and vice versa (Fan et al., 2011).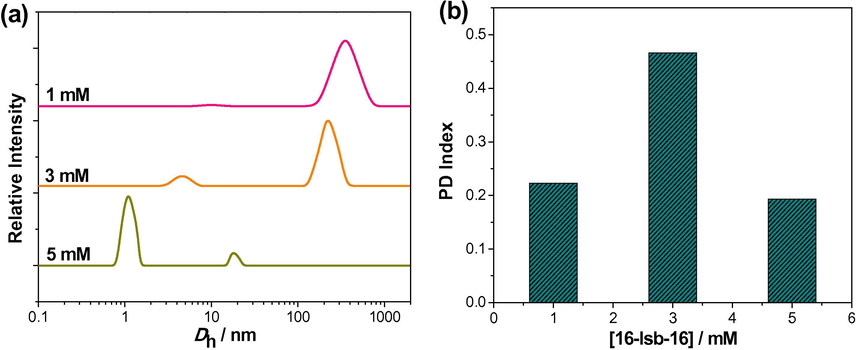
(a) Apparent hydrodynamic diameter (Dh) distributions; (b) polydispersity (PD) index of aggregates formed in the aqueous solution of 16-Isb-16 at different concentrations at 25 °C.
The size information has been collected by transmission electron microscopy (TEM) measurements Figs. 4 and S2). The aggregate morphologies are obviously different at different concentrations. At 5 mM, small aggregates are observed, which is consistent with low PDI values obtained from DLS measurements (Fig. 3b). The data show the presence of micelles with a few bigger aggregates. At 2 mM of 16-Isb-16, most of the aggregates were in the fused states. The fused aggregates transfer to large spherical aggregates at 1 mM 16-Isb-16. These aggregates are well separated and vesicular in nature (vesicles). The unique morphological transition takes place by adding simple solvent water (dilution). The presence of vesicles in 1 mM sample was even seen by a polarizing optical microscope (POM, Fig. S2). It has been reported that vesicle formation takes place in the system of quaternary ammonium gemini surfactant systems, whether they have the flexible methylene spacer or the diamido spacer which has hydrophilicity (Zhang et al., 2012). However, a reverse concentration effect on MVT has been found in this study.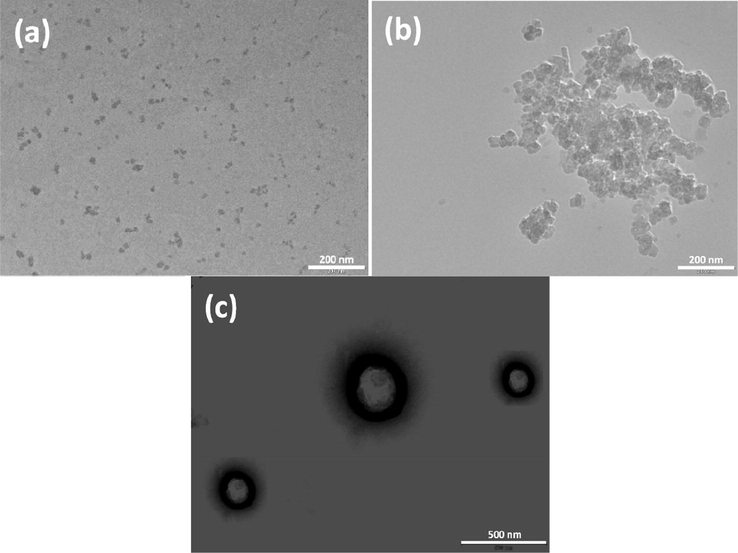
TEM images: (a) 5 mM; (b) 2 mM; (c) 1 mM (with negative stained of uranyl acetate solution for 10–15 s) of an aqueous solution of 16-Isb-16 at 25 °C. Scale bar represents: (a) 200 nm; (b) 200 nm; (c) 500 nm.
Spontaneous vesicle growth could, in principle, occur either gradually by the incorporation of monomer to the vesicles or by a step-wise fusion process with other vesicles Scheme 1). Gradual growth is possible if the rate of incorporation of monomer into pre-existing vesicles is greater than rate of spontaneous assembly into new vesicles. It has been reported that pH can play an important role in all above transitions. Fig. S3 shows the variation of pH of 16-Isb-16 solution on dilution. Looking at Figs. 4 and S3, it is clear that micelles exist at low pH (5 mM) while vesicles exist at higher pH (1 mM). A workable mechanism for these effects is given in following paragraphs.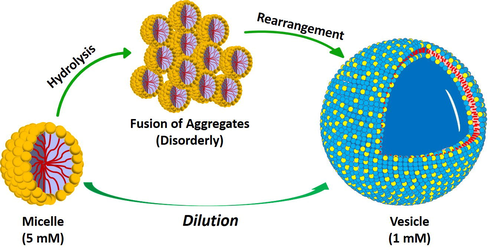
Schematic representation of dilution induced micelle to vesicle transition (MVT) in aqueous isosorbide spacer based cationic gemini surfactant (16-Isb-16.)
The 16-Isb-16 ((RSN2)2+·2Cl−, R represents both alkyl chains, S represents spacer and N2 represents two nitrogen atoms molecule being salt of strong acid and weak base can get hydrolyze (Tehrani-Bagha et al., 2007) in water according to the reaction
This is indicated by pH (4.3) in concentrated 5 mM 16-Isb-16 solution (Fig. S3). At higher concentration, the degree of hydrolysis of above surfactant would be smaller. Therefore, the ratio of ionized form of salt to that of hydrolyzed form of salt will be high and is responsible for higher repulsion between the head groups. It seems responsible for the presence of spherical micelle in the solution (Fig. 4a). With the decrease in 16-Isb-16 concentration, the degree of salt hydrolysis increases. Therefore, base form of surfactant (weak base) is expected relatively more in a typical micelle. Hence, charge on the head group will be shielded due to the presence of solubilized weak base. The idea of lower charge on the micelle finds support from our zeta potential data depicted in Fig. S3. The closer head group approach may also facilitate the hydrogen bonding in the spacer. Since charge on the aggregate is depleting, aggregates have less objection to come near to each other and can fuse. This indeed was observed in Fig. 4b.
3.2 Effect of pH
It has been seen that pH plays an important role in dilution induced morphological transition of 16-Isb-16. To understand the phenomenon, pH variation has been done in acidic range at a fixed [16-Isb-16] (Fig. 5). This is due to the fact that ester bonding in spacer group has been reported stable towards acid hydrolysis (Tehrani-Bagha et al., 2015). The chances (if any) of spacer group hydrolysis can be further suppressed in 16-Isb-16 due to its presence near two quaternary ammonium head groups (Tehrani-Bagha et al., 2007). This is also reflected in NMR data (Figs. 2 and S1) where no acid proton peak observed. pH variations in alkaline range (pH > 7.0) has not been performed due to the possibility of alkaline hydrolysis of the spacer in 16-Isb-16 (Tehrani-Bagha et al., 2015).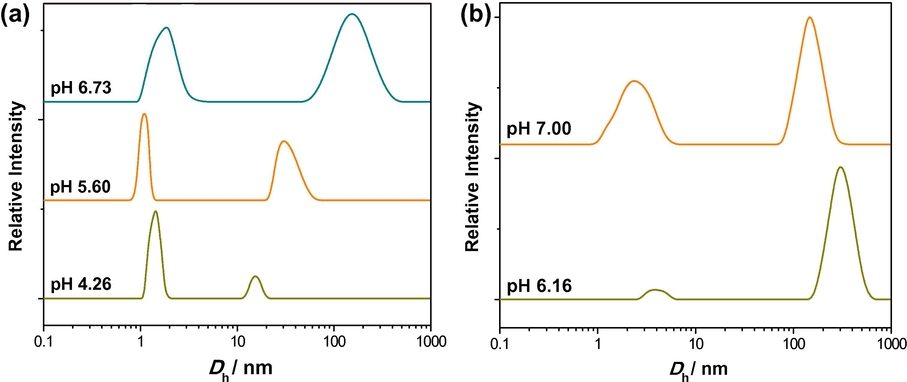
pH mediated (a, b) particle size distribution (5 mM, a and 1 mM, b) with hydrodynamic diameter (Dh) of aqueous 16-Isb-16 at 25 °C.
Structural transition in 16-Isb-16 solution, with pH (NaOH used to vary the pH = ∼7), has also been studied by DLS (Fig. 5). Two 16-Isb-16 concentrations (5 mM, micellar and 1 mM, vesicular) are used for the morphological variations. For 1 mM 16-Isb-16 (Fig. 5b) at 6.16 pH (without pH adjustment), a broad bimodal SD with most vesicular region (hydrodynamic diameter (Dh) ∼200–700 nm) has been observed. The 0.286 PDI value was also supporting for the presence of nearly mono disperse aggregates (Fig. S4a). As the pH increases to 7.00, the vesicular region decreases and micellar region crop up with an increase in PDI value 0.58. However, vesicular region is still as dominant phase. While, for 5 mM 16-Isb-16, aqueous micellar region, with pH range (4.26 to ∼7.0), have been converted/appearance of vesicular aggregates at ∼ 7.0 pH (Fig. 5a). A drastic change in PDI values were also confirmed the conversion of the aggregates (Fig. S4a). These observations show about the formation of vesicles ∼7.0 pH.
To strengthen above point, DLS of 16-Isb-16 (5 to 1 mM) has also been performed in a buffer of pH 7.0 (Fig. S4c). The result clearly indicates that the formation of vesicles is also dependent on pH irrespective of the concentrations of 16-Isb-16. Hence, pH is a vital stimulus for the formation of vesicles with 16-Isb-16. However, at pH 7 (controlled either by buffer or NaOH) gave similar size distributions with aqueous 16-Isb-16 (e.g., 1 mM). The data show any counter-ion present (phosphate) due to buffer has insignificant effect on the size of the morphology.
Zeta (ζ) – potential measurement (Fig. S4b) has also been performed to understand the morphological transitions (as well as vesicle formation) at neutral pH. For both the concentrations (5 and 1 mM), ζ decreases as the pH increases (from 4.26 to ∼7). Decrease in ζ shows the formation of pseudo-nonionic aggregates which correspond to vesicles. Thus, pH (pure, with NaOH or buffer controlled) is a key stimulus responsible for morphological transitions (Scheme 2).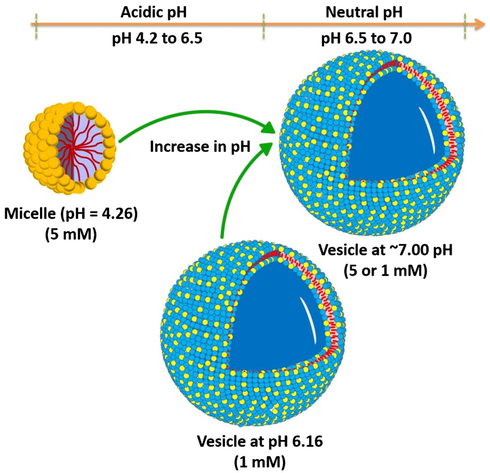
Schematic Representation of pH induced morphological transitions in aqueous solution of 16-Isb-16.
3.3 Effect of temperature
Temperature induced MVT has been observed in aqueous solution of 5 mM 16-Isb-16. However, no morphological changes are observed in 1 mM 16-Isb-16 with temperature. Micelles are formed in 5 mM aqueous solution, which is already verified by TEM (Figs. 4 and S2). Therefore, the changes (from micelle to vesicle) have been examined by the DLS within the temperature range of 25–70 °C (Fig. 6a). Fig. 6a shows that micelle is the dominant morphology at 25 °C. The lower PDI value (0.193) confirms the presence of mono disperse aggregate (Fig. 6b). When the temperature of the sample was increased (25–40 °C), aggregate size (∼1–10 nm) was dramatically changed to the morphology of ∼100–500 nm with a broad bimodal SD (Fig. 6a). On further increase in the temperature (from 40 to 70 °C), aggregates with Dh ∼100–200 nm were remained stable and bimodal SD were also converted into monomodal SD. The PDI values are also confirming the morphological transition (0.559 at ∼40 °C) and larger aggregates/vesicle formation (∼0.005–0.212 above 40 °C).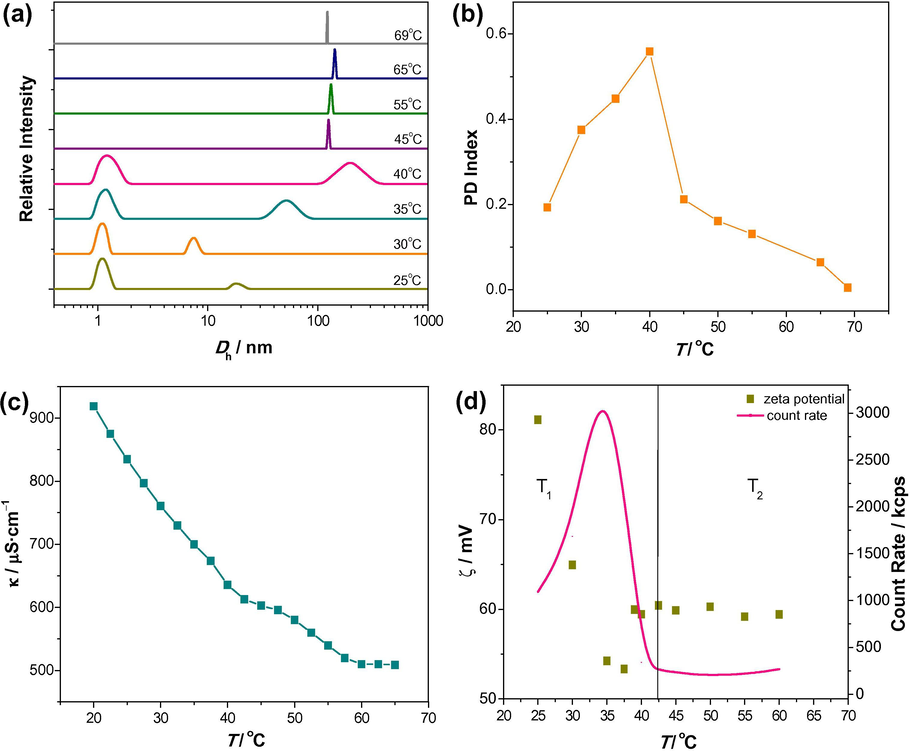
(a) Particle size distributions with hydrodynamic diameter (Dh); (b) polydispersity (PD) index; (c) variation of specific conductance (κ); (d) zeta potential (ζ) and count rate of 5 mM aqueous 16-Isb-16 at different temperatures (T, 25–70 °C).
To understand the phenomenon, this transition has also been examined by conductivity measurements (Fig. 6c). Fig. 6c demonstrates that conductance decreases as the temperature increases (from 25 to 70 °C), which is consonance to a recent study (Yang et al., 2015). Conductivity basically depends on mobility of the free ions in the solution (Zhai et al., 2005). The higher (at 25 °C) and lower (at 70 °C) value of conductance denote the presence of more and less free ions in the solution, respectively. Less free ions (without any buffer) clearly indicate the presence of lower curvature aggregates (i.e., vesicle/bilayer). However, a little break point in conductance vs T plot (40–45 °C) has also been observed which may be due to the structural transition.
These observations find support from the count rate and zeta (ζ) – potential data as a function of temperature (Fig. 6d). The clear transition has been observed at ∼42.5 °C. Similar transition (MVT) has been observe where count rate increases up to certain value (1000–3000 kcps) and then decreases (3000–300 kcps) as the temperature increases (25–40 °C) then followed by a near constancy (∼250–300 kcps) as the temperature increases further (40–60 °C). This indicates that the spherical micelles may fused together and form larger aggregates/vesicles and responsible for count rate decreases (Laughlin, 1997). Moreover, ζ values also showing similar kind of results (but the trend was a little bit different). ζ decreases (from 80 to 55 mV) and then remains constant (57–60 mV) as the temperature increases (25–60 °C). In aqueous solution, 16-Isb-16 mainly present in the form of S2+X (cationic) at room temperature (25 °C), confirmed by higher positive surface charge (+ve zeta potential). Temperature increases surface charge of the aggregate decreases. This may be due to two reasons: (a) breaking of intra-/inter- molecular H-bonding of water molecule at air-water interface; (b) bound Cl− are replaced by OH− (Zana, 2002). Therefore, surface charge density clearly showed the transfer from cationic to nonionic (SOH) or mixture of cationic and nonionic which is responsible for electrostatic attraction (counter-ion binding) and resulting into formation of vesicle at higher temperature. This was further confirmed by 1H NMR.
1H NMR spectra with −N+(CH3)2 peak (located at the air-water interface) for 5 mM 16-Isb-16 (in D2O) are shown in Fig. 7. The main observation from the Fig. 7, is the downfield shift of the −N+(CH3)2 peak (from 25 to 70 °C). This may be due to dehydration of the head group region of the surfactant aggregates (Somasundaran, 2006) which is confirming the preposition made from zeta potential results. Another observation is the splitting of the signal at higher temperature (40 °C). It may be due to the presence of −N+(CH3)2 groups in two different environments hinting towards the coexistence of two different morphologies in the solution (Kumar et al., 2012). If vesicle present with the micelle in the sample, they cannot exchange fast with each other because of long-term stability of the former, leading to signal splitting (Wu et al., 2010; Villeneuve et al., 2006). Similar kind of changes has also been observed with other peaks too.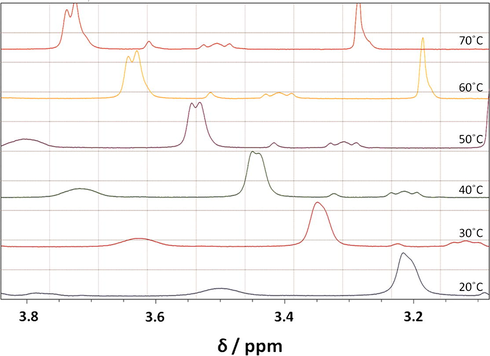
1H NMR spectra with particular −N+(CH3)2 peak of 16-Isb-16 at 5 mM concentration with different temperatures (20–70 °C) in D2O.
Above data prompted us to investigate the morphological transition (MVT) by optical microscopy. Fig. 8 shows the presence of vesicular aggregates (vesicles) with 5 mM 16-Isb-16 (at 43 °C and 47 °C). The sizes are quite comparable with DLS results (Fig. 6a). However, number of aggregates was higher in case of 47 °C. This may be due to the transition (from micelles to vesicle). Hence, it can be concluded by visual observation (and NMR) that spherical micelles converting into vesicles with increasing temperature.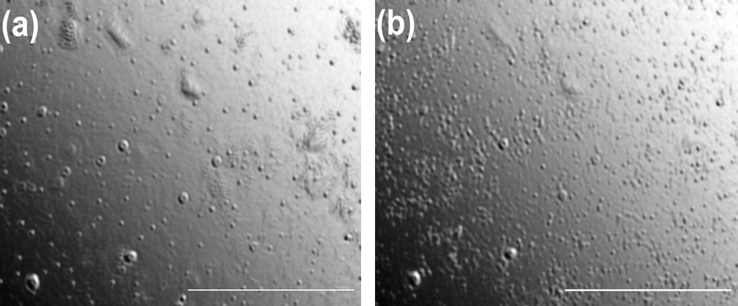
Polarizing optical microscope (POM) images of 5 mM 16-Isb-16 at (a) 43 °C and (b) 47 °C. Scale bar represents 10 µm.
3.4 Effect of salt
Various anions (in a role of counter-ion) have been added to see the morphological transition (VMT) by varying the concentration of different salts (NaCl, NaBr, NaNO3 and NaSal) in aqueous solution of 1 mM 16-Isb-16 (fixed) at 25 °C. Vesicles were the major aggregates in the 1 mM aqueous solution of 16-Isb-16 (as already verified by TEM, Figs. 4 and S2 and DLS results, Fig. 3b). These vesicular aggregates shown salt induced destabilization. The degree of destabilization has been found dependent upon nature of the counter-ion and its binding capacity to the micelle (Rehage and Hoffmann, 1988). Presence of counter-ion reduces the overall charge of the aggregates and presence of excess counter-ion can destabilized the vesicles into higher curvature aggregates (micelle) this indeed was observed from DLS data (Fig. 9). Vesicles in 1 mM aqueous solution of 16-Isb-16 (monomodal SD, Dh ∼200–500 nm) with relatively lower (∼0.2) PDI value (Fig. S5). It can be seen that monomodal SD (vesicle) is converting into broad bimodal SD (Fig. 9) with a Dh ∼5–10 nm (micelle) and ∼ 200–600 nm (vesicle) with the addition of salt (NaCl, NaBr, NaNO3 or NaSal). The higher PDI values (0.35–0.8, Fig. S5) also support the conversion of vesicles into micelles. Similar type of salt effect has been observed in earlier studies too with different amphiphilic systems (Zhang et al., 2012; Rao et al., 2015). However, quaternary salt has been reported to induce MVT (Thapa et al., 2013) and has been discussed in the light of modification of hydrophobic interactions. With further increase of [salt], broad bimodal SD converted into narrow monomodal SD with a Dh ∼3–8 nm with relatively lower PDI value (∼0.05–0.2). This indicates complete conversion into micellar structure. However, the concentration required for VMT was different for each sodium salt defining the role of counter-ion (anion) specificity. For instance, a large amount of NaCl (75–100 mM) was required for transition, whereas, NaSal was needed only 1–2 mM. It allows following order of the anions according to the requirements of the salt for VMT, Sal− < Br− < NO3− < Cl−. Similar ordering of anions was also observed for polydispersity index (Fig. S5). Above ordering has been found in good agreement with the classical Hofmeister like series (Leontidis, 2002).![Particle size distribution with hydrodynamic diameter (Dh) of aqueous 1 mM 16-Isb-16 solution at different [salt]: (a) NaCl; (b) NaBr; (c) NaNO3; (d) NaSal, at 25 °C.](/content/184/2020/13/1/img/10.1016_j.arabjc.2018.01.020-fig11.png)
Particle size distribution with hydrodynamic diameter (Dh) of aqueous 1 mM 16-Isb-16 solution at different [salt]: (a) NaCl; (b) NaBr; (c) NaNO3; (d) NaSal, at 25 °C.
In the last decade, salt induced VMT in single surfactant system has been reported (Mohanty et al., 2007; Ryhanen et al., 2006; Jiang et al., 2008). With the help of the earlier interpretation, a working mechanism for VMT in the present case is proposed: a weakening of electrostatic attraction between S2+X (cationic) and/or S2+OH (neutral form of surfactant) types of surfactant monomer in presence of salt are expected. The order of counter-ion binding plays an important role. The addition of any salt/anion (Cl−/Br−/NO3−/Sal−) would bind to the gemini species (meanwhile will replace the OH−) and probably decrease in the attraction (inter-/intra-molecular H-bonding) between head groups/spacer, resulting into a breakdown of bilayer/vesicle structure (Pandit and Berkowitz, 2002).
NaCl concentration required for VMT is five times higher than of NaBr. NaBr and NaNO3 concentrations are not much different. However, NaSal concentration required is fifteen and seventy-five times lower than the NaCl and NaBr, respectively. This is because of difference in order of counter-ion binding to the surfactant aggregates.
4 Conclusion
Stimuli responsive (concentration (dilution), pH, temperature and nature of salt) morphological transitions (micelle to vesicle/vesicle to micelle transition) have been observed in an aqueous isosorbide (sugar) spacer based cationic gemini surfactant (16-Isb-16). Moving from acidic to the neutral pH causes micelle to vesicle transition (MVT). Zeta potential data show a charge decrease on the aggregate with increasing the pH (only in acidic range). Similar effect has also been observed on heating of 5 mM 16-Isb-16 (∼45 °C). However, a reverse effect (vesicle to micelle transition, VMT) was observed with addition of salt. VMT was found dependent on [salt] as well as nature of counter-ion and follow the order: Sal− < NO3− < Br− < Cl−. The work may find application in the fields of controlled drug release as well as in other biological phenomenon (Bhattacharya and Samanata, 2011; Szostak et al., 2001; Zepik et al., 2008; Mancy et al., 2008).
Acknowledgement
Kushan Parikh is thankful to the UGC BSR RFSMS, New Delhi, India for financial support to carry out this work (F. No. 7-303/2010(BSR)). Authors are also thankful to Head, Department of Chemistry, The Maharaja Sayajirao University of Baroda, for providing research facilities. We would also like to acknowledge Geology department, M.S. University of Baroda for POM facility.
References
- J. Phys. Chem. Letter. 2011;2:914.
- Surface and Colloid Chemistry. New York: CRC Press; 1997.
- J. Phys. Chem.. 1994;98:8560.
- The Colloidal Domain, Where Physics, Chemistry, Biology and Technology Meet (second ed.). New York: John Wiley; 1999.
- Langmuir. 2011;27:10570.
- J. Colloid Interface Sci.. 1998;201:59.
- Science. 2003;302:618.
- Chem. Soc. Rev.. 2013;42:3862.
- J. Am. Chem. Soc.. 2005;127:6526.
- RSC Adv.. 2015;5:640.
- Colloid Polym. Sci.. 2014;292:739.
- Langmuir. 2008;24:4600.
- Soft Matter. 2009;5:599.
- J. Am. Chem. Soc.. 2003;125:757.
- Soft Matter. 2014;10:5201.
- J. Phys. Chem. B. 2008;112:7420.
- Nature. 1992;359:710.
- J. Phys. Chem. B. 2012;116:3699.
- Angew. Chem. Int. Ed.. 1994;33:1685.
- Colloids Surf. A. 1997;128:27.
- Chem. Rev.. 2008;108:2064.
- Current Opin. Colloid Interface Sci.. 2002;7:81.
- Chem.-Eur. J.. 2007;13:9495.
- Phys. Chem. Chem. Phys.. 2014;16:3640.
- Handbook of Biological Physics. Amsterdam: Elsevier; 1995.
- Langmuir. 2015;31:32.
- Int. J. Pharm.. 2003;256:95.
- Nature. 2008;454:122.
- Science. 2000;287:1245.
- J. Phys. Chem. B. 2007;111:7155.
- Biophys. J.. 2002;82:1818.
- Colloid Polym. Sci.. 2015;293:1437.
- J. Mol. Liq.. 2015;206:19.
- J. Colloid Interface Sci.. 2011;356:176.
- J. Phys. Chem. B. 2015;119:4263.
- J. Phys. Chem.. 1988;92:4712.
- Langmuir. 2007;23:2376.
- Scattering Methods in Polymer Science. London: Ellis Horwood Limited; 1995.
- Vesicles. New York: Marcel Dekker; 1996.
- Rosoff, M., Dekker, M., 1995. Surfactant Science Series, vol. 62, Vesicles. Inc., New York.
- Science. 2003;302:580.
- J. Am. Chem. Soc.. 2006;128:8659.
- Langmuir. 2006;22:2558.
- J. Phys. Chem. B. 2017;121:8756.
- Langmuir. 2013;29:5734.
- Encyclopaedia of Surface and Colloid Science. New York: CRC Press; 2006.
- Angew. Chem. Int. Ed.. 2005;117:4018.
- Chem. Rev.. 2007;107:3687.
- Cryst. Eng. Comm.. 2017;19:3288.
- Nature. 2001;409:387.
- J. Colloid Interface Sci.. 2007;312:444.
- J. Colloid Interface Sci.. 2015;449:72.
- Soft Matter. 2013;9 11225
- J. Am. Chem. Soc.. 2008;130:8813.
- J. Colloid Interface Sci.. 2011;359:163.
- J. Phys. Chem. B. 2006;110:17830.
- Langmuir. 2010;26:7922.
- J. Colloid Interface Sci.. 1995;171:73.
- J. Colloid Interface Sci.. 2012;380:83.
- Soft Matter. 2015;11:8848.
- Biomimetic Based Applications, Nanoparticle Synthesis in Vesicles Microreactors. In Tech; 2011.
- Angew. Chem. Int. Ed.. 2003;42:2188.
- Chem. Eur. J.. 2006;12:2825.
- J. Phys. Chem. B. 2010;114:14955.
- Adv. Colloid Interface Sci.. 2002;97:205.
- Angew. Chem. Int. Ed.. 2008;47:1323.
- J. Phys. Chem. B. 2005;109:5627.
- J. Colloid Interface Sci.. 2005;284:698.
- Langmuir. 2012;28:11979.
- Green Chem. Lett. Rev.. 2017;10:202.
Appendix A
Supplementary material
Supplementary data associated with this article can be found, in the online version, at https://doi.org/10.1016/j.arabjc.2018.01.020.
Appendix A
Supplementary material
Supplementary data 1
Supplementary data 1


