

Translate this page into:
Self-exothermic reaction assisted green synthesis of carbon dots for the detection of para-nitrophenol and β-glucosidase activity
⁎Corresponding author. xianggq@haut.edu.cn (Guoqiang Xiang)
-
Received: ,
Accepted: ,
This article was originally published by Elsevier and was migrated to Scientific Scholar after the change of Publisher.
Peer review under responsibility of King Saud University.
Abstract
A rapid, green synthesis strategy assisted by a self-exothermic reaction was designed to prepare highly luminescent carbon dots (CDs) from Ganpu tea infusion (G-CDs) within 5 min using H2O2 and diethylenetriamine (DETA) as the exothermic reactants. G-CDs were successfully obtained through a self-exothermic reaction The prepared G-CDs exhibited clear excitation-dependent characteristics and displayed a strong ultraviolet fluorescence emission (385 nm) at the excitation wavelength of 320 nm. The fluorescence of G-CDs was quantitatively quenched by para-nitrophenol (p-NP) with a concentration range of 0.05–50 µM through inner filter effect (IFE). Since p-NP is one of the hydrolysates of the substrate pNPG under the action of Beta-glucosidase (β-Glu), a new fluorescence assay was developed for the indirect determination of β-Glu activity. The detection limits of G-CDs based fluorescence assays are 14.6 nM for p-NP and 0.074 U·L-1 for β-Glu activity, respectively. The developed fluorescence assays were successfully applied to the detection of p-NP in water and human urine samples and β-Glu activity in fruit samples with satisfactory results.
Keywords
Carbon dots
β-glucosidase
Self-exothermic reaction
Para-nitrophenol
Inner filter effect

1 Introduction
Para-nitrophenol (p-NP) is an important synthetic intermediate for manufacturing textiles, rubber, leather, pesticides, medicines, explosives, plastics, and dyes (Tan et al., 2019; Huang et al., 2019; Xiong et al., 2019; Tiwari et al., 2019). However, as a widespread contaminant in industrial and agricultural wastewater, p-NP exhibits high stability, high water solubility, and poor biodegradability, resulting in its gradual accumulation in environmental water (Mei et al., 2019). Studies have shown that human exposure to p-NP can cause damage to the central nervous system, cardiovascular system, and mucous membrane (Fatima et al., 2019), due to which water contaminated with p-NP has become an increasingly serious environmental pollution problem nowadays. Therefore, p-NP has been listed as a priority pollutant by the U.S. Environmental Protection Agency (USEPA), and the maximum allowable limit of p-NP in drinking water is approximately 0.43 μM (Zhu et al., 2017). Furthermore, p-NP has been used as an effective biomarker for parathion and methyl parathion exposure (Rubin et al., 2002), and it is one of the most frequently detected exogenous metabolites in human urine (Kutz et al., 1992). Therefore, a simple method for the selective, sensitive monitoring of p-NP is highly desired.
To date, various traditional analytical techniques, such as chromatographic techniques (Kumar et al., 2015; Li et al., 2020a; Du and Fung, 2018), electrochemical methods (Huang et al., 2021a), and chemiluminescence method (Díaz et al., 1998), have been applied to monitor p-NP in different real samples. However, these methods suffer from drawbacks such as the requirement of complicated and expensive instruments, unstable electrodes, and time-consuming sample pretreatment (Tian et al., 2019). On the contrary, fluorescence assays for p-NP have attracted extensive attention due to their excellent sensitivity, rapid response, and simple operation (Zhang et al., 2019b; Zhai et al., 2020; Ding et al., 2021; Liu et al., 2021). A variety of fluorescent materials with excellent luminescence properties, such as metal–organic frameworks (MOFs) (Zhang et al., 2019a), quantum dots (Geng et al., 2016; Zhang et al., 2019b; Tian et al., 2019; Ding et al., 2021; Ning et al., 2020; Peng et al., 2021), organic fluorescent dyes (Dai et al., 2020), and metal nanoclusters (Li et al., 2020b) have been applied for the determination of p-NP in different kinds of samples. Among these fluorescent probes, CDs have attracted more attention due to their excellent characteristics, such as low toxicity, easy preparation and modification, good biocompatibility and adjustable luminescence properties (Li et al., 2019, 2021). For the preparation of CDs, solvothermal (hydrothermal)-assisted strategy is widely accepted because of its simplicity, environmental friendliness, and high efficiency. However, the solvothermal procedure is time consuming and energy-intensive. Therefore, the development of facile, rapid, and low-energy-consumption approaches for the synthesis of CDs with high fluorescence quantum yields is still a significant challenge (Deng et al., 2021; Thangaraj et al., 2021; He et al., 2022).
Beta-glucosidase (β-Glu, EC 3.2.1.21) is a hydrolase that can specifically cleave the glycosidic bond, and it plays crucial roles in a variety of biological processes (Bi et al., 2019; Liu et al., 2022). In addition to being an essential indicator for medical diagnosis, β-Glu acts as a vital flavor enzyme in foods and beverages (Lee et al., 2016; Liu et al., 2022). Many flavor compounds in fruits and plant tissues are glycosylated and accumulate as non-volatile and tasteless glycoconjugates that can be released by acid or enzymatic hydrolysis. Volatile flavor compounds (monoterpenes and vanillin) can be liberated from β-D-glycosides by β-Glu, and β-Glu activity is an important factor affecting the flavor of grapes, apricots, peaches, tea, wines, etc. (Whitaker et al., 2003). Therefore, the development of reliable and sensitive analytical methods for monitoring β-Glu activity is significant. The conventional method for β-Glu activity monitoring was proposed by Tabatabai and Eivasi, and it is based on the conversion of the substrate p-nitrophenyl-β-D-glucopyranoside (pNPG) to p-NP with the spectrophotometric quantitation of p-NP concentrations (Trasar-Cepeda et al., 2008). Fortunately, many reported fluorescence assays based on different fluorescent nanomaterials for p-NP gave constructive reference to the development of fluorescence methods for the determination of β-Glu activity with the advantages of simplicity, fast response, and high sensitivity (Kong et al., 2020; Ma et al., 2020; Peng et al., 2022).
Herein, fluorescent G-CDs were prepared through a self-exothermic reaction assisted green procedure using Ganpu tea infusion as the carbon source. The G-CDs possesses strong fluorescent emission peak at 385 nm, which overlaps greatly with the absorption peak of p-NP (400 nm). This spectral overlap gives p-NP a distinct IFE on the fluorescence of G-CDs. Based on this IFE, a sensitive and selective fluorescence assay for p-NP was developed. Furthermore, this fluorescence assay was also applied to the indirect determination of β-Glu activity in fruits based on the conversion of the substrate pNPG to p-NP under the action of β-Glu. The G-CDs were successfully applied as a fluorescent probe for the sensitive and quick detection of p-NP in water and human urine samples and β-Glu activity in fruit samples (Scheme 1).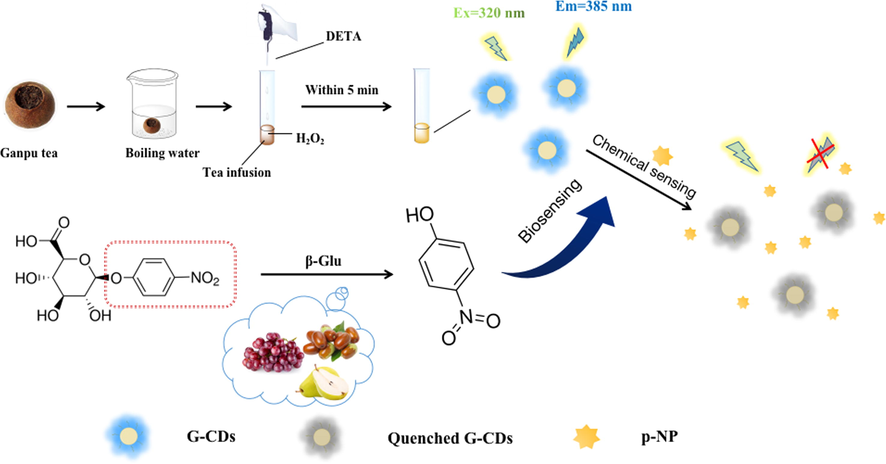
A schematic of the synthetic strategy for G-CDs and the sensing principles for p-NP and β-Glu.
2 Experimental
2.1 Apparatus and reagents
Transmission electron microscopy (TEM) images of G-CDs were obtained by a Tecnai G2 F30 transmission electron microscope (FEI, USA). The elemental composition of G-CDs was measured with an Escalab 250Xi X-ray photoelectron spectrometer (Thermo, USA). A fluorescence spectrometer (Shimadzu, Japan, RF-6000) was employed to obtain the excitation and emission spectra. A time-correlated single-photon counting (TCSPC) fluorescence lifetime spectrometer (Horiba Jobin Yvon, France) was used to measure the fluorescence lifetime of G-CDs. The Fourier transform infrared (FTIR) absorption spectra were recorded on a WQF-510 FTIR spectrometer (Beijing Beifen-Ruili Analytical Instrument (Group) Co. Ltd., Beijing, China) using KBr pellets. The absorption spectra were obtained by using a UV–Vis spectrophotometer (Shimadzu, UV-2450).
p-NP, H2O2 (30%), diethylenetriamine (DETA), β-Glu (100 U·g−1), polyvinyl pyrrolidone (PVP) and p-nitrophenyl-β-D-glucuronide (pNPG) were obtained from Shanghai Aladdin Biochemical Technology Co., Ltd. (Shanghai, China). Sugars, amino acids (including glucose (Glc), lactose (Lac), fructose (Fru), D-mannose (Man), sucrose (Suc), lysine (Lys), glutamic acid (Glu), and cysteine (Cys)), and metal salts were purchased from Sangon Biotech (Shanghai) Co. Ltd. (Shanghai, China). Britton-Robinson (BR) buffer solutions were used to adjust the pH of the testing solutions. All the chemical reagents were of analytical grade and used without further purification. Ganpu tea with a storage time of three years was obtained from Chakeng village (Xinhui city, Guangdong province, China). Deionized water (18 MΩ·cm−1) obtained from a Millipore system was used in all the experiments.
2.2 Fabrication of G-CDs from Ganpu tea infusion
Based on our previous works on the rapid preparation of CDs (Su et al., 2023), a self-exothermic reaction assisted procedure was used to fabricate G-CDs within 5 min between H2O2 and DETA using Ganpu tea infusion as the carbon source. First, Ganpu tea (10.0 g) was placed into a beaker (250 mL) and then, 100 mL of boiling water was added. The mixture turned dark brown; after cooling naturally and filtration, Ganpu tea infusion was obtained. The self-exothermic reaction assisted procedure is as follows: 1.75 mL of Ganpu tea infusion and 5 mL of H2O2 were placed into a glass tube (50 mL). After homogeneous mixing, DETA (0.6 mL) was added dropwise to the resulting mixture. Along with DETA drops, H2O2 immediately undergo a violent decomposition reaction in the alkaline medium, resulting in a large number of bubbles and even white smoke. At the same time, a large amount of heat is released, so that the temperature of the reaction mixture reaches 100 °C in 30 s, and the color of the mixture gradually changes from dark brown to light yellow. When the solution was free of bubbles (about 2 min), it was cooled naturally to room temperature. The resulting G-CDs solution (about 6.50 mL) was collected and diluted 20 times with deionized water as a stock solution for the subsequent experiments. The possible formation mechanism of G-CDs is as follows: phenolic hydroxyl groups on tea polyphenols are oxidized by H2O2 to quinones. The C⚌N bond was formed by the reaction of quinone with amino group. The formed N-containing molecules form G-CDs by polymerization.
2.3 Fluorescence sensing procedure for p-NP
First, 200 μL of G-CDs stock solution and 2 mL of BR buffer (pH 4.0) were placed into a series of graduated tubes (5 mL). A certain amount of the p-NP standard solution (or the sample solution) was added to the test tube, and the solution was diluted to the required volume with deionized water. After vigorously shaking for 1 min, the fluorescence intensities (λ = 385 nm) of the test solutions were measured at the excitation wavelength of 320 nm with a slit width of 10 nm. lg(I0/I) was calculated for the quantitative analysis of p-NP, where I and I0 are the fluorescence intensities with and without p-NP in the test solutions, respectively.
2.4 Determination of β-Glu activity in fruits
Different amounts of β-Glu were dissolved in BR buffers at pH 5.0 to obtain a series of β-Glu standard solutions with various activities (0.1, 0.2, 0.5, 1.0, 2.0, 5.0, 10.0, 15.0, and 20.0 U·L-1). Then, we added 0.5 mL of G-CDs stock solution, enzyme solutions with different activities (0.5 mL), and pNPG solution (1 mL, 1.0 mM) into a 10 mL colorimetric tube and diluted to volume with a BR buffer of pH 5.0; the solution was shaken well and incubated at 50 °C for 5 min. Finally, Na2CO3 solution (0.65 mL, 1.0 M) was added to stop the reaction. At the same time, a blank test was performed (without adding the β-Glu solution). After the solution was cooled to room temperature, the intensity of the fluorescence emission peak (λ = 385 nm) was measured at the excitation wavelength of 320 nm; the fluorescence intensities of the blank solution and the test solution are I0 and I, respectively. The lg(I0/I) value was calculated and quantitatively analyzed.
2.5 Sample preparation
2.5.1 Water and human urine sample pretreatment
Lake water and tap water samples were collected from the campus (Henan University of Technology, Zhengzhou, China); the water samples were analyzed after filtration.
Human urine samples were obtained from three volunteers (males) from different chemical laboratories (Henan University of Technology, Zhengzhou, China). The pH of the collected urine samples (50 mL each) was adjusted to 2 with HCl (1.0 M), and the samples were hydrolyzed for 1 h in a boiling water bath. The hydrolyzed samples were cooled to room temperature; then, the extraction of p-NP from the urine samples was performed using dichloromethane as the extraction solvent. After dichloromethane was removed by nitrogen blowing, the resulting extract was diluted to 50 mL with deionized water for further detection.
2.5.2 Extraction of β-Glu from fruits
First, 10.0 g of fruit pulp was accurately weighed and placed into a pre-cooled mortar. After the addition of PVP (0.2 g) and a pre-cooled BR buffer (pH 5.0), the mixture was ground evenly to homogenize in an ice bath. Then, the homogenate was centrifuged at 11,000 r·min−1 at 4 °C for 20 min, and the obtained supernatant was diluted to 25 mL with the BR buffer (pH 5.0) to obtain a crude enzyme solution. The crude enzyme solution was stored in a refrigerator at 4 °C for the subsequent experiments.
3 Results and discussion
3.1 Characterization of G-CDs
G-CDs obtained from Ganpu tea infusion were well characterized by different techniques. The morphology and particle size of G-CDs were determined by TEM image (Fig. 1A), which indicates that G-CDs are spherical with an average diameter of 4.5 nm. Clear lattice fringes with a lattice fringe spacing of 0.37 nm (inset of Fig. 1A) may be attributed to the crystalline spacing of graphite (0 0 2), which indicates that G-CDs have a graphite-like structure (Liu et al., 2020). The surface groups of G-CDs were explored by FTIR spectroscopy. As shown in Fig. 1B, the peaks at 1267 cm−1 correspond to the bending vibrations of the C-O. The absorption peaks at 1379 cm−1 and 1668 cm−1 were attributed to the bending vibrations of C-N and C = O, respectively. The absorption peak at 3431 cm−1 corresponded to the O–H stretching vibration (Qi et al., 2019).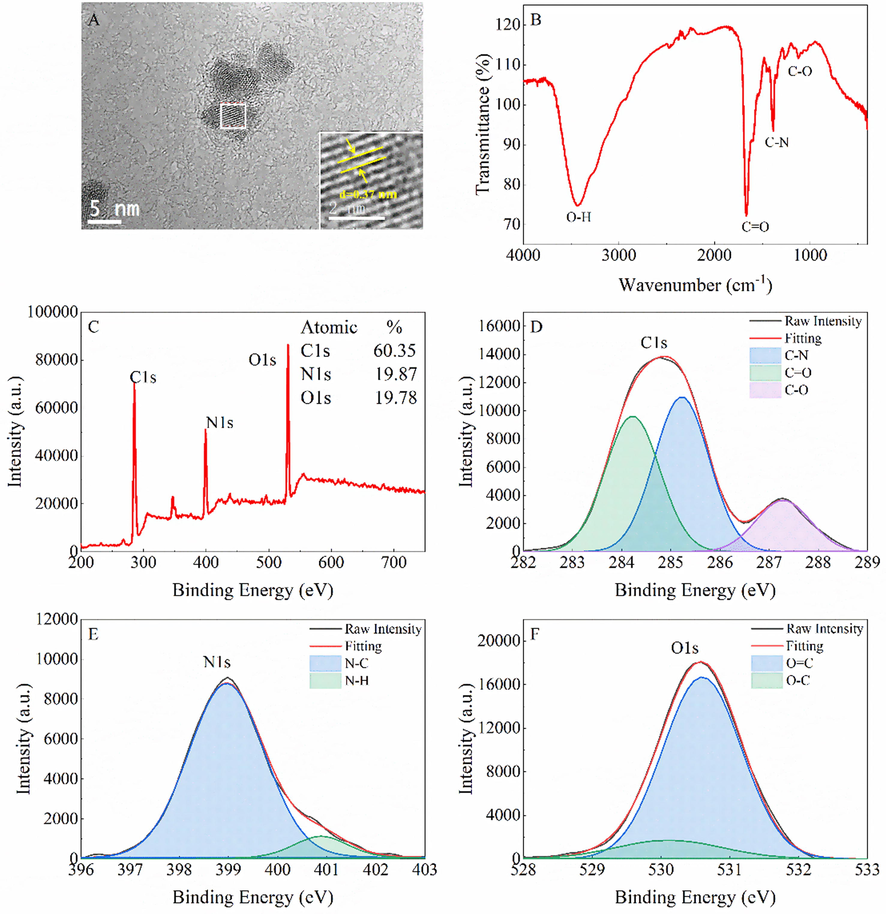
Characterization of G-CDs. TEM image of G-CDs (A), FTIR spectrum of G-CDs (B), XPS spectrum of G-CDs (C), High-resolution XPS spectra of C1s (D), N1s (E), and O1s (F).
The elemental composition and chemical bonds of G-CDs were characterized by XPS. Fig. 1C exhibits the survey scan of G-CDs, where three major peaks are observed at 284.8/287.3, 399.0, and 530.6 eV; these peaks can be attributed to C1s, N1s, and O1s with the atomic percentages of 60.35%, 19.87%, and 19.78%, respectively. The high-resolution C1s spectrum (Fig. 1D) shows three peaks at 284.2, 285.3, and 287.3 eV, corresponding to the C—N/C⚌C, C—C, and C⚌O groups (Zhang and Chen, 2014; Atchudan et al., 2018). In the high-resolution N1s spectrum (Fig. 1E), the two peaks at 399.0 and 400.9 eV can be assigned to the C—N and N—H groups, respectively (Zhang and Chen, 2014; Li et al., 2015). The O1s spectrum (Fig. 1F) shows two fitted peaks at 530.1 and 530.6 eV, which can be attributed to the C⚌O and C-O groups, respectively (Zhang and Chen, 2014; Kumar et al., 2017; Atchudan et al., 2018). The elemental information obtained from XPS analysis was consistent with that obtained from FTIR analysis.
UV–Vis and fluorescence spectra were recorded to investigate the optical properties of G-CDs. Fig. 2A shows that G-CDs exhibit a typical absorption peak at 325 nm, which can be ascribed to the n-π* transition of the C⚌O and N—H groups (Deng and Wu, 2014).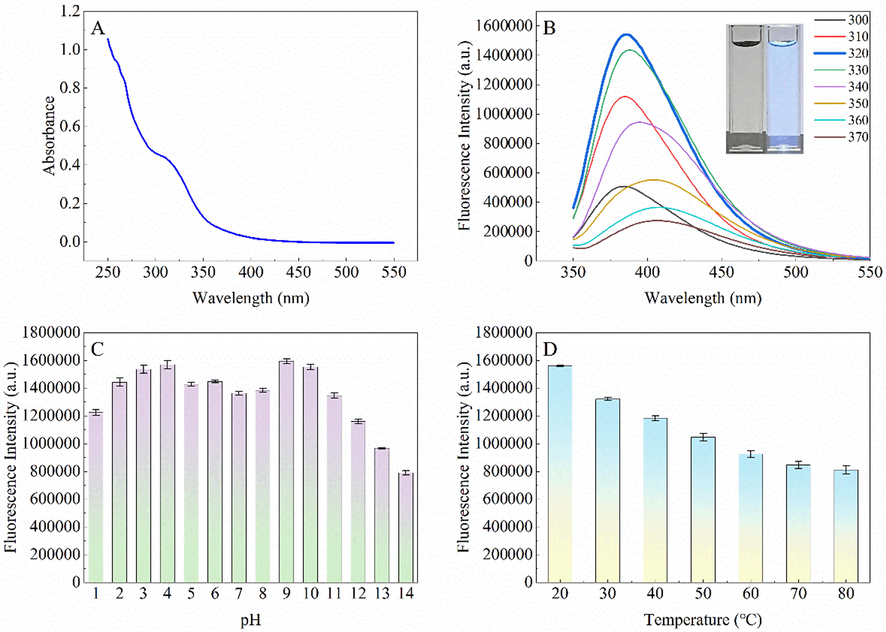
UV–Vis absorption spectrum of G-CDs (A), Fluorescence emission spectra of G-CDs with excitation wavelengths ranging from 300 nm to 370 nm (inset: images of G-CD solutions under daylight (left) and 365 nm UV irradiation (right)) (B), Effect of pH on the fluorescence intensity of G-CDs (C), Effect of temperature on the fluorescence intensity of G-CDs (D).
Under the different excitation wavelength (300–370 nm), the fluorescence emission spectra showed apparent excitation wavelength dependence (Fig. 2B). The fluorescence emission wavelength redshifts with the increase of excitation wavelength; while the fluorescence intensity increases first and then decreases with the increase of excitation wavelength. When the excitation wavelength is 320 nm, the strongest fluorescence emission peak of G-CDs appears at 385 nm. The fluorescence quantum yield of G-CDs was measured to be 14.9% in solution (BR buffer, pH 4.0) against quinine sulfate standard.
The effect of pH on the fluorescence of G-CDs was then studied, and the results are presented in Fig. 2C. The fluorescence intensity of G-CDs decreased considerably in strongly acidic or alkaline media. At the same time, the fluorescence intensity was relatively stable in weakly acidic or alkaline media. The effect of temperature on the fluorescence of G-CDs was also investigated. As evident from Fig. 2D, on increasing the temperature (30–80 ℃), the fluorescence intensity of G-CDs gradually decreases, which is completely consistent with other reports. The stability of G-CDs was investigated, and the effects of NaCl, storage time and irradiation time (365 nm) on the fluorescence intensity were studied. It can be found from Fig.S1 (Supplementary information) that the fluorescence emission of G-CDs has good stability in the range of 0–2.0 M NaCl concentration. The fluorescence of G-CDs stored for 10 days did not change significantly. Under UV irradiation, the fluorescence of G-CDs did not change significantly within 24 h. These indicate that G-CDs have excellent fluorescence stability.
3.2 Fluorescence sensing of p-NP and β-Glu activity by G-CDs
As shown in Fig. 3A, the fluorescence intensity of G-CDs continuously decreased with the increase in the p-NP concentration. A calibration curve (Fig. 3B) was then constructed by plotting fluorescence quenching efficiency (lg(I0/I)) versus p-NP concentration (from 0.05 to 50 μM), and a good linear fitting was obtained (R2 = 0.9997) for the equation lg(I0/I) = 0.0096C + 0.0035. The detection limit for p-NP was estimated to be 14.6 nM according to the 3σ (IUPAC) rule. The relative standard deviation (RSD) was 1.2% (c = 10 μM), indicating that the method has good repeatability. The detection limit of this method for p-NP was lower than those of most of the previously reported methods based on different fluorescent probes (Table 1). Here, it should be noted that these previously reported fluorescent probes for p-NP were synthesized through complicated, time-consuming, and energy-intensive procedures. However, G-CDs were fabricated by a self-exothermic reaction assisted green procedure within 5 min using inexpensive and abundant tea as the raw material. The excellent fluorescence stability of G-CDs also makes the analysis method have good repeatability and reproducibility. Thus, this study provides a simple, rapid, sensitive, and low-cost method for p-NP sensing.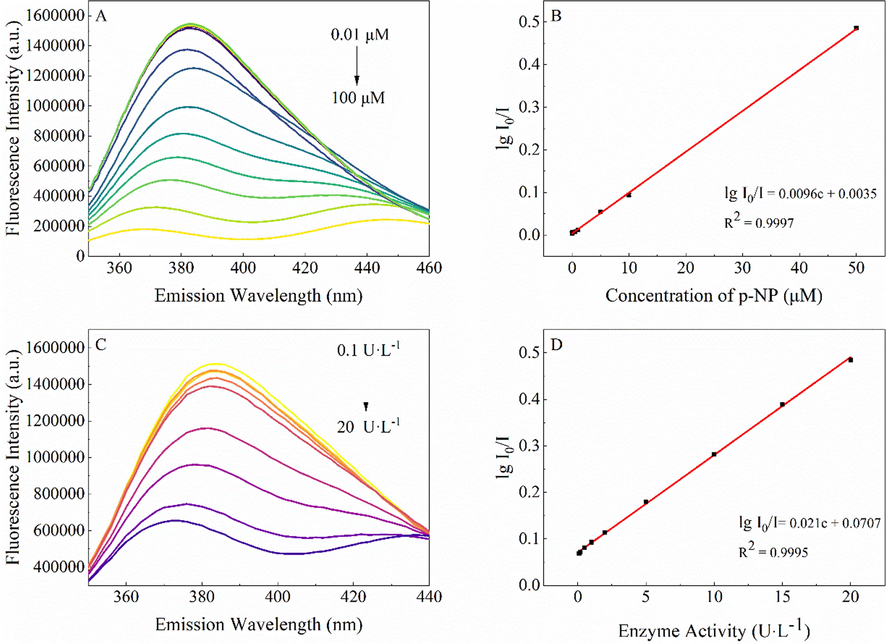
Fluorescence responses of G-CDs in the presence of different concentrations of p-NP (A) and β-Glu with different activities (C). Linear relationships between lg(I0/I) and concentration of p-NP (B) and β-Glu activity (D).
Probes
Mechanism
Detection limit
(nM)Linear range
(μM)Ref
S quantum dots
IFE
70
0.2–30
30–90(Peng et al., 2021)
CeO2 quantum dots
FRET
1.5
0.005–75
(Xu et al., 2021)
Gold nanoclusters
IFE
90
0.1–100
(Li et al., 2020b)
β-cyclodextrin-capped ZnO quantum dots
Electron transfer
670
1.0–40
(Geng et al., 2016)
B, N-doped CDs
IFE
200
0.5–60
60–200(Xiao et al., 2018)
N, S-doped CDs
IFE and photoinduced electron transfer
39
0.05–125
(Huang et al., 2021b)
N-doped CDs
IFE and static quenching
400
1–250
(Das and Dutta, 2021)
N-doped CDs
FRET
201
0.5–70
(Liao et al., 2021)
N-doped oxidized CDs
Electron transfer
2000
2.0–2000
(Bogireddy et al., 2020)
N, P-doped CDs
IFE
74.35
0–37.5
(Tu et al., 2020)
N-doped CDs
Static quenching
50
0.1–39
(Tian et al., 2019)
Cu-doped CDs
IFE
80
0.5–50
(Fang et al., 2019)
N, Si-doped CDs
IFE
11
0.025–80
(Wang et al., 2021)
N-doped CDs
IFE
14.6
0.05–50
This study
Since p-NP is the hydrolysate of pNPG under the action of β-Glu and there is a linear correlation between the concentration of p-NP and β-Glu activity, the fluorescence quenching of G-CDs by p-NP can be applied for indirectly sensing β-Glu activity. As shown in Fig. 3C, the fluorescence of G-CDs in the presence of pNPG decreases gradually with the increase in β-Glu activity. A good linear relationship between fluorescence quenching efficiency lg(I0/I) and β-Glu activity was achieved in the β-Glu activity range of 0.1–20 U·L-1 (Fig. 3D). Based on the 3σ (IUPAC) rule, the detection limit for β-Glu activity was calculated to be 0.074 U ·L-1. Compared with the detection limits of previously reported fluorescence methods for β-Glu activity determination (Table.S1, Supplementary information), the detection limit of this method was the lowest (Liu et al., 2019a; Liu et al., 2019b; Kong et al., 2020; Gong et al., 2019). Similarly, G-CDs obtained within 5 min are greener and more efficient compared with CDs obtained from solvothermal methods. Therefore, this indirect analytical method is simple and rapid with high sensitivity.
3.3 Selectivity of fluorescence assay
To evaluate the selectivity of the fluorescence assay for p-NP, metal ions, amino acids, and sugar compounds were chosen as the potential interfering substances; and their effects on the fluorescence intensity of G-CDs were investigated. The fluorescence intensities for the sensing system containing p-NP (10 µM) and potential interfering substances were recorded according to the procedure in section 2.3. As shown in Fig. 4A, 10 µM p-NP and other organic compounds (Suc, Lac, Glc, Fru, Man, Lac, Lys, Glu, and Cys) were selected to investigate the fluorescence performance of G-CDs. The fluorescence quenching of G-CDs by p-NP in the presence of competitive compounds (100 µM) remained similar to that observed for the control group, indicating the high selectivity of the sensor for detecting p-NP.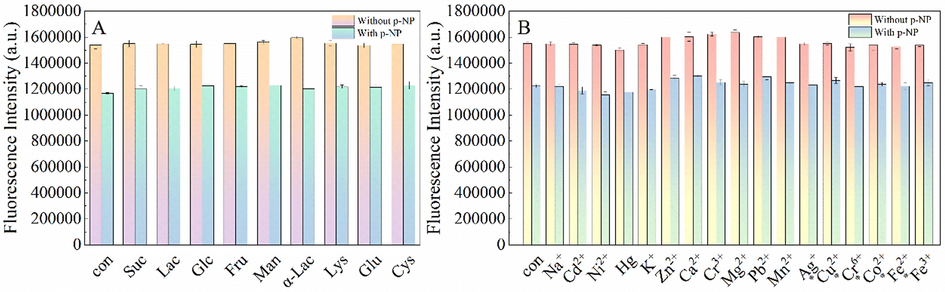
Fluorescence responses of G-CDs at 385 nm to different interfering substances (A-B) in the absence and presence of p-NP (10 μM) (I0 is the fluorescence intensity of G-CDs at 385 nm when only G-CDs and p-NP (10 μM) were added, recorded as the blank group.).
Metal ions were also used to investigate the selectivity of the sensor for p-NP detection (Fig. 4B). None of the metal ions (100 µM) had any effect on the fluorescence intensity of G-CDs in the presence and absence of p-NP. Therefore, high tolerance to metal ions could be the basis for detecting p-NP in water samples.
3.4 Fluorescence quenching mechanism
To elucidate the possible fluorescence quenching mechanism of G-CDs by p-NP, the spectral overlap between the absorption spectrum of p-NP and the fluorescence emission spectrum of G-CDs was first considered (Fig. 5A). Clearly, there was considerable spectral overlap between the absorption spectrum of p-NP (λmax = 400 nm, ε = 1.87 × 10⁴ L·mol−1·cm−1) and the fluorescence emission spectrum of G-CDs (Em = 385 nm), which suggested that the possible quenching mechanism was IFE or FRET. In order to further verify the fluorescence quenching mechanism of G-CDs, the fluorescence lifetime of G-CDs in the presence and absence of p-NP was measured. As shown in Fig. 5B, the fluorescence lifetime of G-CDs (3.09 ns) is almost the same as that of G-CDs-p-NP (3.09 ns) sensing system. Therefore, FRET can be excluded as the quenching mechanism, and the possible quenching mechanism is IFE.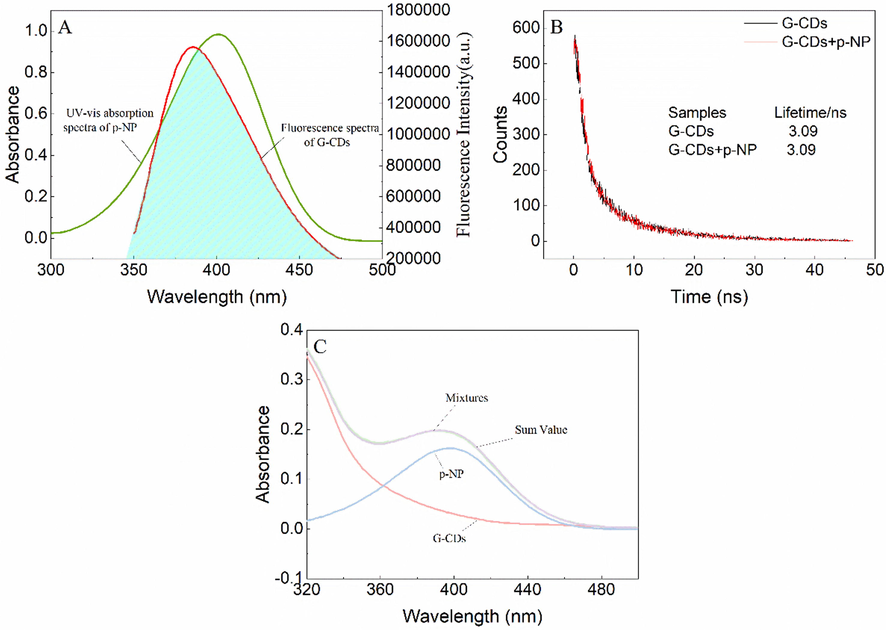
Fluorescence emission spectra of G-CDs and UV–Vis absorption spectra of p-NP (A), Fluorescence decay curve of G-CDs in the absence and presence of p-NP (B), UV–Vis absorption spectra of G-CDs, p-NP, G-CDs-p-NP mixtures and the sum value of absorptance of G-CDs and p-NP (C).
Then, the fluorescence of G-CDs was corrected according to the reported mathematical model, and combined with the absorption curve of the sensor system, the IFE mechanism was further confirmed (Das and Dutta, 2021; Liao et al., 2021; Bogireddy et al., 2020). The corrected fluorescence intensities of G-CDs were calculated, and it was found that the computed values remained almost unchanged when G-CDs were mixed with different concentrations of p-NP. This result illustrates that the fluorescence quenching mechanism of G-CDs by p-NP is mainly IFE rather than static quenching. Finally, absorption curves of G-CDs, p-NP, and the G-CDs-p-NP mixture were carefully recorded to confirm the IFE mechanism. From Fig. 5C, it can be inferred that the absorption curve of the G-CDs-p-NP mixture almost coincides with the sum curve of G-CDs and p-NP. This result indicated that no G-CDs-p-NP complex generated, which ruled out the possibility of static quenching and thus confirmed the IFE quenching mechanism.
3.5 Real sample analysis
3.5.1 Determination of p-NP in environmental water and human urine samples
The feasibility of the IFE-based fluorescence assay was verified by analyzing environmental water and human urine samples. The analytical results and spiking recoveries are listed in Table 2. The spiking recoveries were in the range of 96.7–108.4%, indicating that this fluorescent assay possesses high accuracy, sensitivity, and precision.
Samples
Spiked amount (μM)
Detection quantity (μM)
Recovery
(%)RSD
(%)
Lake water
0
not detected
–
–
10
10.83
108.3
3.20
20
20.19
101.0
1.80
Tap water
0
not detected
–
–
10
9.77
97.7
4.20
20
20.81
104.1
1.10
Urine-1
0
33.55
–
–
20
52.47
98.0
2.70
40
72.76
98.9
3.10
Urine-2
0
25.74
–
–
20
44.22
96.7
1.10
40
67.87
103.2
1.60
Urine-3
0
0.11
–
–
10
10.42
103.1
1.20
20
20.34
101.1
0.90
3.5.2 Determination of β-Glu activity in fruits
To further verify the practicality of this method, the β-Glu in jujubes, pears, and red grapes was extracted, and the resulting crude enzyme solution was measured by this method. The results are shown in Table 3. The unique and persistent flavor of pears is related to their high β-Glu activity. This is because the flavor substances in this fruit are present in two states: free state and bound state. Most bound flavoring substances exist in the form of glycosides, which have no aroma but can be broken down by the corresponding enzymes to release free flavoring substances; among these enzymes, β-Glu is a crucial enzyme for the release of bound aroma.
Samples
Found (U·g−1)
RSD (%)
Pears
12.98
4.47
Red grapes
3.36
2.23
Jujubes
5.80
4.07
4 Conclusions
Fluorescent G-CDs were fabricated within 5 min by a self-exothermic reaction strategy. A sensitive and selective fluorescence assay for p-NP based on G-CDs was developed, and the fluorescence quenching was ascribed to IFE mechanism. In addition, a fluorescence assay for the indirect determination of β-Glu activity was designed based on the hydrolysate p-NP of the substrate pNPG under the action of β-Glu. The assays developed in this study for p-NP and β-Glu activity are simple, rapid, and sensitive and therefore, these fluorescent assays are excellent candidates for environmental and biological applications.
Acknowledgements
This work was financially supported by the Innovative Funds Plan of Henan University of Technology (Grant No. 2020ZKCJ03).
Declaration of Competing Interest
The authors declare that they have no known competing financial interests or personal relationships that could have appeared to influence the work reported in this paper.
References
- Highly fluorescent nitrogen-doped carbon dots derived from phyllanthus acidus utilized as a fluorescent probe for label-free selective detection of Fe3+ ions, live cell imaging and fluorescent ink. Biosens. Bioelectron.. 2018;99:303-311.
- [CrossRef] [Google Scholar]
- Purification and characterization of a glucose-tolerant β-glucosidase from black plum seed and its structural changes in ionic liquids. Food Chem.. 2019;274:422-428.
- [CrossRef] [Google Scholar]
- 4-nitrophenol optical sensing with N doped oxidized carbon dots. J. Hazard. Mater.. 2020;386:121643
- [CrossRef] [Google Scholar]
- Highly sensitive determination of 4-nitrophenol with coumarin-based fluorescent molecularly imprinted poly (ionic liquid) J. Hazard. Mater.. 2020;398:122854
- [CrossRef] [Google Scholar]
- N-doped carbon dots synthesized from ethylene glycol and β-alanine for detection of Cr(VI) and 4-nitrophenol via photoluminescence quenching. Acs Appl. Nano Mater.. 2021;4:3444-3454.
- [CrossRef] [Google Scholar]
- Eco friendly synthesis of fluorescent carbon dots for the sensitive detection of ferric ions and cell imaging. Arab. J. Chem.. 2021;14:103195
- [CrossRef] [Google Scholar]
- Highly sensitive photoluminescence energy transfer detection for 2,4,6-trinitrophenol using photoluminescent carbon nanodots. RSC Adv.. 2014;4:42066-42070.
- [CrossRef] [Google Scholar]
- Phenol derivatives as enhancers and inhibitors of luminol-H2O2-horseradish peroxidase chemiluminescence. J. Biolumin. Chemilumin.. 1998;13:75-84.
- [CrossRef] [Google Scholar]
- Serratia marcescens-derived fluorescent carbon dots as a platform toward multi-mode bioimaging and detection of p-nitrophenol. Analyst. 2021;146:683-690.
- [CrossRef] [Google Scholar]
- Dual-opposite multi-walled carbon nanotube modified carbon fiber microelectrode for microfluidic chip-capillary electrophoresis determination of methyl parathion metabolites in human urine. Electrophoresis. 2018;39:1375-1381.
- [CrossRef] [Google Scholar]
- Fluorescent sensing platform for the detection of p-nitrophenol based on Cu-doped carbon dots. Opt. Mater.. 2019;97:109396
- [CrossRef] [Google Scholar]
- Photocatalytic degradation performance of various types of modified TiO2 against nitrophenols in aqueous systems. J. Clean. Prod.. 2019;231:899-912.
- [CrossRef] [Google Scholar]
- A new fluorescent sensor for detecting p-nitrophenol based on β-cyclodextrin-capped ZnO quantum dots. RSC Adv.. 2016;6:86061-86067.
- [CrossRef] [Google Scholar]
- Highly fluorescent N-doped carbon dots with two-photon emission for ultrasensitive detection of tumor marker and visual monitor anticancer drug loading and delivery. Chem. Eng. J.. 2019;356:994-1002.
- [CrossRef] [Google Scholar]
- The synthetic strategies, photoluminescence mechanisms and promising applications of carbon dots: Current state and future perspective. Carbon. 2022;186:91-127.
- [CrossRef] [Google Scholar]
- Catalytic hydrogenation of p-nitrophenol using a metal-free catalyst of porous crimped graphitic carbon nitride. Appl. Surf. Sci.. 2019;480:888-895.
- [CrossRef] [Google Scholar]
- Electrostatically assembling 2D hierarchical Nb2CTx and zifs-derivatives into Zn-Co-NC nanocage for the electrochemical detection of 4-nitrophenol. Sensor Actuat B-Chem.. 2021;338:129828
- [CrossRef] [Google Scholar]
- Cuttlefish ink-based N and S co-doped carbon quantum dots as a fluorescent sensor for highly sensitive and selective para-nitrophenol detection. Anal Methods-Uk.. 2021;13:5351-5359.
- [CrossRef] [Google Scholar]
- Enzyme-triggered fluorescence turn-off/turn-on of carbon dots for monitoring β-glucosidase and its inhibitor in living cells. Luminescence. 2020;35:222-230.
- [CrossRef] [Google Scholar]
- Polydopamine@electrochemically reduced graphene oxide-modified electrode for electrochemical detection of free-chlorine. Sensor Actuat B-Chem.. 2017;240:818-828.
- [CrossRef] [Google Scholar]
- Electro-oxidation of nitrophenol by ruthenium oxide coated titanium electrode: Parametric, kinetic and mechanistic study. Chem. Eng. J.. 2015;263:135-143.
- [CrossRef] [Google Scholar]
- Selected pesticide residues and metabolites in urine from a survey of the U.S. general population. J. Toxicol. Environ. Health. 1992;37:277-291.
- [CrossRef] [Google Scholar]
- Functional beverage from fermented soymilk with improved amino nitrogen, β-glucosidase activity and aglycone content using bacillus subtilis starter. Food Sci. Biotechnol.. 2016;25:1399-1405.
- [CrossRef] [Google Scholar]
- Synthesis of carboxyl functionalized microporous organic network for solid phase extraction coupled with high-performance liquid chromatography for the determination of phenols in water samples. Talanta. 2020;208:120434
- [CrossRef] [Google Scholar]
- N, S co-doped carbon quantum dots for the selective and sensitive fluorescent determination of N-acetyl-L-cysteine in pharmaceutical products and urine. Anal. Lett.. 2019;52:1711-1731.
- [CrossRef] [Google Scholar]
- Hexagonal cobalt oxyhydroxide-carbon dots hybridized surface: High sensitive fluorescence turn-on probe for monitoring of ascorbic acid in rat brain following brain ischemia. Anal. Chem.. 2015;87:3404-3411.
- [CrossRef] [Google Scholar]
- One-pot synthesis of green-emitting gold nanoclusters as a fluorescent probe for determination of 4-nitrophenol. Microchim. Acta. 2020;187:106.
- [CrossRef] [Google Scholar]
- Advances and perspectives in carbon dot-based fluorescent probes: Mechanism, and application. Coordin Chem Rev.. 2021;431:213686
- [CrossRef] [Google Scholar]
- Fluorescent nitrogen-doped carbon dots for high selective detecting p-nitrophenol through FRET mechanism. Spectrochim. Acta A Mol. Biomol. Spectrosc.. 2021;259:119897
- [CrossRef] [Google Scholar]
- “Turn-on” fluorescence determination of β-glucosidase activity using fluorescent polymer nanoparticles formed from polyethylenimine cross-linked with hydroquinone. Acs Appl. Polym. Mater.. 2019;1:3057-3063.
- [CrossRef] [Google Scholar]
- Polarity-Sensitive polymer carbon dots prepared at room-temperature for monitoring the cell polarity dynamics during autophagy. Acs Appl. Mater. Inter.. 2020;12:4815-4820.
- [CrossRef] [Google Scholar]
- A “turn off-on” fluorescent nanoprobe consisting of CuInS2 quantum dots for determination of the activity of β-glucosidase and for inhibitor screening. Microchim. Acta. 2019;186:806.
- [CrossRef] [Google Scholar]
- An optical sensing platform for beta-glucosidase activity using protein-inorganic hybrid nanoflowers. J. Fluoresc.. 2022;32:669-680.
- [CrossRef] [Google Scholar]
- Mussel-inspired polydopamine-encapsulated carbon dots with dual emission for detection of 4-nitrophenol and Fe3+. Luminescence. 2021;36:431-442.
- [CrossRef] [Google Scholar]
- Carbon dots as fluorescent nanoprobe for the determination of N-acetyl-β-d-glucosaminidase activity. Anal. Chim. Acta. 2020;1101:129-134.
- [CrossRef] [Google Scholar]
- Simultaneous p-nitrophenol and nitrogen removal in PNP wastewater treatment: Comparison of two integrated membrane-aerated bioreactor systems. J. Hazard. Mater.. 2019;363:99-108.
- [CrossRef] [Google Scholar]
- UV-emitting polyelectrolyte-modified MoS2 quantum dots for selective determination of nitrophenol in water samples based on inner filter effect. Can. J. Chem.. 2020;98:222-227.
- [CrossRef] [Google Scholar]
- Facile synthesis of fluorescent sulfur quantum dots for selective detection of p-nitrophenol in water samples. Microchem. J.. 2021;170:106735
- [CrossRef] [Google Scholar]
- A Carbon Dots Probe for Specific Determination of Cysteine based on Inner Filter Effect. J. Anal. Chem.. 2022;77:1141-1146.
- [CrossRef] [Google Scholar]
- Biomass-derived nitrogen-doped carbon quantum dots: highly selective fluorescent probe for detecting Fe3+ ions and tetracyclines. J. Colloid Interf. Sci.. 2019;539:332-341.
- [CrossRef] [Google Scholar]
- Introduction--the methyl parathion story: A chronicle of misuse and preventable human exposure. Environ. Health Persp.. 2002;110:1037-1040.
- [CrossRef] [Google Scholar]
- Smartphone-based colorimetric determination of glucose in food samples based on the intrinsic peroxidase-like activity of nitrogen-doped carbon dots obtained from locusts. Arab. J. Chem.. 2023;16:104538
- [CrossRef] [Google Scholar]
- A new MOFs/polymer hybrid membrane: MIL-68(Al)/PVDF, fabrication and application in high-efficient removal of p-nitrophenol and methylene blue. Sep. Purif. Technol.. 2019;215:217-226.
- [CrossRef] [Google Scholar]
- Biomass-derived carbon quantum dots - A Review. Part 1: preparation and characterization. ChemBioEng Rev.. 2021;8:265-301.
- [CrossRef] [Google Scholar]
- Yellow-emitting carbon dots for selective detecting 4-NP in aqueous media and living biological imaging. Spectrochim. Acta A Mol. Biomol. Spectrosc.. 2019;220:117117
- [CrossRef] [Google Scholar]
- Environmental persistence, hazard, and mitigation challenges of nitroaromatic compounds. Environ. Sci. Pollut. R.. 2019;26:28650-28667.
- [CrossRef] [Google Scholar]
- Hydrolytic enzyme activities in agricultural and forest soils. some implications for their use as indicators of soil quality. Soil Biol. Biochem.. 2008;40:2146-2155.
- [CrossRef] [Google Scholar]
- Hydrothermal synthesis of auricularia auricula derived nitrogen, phosphorus-doped carbon dots and application in Ag(I) and 4-nitrophenol detection and bioimaging. Anal Methods-Uk.. 2020;12:2237-2243.
- [CrossRef] [Google Scholar]
- Nitrogen, silicon co-doped carbon dots as the fluorescence nanoprobe for trace p-nitrophenol detection based on inner filter effect. Spectrochim. Acta A Mol. Biomol. Spectrosc.. 2021;244:118876
- [CrossRef] [Google Scholar]
- Whitaker, J.R., Voragen, A.G.J., Wong, D.W.S. (Eds.), 2003. Handbook of food enzymology, Food science and technology. Marcel Dekker, New York.
- Highly selective detection of p-nitrophenol using fluorescence assay based on boron, nitrogen co-doped carbon dots. Talanta. 2018;184:184-192.
- [CrossRef] [Google Scholar]
- Removal of nitrophenols and their derivatives by chemical redox: A review. Chem. Eng. J.. 2019;359:13-31.
- [CrossRef] [Google Scholar]
- CeO2 quantum dots for highly selective and ultrasensitive fluorescence detection of 4-nitrophenol via the fluorescence resonance energy transfer mechanism. Spectrochim. Acta A Mol. Biomol. Spectrosc.. 2021;262:120115
- [CrossRef] [Google Scholar]
- Sensitive and selective determination of 4-nitrophenol in water and food using modified polyethyleneimine-capped carbon dots. J Chin Chem Soc-Taip.. 2020;67:1230-1238.
- [CrossRef] [Google Scholar]
- Nitrogen-doped carbon quantum dots: Facile synthesis and application as a “turn-off” fluorescent probe for detection of Hg2+ ions. Biosens. Bioelectron.. 2014;55:83-90.
- [CrossRef] [Google Scholar]
- Selective detection of aromatic nitrophenols by a metal-organic framework-based fluorescent sensor. Cryst. Growth Des.. 2019;19:6308-6314.
- [CrossRef] [Google Scholar]
- Bacteria-derived fluorescent carbon dots for highly selective detection of p-nitrophenol and bioimaging. Analyst. 2019;144:5497-5503.
- [CrossRef] [Google Scholar]
- Green, rapid, and universal preparation approach of graphene quantum dots under ultraviolet irradiation. Acs Appl. Mater. Inter.. 2017;9:14470-14477.
- [CrossRef] [Google Scholar]
Appendix A
Supplementary material
Supplementary data to this article can be found online at https://doi.org/10.1016/j.arabjc.2023.104820.
Appendix A
Supplementary material
The following are the Supplementary data to this article:Supplementary data 1
Supplementary data 1


