

Translate this page into:
Silver nanoparticles-decorated reduced graphene oxide: A novel peroxidase-like activity nanomaterial for development of a colorimetric glucose biosensor
⁎Corresponding author. hoang.tranvinh@hust.edu.vn (Hoang V. Tran)
-
Received: ,
Accepted: ,
This article was originally published by Elsevier and was migrated to Scientific Scholar after the change of Publisher.
Peer review under responsibility of King Saud University.
Abstract
In this study, we present a novel approach to prepare of a colorimetric chemical sensor for H2O2 and a glucose biosensor basing on the use of peroxidase-like activity of silver nanoparticles decorated on reduced graphene oxide sheets (AgNPs@rGO) nanocomposite. Herein, AgNPs@rGO nanocomposite was synthesized by a one-step hydrothermal reducing method and its physico-chemical properties were characterized by X-ray diffraction (XRD), Transmission Electron Microscopy (TEM), Ultraviolet–visible spectroscopy (UV–Vis), Fourier-Transform Infrared spectroscopy (FT-IR) and Energy Dispersive X-ray spectroscopy (EDX). Obtained evaluation results shown that the synthesized AgNPs/rGO nanocomposite has performed an efficient peroxidase-like activity for the oxidation of 3,3′,5,5′-tetramethylbenzidine (TMBred) by H2O2, leading to the oxidized form (TMBox) which presents a typical blue color (maximum of absorbance at λmax = 655 nm). A colorimetric assay for H2O2 detection was designed and fabricated with a limit of detection of 20 μM. Moreover, we have used of AgNPs/rGO nanocomposite combining with glucose oxidase (GOx) to develop of a colorimetric glucose biosensor with a low limit of detection of 40 μM and a linear dynamic range from 125 μM to 1 mM. This glucose test was applied to the detection of glucose in human serum samples.
Keywords
Silver nanoparticles-reduced graphene oxide (AgNPs/rGO) nanocomposite
Peroxidase-like activity
Hydrogen peroxide (H2O2)
Glucose Biosensor
Colorimetric assay
Glucose Oxidase (GOx)
Horseradish Peroxidase (HRP)

1 Introduction
Diagnosis and treatment of diabete has become a major concern because more than 117 million people suffer from diabete around the World, and it is forecasted that this figure will reach 300 million by 2025. The most significant goal in the treatment of diabetes is the tight control of blood glucose concentration, which is about 3.9–5.0 mM and 7.8–11.0 mM for healthy and diabetic persons, respectively (Association, 2010), which implies that reliable, widely available and easy to use tests or sensors are available on the market. In the general, glucose oxidase (GOx) is commonly used for glucose monitoring since it presents an incomparable selectivity in the catalytic oxidation of this molecule by oxygen, yielding gluconic acid and hydrogen peroxide (H2O2) (Eq. (1)).
For experimental conditions where glucose concentration is rate-limiting, it can be estimated from the rate of H2O2 production, which can be measured by several techniques such as fluorescence spectroscopy, surface plasmon resonance, Raman spectrometry, electrochemistry, or colorimetry (Zhang et al., 2018; Zhang et al., 2017; Jabariyan et al., 2018; Chen et al., 2018; Gao et al., 2017; Pang et al., 2018; Sooraj et al., 2018). In this latter case, the current strategy consists in the quantification of H2O2 production with a fast secondary enzymatic reaction based on the Horseradish Peroxidase (HRP) enzyme (simplified reaction given as Eq. (2)).
In the glucose test, glucose oxidase (GOx) enzyme has to use to generate the unique selectivity for glucose; it is not the case for HRP, however, and it may be of high interest to replace it with a non-enzymatic catalyst in commercial sensors.
The literature is now rich with examples of catalytic compounds which are able to mimic efficiently natural peroxidase, for a wide range of applications. In particular, nanomaterials and their composites have received considerable attention as catalysts, due to their unique composition-dependent and structure-dependent properties, as well as high stability and low cost. Mimicking enzymes such as catalases, oxidases, super-oxide dismutases and peroxidases are the major features of such nanomaterials. Wei and co-workers (Wei and Wang, 2008) reported for the first time in 2008 that Fe3O4 nanoparticles present a peroxidase-like activity similar to the horseradish peroxidase (HRP) enzyme, which was a real breakthrough for developing nanomaterials for biochemical applications. Since that date, many other nanomaterials have been reported for their peroxidase activity, including transition metal oxides and their nanocomposites such as Co3O4 (Liu et al., 2020), NiO (Yan et al., 2019), MnO2 (Han et al., 2017; Han et al., 2017; Liu et al., 2018), MoO3 (Ren et al., 2019), MoS2-decorated MgFe2O4 nanoparticles (Zhang et al., 2018), graphene quantum dots-copper oxide nanocomposites (GQDs/CuO) (Zhang et al., 2017), Fe(III)-based containing nanomaterials such as Fe3O4 (Wei and Wang, 2008), MFe2O4 (M = Mg, Ni, Cu) (Su et al., 2015), graphene/Fe3O4 (Dong et al., 2012), FeOOH/N-doped carbon nanosheets (Tran et al., 2016) or sulphur-based nanomaterials for example, vanadium(IV) disulfide (VS2) nanosheets (Huang et al., 2018), Fe3S4 (Ding et al., 2016), or noble metal nanoparticles such as AgNPs (Nguyen et al., 2018), Au@Ag (Han et al., 2015), Pt nanoclusters (Jin et al., 2017). Recently, carbon-based nanomaterials and their derivatives such as C60-carboxyfullerenes (Li et al., 2013), graphene quantum dots (Lin et al., 2015) are used as peroxidase-like activity materials for biosensor applications.
In this work, we decorated reduced graphene oxide sheets with silver nanoparticles (AgNPs@rGO) synthesized by the hydrothermal route and we demonstrated that such nanomaterial possesses a peroxidase-like activity. AgNPs@rGO has performed an excellent catalystic activity for oxidation of 3,3′,5,5′-tetramethylbenzidine (TMB) in a presence of hydrogen peroxide. As an example of application, we included this catalyst in a costless colorimetric assay for glucose monitoring and we demonstrated that such a method is as efficient as actual routine (but costly) hospital tests to determine glucose in human blood serum.
2 Experimental
2.1 Chemicals
Graphene oxide (GO) was synthesized in our laboratory by Hummer’s method as previously reported (Tran et al., 2017) and characterized by UV–Vis, FT-IR, XRD and SEM/TEM (results shown in Fig. SI.1). Glacial acetic acid (CH3COOH), sodium acetate (CH3COONa, 3 H2O), silver nitrate (AgNO3), ammonia solution (NH3), hydrogen peroxide (H2O2) solution 30% v/v., glucose oxidase (GOx) (type VII, lyophilized powder, ≥100,000 units g−1 solid), glucose, galactose, fructose, sucrose, lactose, ascorbic acid, phosphate buffered saline (PBS) and 3,3′,5,5′ - tetramethylbenzidine (TMB) were purchased from Sigma-Aldrich.
2.2 Synthesis of silver nanoparticles-decorated reduced graphene oxide (AgNPs@rGO) nanocomposite
15 mL of 0.02 M AgNO3 were stirred with 16 mL of graphene oxide dispersed in water (1 mg mL−1 GO) for 30 min at room temperature to obtain a homogeneous solution. Then, was added 130 μL of a 13.9 M NH3 solution + 10 mL of a 3 mM glucose solution. The mixture was heated in an autoclave at 90 °C for 2.5 h, then cooled down to room temperature. Finally, the reacted mixture was centrifuged at 10,000 rpm for 30 min to collect AgNPs@rGO as a dark-yellow precipitate, which was re-dispersed into 20 mL distilled water and stored at 4 °C before use. The final concentration of AgNPs in AgNPs@rGO suspension was estimated of ca. 1.6 mg mL−1.
2.3 Characterizations
Absorbance measurements (UV–Vis) spectra were measured using an Agilent 8453 UV–Vis spectrophotometer. X-ray Diffraction (XRD) patterns of rGO and AgNPs@rGO samples were obtained at room temperature on a D8 Advance Bruker ASX, using the CuKα radiation (λ = 1.5406 Å) in the range of 2θ = 10°–60°, at a scanning rate of 0.02 s−1. Morphology and crystal structure of nanoparticles were characterized by Transmission Electron Microscopy (TEM, JEOL, Voltage: 100 kV, magnification: × 200,000). The chemical composition of samples was determined on a JEOL Scanning Electron Microscope (SEM) equipped with an Energy Dispersive X-ray (EDX) analysis module (JSM-5410). Infrared (IR) spectra were recorded with KBr pellets in transmission mode on a Nicolet FT-IR Spectrometer model 205.
2.4 Procedure for detection of hydrogen peroxide
A mixture of 440 μL of acetate buffer (pH = 3), 250 µL of AgNPs@rGO suspended in water, 112.5 µL of 20 mM TMB and 100 µL of H2O2 at different concentrations was added into a 1.5 mL Eppendorf, thoroughly vortexed and left to react for 30 min. Finally, the mixture was transferred to a spectrophotometric cuvette for the measurement of the optical density at 652 nm (OD652). Optimization experiments for H2O2 detection were described in Section SI.II.
2.5 Procedure for detection of glucose
50 μL of glucose solutions (variable concentrations of glucose in PBS buffer at pH = 7) and 100 μL of GOx (2 mg mL−1 in 0.01 × PBS) were added into a 1.5 mL Eppendorf. The mixture was vortexed and incubated at 37 °C in a water bath for 40 min. Then, 250 μL of AgNPs@rGO suspension, 440 µL of acetate buffer (pH = 3) and 112.5 µL of 20 mM TMB were added to the Eppendorf, vortexed and incubated at 50 °C in a water bath for 30 min. Finally, the mixture was transferred to a spectrophotometric cuvette for the OD652 measurement.
2.6 Application for glucose detection in human serum samples
Human sera from volunteers were collected from blood samples by a local hospital M.D. Human sera were diluted 10 times with 0.01 × PBS then used following the test procedure described in Section 2.5.
3 Results and discussions
3.1 Characterization of silver nanoparticles-decorated reduced graphene oxide (AgNPs@rGO)
Fig. 1a presents the XRD spectra of rGO (curve i) and AgNPs@rGO (curve ii). The XRD pattern of rGO shows that the peak at 11.51° completely disappeared and is replaced by a broad peak at 2θ = 25.53° corresponding to a d-spacing of 0.39 nm. The XRD spectrum of GO (Fig. SI.1c) presents a sharp single peak at 2θ = 11.51° (d-spacing: 0.89 nm), which is attributed to the introduction of oxygenated functional groups on the surface of carbon sheet. Decrease of the d-spacing between GO and rGO sheets is attributed to the removal of the oxygen-containing groups and confirms that GO has been reduced to rGO (Kosowska et al., 2018). The XRD pattern of the AgNPs@RGO (curve ii) shows three main characteristic peaks at 2θ = 37.5°, 43.1° and 64.8°, which match very well with those of the standard AgNPs (PCPDF card number 40783) (Mamatha et al., 2017) with Miller indices (1 1 1), (2 0 0) and (2 2 0), respectively. The broad diffraction peak at 2θ of 22.56° is attributed to rGO. FTIR spectra of rGO and AgNPs@rGO (Fig. 1b) shows a strong band at ∼ 3500 cm−1 attributed to υO-H and a band at 1641 cm−1 attributed to υC=O, that shows that rGO still carries oxygenated species such as carboxylic, carbonyl and hydroxyl groups which can contribute as Ag+ binding sites. These groups also contribute to the hydrophilicity of rGO. Interestingly, compared with rGO, the absorption band attributed to the O–H group at 1064 cm−1 almost disappears for AgNPs@rGO, which may indicate that Ag+ can be reduced by O–H groups of rGO to form AgNPs, resulting in O–H groups being converted into –COOH groups. On the FT-IR spectrum of GO (Fig. SI.1b), the peaks at 1739, 1610 and 1463 cm−1 are due to the stretching vibration of C = O bond from carboxyl groups, the skeletal C–C vibrations of un-oxidized graphene domains and the alkoxy C–O vibrations, respectively (Liu et al., 2013). The adsorption at 3568 cm−1 is attributed to the stretching vibration of O–H group from adsorbed water and a sharp absorption peak at 3371 cm−1 depicts the stretching vibrations of the surface hydroxyl (–OH) groups on GO (Tran et al., 2018). The UV–Vis spectra of AgNPs@rGO (Fig. 1c; curve ii) shows the adsorption band at 425 nm which is attributed to the characteristic surface plasmon absorption of AgNPs, while this absorption is not observed for rGO (Fig. 1c, curve i). A peak at 260 nm in UV–Vis spectrum of rGO solution indicates the restoration of the extensive conjugated sp2 carbon network within the graphene sheets upon reduction of exfoliated GO. However, this peak has been changed to a shoulder in AgNPs@rGO (curve ii), due to the reduction of Ag+ into AgNPs. The EDX spectra of AgNPs@rGO (Fig. 1d) shows the peaks of C, N and O at 285, 400 and 531 eV, respectively and three strong peaks at 2.99, 3.17 and 3.20 keV which confirmed the presence of AgNPs (Nguyen et al., 2018; Li et al., 2018) on rGO. The TEM picture (Fig. 1e) revealed that rGO presents a layered-like structure with some wrinkled edges; the layer is very thin and transparent. TEM of AgNPs@rGO (Fig. 1f) shows spherical AgNPs particles attached onto rGO, with a diameter from 18 to 30 nm, uniformly distributed on the rGO flakes. All these results clearly indicated the successful hydrothermal synthesis of AgNPs@rGO.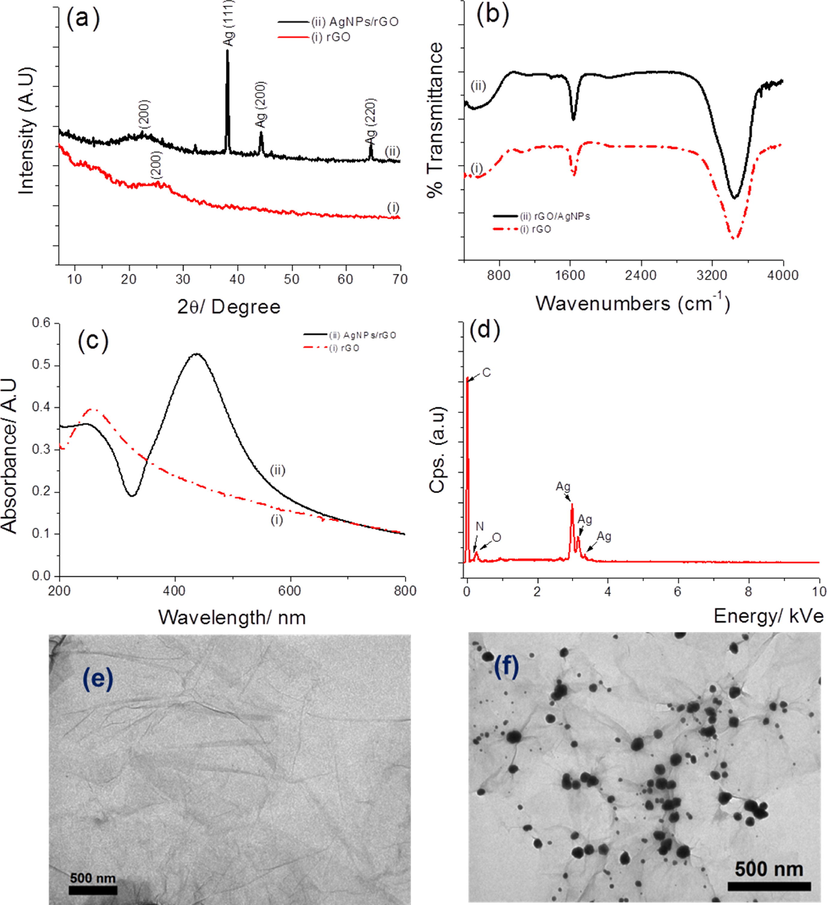
(a) XRD; (b) FT-IR; (c) UV–Vis of rGO (curve i) and AgNPs@rGO (curve ii); (d) EDX of AgNPs@rGO and TEM of (e) rGO and (f) AgNPs@rGO, respectively.
3.2 Hydrogen peroxide detection
3.2.1 Peroxidase – Like catalytic activity of AgNPs@rGO
To understand the role of AgNPs@rRGO as catalyst for the oxidation of TMB by H2O2, we prepared several solutions of different compositions and characterized them by UV–Vis (Fig. 2A). In the case of a solution containing rGO and TMB (curve a), or AgNPs and TMB (curve c), or AgNPs@rGO + TMB (curve f), there is no peak at 652 nm corresponding to TMBOx (corresponding to Eppendorfs labelled a, c, f in the inset, respectively). Other control samples, e.g·H2O2 + TMB (curve i) and rGO + H2O2 + TMBRed (curve b) revealed a slight blue color, indicating that H2O2 oxidized TMBRed into TMBOx even without catalyst, even if this reaction is very slow in these conditions. In contrast, with mixtures of AgNPs + H2O2 + TMBRed (curve d) or AgNPs@rGO + H2O2 + TMBRed (curve e), a strong absorbance peak centred at 652 nm was observed, corresponding to a deep blue color (Eppendorfs d and e, inset), which demonstrates the catalytic activity of AgNPs, even stronger with AgNPs@rGO (curve e). This can be attributed to the high active surface area of the AgNPs@rGO nanocomposite, possibly completed by the role of rGO as electron shuttle between the donor (TMBRed) and the acceptor (Ag+). The catalysed reaction mechanism can be described by the following steps: (i) AgNPs are first dissolved by H2O2 to release Ag+ (at pH 7) (Eq. (3)) (Nguyen et al., 2018).
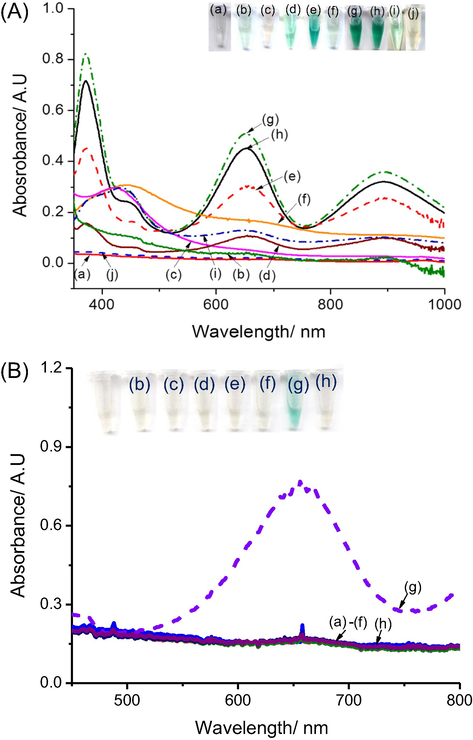
(A) UV–vis spectra of the mixture after 30 min reaction at 40 °C of (a) rGO + TMB; (b) rGO + H2O2 + TMB; (c) AgNPs + TMB; (d) AgNPs + H2O2 + TMB; (e) AgNPs@rGO + H2O2 + TMB; (f) AgNPs@rGO + TMB; (g) AgNO3 + H2O2 + TMB; (h) AgNO3 + TMB, (i) H2O2 + TMB ; and (j) AgNPs@rGO + H2O2; (B) UV–vis spectra after 30 min. reaction of a mixture of AgNPs@rGO + TMBRed containing (a) saccharose; (b) lactose; (c) ascorbic acid; (d) galactose; (e) fructose; (f) glucose; (g) H2O2 and (h) water (blank sample).
This reaction is confirmed by the disappearance of the peak at ∼ 425 nm, specific peak of AgNPs (curve j). Then (ii), Ag+ oxidizes TMBRed into TMBOx (
>
) (Liu et al., 2012; Jang and Roper, 2011), leading to the blue color caused by TMBOx as describing in Eq. (4).
Two Eppendorfs containing AgNO3 + TMBRed (curve h) and AgNO3 + H2O2 + TMBRed (curve g) demonstrated a depth blue colour and a strong maximum absorbance peak at 652 nm, indicating that Ag+ ions are able to oxidize TMBRed efficiently following Eq. (4).
3.2.2 Selectivity of the H2O2 test
For the selective test, we first optimized working conditions for the oxidation reaction between TMB and H2O2 in presence of AgNPs@rGO by changing pH, temperature and concentrations, and measuring the absorbance at 652 nm after a fixed incubating time (30 min). Detailed results are presented in Section SI.II and Fig. SI.3. Obtained results suggested that the highest absorbances at 652 nm (ΔA652) were obtained at pH 3, at a temperature of 50 °C, for 5 mM TMB and 250 µL of AgNPs@rGO. Therefore, these parameters are used for further test. Fig. 2B shows UV–vis spectra after 30 min reaction of a mixture of AgNPs@rGO + TMBRed + 5 mM of some saccharides including saccharose, lactose, galactose, fructose, glucose, ascorbic acid and distillated water (blank sample), compared to 0.5 mM H2O2 (Fig. 2B, curve a to curve h, respectively). As shown, TMB oxidation occurs only in presence of H2O2, which indicates an excellent selectivity.
3.2.3 Sensitivity of the H2O2 test
Fig. 3A presents UV–Vis spectra after 30 min reaction for the AgNPs@rGO + TMB system with H2O2 concentrations from 0.1 mM to 1 mM. Obtained calibration curve for H2O2 is given on Fig. 3B, with an absorbance at 652 nm which follows Eq. (5) (R2 = 0.984).
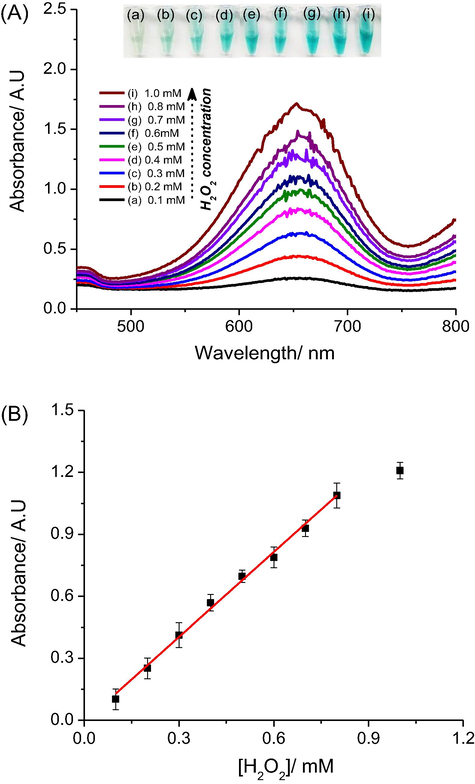
(A) UV–vis spectra of AgNPs@rGO + H2O2 + TMBRed system with different concentrations of hydrogen peroxide from 0.1 to 1 mM; (B) Corresponding calibration curve for H2O2 detection using AgNPs@rGO to replace of peroxidase enzyme.
From the calibration curve and the absorbance obtained with blank samples, we estimated a limit of detection (LOD) of 20 µM H2O2 based on three times the standard deviation of the blank tests. The change in color of the reaction mixture can be seen by naked eyes even for that low H2O2 concentration.
3.3 Glucose detection
3.3.1 Control reactions and selectivity of the glucose test
A colorimetric glucose test has been developed based on the above-described H2O2 test, by combination with glucose oxidase (GOx). This enzyme is known to catalyse the oxidation of glucose by O2, leading to gluconic acid and H2O2 (Eq. (1)). H2O2 can therefore be detected as a product of the reaction. Results from Fig. 4A show that a change in colour is obtained only when glucose, GOx and AgNPs@rGO are put together (curve a). In contrast, the reaction mixtures without one of the substances such as GOx (curve b), glucose (curve c) or AgNPs@rGO (curve d) did not lead to any change in absorbance, which demonstrates that no side-reactions occur. The selectivity of the colorimetric glucose test was investigated by conducting control experiments with lactose, fructose, saccharose, galactose and ascorbic acid, all at a concentration of 0.8 mM.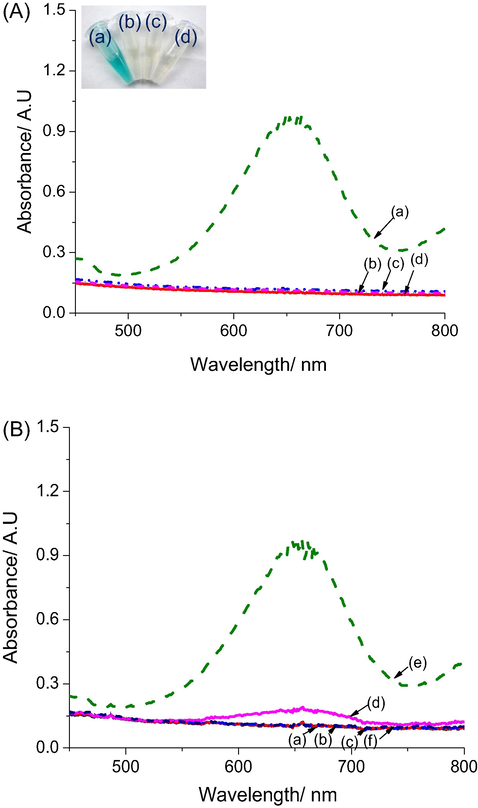
(A) UV–Vis spectra, after 30 min reaction, of mixtures of (a) glucose + GOx + TMB + AgNPs/rGO; (b) glucose + TMB + AgNPs/rGO; (c) GOx + TMB + AgNPs/rGO and (d) glucose + GOx + TMB. (Inset: the corresponding Eppendorfs. (B) UV–vis spectra after 30 min reaction of mixtures of GOx + TMB + AgNPs/rGO + 50 μL of: (a) lactose, (b) fructose, (c) saccharose, (d) galactose, (e) glucose and (f) acid ascorbic. Experimental conditions: 2 mg mL−1 GOx in 100 μL solution at pH 4.5.
As shown on Fig. 4B, no change in absorbance was found, except for galactose with an absorbance change which represents 9.1% of the change obtained for the same concentration of glucose. This is due to the fact that the GOx used contained ca. 3% of galactose gxidase, however, as results show in Fig. 4B clearly prove the excellent selectivity of our colorimetric test. Therefore, above results demonstrated AgNPs@rGO can play the role as an artificial peroxidase enzyme to develop a selective colorimetric glucose biosensor with working principle is proposed in Fig. 5.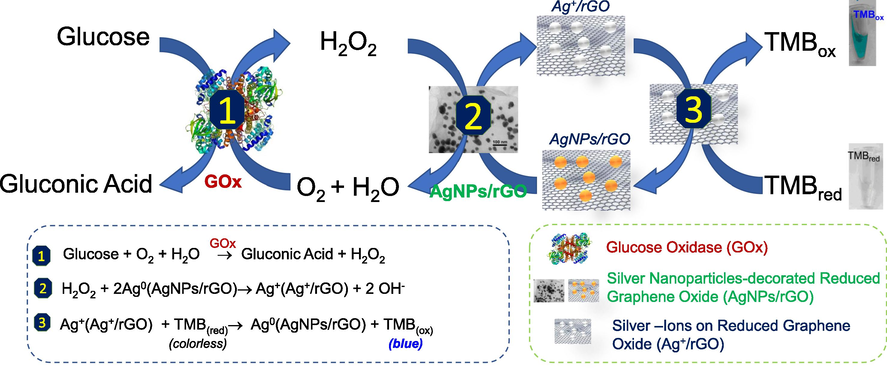
Illustration of working principle of glucose biosensor based on AgNPs/rGO –a novel peroxidase-like activity nanomaterial.
3.3.2 Sensitivity of the glucose test
UV–Vis spectra obtained with increasing glucose concentrations from 0.125 mM to 1.25 mM are shown in Fig. 6A, along with the calibration curve (Fig. 6B). The absorbance varies linearly for glucose concentrations within the range 125 µM to 1.0 mM, with a regression equation Eq. (6):
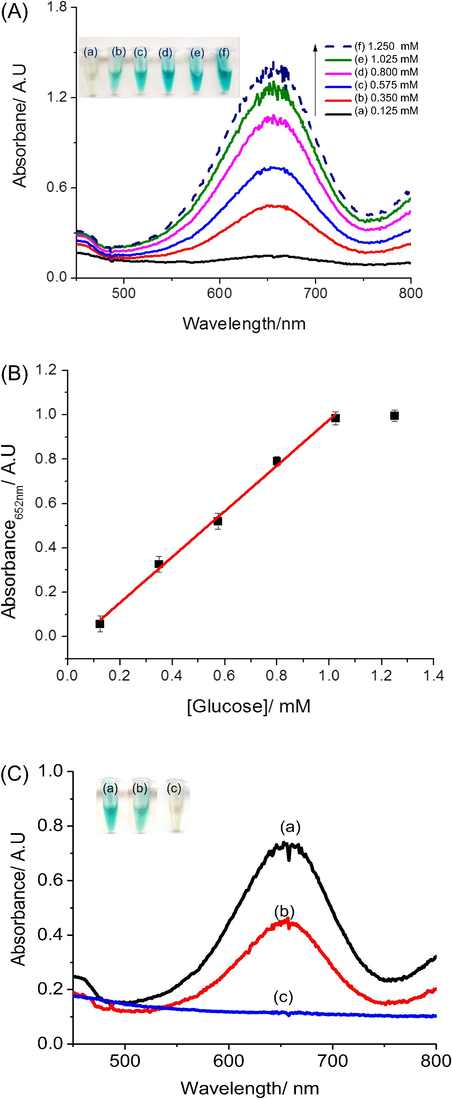
(A) UV–Vis spectra of the AgNPs@rGO/GOx/TMB test for various glucose concentrations; (B) Corresponding calibration curve. Experimental conditions: 2 mg mL−1 GOx in 100 μL solution at pH 4.5. Reaction time: 30 min, (C) UV–vis spectra obtained from the AgNPs@rGO/GOx/TMB glucose test for (a) 0.575 mM glucose added in 50 μL PBS; (b) 50 μL of 10 times diluted human serum; (c) 50 μL H2O (Inset: color of solution in corresponding Eppendorfs).
The limit of detection (LOD) is estimated to be 40 µM based on three times the standard deviation of the blank tests. These results are therefore fully compatible with blood analysis, after dilution of the samples.
3.3.3 Application of the glucose test on human serum samples
To evaluate the ability of our glucose test to work with real samples, we used human sera from volunteers, diluted 10 times with PBS. Glucose-free PBS was used as blank sample and a 0.575 mM glucose solution in PBS was used as control. Detected results are shown on Fig. 6C. The glucose concentration in the diluted serum sample was extracted using Eq. (7):
4 Conclusions
Silver nanoparticles-decorated reduced graphene oxide (AgNPs@rGO) was successfully synthesized and applied for the fabrication of a hydrogen peroxide colorimetric test. Beyond hydrogen peroxide, a glucose test was also obtained by combining AgNPs@rGO with glucose oxidase. The results demonstrated a linear operation range between 0.125 and 1.25 mM with a LOD of 40 μM. This single-enzyme glucose test was successfully applied to measure glucose concentrations in human serum. It proved to be sensitive, selective, low-cost and easy to use and therefore could be easily implemented for third world populations which have a limited access to clinical premises.
Acknowledgments
This research was funded by Vietnam National Foundation for Science and Technology Development (NAFOSTED) under grant number 104.99-2016.23.
References
- Diagnosis and classification of diabetes mellitus. Diabetes Care. 2010;33(Suppl 1):S62-S69.
- [Google Scholar]
- A colorimetric immunoassay based on glucose oxidase-induced AuNP aggregation for the detection of fumonisin B1. Talanta. 2018;186:29-35.
- [Google Scholar]
- Magnetic Fe3S4 nanoparticles with peroxidase-like activity, and their use in a photometric enzymatic glucose assay. Microchim. Acta. 2016;183(2):625-631.
- [Google Scholar]
- Graphene oxide-Fe3O4 magnetic nanocomposites with peroxidase-like activity for colorimetric detection of glucose. Nanoscale. 2012;4(13):3969-3976.
- [Google Scholar]
- Colorimetric detection of glucose based on gold nanoparticles coupled with silver nanoparticles. Spectrochim. Acta Part A Mol. Biomol. Spectrosc.. 2017;173:207-212.
- [Google Scholar]
- Au@Ag heterogeneous nanorods as nanozyme interfaces with peroxidase-like activity and their application for one-pot analysis of glucose at nearly neutral pH. ACS Appl. Mater. Interfaces. 2015;7(26):14463-14470.
- [Google Scholar]
- Phage capsid protein-directed MnO2 nanosheets with peroxidase-like activity for spectrometric biosensing and evaluation of antioxidant behaviour. Chem. Commun.. 2017;53:5216-5219.
- [Google Scholar]
- Novel biotemplated MnO2 1D nanozyme with controllable peroxidase-like activity and unique catalytic mechanism and its application for glucose sensing. Sens. Actuators, B. 2017;252:919-926.
- [Google Scholar]
- Layered vanadium(IV) disulfide nanosheets as a peroxidase-like nanozyme for colorimetric detection of glucose. Microchim. Acta. 2018;185:7.
- [Google Scholar]
- Colorimetric detection of glucose using lanthanum-incorporated MCM-41. Spectrochim. Acta Part A Mol. Biomol. Spectrosc.. 2018;203:294-300.
- [Google Scholar]
- Balancing redox activity allowing spectrophotometric detection of Au(I) using tetramethylbenzidine dihydrochloride. Anal. Chem.. 2011;83:1836-1842.
- [Google Scholar]
- Ultrasmall Pt nanoclusters as robust peroxidase mimics for colorimetric detection of glucose in human serum. ACS Appl. Mater. Interfaces. 2017;9(11):10027-10033.
- [Google Scholar]
- Chitosan and graphene oxide/reduced graphene oxide hybrid nanocomposites – Evaluation of physicochemical properties. Mater. Chem. Phys.. 2018;216:28-36.
- [Google Scholar]
- Crosslinked pectin nanofibers with well-dispersed Ag nanoparticles: Preparation and characterization. Carbohydr. Polym.. 2018;199:68-74.
- [Google Scholar]
- A novel glucose colorimetric sensor based on intrinsic peroxidase-like activity of C60-carboxyfullerenes. Biosens. Bioelectron.. 2013;47:502-507.
- [Google Scholar]
- Intrinsic peroxidase-like catalytic activity of nitrogen-doped graphene quantum dots and their application in the colorimetric detection of H2O2 and glucose. Anal. Chim. Acta. 2015;869:89-95.
- [Google Scholar]
- Sensitive colorimetric immunoassay of Vibrio parahaemolyticus based on specific nonapeptide probe screening from a phage display library conjugated with MnO2 nanosheets with peroxidase-like activity. Nanoscale. 2018;10:2825-2833.
- [Google Scholar]
- Highly sensitive and selective colorimetric detection of Ag(I) ion using 3,3',5,5'-tetramethylbenzidine (TMB) as an indicator. Sens. Actuators, B. 2012;165:44-47.
- [Google Scholar]
- Colorimetric assay of bacterial pathogens based on Co3O4 magnetic nanozymes conjugated with specific fusion phage proteins and magnetophoretic chromatography. ACS Appl. Mater. Interfaces. 2020;12(8):9090-9097.
- [Google Scholar]
- Synthesis of porous Fe3O4 hollow microspheres/graphene oxide composite for Cr(VI) removal. Dalton Trans.. 2013;42:14710-14717.
- [Google Scholar]
- Rapid synthesis of highly monodispersed silver nanoparticles from the leaves of Salvadora persica. Mater. Lett.. 2017;205(226–229)
- [Google Scholar]
- A label-free colorimetric sensor based on silver nanoparticles directed to hydrogen peroxide and glucose. Arabian J. Chem.. 2018;11(7):1134-1143.
- [Google Scholar]
- Colorimetric detection of glucose based on ficin with peroxidase-like activity. Spectrochim. Acta Part A Mol. Biomol. Spectrosc.. 2018;189:510-515.
- [Google Scholar]
- Green tide biomass templated synthesis of molybdenum oxide nanorods supported on carbon as efficient nanozyme for sensitive glucose colorimetric assay. Sens. Actuators, B. 2019;296:126517
- [Google Scholar]
- SERS based detection of glucose with lower concentration than blood glucose level using plasmonic nanoparticle arrays. Appl. Surf. Sci.. 2018;447:576-581.
- [Google Scholar]
- The peroxidase/catalase-like activities of MFe2O4 (M=Mg, Ni, Cu) MNPs and their application in colorimetric biosensing of glucose. Biosens. Bioelectron.. 2015;63:384-391.
- [Google Scholar]
- A nanocomposite prepared from FeOOH and N-doped carbon nanosheets as a peroxidase mimic, and its application to enzymatic sensing of glucose in human urine. Microchim. Acta. 2016;185:270.
- [Google Scholar]
- Graphene oxide/Fe3O4/chitosan nanocomposite: a recoverable and recyclable adsorbent for organic dyes removal. Application to methylene blue. Mater. Res. Express. 2017;4(3):035701
- [Google Scholar]
- Graphene oxide enhanced adsorption capacity of chitosan/magnetite nanocomposite for Cr(VI) removal from aqueous solution. Mater. Res. Express. 2018;6(Number 2):025018
- [Google Scholar]
- Fe3O4 magnetic nanoparticles as peroxidase mimetics and their applications in H2O2 and glucose detection. Anal. Chem.. 2008;80(6):2250-2254.
- [Google Scholar]
- Rock salt type NiO assembled on ordered mesoporous carbon as peroxidase mimetic for colorimetric assay of gallic acid. Talanta. 2019;301:406-412.
- [Google Scholar]
- Growth of CuO nanoneedles on graphene quantum dots as peroxidase mimics for sensitive colorimetric detection of hydrogen peroxide and glucose. Sens. Actuators, B. 2017;248:374-384.
- [Google Scholar]
- A flower-like MoS2-decorated MgFe2O4 nanocomposite: Mimicking peroxidase and colorimetric detection of H2O2 and glucose. Sens. Actuators, B. 2018;275:155-162.
- [Google Scholar]
Appendix A
Supplementary material
Supplementary data to this article can be found online at https://doi.org/10.1016/j.arabjc.2020.05.008.
Appendix A
Supplementary material
The following are the Supplementary data to this article:Supplementary data 1
Supplementary data 1


