

Translate this page into:
Simultaneous optimization of extraction and antioxidant activity from Blumea laciniata and the protective effect on Hela cells against oxidative damage
⁎Corresponding author. dcb@sicau.edu.cn (Chunbang Ding)
-
Received: ,
Accepted: ,
This article was originally published by Elsevier and was migrated to Scientific Scholar after the change of Publisher.
Abstract
Abstract
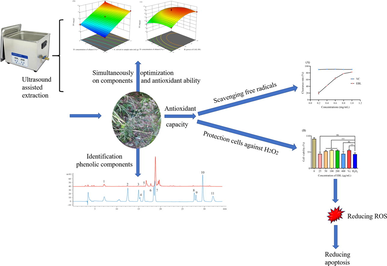
Blumea was the resource for medicine such as l-borneol showing a great economic value. Interestingly, Blumea laciniata was widely used as a folk medicine in south of China and Asia. But the chemical compounds and specific pharmacological activity were rarely reported. Therefore, in this present work, the chemical components from B. laciniata were determined and the antioxidant ability on scavenging radicals and the protection on Hela cells against H2O2 were evaluated. The results showed the antioxidant ability was associated with the presence of polyphenols via response surface method. Additionally, chlorogenic acid, isoorientin, rutin, luteolin-4′-O-glucoside and cinnamic acid were firstly identified in B. laciniata. Moreover, the extract from B. laciniata (EBL) showed a strong antioxidant on clearing DPPH and ABTS free radicals with a lower EC50. Besides, EBL showed no toxicity on Hela cells and even could protect cells from H2O2 induced damage by sharply reducing the excessive reactive oxygen species, improving the mitochondrial membrane potential and then decreasing the generation of cell apoptosis. These outcomes could provide a promising understanding on the potential antioxidant.
Keywords
Antioxidant ability
Blumea laciniata
Hela cells
Response surface method
ROS

1 Introduction
Blumea distributed from southeast to southwest China, Africa and Southeast Asia, and in those places many kinds possessing various medicinal effects were widely used as a herbal medicine for pharmacological activity, such as antioxidant activity, enhancing percutaneous penetration activity, hepatoprotective effects, antitumor activity and antifungal effects (Chen et al., 2009). Those effects might be linked with the content of flavonoids, terpenoids, polyphenols and volatile oil compounds (Pang et al., 2017; Shen et al., 2019; Tan et al., 2020). Likewise, Blumea balsamifera could well scavenge free radicals and inhibit aldose reductase to show anti-diabetic effect (Sakee et al., 2011; Lee et al., 2012). In addition, Blumea was the resource for l-borneol (a widely used medicine), and the essential oil exhibited a unique aromatic odor and was widely incorporated into perfume and cosmetics industries (Pang et al., 2014a, 2014b). Therefore, the plants of Blumea had a great economic value. However, rarely studies were reported on Blumea laciniata (Roxb.) DC. about chemical and pharmacological activity.
B. laciniata was a commonly used herbal medicine in the south of China and Himalayan region. However, the relative researches about B. laciniata were rarely reported. Scholars from India found the essential oil form B. laciniata could well inhibit common pathogenic bacteria, Escherichia Coli, Pseudomonas Aeruginosa, Salmonella Typhi, Protus Vulgaris, Salmonella Typhi, Staphylococcus Aureus (Kar and Jain, 1971). And protocatechuic acid, chrysoeriol, apigenin, 4-hydroxy-3,5-dimethoxbenzoic acid and scopolet also were identified in ethyl acetate fraction of ethanol extract from Blumea laciniata (Yuan et al., 2009). Li et al. screened 21 herbs originating in southern China for antiviral activity and found that the extract of B. laciniata exhibited a good inhibitory effect on respiratory syncytial virus. Previous studies proved the extract of B. laciniata also showed a strong antiviral ability against human herpes simplex virus type 1 (Chen et al., 2018). Meanwhile, the chemical composition of B. laciniata was analyzed, and it was found that the effective components of the antiviral activity might be related to its polyphenols (Li et al., 2004). But, the reports about the antioxidant ability of the extract from B. laciniala was still unknown.
When body was stimulated by endogenous or exogenous oxidative stimuli, the number of reactive oxygen radicals in the body would significantly increase, which caused damage to mitochondrial DNA, mitochondrial dysfunction, and then leading to tissue damage, disease occurrence and aging of the body (Finkel and Holbrook, 2000). Hopefully, many antioxidant active substances in plant and botanical herbs had been found to play a crucial role by scavenging free radical levels and improving antioxidant enzyme activity in the organism (Zhuang et al., 2014; Chen et al., 2018). The first and important step to obtain bioactive compounds from plants was extraction, easily affected by multiple factors such as extraction time, solvent to sample ratio and so on (Santos et al., 2016). Therefore, response surface method (RSM) was established to observe the influence on the extraction rate and optimize the process. In our previous pre-experiment, B. laciniata contained different chemical components and exerted a great antioxidant ability. Therefore, in this present study, the first attempt to optimize the ultrasound-assisted extraction (UAE) condition for chemical compounds and the antioxidant ability by applying Box-Behnken design (BBD). Further the phenolic compounds were detected by High-Performance Liquid Chromatography (HPLC). And the protection of B. laciniata in cellular level was determined to comprehensively evaluate the antioxidant capacity. Those finds may be helpful to gain a better understanding on B. laciniata for potential pharmacological applications.
2 Materials and methods
2.1 Materials and chemicals
Blumea laciniata (Roxb.) DC. was picked up from Zigong, Sichuan, China, at 29°18′41′' N, 104°47′31′' E. The plant was identified as B. laciniata by professor Chao Hu, Department of Botanical Science, College of Life Science, Sichuan Agricultural University and the herbarium (No.3564) was collected and stored in the specimen room of College of Life Science, Sichuan Agricultural University. The whole plant was washed by up-water three times then dried at 50℃ before grounded into powder.
2,2-Diphenyl-1-picryl-hydrazyl (DPPH) was purchased from Sigma Chemical Co. (St. Louis, MO, USA). Ethanol, gallic acid, acetic acid, vanillin, ferric chloride, sodium carbonate, perchloric acid, sodium nitrite and others were purchased from the Chengdu Kelong Chemical Factory (Chengdu, China). Folin-phenol reagent was obtained from Beijing Solarbio Science & Technology Co., Ltd. (Beijing, China). MTT kits and Reactive Oxygen Species Assay Kit (ROS) was obtained from Beyotime Biotechnology (Shanghai, China). Fetal bovine serum (FBS), Dulbecco's modified eagle medium (DMEM), phosphate buffer solution (PBS) and digestive enzyme and Penicillin-Streptomycin solution (10X) were purchased from Hyclone (USA). All chemicals were analytical grade.
2.2 Ultrasonic-assisted extraction (UAE) of chemical compositions
The chemical compositions in B. laciniala were extracted with the assistance of ultrasonic cleaner (SB-4200DTD, Ningbo Scientz Biotechnology Co., LTD, Zhejiang, China). Dry powder (1 g) of B. laciniala was mixed with different concentration of ethanol (50%, 70% and 90%). The solvent to sample ratio was kept at 20, 40 and 60 mL/g. The solution was placed at 50℃ under the UAE with power of 200, 280 and 360 W for 30, 60 and 90 min. All experiments were performed in triplicate.
2.3 Response surface methodology (RSM) design
The optimization experiments for UAE of chemical compounds from B. laciniala were performed by applying a three-level-four-factor Box–Behnken design (BBD) with RSM. Four chemical compounds and three antioxidant abilities were taken as the responses. The coded and actual levels of the four factors were presented in Table 1. The mean values of dependent parameters obtained from the triplicate experiments were fitted to a second order polynomial model as follows:
where Y was the predicted extraction yield; β0 meant a constant; βi, βii, and βij denoted coefficients of the linear, quadratic, and interaction terms, respectively; Xi and Xj represented independent variables. Analysis of variance (ANOVA) was performed to evaluate the individual linear, quadratic and interaction regression coefficients (β) using Design Expert 11 trial version (Stat-Ease, Inc.). The significance of the dependent variables was statistically analyzed by calculating the p value.
Run
Solvent to sample ratio mL/g (X1)
Power of UAE W (X2)
Extraction time min (X3)
Concentration of ethanol % (X4)
TP mg GAE/g
TF mg LE/g
TPA mg PAE/g
TT mg UAE/g
FRAP mM FE / g
ABTS mM TE / g
DPPH %
1
30
280
90
50
40.55
91.79
17.63
8.95
61.76
18.29
82.09
2
40
280
60
50
52.75
83.38
15.89
8.26
47.28
12.02
82.39
3
40
280
60
90
58.06
89.21
14.41
19.10
42.41
11.18
88.09
4
20
360
60
70
28.61
85.37
14.06
18.50
70.52
21.96
83.51
5
30
280
30
90
45.40
80.30
13.30
13.67
45.23
13.54
88.05
6
30
200
60
50
39.67
67.78
11.85
11.22
46.26
12.90
79.60
7
40
280
30
70
53.85
94.34
20.98
16.55
43.98
10.53
84.43
8
30
360
60
50
38.83
86.64
18.12
7.90
55.27
14.50
80.18
9
30
280
60
70
41.39
93.06
17.94
16.30
55.15
16.28
82.13
10
40
360
60
70
53.62
80.94
17.12
11.91
38.04
9.82
80.99
11
20
280
60
90
31.99
57.77
10.96
11.91
51.56
17.37
83.42
12
30
280
60
70
41.74
84.51
17.48
16.93
52.80
15.73
83.91
13
30
200
60
90
45.03
53.05
11.77
14.40
31.43
8.89
85.78
14
20
280
30
70
29.36
70.12
13.84
17.40
64.44
21.94
80.39
15
30
280
30
50
41.66
83.66
19.58
16.74
50.54
14.59
82.28
16
30
280
60
70
44.20
93.45
16.54
19.46
56.19
18.06
81.89
17
30
200
90
70
43.83
75.39
17.57
17.08
45.83
14.83
83.28
18
30
360
90
70
43.89
95.67
21.39
21.78
64.39
17.74
83.51
19
40
280
90
70
55.78
93.36
22.92
21.25
48.79
11.84
85.79
20
20
280
90
70
29.92
84.91
16.78
16.07
57.76
23.16
83.30
21
30
200
30
70
42.00
66.97
14.26
19.48
43.96
11.91
80.30
22
30
280
90
90
45.52
81.75
17.92
25.27
46.10
12.29
86.92
23
30
280
60
70
42.19
84.67
13.95
18.01
50.40
15.29
81.84
24
40
200
60
70
54.05
83.56
15.35
19.90
36.91
10.18
83.62
25
30
360
30
70
41.74
90.06
17.48
18.71
54.68
15.81
85.02
26
20
200
60
70
26.53
33.65
11.49
6.65
34.89
13.21
73.03
27
30
360
60
90
45.82
78.18
11.55
21.86
49.22
12.54
87.33
28
30
280
60
70
41.65
90.63
17.36
18.56
52.02
16.81
82.61
29
20
280
60
50
27.17
81.32
13.44
11.67
70.01
24.11
79.91
2.4 Determination of chemical components
Quantifications of total polyphenols (TP), total flavonoids (TF), total phenolic acid (TPA) and total triterpenes (TT) were measured by a microplate reader and all experiments were performed in triplicate.
TP was assessed according to Folin-phenol reagent method (Zeng et al., 2020). Briefly, 0.2 mL sample solution was mixed with 0.2 mL Folin-phenol reagent (25%, v/v). After 5 min, 0.2 mL sodium carbonate (7.5%, w/v) was added in. Finally, the mixture was diluted to 2 mL with up-water. The reaction solution was placed at dark for 30 min before read at 700 nm for absorbance. The TP content was calculated according to the standard curve made with gallic acid and the TP was expressed as milligram gallic acid equivalent per gram (mg GAE / g) of dry sample.
TF was determined according to the previous method (Lim et al., 2019). Briefly, 0.2 mL sample solution was mixed with 0.3 mL sodium nitrite (5%, w/v), 0.3 mL aluminum nitrate (10%, w/v) and 0.6 mL sodium hydroxide (4%, w/v). The mixture solution was stood at dark for 15 min then diluted to 2 mL with up-water. Finally, the absorbance of reaction solution was read at 510 nm. The TF content was calculated according to the standard curve made with rutin and the TP was expressed as milligram rutin equivalent per gram (mg RE / g) of dry sample.
TPA content was assessed by SDS-HCI method. Briefly, 0.1 mL sample solution was mixed with 0.3 mL SDS (0.3%, w/v) and 0.3 mL mixture solution made with 0.15 mL ferric chloride (0.6%, w/v) and 0.15 mL potassium ferricyanide (0.9%, w/v). Finally, HCl (0.1 mM) was added in to 2 mL. The whole reaction was operated at dark. The absorbance of the reaction solution was read at 753 nm. The TPA content was calculated with the standard curve made with protocatechuic acid. TPA was expressed as milligram protocatechuic acid equivalent per gram (mg PAE / g) of dry sample.
TT content was determined according to the method with some modifications (Luo et al., 2020). Briefly, 0.05 mL sample solution was mixed with 0.1 mL vanillin (2%, w/v, resolved in acetic acid) and 0.15 mL perchloric acid. The mixture was placed at 60℃ for 15 min before diluted to 1.2 mL with acetic acid. The absorbance of reaction solution was read at 550 nm. The TT content was calculated with the standard curve made with ursolic acid. TT was expressed as milligram ursolic acid equivalent per gram (mg UAE / g) of dry sample.
2.5 Determination of antioxidant abilities
Antioxidant activities of sample solution were evaluated by DPPH free radical scavenging ability, ferric reducing antioxidant power (FRAP) and 2,2-azinobis (3-ethylbenzthiazoline-6-sulphonic acid) (ABTS) radical scavenging activity assay kit. DPPH was resolved in ethanol to 0.7 mM. 20 μL sample solution was mixed with 180 μL DPPH solution (0.7 mM) at dark for 10 min before the absorbance was read at 517 nm. The outcome was expressed as clearance rate (%). FRAP and ABTS were determined according to the kit instructions (Nanjing Jiancheng Bioengineering Institute, China). The FRAP results were expressed as millimoles of ferrous sulfate equivalent per gram (mM FE/g) of dry sample. ABTS results were expressed as millimoles of Trolox equivalent per gram (mM TE/g) of dry sample. All experiments were performed in triplicate.
2.6 HPLC analysis
The chromatographic analysis was performed using an Agilent 1260 HPLC (Agilent Technologies, Santa Clara, CA, USA) coupled with a UV–Vis DAD detector and a C18 reversed-phase column (5.0 µm, 150 mm × 4.6 mm). The phenolic compositions were analysed by a gradient elution program using (A) mili-Q water, (B) aqueous phosphoric acid (0.2%, v/v) and (C) acetonitrile were used as the mobile phase and the gradient program was set as follows: 10–16% B (0–3 min), 16–30% B (3–20 min), 30–40% B (20–25 min), 40–16% B (25–30 min), and 16–10% B (30–40 min) with a 0.5 mL/min flow rate. The column temperature was kept at 30℃. The polyphenols concentrations of hlorogenic acid, isoorientin, rutin, apigenin8-C-glucoside, luteolin-4′-O-glucoside, quercitrin, apigenin-7-O-glucoside, luteolin, quercetin, cinnamic acid and apigenin were determined.
2.7 Determination of the antioxidant ability on cellular level
2.7.1 The cell culture
Hela cells were kindly provided by Stem Cell Bank, Chinese Academy of Sciences, Shanghai, China. Hela cells were cultured in DMEM containing 10% FBS. When the cells grew to 80% of the flask, the cells were digested from the bottom and washed with PBS for 3 times for following assays.
2.7.2 Establishment of injury model
The cell density was readjusted to 105 cells/mL and the suspension was seeded into 96-well plate for 12 h. Then different concentrations of H2O2 was added into the plate for 5 h. After exposure, all solution was removed and fresh medium was added into the plate and the cell viability was determined with MTT method (Rajan et al., 2020).
2.7.3 The toxicity of EBL on Hela cells
The Hela cells were resuspended at a concentration of 105 cells/mL. 90 μL cell suspension was added into 96-well plate for 12 h and then different concentration of EBL was transferred into each well for 24 h treatment. After incubation, all solution was removed and new medium was added into the plate. 5 mg/mL MTT solution was transferred into each plate for 5 h. Subsequently the solution was replaced by DMSO solution to resolve formazan. The plate was incubated in a shaker for 1 h. The absorbance of the plate was read at 570 nm and the cell viability was calculated according to the following formula:
Cell viability (%) = A1/A2
Where A1 was the absorbance of trail group and A2 was the absorbance of the blank group.
2.7.4 Determination of the protection of EBL on Hela cells against oxidative stress
Hela cells were seeded into 96-well plate for 12 h and EBL was added into each well for 24 h treatment. Then the solution was removed and new medium and H2O2 were added in and incubated for 5 h. 25 μg/mL of Vc was used as the positive group. Then the cell viability was determined with MTT method.
2.7.5 Determination of the ROS level
The cell suspension was adjusted to the density of 106 cells/mL and then transferred into 6-well plate for 12 h before the sample solution was added in. After 24 h treatment, the cells were exposed to H2O2 for 5 h. Subsequently, the solution was replaced by paraformaldehyde (4%) for 30 min at 4℃. Then PBS was used to washed the cells for 3 time to remove the fixative and ROS kit was added to stain the cell for 30 min at 37℃. Finally, the ROS level was determined by a fluorescence microscope (Olympas-BX51TRF, Japan).
2.8 Statistical analyses
The experimental results of the response surface design were analyzed statistically by one-way ANOVA using Design-Expert 11 software (trial version, State-Ease Inc., Minneapolis, MN, USA). All experimental results were expressed as mean ± standard deviation (SD). All experiments were carried out in triplicates.
3 Results
3.1 The effect of different extraction conditions on the chemical components
3.1.1 Total polyphenols (TP)
Based on the regression coefficient (β) values, linear (X1) revealed a major effect, which was followed by X4. The extraction yield value of TP could be expressed by the following second order poly-nomial equation:
Y = 42.23 + 12.88X1 + 0.12X2 + 0.46X3 + 2.60X4 − 0.63X1X2 + 0.34X1X3 + 0.12X1X4 + 0.08X2X3 + 0.41X2X4 + 0.31X3X4 − 0.71X12 − 0.49X22 + 0.75X32 + 0.62X42
The lack of fit was not significant with the p value = 0.7577 and the model was significant (p < 0.001) indicating the model was fit with good prediction (R2 = 0.9938, adj R2 = 0.9875).
The linear effects of X1 and X4 were positive to the yield of TP while the interactions between two factors were not significant (Table 2). The extraction time and power of UAE did not affect the yield of TP. Increasing of the solvent to sample ratio promoted the TP yield (Fig. 1A), which could help the solute dissolve in solvent. Furthermore, cell wall and particle collisions disruption produced by cavitation enhanced solvent penetration into the sample matrix (He et al., 2016). Note: * means p < 0.05; ** means p < 0.01 and # means < 0.001.
Source
F-value
p-value
TP
TF
TPA
TT
FRAP
ABTS
DPPH
TP
TF
TPA
TT
FRAP
ABTS
DPPH
X1
2122.86
99.87
34.47
15.37
64.57
161.47
33.78
<0.0001#
<0.0001#
<0.0001#
0.0015**
<0.0001#
<0.0001#
<0.0001#
X2
0.17
149.19
15.39
10.05
66.09
21.40
15.91
0.6829
<0.0001#
0.0015**
0.0068**
<0.0001#
0.0004#
0.0013**
X3
2.66
11.23
11.05
4.33
3.65
4.94
1.39
0.1249
0.0048**
0.0050**
0.0562
0.0769
0.0432*
0.2577
X4
86.38
23.65
13.95
121.19
32.56
21.72
78.33
<0.0001#
0.0003#
0.0022**
<0.0001#
0.0001#
0.0004#
<0.0001#
X1X2
1.68
71.00
0.10
83.22
27.38
12.76
36.80
0.2153
<0.0001#
0.7617
<0.0001#
0.0001#
0.0031**
<0.0001#
X1X3
0.50
5.99
0.15
7.72
3.04
0.001
0.51
0.4916
0.0282*
0.7026
0.0148*
0.1031
0.9705
0.4877
X1X4
0.06
20.75
0.15
23.71
4.24
5.36
1.02
0.8059
0.0004#
0.7035
0.0002#
0.0585
0.0362*
0.3298
X2X3
0.03
0.19
0.05
6.33
1.41
0.15
4.29
0.8687
0.6695
0.8183
0.0247*
0.2545
0.7075
0.0574
X2X4
0.71
0.95
6.42
24.54
1.78
0.65
0.20
0.4140
0.3471
0.0239*
0.0002#
0.2038
0.4351
0.6588
X3X4
0.41
1.07
6.55
79.52
2.47
3.78
0.19
0.5341
0.3181
0.0227*
<0.0001#
0.1386
0.0722
0.6694
X12
3.64
23.26
2.14
26.68
0.47
0.64
2.56
0.0770
0.0003#
0.1653
0.0001#
0.5059
0.4380
0.1316
X22
1.62
78.09
7.68
4.73
16.65
24.49
5.76
0.2232
<0.0001#
0.0150*
0.0473*
0.0011**
0.0002#
0.0309*
X32
3.92
4.52
25.81
22.30
1.77
0.35
10.61
0.0679
0.0517
0.0002#
0.0003#
0.2041
0.5656
0.0057**
X42
2.68
26.31
17.26
57.36
2.57
8.84
11.97
0.1240
0.0002#
0.0010#
<0.0001#
0.1311
0.0101*
0.0038**
Lack of Fit
0.61
0.35
0.51
0.64
2.35
1.57
1.82
0.7577
0.9182
0.8257
0.7437
0.2130
0.3513
0.2958
Model
159.29
36.11
10.85
35.54
16.42
19.16
14.96
<0.0001
<0.0001
<0.0001
<0.0001
<0.0001
<0.0001
<0.0001
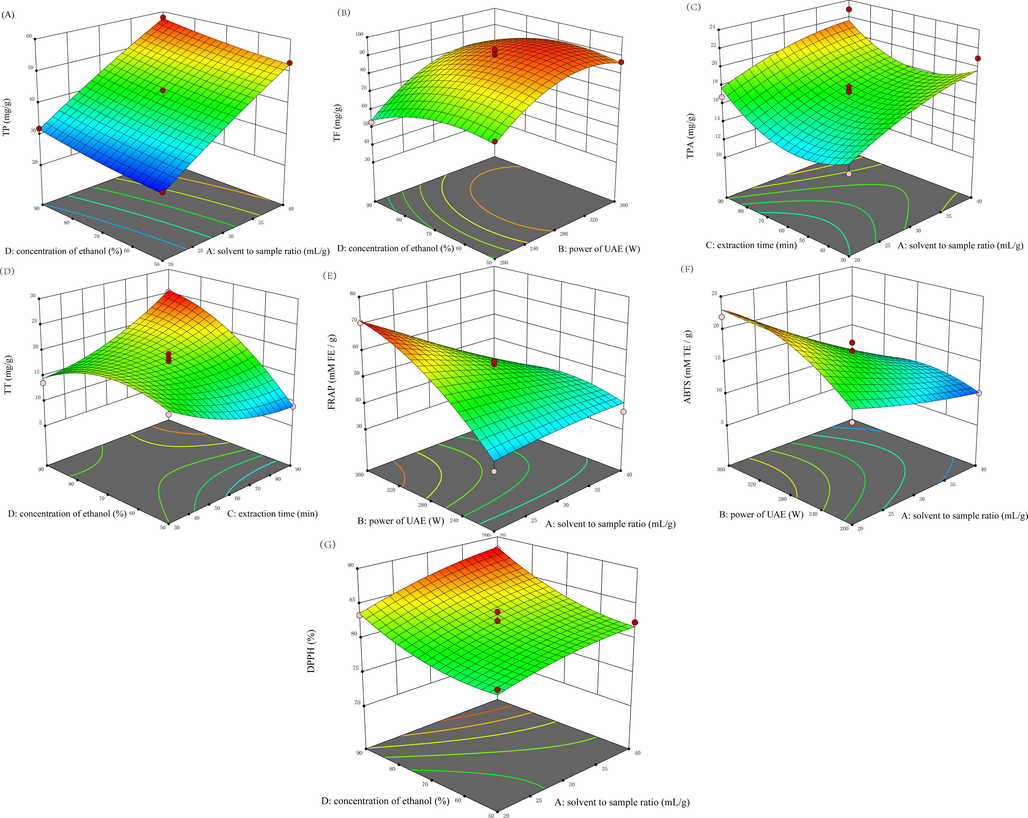
Response surface plots (3D) showing the interactive effect of extractions variables on (A) the total polyphenols, (B) Total flavonoid, (C) Total phenolic acid, (D) Total triterpenes, (E) ferric reducing antioxidant power, and the scavenging ability on (F) ABTS and (G) DPPH free radicals.
3.1.2 Total flavonoids (TF)
As shown in Table 2, the ANOVA results showed significant linear (X1, and X2), quadratic (X22) and interactive (X1X2) effects on TP. Based on the regression coefficient (β) values, interactive (X1X2) revealed a major effect, which was followed by X2, X22, and X1. The extraction yield value of TP could be expressed by the following second order poly-nomial equation:
Y = 89.26 + 9.30X1 + 11.37X2 + 3.12X3 – 4.53X4 − 13.59X1X2 – 3.95X1X3 + 7.35X1X4 − 0.7029X2X3 + 1.57X2X4 – 1.67X3X4 – 6.11X12 − 11.19X22 + 2.69X32 − 6.49X42
The lack of fit was not significant with the p value = 0.9182 and the model was significant (p < 0.001) indicating the model was fit with good prediction (R2 = 0.9731, adj R2 = 0.9461).
The linear effects of X1 and X2 showed a significant (p < 0.05) positive effect on the yield of TF. However, the interaction between X1 and X2 was negative to the yield. Extraction ratio was increasing with a lower solvent to sample ratio and a weaker power of UAE. Increasing the power of ultrasound, the yield of TF was enhanced (Fig. 1B). X22 also showed a negative effect on the yield of TF. This may be multilevel effects of cavitation created by ultrasonic radiation pressure while increasing the power would contribute to the degradation of some bioactive compounds (Sang et al., 2017; Rombaut et al., 2014)
3.1.3 Total phenolic acid (TPA)
As shown in Table 2, the ANOVA results showed significant linear (X1, X2 and X3), quadratic (X22, X32 and X42) and interactive (X1X2) effects on TPA. Based on the regression coefficient (β) values, quadratic (X42) revealed a major effect. The extraction yield value of TP could be expressed by the following second order poly-nomial equation:
Y = 16.65 + 2.17X1 + 1.45X2 + 1.23X3 − 1.38X4 – 0.1984X1X2 – 0.25X1X3 + 0.2492X1X4 + 0.1502X2X3 − 1.62X2X4 + 1.64X3X4 – 0.7375X12 − 1.40X22 + 2.56X32 − 2.09X42
The lack of fit was not significant with the p value = 0.8257 and the model was significant (p < 0.001) indicating the model was fit with good prediction (R2 = 0.9156, adj R2 = 0.8312).
The linear effects of X1 and X2 showed a significant (p < 0.05) positive effect on the yield of TPA while X4 showed a significant (p < 0.05) negative effect. In addition, the interaction between X1 and X2 was also negative to the yield. X22 and X42 also showed a negative effect on the yield of TF. While as the extraction time prolonged, the extraction rate of TPA was improved (Fig. 1C). The influence of four factors on TPA was similar to that on TF. Both of them were mainly affected by the solvent to sample ratio and power of UAE.
3.1.4 Total triterpenes (TT)
The ANOVA results showed significant linear (X4), quadratic (X12, X32 and X42) and interactive (X1X2, X1X4, X2X4 and X3X4) effects on TT. Based on the regression coefficient (β) values, interactive (X3X4) revealed a major effect. The extraction yield value of TP could be expressed by the following second order poly-nomial equation:
Y = 17.85 + 1.23X1 + 0.9948X2 + 0.6535X3 + 3.46X4 − 4.96X1X2 + 1.51X1X3 + 2.65X1X4 + 1.37X2X3 + 2.69X2X4 + 4.85X3X4 − 2.21X12 − 0.9285X22 + 2.02X32 − 3.23X42
The lack of fit was not significant with the p value = 0.7437 and the model was significant (p < 0.001) indicating the model was fit with good prediction (R2 = 0.9726, adj R2 = 0.9453).
The linear effects of X4 showed a significant (p < 0.05) positive effect on the yield of TT while quadratic X42 showed a significant (p < 0.05) negative effect. In addition, the interactions of X1X4, X2X4 and X3X4 were also positive to the yield. Under a high temperature, extending the extraction time could help extract more TT from B. laciniata (Fig. 1D). Nevertheless, the interaction between solvent to sample ratio and power of UAE was negative to the yield of TT. Increasing the concentration of ethanol helped the solute (like TT) dissolve in solvent (Belwal et al., 2016).
3.2 The effect of different extraction conditions on the antioxidant abilities
FRAP was mainly affected by X1 followed by X2, X4 and X1X2. Enhance the single factor of power of UAE showed a positive effect on FRAP. However, the interaction of X1X2 revealed that a lower solvent to sample ratio and a weaker power of UAE could enhance FRAP. In addition, X1 and X4 also demonstrated a negative effect on the yield.
ABTS was mainly affected by X1 followed by X2, X22X1X2 and X4. The linear effects of X1 and X4 were negative to ABTS while X2 showed a positive. Hence interactive effect of X1X2 also suggested a negative on the activity of ABTS, which was similar to the outcome of FRAP.
DPPH radical scavenging ability was dominated by X4 followed by X1, X3, X1X2, X12 and X22. Linear effects of X1 and X4 were positive to the ability. While increasing extraction time would lower the DPPH scavenging ability.
The second order poly-nomial equation of three antioxidant abilities were present as followed:
YFRAP = 53.31 – 7.65X1 + 7.74X2 + 1.82X3 − 5.43X4 – 8.63X1X2 + 2.87X1X3 + 3.40X1X4 + 1.96X2X3 + 2.20X2X4 – 2.59X3X4 − 0.8838X12 − 5.28X22 + 1.72X32 − 2.08X42
YABTS = 16.43–4.68X1 + 1.70X2 + 0.8187X3 − 1.72X4 – 2.28X1X2 + 0.024X1X3 + 1.48X1X4 − 0.2443X2X3 + 0.5127X2X4 − 1.24X3X4 − 0.40X12 − 2.48X22 + 0.2948X32 − 1.49X42
YDPPH = 84.47 + 1.81X1 + 1.24X2 + 0.3682X3 + 2.76X4 – 3.28X1X2 – 0.3852X1X3 + 0.5457X1X4 – 1.12X2X3 + 0.2439X2X4 – 0.2357X3X4 – 0.6796X12 − 1.02X22 + 1.38X32 + 1.47X42
The non-significant values of the lack of fit (p = 0.2130, 0.3513, and 0.2958, respectively) showed that the models were fit with good prediction (R2 = 0.9426, 0.9504 and 0.9373, respectively; adj R2 = 0.8852, 0.9008 and 0.8747, respectively)
Solvent to sample ratio (X1) was the main influencing factor to FRAP, ABTS and DPPH scavenging ability. Meanwhile X1 also affected the yield of TP, TT and TPA. The interaction effect of X1 and X2 showed the same effect on FRAP and ABTS scavenging ability (Fig. 1E and F). Nevertheless, when the extraction time and temperature were fixed, a high concentration of ethanol could help to extract a stronger matrix on clearing DPPH (Fig. 1G). The similar effect of interaction between X1 and X2 indicating that the antioxidant ability was associated with the presence of phenolic compounds rather than total triterpenes (Li et al., 2004). Therefore, the antioxidant of B. laciniata was closely linked with the content of polyphenols.
3.3 Verification of the model
The yields of TP, TF, TPA and TT were determined on the optimum condition for each compound. And the antioxidant ability was also conducted under the optimal extraction condition. The experimental and predicted values were present in Table 3. The outcomes were close to the predicted values, suggesting the response surface method was successfully applied to optimize the extraction process for different constituents and antioxidant abilities of B. laciniata. Note: the experimental assays were conducted three times and expressed as mean ± SD.
TP mg GAE/g
TF mg LE/g
TPA mg PAE/g
TT mg UAE/g
FRAP mM FE / g
ABTS mM TE / g
DPPH %
Predicted
59.59
102.20
22.00
29.74
80.91
26.6
91.37
Experimental
60.29 ± 1.21
101.41 ± 1.66
21.04 ± 0.70
29.12 ± 0.77
80.97 ± 0.84
26.06 ± 0.40
91.04 ± 0.31
3.4 HPLC analysis of phenolic compositions
To further investigate the phenolic compounds in EBL, HPLC was applied to determine the presence of compounds. As shown in Fig. 2, chlorogenic acid, isoorientin, rutin, luteolin-4′-O- glucoside and cinnamic acid five kinds phenolic compounds were firstly identified in EBL among the 11 kinds standards. Moreover, among the five compounds, chlorogenic acid was highly contained while other four compounds were in trace amounts (Fig. 2).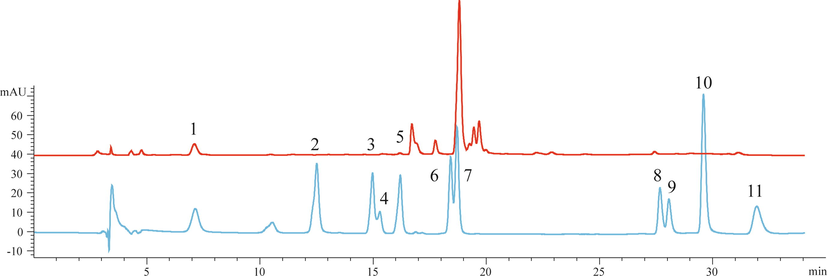
The HPLC analysis on the phenolic compounds of EBL. 1 chlorogenic acid, 2 isoorientin, 3 rutin, 4 apigenin8-C-glucoside, 5 luteolin-4′-O- glucoside, 6 quercitrin, 7 apigenin-7-O-glucoside, 8 luteolin, 9 quercetin, 10 cinnamic acid, 11 apigenin. The red line was the sample curve and blue line was the standard curve.
3.5 The scavenging ability on free radicals
This was the first time to determine the antioxidant ability of B. laciniala. DPPH free radical scavenging ability was applied to evaluate the antioxidant of extract from B. laciniala (ELB). As shown in Fig. 3A, with the increasing concentrations, the clearance rate on DPPH was enhanced. The EC50 was 0.41 mg/mL. Moreover, EBL could also significantly scavenge ABTS radicals with an EC50 of 0.13 mg/mL (Fig. 3B). Natural extracts from plants were demonstrated to show a strong antioxidant ability. Likewise, polyphenols from Rosa banksiae Ait. flowers showed a strong clearance rate on DPPH radical with an EC50 of 0.34 mg/mL (Zeng et al., 2020). And the EC50 of polyphenols from two types of Solanum gilo Raddi on DPPH radical ranged from 0.17 to 0.81 mg/mL (De et al., 2019). Therefore, EBL like other extracts could well scavenge free radicals.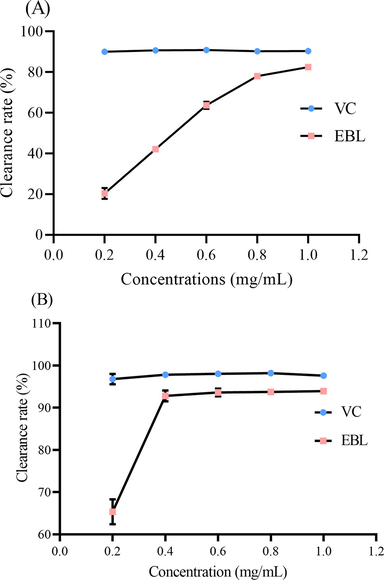
The antioxidant ability of EBL on scavenging (A) DPPH and (B) ABTS free radicals.
3.6 The protection of B. Laciniala on Hela cells against oxidative stress
3.6.1 The toxicity of B. Laciniala on Hela cells
Nevertheless, single antioxidant assays in vitro were not enough to elucidate the antioxidant comprehensively (Granato et al., 2018). Hence, Hela was used to evaluate the antioxidant ability of EBL in cell level. Firstly, the toxicity of EBL should be determined and a serial of suitable concentrations may be picked up. As shown in Fig. 4, different concentrations of EBL (0–400 μg/mL) showed no significantly negative effect on the cell viability of Hela cells after 24 h treatment. The results obtained in this work was in accordance with the previous research that extracts from Blumea balsamifera was also showed a low cell toxicity on Hep G2 cells (Toshio et al., 2008). Therefore, those five concentrations were suitable for following experiments.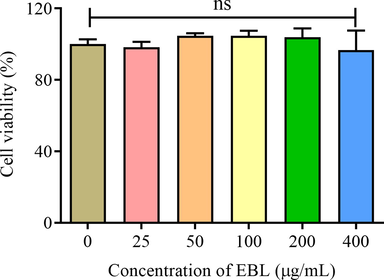
The cell viability under the treatment with different concentration of EBL for 24 h. Note: ns meant not significant.
3.6.2 The cell viability of Hela cells under oxidative stress
Under the oxidative stress induced by H2O2, the cell viability was decreased. A high concentration of H2O2 leaded a sharply reducing on live cell numbers. Hence, it was necessary to find a suitable concentration to establish the injury model. After exposed to different concentrations of H2O2, the cell viability of Hela cells was reduced, and on the condition of 4 mM H2O2, the cell viability was about 50% to the blank group (Fig. 5A). Therefore, 4 mM H2O2 was suitably picked up for the following assays. Natural polyphenols extract from plants were proved to show a protection on cells against stress environments. Likewise, phenolics from Tamarix gallica protect IEC-6 cells against H2O2 induced stress under the concentration of no-toxicity (Bettaib et al., 2017). Hence, different concentrations of EBL were used to pretreated Hela and then the cells were exposed to H2O2 to evaluate the protection of EBL in cellular level. As shown in Fig. 5B, 25 and 400 μg/mL of EBL could not promote the cell viability (p > 0.05) while 50–200 μg/mL of EBL and Vc could significantly improve the survival of Hela cells under oxidative stress. 50–200 μg/mL of EBL exhibited a protection on Hela cells against cell death induced by H2O2, thus the three concentrations were applied to explore the effect on the ROS level.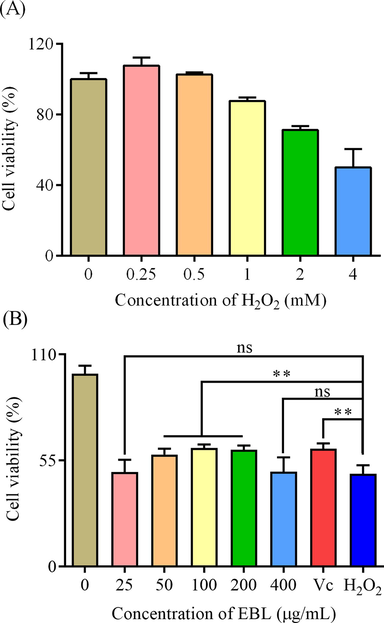
The effect of EBL on Hela cells under oxidative stress. (A) the establishment of injury model and (B) the cell viability of Hela cells pretreated with EBL for 24 h in the presence of H2O2. Note: ns meant not significant and ** meant p < 0.01. Injury meant the group only treated with H2O2, and Blank meant the group treated with same volume of DMEM.
3.6.3 The ROS level of HELA under oxidative stress
H2O2 was the trigger of ROS, causing more free radicals such as •OH, O2¯, leading to cell damage, lipid peroxidation and even cell death (Stadtman, 2004). Hence, a high level of ROS could bring harm to the cell. As shown in Fig. 6A, compared with the blank group, the ROS in injury group was more while pretreated with EBL and Vc, the fluorescent brightness was weak. With the increasing concentration of EBL, the ROS in Hela cells were decreasing and 400 μg/mL of EBL could lower more ROS than Vc and reduce the ROS level to that in blank group. A high level of ROS could lead to the reducing of mitochondrial membrane potential (MMP) then causing cell death (Hseu et al., 2014). As shown in Fig. 6B, the MMP was sharply lowered when the cell was exposed to H2O2, while pretreated with EBL, the MMP could significantly restrain the decrease of MMP. Therefore, the cell apoptosis was then suppressed (Fig. 6C). Hence, EBL showed the protection on Hela cells against H2O2 by reducing the increasing ROS and improving the MMP then reducing cell apoptosis.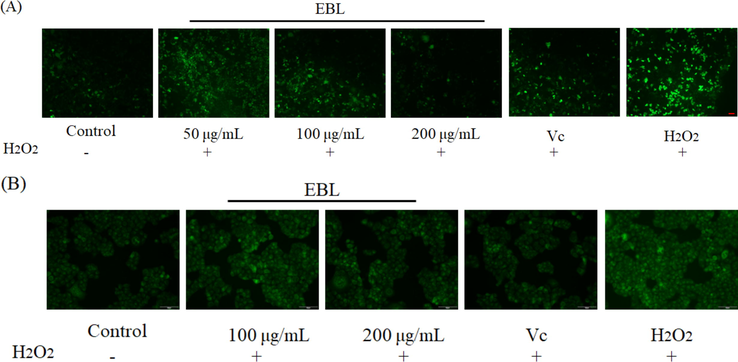
The effect of EBL on (A) the ROS level, (B) the mitochondrial membrane potential and (C) the cell apoptosis stained by Hoechst 33,258 in Hela cells. Note: * meant p < 0.05 and ** meant p < 0.01 compared with injury group. The red arrows meant the apoptotic bodies and red bar = 50 μm. Injury meant the group only treated with H2O2, and Blank meant the group treated with same volume of DMEM.
4 Discussion
Rarely reports were leaded to focusing on the chemical and pharmacology of B. laciniala. Therefore, this was the first time to use response surface method to simultaneously optimize the total polyphenols, total flavonoids, total phenolic acid and total triterpenes from B. laciniala. EBL exhibited a strong antioxidant ability which was closely connected with the content of polyphenols, like the conclusion obtained from B. lacera (Alam et al., 2020). Polyphenols from natural plants were considered to be beneficial for human health through exerting various biological effects such as metal chelation, free radicals scavenging, promotion on antioxidant enzymes activity and alteration of signal transduction pathways (Stocker, 1999). Meanwhile, five phenolic compounds chlorogenic acid, isoorientin, rutin, luteolin-4′-O-glucoside and cinnamic acid were firstly identified with HPLC in B. laciniala. In this genus, luteolin-7-methyl ether, rutin, luteolin and quercetin were found in B. balsamifera (Tan et al., 2020; Chen et al., 2018). Rutin hydrate, gallic acid, and other six phenolic compounds except quercetin were also detected in Blumea lacera and the antioxidant ability of B. lacera was associated with the high presence of polyphenols (Alam et al., 2020). But quercetin was not detected in B. laciniata. Polyphenols like luteolin-4′-O-glucoside and chlorogenic acid was proved to possess a strong antioxidant on scavenging free radicals in vitro (Süzgeç-Selçuk and Birteksöz, 2011; Naveed et al., 2018; Kono et al., 1998). And chlorogenic acid also protected against DNA breakage (Shibata et al., 1999). Thymus vulgaris, Salvia officinalis and Origanum majorana three extracts exerted a great antioxidant due to the combination of different phenolic compounds (Roby et al., 2013). Different phenolic compounds also existed in EBL. Hence the excellent antioxidant of EBL may be the synergistic effect of those phenolic compounds.
As was well known, single antioxidant methods using colorimetric assays are not enough to comprehensively assess the antioxidant properties of a potential plant (Granato et al., 2018). Hence, Hela cells were applied to evaluate the antioxidant ability of EBL in cellular level to further explore the antioxidant quality of B. laciniala·H2O2 could cause oxidative stress to cell and in many reports, H2O2-induced cell injury model was widely used to estimate the protection effect of drugs (Fang et al., 2018; Sim et al., 2017). After exposed to H2O2, the cells pretreated with EBL survived more than injury group, indicating EBL showed a great protection on Hela cells against H2O2 (Fig. 5B).
A low level of ROS played a vital role in physiological cell but excessive ROS could harm to cells, causing damage to DNA, lipids, proteins and other biomacromolecules (Valko et al., 2006). Under the condition of H2O2, the ROS in cell was quickly accumulated (Fig. 6A), then the cells were undergone the oxidative stress thus the cell viability was decreased (Fig. 5B). Extracts from plants were proved to alleviate the oxidative damage. Hedyotis diffusa could protect human hepatocyte cells (LO2) from H2O2-induced cytotoxicity by attenuating cell apoptosis via ERK pathway (Gao et al., 2015). Rhus verniciflua Stokes extract also reduced the ROS level in protect PC-12 cells under H2O2 conditions (Nam et al., 2017). In this work, EBL could significantly lower the ROS level compared with the injury group. In the cell system, antioxidant enzymes such as superoxide dismutase (SOD) and catalase (CAT) were the main defender to eliminate the excessive free radicals causing by high level of ROS (Michiels et al., 1994). And extracts from plants could stimulate the antioxidant system to exert the antioxidant ability such as promoting the ability of CAT and SOD (Zal et al., 2017). Extracts from papaya seed offered protection to Hep G2 cells from oxidative stress by promoting antioxidant enzymes and then improving the cell survivals (Salla et al., 2016). B. laciniala showed a strong antioxidant ability in cell level, which might be linked with the antioxidant system to clear increasing ROS. Meanwhile, a high level of ROS could reduce MMP which was the mark of cell apoptosis (Smith et al., 2000; Kroemer et al., 2007). Under the oxidative stress, the content of ROS was increasing and MMP was reducing then leading to cell apoptosis (Fig. 6). However, EBL could alleviate the damage induced by ROS to MMP in the representation of preventing the decreasing of MMP and reducing the generation of apoptotic bodies. As the concentration of EBL showed no obvious negative effect on the growth of Hela cells (Fig. 4), and the effect of EBL was quite better than Vc on reducing the ROS level. Therefore, it was assumed that EBL could become a safe natural alternative in pharmaceutical industry applying in antioxidants.
But in vitro antioxidant assays were still not sufficient to fully evaluate the antioxidant of EBL. More further in vivo experiments will be carried out to explore the antioxidant capacity as well as the antioxidant mechanism.
5 Conclusions
Response surface method was successfully applied to optimized the components and the antioxidant ability of B. laciniala. Moreover, the antioxidant ability of B. laciniala was closely associated with the content of polyphenols. Besides, five phenolic compounds, chlorogenic acid, isoorientin, rutin, luteolin-4′-O-glucoside and cinnamic acid were firstly identified in EBL. Furthermore, EBL could well scavenge DPPH and ABTS free radicals. Additionally, EBL also exhibited a no-toxicity on Hela cells and a great protection on Hela cells against H2O2 induced damage by reducing the accumulating ROS. These outcomes could help to provide a better understanding on B. laciniala in pharmacological industry.
Funding
This research received no external funding.
CRediT authorship contribution statement
Lijun Zhou: Writing - review & editing. Siyuan Luo: Investigation. Jiajia Li: Investigation. Yiling Zhou: Investigation. Tao Chen: Methodology. Shiling Feng: Software. Chunbang Ding: Supervision.
Declaration of Competing Interest
The authors declared that there is no conflict of interest.
References
- Comparative assessment of nutritional composition, polyphenol profile, antidiabetic and antioxidative properties of selected edible wild plant species of Bangladesh. Food Chemistry. 2020;320:126646
- [CrossRef] [Google Scholar]
- Optimization extraction conditions for improving phenolic content and antioxidant activity in Berberis asiatica fruits using response surface methodology (RSM) Food Chemistry. 2016;207:115-124.
- [CrossRef] [Google Scholar]
- Tamarix gallica phenolics protect IEC-6 cells against H2O2 induced stress by restricting oxidative injuries and MAPKs signaling pathways. Biomedcine Pharmacotherapy. 2017;89:490-498.
- [CrossRef] [Google Scholar]
- Chemical constituents of plants from the genus Blumea. Chemistry Biodiversity. 2009;6:809-817.
- [CrossRef] [Google Scholar]
- Simultaneous optimization of the ultrasound-assisted extraction for phenolic compounds content and antioxidant activity of Lycium ruthenicum Murr. fruit using response surface methodology. Food Chemistry. 2018;242:1-8.
- [CrossRef] [Google Scholar]
- Optimization of the extraction of polyphenols and antioxidant capacities from two types of Solanum gilo Raddi using response surface methodology. J. Appl. Res. Medicinal Aromatic Plants. 2019;16:100238
- [CrossRef] [Google Scholar]
- Characterization of purified red cabbage anthocyanins: improvement in HPLC separation and protective effect against H2O2-induced oxidative stress in HepG2 Cells. Molecules. 2018;24:124.
- [CrossRef] [Google Scholar]
- Oxidants, oxidative stress and the biology of ageing. Nature. 2000;408:239-247.
- [CrossRef] [Google Scholar]
- Effect of Hedyotis diffusa water extract on protecting human hepatocyte cells (LO2) from H2O2-induced cytotoxicity. Pharmaceutical Biology. 2015;54:1148-1155.
- [CrossRef] [Google Scholar]
- Antioxidant activity, total phenolics and flavonoids contents: Should we ban in vitro screening methods? Food Chemistry. 2018;264:471-475.
- [CrossRef] [Google Scholar]
- Optimization of ultrasound-assisted extraction of phenolic compounds and anthocyanins from blueberry (Vaccinium ashei) wine pomace. Food Chemistry. 2016;204:70-76.
- [CrossRef] [Google Scholar]
- The anti-tumor activity of Antrodia salmonea in human promyelocytic leukemia (HL-60) cells is mediated via the induction of G1 cell-cycle arrest and apoptosis in vitro or in vivo. J. Ethnopharmacology. 2014;153:499-510.
- [CrossRef] [Google Scholar]
- Antibacterial evaluation of some indigenous medicinal volatile oils. Qualitas Plantarum Materiae Vegetabiles. 1971;20:231-237.
- [CrossRef] [Google Scholar]
- Iron chelation by chlorogenic acid as a natural antioxidant. Bioscience Biotechnology Biochemistry. 1998;62:22-27.
- [CrossRef] [Google Scholar]
- Mitochondrial membrane permeabilization in cell death. Physiology Review. 2007;87:99-163.
- [CrossRef] [Google Scholar]
- Analysis of apigenin in Blumea balsamifera Linn DC. and its inhibitory activity against aldose reductase in rat lens. J. Agricultural Chemistry Environment. 2012;1:28-33.
- [CrossRef] [Google Scholar]
- Antiviral activities of medicinal herbs traditionally used in southern mainland China. Phytotherapy Research. 2004;18:718-722.
- [CrossRef] [Google Scholar]
- Correlation between the extraction yield of mangiferin to the antioxidant activity, total phenolic and total flavonoid content of Phaleria macrocarpa fruits. J. Appl. Res. Medicinal Aromatic Plants. 2019;14:100224
- [CrossRef] [Google Scholar]
- Optimization of ultrasound-assisted extraction of triterpenes from Bergenia emeiensis leaves and inhibition effect on the growth of Hela cells. J. Appl. Res. Medicinal Aromatic Plants. 2020;6:100266
- [CrossRef] [Google Scholar]
- Importance of SE-glutathione peroxidase, catalase, and Cu/Zn-SOD for cell survival against oxidative stress. Free Radical Biology Medcine. 1994;17:235-248.
- [CrossRef] [Google Scholar]
- Rhus verniciflua stokes extract and its flavonoids protect PC-12 Cells against H2O2-induced cytotoxicity. J. Microbiology Biotechnology. 2017;27:1090-1097.
- [CrossRef] [Google Scholar]
- Chlorogenic acid (CGA): A pharmacological review and call for further research. Biomedcine Pharmacotherapy. 2018;97:67-74.
- [CrossRef] [Google Scholar]
- External application of the volatile oil from Blumea balsamifera may be safe for liver—A study on its chemical composition and hepatotoxicity. Molecules. 2014;19:18479-18492.
- [CrossRef] [Google Scholar]
- Effect of volatile oil from Blumea balsamifera (L.) DC. leaves on wound healing in mice. J. Traditional Chinese Medicine. 2014;6:716-724.
- [CrossRef] [Google Scholar]
- Effects and mechanisms of total flavonoids from Blumea balsamifera (L.) DC. on skin wound in rats. International Journal of Molecular. Science. 2017;18:2766.
- [CrossRef] [Google Scholar]
- Performance of different solvents on extraction of bioactive compounds, antioxidant and cytotoxic activities in Phoenix loureiroi Kunth leaves. J. Appl. Res. Medicinal Aromatic Plants. 2020;17:100247
- [CrossRef] [Google Scholar]
- Evaluation of antioxidant activity, total phenols and phenolic compounds in thyme (Thymus vulgaris L.), sage (Salvia officinalis L.), and marjoram (Origanum majorana L.) extracts. Industrial Crops and Products. 2013;43:827-831.
- [CrossRef] [Google Scholar]
- Green extraction processes of natural products as tools for biorefinery. Biofuels, Bioproducts Biorefining. 2014;8:530-544.
- [CrossRef] [Google Scholar]
- Antimicrobial activity of Blumea balsamifera (Lin.) DC. extracts and essential oil. Natural Product Research. 2011;25:1849-1856.
- [CrossRef] [Google Scholar]
- Antioxidant activity of papaya seed extracts against H2O2 induced oxidative stress in HepG2 cells. LWT-Food Science and Technology. 2016;66:293-297.
- [CrossRef] [Google Scholar]
- Extraction optimization and identification of anthocyanins from Nitraria tangutorun Bobr. seed meal and establishment of a green analytical method of anthocyanins. Food Chemistry. 2017;218:386-395.
- [CrossRef] [Google Scholar]
- Effects of time and extraction temperature on phenolic composition and functional properties of red rooibos (Aspalathus linearis) Food Research International. 2016;89:476-487.
- [CrossRef] [Google Scholar]
- Diterpenoids and bisnorditerpenoids from Blumea aromatica. J. Natural Products. 2019;82:3181-3185.
- [CrossRef] [Google Scholar]
- Natural antioxidant, chlorogenic acid, protects against DNA breakage caused by monochloramine. Bioscience Biotechnology Biochemistry. 1999;63:1295-1297.
- [CrossRef] [Google Scholar]
- Antioxidant effects of Geranium nepalense ethanol extract on H2O2-induced cytotoxicity in H9C2, SH-SY5Y, BEAS-2B, and HEK293. Food Sci. Biotechnology. 2017;26:1045-1053.
- [CrossRef] [Google Scholar]
- The rising incidence of adenocarcinoma relative to squamous cell carcinoma of the uterine cervix in the United States–a 24-year population-based study. Gynecologic Oncology. 2000;78:97-105.
- [CrossRef] [Google Scholar]
- Role of oxidant species in aging. Current Medicinal Chemistry. 2004;11:1105-1112.
- [CrossRef] [Google Scholar]
- Dietary and pharmacological antioxidants in atherosclerosis. Current Opinion Lipidology. 1999;10:589-598.
- [CrossRef] [Google Scholar]
- Flavonoids of Helichrysum chasmolycicum and its antioxidant and antimicrobial activities. South African Journal of Botany. 2011;77:170-174.
- [CrossRef] [Google Scholar]
- Simultaneous quantitative determination of polyphenolic compounds in Blumea balsamifera (Ai-Na-Xiang, Sembung) by High-Performance Liquid Chromatography with photodiode array detector. Int. J. Analytical Chemistry. 2020;2020:1-9.
- [CrossRef] [Google Scholar]
- Mechanism of growth inhibitory effect of Blumea balsamifera extract in hepatocellular carcinoma. Bioscience Biotechnology Biochemistry. 2008;72:1183-1189.
- [CrossRef] [Google Scholar]
- Free radicals, metals and antioxidants in oxidative stress-induced cancer. Chemico-Biological Interactions. 2006;160:1-40.
- [CrossRef] [Google Scholar]
- Studies on the chemical constituents of Blumea laciniata. J. Chinese Medicinal Materials. 2009;32:1065-1066. https://doi.org/10.13863/j.issn1001-4454.2009.07.044 PMID: 19873734
- [Google Scholar]
- Antioxidant ameliorating effects against H2O2-induced cytotoxicity in primary endometrial cells. Toxicology Mechanisms and Methods. 2017;28:122-129.
- [CrossRef] [Google Scholar]
- Phenolic composition, antioxidant and anticancer potentials of extracts from Rosa banksiae Ait. flowers. Molecules. 2020;25:3068.
- [CrossRef] [Google Scholar]
- The lifespan-extending effects of Nymphaea hybrid root extract in the nematode Caenorhabditis elegans. Plant Foods for Human Nutrition. 2014;69:304-309.
- [CrossRef] [Google Scholar]


