Translate this page into:
Smartphone-based colorimetric determination of glucose in food samples based on the intrinsic peroxidase-like activity of nitrogen-doped carbon dots obtained from locusts
⁎Corresponding author. xianggq@haut.edu.cn (Guoqiang Xiang)
-
Received: ,
Accepted: ,
This article was originally published by Elsevier and was migrated to Scientific Scholar after the change of Publisher.
Peer review under responsibility of King Saud University.
Abstract
In this study, nitrogen-doped carbon dots (N-CDs) with excellent peroxidase-like activity were prepared using locust powder as the carbon source by a self-exothermic reaction. The obtained N-CDs could catalyze the oxidation of the chromogenic substrate 3,3′,5,5′-tetramethylbenzidine (TMB) in the presence of H2O2 to generate a blue oxidized product (TMBox) with a maximum absorption peak at 654 nm. The catalytic reaction conditions were optimized; furthermore, steady-state kinetic analysis indicated that N-CDs exhibited high affinity toward both TMB and H2O2, and the Michaelis-Menten constant (km) values were 0.115 mM (TMB) and 0.764 mM (H2O2). A smartphone-based colorimetric method was developed for quantitative detection. The 1/L values (L stands for lightness in HSL color space) of the TMBox solution were recorded via an iPhone application Color Analyzer. Since H2O2 is the by-product of glucose (Glu) oxidation in the presence of glucose oxidase (GOx), a simple, sensitive, and selective smartphone-based colorimetric method was developed for the determination of Glu, and the detection limit was 1.09 μM. The smartphone-based method was successfully applied to determine Glu in different food samples with recoveries in the range of 88.5–109.0 %.
Keywords
Carbon dots
Self-exothermic reaction
Glucose
Peroxidase mimics
Food samples
1 Introduction
Sugar is one of the most essential nutrients in fruits; the content of sugar is used to characterize the maturity of the fruit, and it can also be used as an index of consumer acceptability (Hu et al., 2015). Glucose is a major monosaccharide present in almost all fruits, and it plays an important role in the evaluation of fruit quality (Liu et al., 2006). The taste of fruits, vegetables, and rice is primarily associated with soluble components such as soluble sugars and amino acids. Glucose intake results in an increase in the blood glucose level, while excessive high-glucose fruits intake can rapidly increase the blood glucose level of diabetes mellitus patients (Liu et al., 2004; Xi et al., 2014). More detailed knowledge of the glucose concentration in fruits, vegetables, and rice is still needed because it will be beneficial not only for their quality control, storage, flavor, and processing, but also for diabetics or people whose body is sensitive to Glu level (Jukka et al., 2007; Ma et al., 2014). Thus, it is important to develop a rapid, portable, and economical glucose sensor for measuring the glucose concentration in fruits, assessing the fruit quality, identifying Glu-rich fruits, and guiding the fruit intake for diabetes mellitus patients (Ang et al., 2015).
Many methods have been reported for the analysis of glucose, including high-performance liquid chromatography (HPLC) (Ms et al., 2022), electrochemical methods (Lu et al., 2021; Pak et al., 2021; Xia et al., 2021), spectrophotometry ((Liu et al., 2017; Tran et al., 2018; Zhao and Dong et al., 2018), fluorescence (Chen et al., 2017; Lin et al., 2018; Yuan et al., 2015; Zhang et al., 2019), chemiluminescence (CL) (Yao et al., 2022; Zhao et al., 2018), and electrochemiluminescence (ECL) (Kitte et al., 2017). Among these analytical techniques, spectrophotometry methods, especially the method based on horseradish peroxidase (HRP) and glucose oxidase (GOx), are prevalent because of their good sensitivity, easy operation, fast response, and low cost (Shi et al., 2021; Wang et al., 2022). Furthermore, the results of colorimetry can be visually recorded and monitored by the naked eye or a smartphone (Bandi et al., 2021; Zhang et al., 2022; Zheng et al., 2022). Unfortunately, natural enzymes are sensitive to harsh testing and storage conditions, and they have high costs; moreover, they are easily denatured and difficult to recycle, all of which limit their practical applications (Peng et al., 2020).
Since the first report on Fe3O4 nanoparticles (Gao et al., 2007) with peroxidase-like activity, nanozymes (nanomaterials with enzyme-like characteristics) as a substitute for natural enzymes in colorimetric analysis have attracted considerable attention due to their beneficial properties, such as convenient preparation, robustness to denaturation, and flexibility in composition and structural design ((Liang et al., 2020; Tripathi et al., 2020). Among the various nanozymes, peroxidase-mimicking nanozymes have been the most widely investigated. Moreover, it has been reported that noble metal nanoparticles (Song et al., 2019), transition metal nanoparticles (Liu et al., 2020), metal oxides (Li et al., 2022; Liu and Yan et al., 2020; Zhu et al., 2022) and bimetallic nanostructures (Darabdhara et al., 2019), and carbon-based nanomaterials (including carbon dots (Shu et al., 2021), carbon nanotubes (Zhang et al., 2013), graphene (Lin et al., 2015; Zhu et al., 2021), and graphene oxide (Tran et al., 2020) exhibit excellent peroxidase-like activity; furthermore, they have been used for the analysis of H2O2 and the related analytes as an alternative to HRP. Currently, the peroxidase-like activity of CDs is being extensively studied, providing insights for a detailed understanding of their mechanism of action (Das et al., 2021; Shi et al., 2019; Wei et al., 2020). Moreover, the analytical applications of CDs having peroxidase-like activity particularly involve the detection of H2O2-related analytes or some inhibitors, such as H2O2 (Peng et al., 2020), Glu (Zhong, et al 2018), cholesterol (Zhao et al., 2019), uric acid (Liang et al., 2020), sarcosine (Shu et al., 2021), putrescine (Li et al., 2021a), cadaverine (Li et al., 2021b), ATP (Huang et al., 2021), and ascorbic acid (Shu et al., 2020), for the oxidation reaction. For Glu detection, the real samples used for most the analytical applications based on the peroxidase-like activity of CDs are human serum samples. There are very few reports on analytical applications involving other real samples. In addition, efficient, rapid, and low-cost preparation of CDs-based nanozymes and a precise understanding of their synthesis process are also significant challenges.
In our previous study (Su et al., 2022), we reported an efficient, rapid, and low-cost method for synthesizing N-CDs by a self-exothermic reaction within 10 min using locust powder as the raw material. These N-CDs has proved that biomass is an ideal raw material for the preparation of high-performance CDs because it is rich in C element and also contains N, S, P elements (Fu et al., 2019; Fu et al., 2021). In this study, the intrinsic peroxidase-like activity of N-CDs derived from locust powder was confirmed. The N-CDs were successfully applied for Glu detection based on the TMB-H2O2 reaction. The catalytic reaction was well optimized, and the effect of N-CDs as a peroxidase mimic on the reaction kinetics was investigated. Since H2O2 is the by-product of Glu oxidation in the presence of glucose oxidase (GOx), a smartphone-based colorimetric method was developed for the determination of Glu based on the linear relationship between the 1/L values (HSL color space) of the sample solutions identified by an iPhone with a free application (Color Analyzer) and the concentrations of Glu. Furthermore, the developed smartphone-based colorimetric method was successfully applied to analyze Glu in different food samples with excellent sensitivity, selectivity, and repeatability (Scheme 1).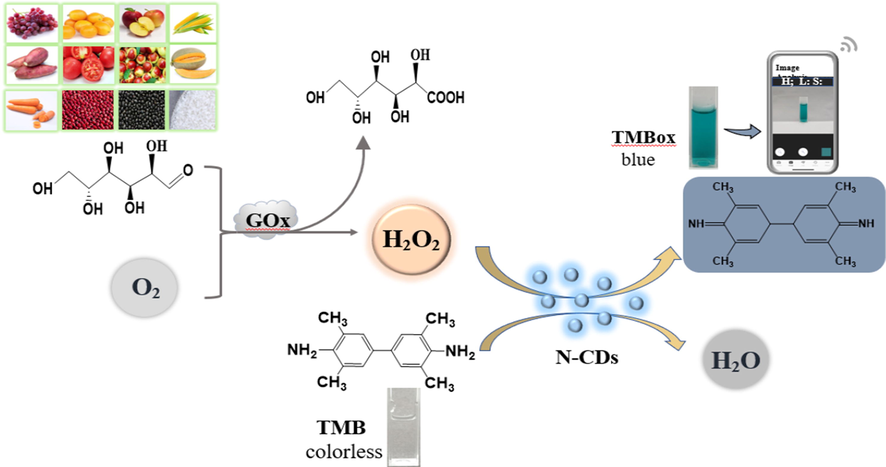
A schematic of the smartphone-based colorimetric assay of glucose with N-CDs as the peroxidase mimic.
2 Experimental
2.1 Instrumentation and reagents
TEM images of N-CDs were obtained by a transmission electron microscope (JEM-2011, JEOL, Japan). The elemental composition of N-CDs was determined with an X-ray photoelectron spectrometer (Escalab 250Xi, Thermo Scientific, USA). Electron spin resonance (ESR) experiments were performed on an EMX-8/2.7 spectrometer (Bruker, Germany). A fluorescence spectrometer (RF-6000, Shimadzu, Japan) was employed to obtain the fluorescence spectra. Absorption spectra were recorded using a UV–vis spectrophotometer (UV-2600, Shimadzu, Japan). Fourier transform infrared (FTIR) absorption spectra were obtained using KBr pellets on an IR spectrometer (WQF-510, Beijing Beifen-Ruili Analytical Instrument (Group) Co. ltd., Beijing, China). The solid powder of N-CDs was obtained by a lyophilizer (FD-IA-50, Beijing Songyuan Huaxing Technology Development Co., ltd., Beijing, China). An iPhone 7 smartphone was used to obtain photos for the tests. All the images were analyzed by a free application (Color Analyzer).
Hydrogen peroxide (30 %), nitric acid (AR), 3,3′,5,5′-tetramethylbenzidine (TMB), diethylenetriamine (DETA), and glucose oxidase (GOx) were purchased from Aladdin (Shanghai, China). Amino acids, sugars (including methionine (Met), histidine (His), arginine (Arg), lysine (Lys), glycine (Gly), glutamic acid (Glt), cysteine (Cys), Vitamin C (Vc), sucrose (Suc), fructose (Fru), and glucose (Glu)), and sulfates or nitrites of metals were purchased from Sangon Biotech (Shanghai) Co., ltd. (Shanghai, China). The pH of the testing solutions was controlled by acetic acid-sodium acetate buffer solutions. Locusts were obtained from a local supermarket (Zhengzhou, China). Deionized water (18 MΩ cm−1) obtained from a Millipore system was used in all the experiments.
2.2 Synthesis of N-CDs
N-CDs were prepared according to our previously reported method[47], and the details are provided in the supplementary information.
2.3 Peroxidase-like catalytic activity of N-CDs
The peroxidase-like catalytic activity of N-CDs was determined by investigating the oxidation of TMB in the presence of H2O2. Typically, N-CDs-TMB, TMB-H2O2, and N-CDs-TMB-H2O2 were mixed in three colorimetric tubes, sequentially. After reactions in a water bath for 15 min, the absorbance (654 nm) of the above-mentioned solutions was recorded.
2.4 Steady-state kinetic study
Steady-state kinetic experiments were carried out in the time course mode by monitoring the absorbance variation at 654 nm on a UV-2600 spectrophotometer. The experiments were performed at 50 °C with 0.45 mg mL-1N-CDs in buffer solutions (pH 3.0) by varying the concentration of TMB (0.1–1.0 mM) at a fixed H2O2 concentration (0.1 mM) and by varying the concentration of H2O2 (0.05–10 mM) at a fixed TMB concentration (0.6 mM). The apparent kinetic parameters were calculated through a Lineweaver-Burk plot:
Here, V0 and Vmax are the initial and maximum velocities, respectively, [S] is the substrate concentration, and Km is the Michaelis-Menten constant, which is an indicator of the affinity of an enzyme toward the substrate.
2.5 Quantitative detection of glucose by a smartphone
First, 200 μL GOx solution (1.0 mg mL−1) and 200 μL Glu with different concentrations in NaAc-HAc buffer (pH 3) were incubated at 40 °C in a water bath for 90 min. Then, 225 μL N-CD solution (10 mg mL−1), 0.75 mL 4 mM TMB, and 0.5 mL NaAc-HAc buffer (pH 3) were sequentially added into the mixed solution. After diluting to volume with deionized water, the final solution was further incubated at 50 °C in the water bath for 15 min. Finally, photos of the resulting solutions were taken by a smartphone (iPhone 7), and the 1/L values of the solutions images (HSL color space: H stands for hue, S stands for saturation, and L stands for lightness) were obtained from the images by a free application (Color Analyzer); furthermore, quantitative analysis was based on the excellent linear relationship between the 1/L values and the concentrations of Glu. For comparison, the absorbance (654 nm) of the resulting solutions was detected by a UV-2600 spectrophotometer. Moreover, the corresponding quantitative analysis was performed by the conventional absorbance method.
2.6 Sample treatment
Different food samples (including fruits, vegetables, and cereals purchased from the local supermarket) with different Glu concentrations were chosen as the representative samples for evaluating the analytical performance of the developed method. The extraction of Glu from the food samples was carried out according to a previously reported method (GB 5009.8-2016). For fruit and vegetable samples, 10.0 g peeled fruits or vegetables were chopped and homogenized; for the grain samples, 10.0 g milled rice and husked beans were ground into flour. During extraction, an aliquot of the food sample (1.0 g of the homogenate or cereal flour) was weighed and extracted with 60 mL deionized water. The mixture was kept in an ultrasonic equipment at 60 W for 20 min. After being centrifuged at 5000 rpm for 10 min, the supernatant was collected. Finally, the obtained supernatant was filtered through a 0.45 μm filter and diluted to 100 mL for the subsequent tests.
3 Results and discussion
3.1 Characterization of N-CDs
The N-CDs prepared using locust powder were characterized by HRTEM, XPS, FTIR spectroscopy, UV–vis spectroscopy, and fluorescence spectroscopy. The morphology of the N-CDs was investigated by TEM; the TEM images (Fig. 1a-b) indicate that the N-CDs are uniformly distributed with an average diameter of 2.59 ± 0.3 nm. The HRTEM image (inset of Fig. 1b) indicates high crystallinity of N-CDs; moreover, the lattice fringe spacing of 0.206 nm corresponded to that of the sp2 (1120) graphitic crystal phase of graphene (Alam et al., 2015). The elemental composition and chemical bonds in N-CDs were characterized by XPS. Fig. 1c exhibits the survey scan of the N-CDs, where the three major peaks at 286.3, 401.0/406.5, and 532.2 eV can be ascribed to C 1 s, N 1 s, and O 1 s with the atom ratios of 41.14 %, 25.41 %, and 32.83 %, respectively. The high-resolution spectrum of C 1 s, N 1 s, and O 1 s is shown in Fig. S1. It could be concluded that there were C—N/C⚌C, C—C, C—O—C, C⚌O, C—N, N—H, and N—O groups on the surface of N-CDs (Atchudan et al., 2018; Kumar et al., 2017; Li et al., 2015; Zhang and Chen et al., 2014). FTIR spectroscopy was conducted to confirm the surface groups of N-CDs. As shown in Fig. 1d, the peak at 769 cm−1 is ascribed to the C⚌C stretching vibration. The absorption peaks at 1384 cm−1 and 1766 cm−1 were attributed to the C—N and C⚌O bending vibrations, respectively; the peaks at 3016 cm−1 and 3431 cm−1 corresponded to the N—H and O—H stretching vibrations (Qi et al., 2019). The information about elemental composition and chemical bonds obtained from XPS was consistent with the results of FTIR spectroscopy.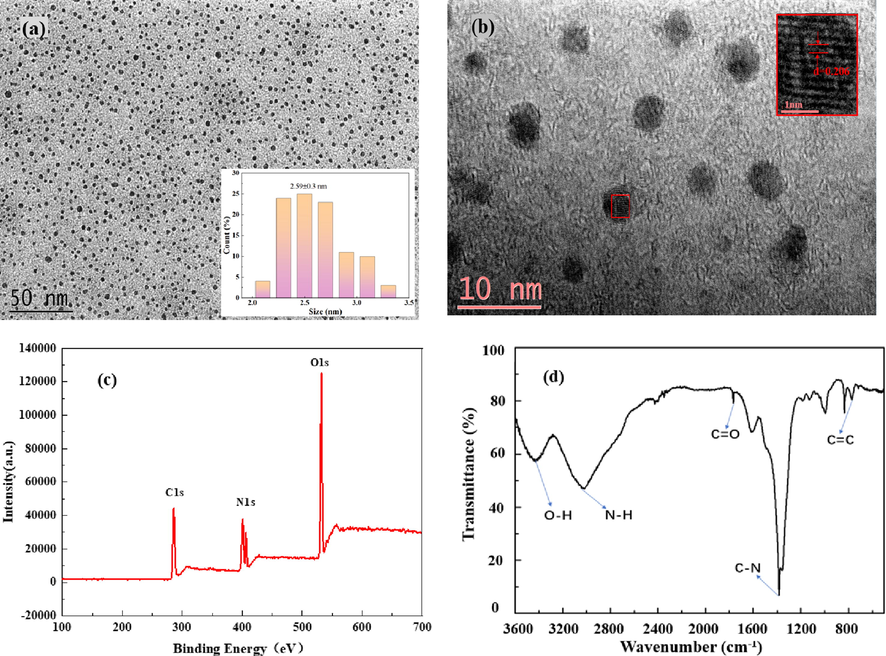
TEM image (a) and HRTEM image (b) of N-CDs. XPS survey spectrum (c) and FTIR spectrum (d) of N-CDs.
Under excitation in the range of 350–450 nm, the wavelength and intensity of the fluorescence emission were investigated, and the strongest emission peak of N-CDs was observed at 470 nm at the excitation wavelength of 390 nm (Fig. S1d). The fluorescence quantum yield of N-CDs was measured in a solution (PB buffer, pH 4) using quinine sulfate as the standard, and the value was approximately 3.1 %.
The optical properties of N-CDs were studied using fluorescence spectroscopy and UV–vis spectroscopy. Fig. S1d shows that the N-CDs exhibit two typical UV–vis absorption peaks at 300 nm and 350 nm: The peak at 300 nm was ascribed to the π-π* transition for the C⚌C bond, in which the orbitals are sp2-hybridized clusters; the peak at 350 nm corresponded to the n-π* transition of the C⚌O and N—H groups (Yang et al., 2018).
3.2 Peroxidase-like activity of N-CDs
The peroxidase-like activity of N-CDs was investigated by choosing TMB as the chromogenic substrate for oxidation by H2O2, and the UV–vis spectra of TMB were obtained under different reaction conditions. As shown in Fig. 2, there is no obvious absorption peak at 654 nm and no significant color change in the TMB solution for TMB + N-CDs and TMB-H2O2 (curves a and b, respectively); this indicated that N-CDs could not oxidize TMB and H2O2 oxidized TMB very slowly without the catalyst. TMB + H2O2 + N-CDs showed a remarkable absorption peak at 654 nm and produced a blue-green color (Fig. 2 inset, photo c), suggesting that N-CDs exhibited peroxidase-like activity for the oxidation of TMB by H2O2.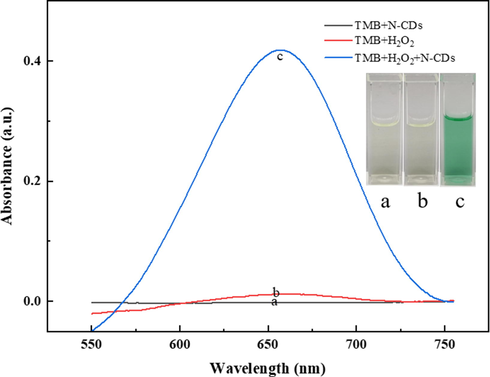
UV–vis absorption spectra of (a) TMB + N-CDs, (b) TMB + H2O2, and (c) TMB + H2O2 + N-CDs in acetate buffer at pH 3.0 (TMB: 0.6 mM, H2O2: 50 μM). Inset: The corresponding photographs of the above-mentioned reaction solutions.
3.3 Optimization of catalytic conditions
To further evaluate the peroxidase-like activity of N-CDs, the effects of pH, reaction temperature, and concentrations of TMB and N-CDs on the absorptance at 654 nm were investigated.
The oxidation reaction between H2O2 and TMB usually takes place under acidic conditions, and pH is the key factor for the reaction and the color of the reaction products. The catalytic behavior of N-CDs for the oxidation of TMB by H2O2 at pH values ranging from 1 to 6 was investigated. As shown in Fig. 3a, the maximum absorptance at 654 nm was achieved at pH 3, and the absorptance decreased considerably beyond this pH. This result indicated that the peroxidase-like activity of N-CDs was lower under weak acidic conditions. Moreover, the lower absorptance at pH 1 and 2 was because the blue oxidized product of TMB was easily converted to another yellow compound at strong acidic conditions. Therefore, pH 3 was chosen as the best pH. The effect of the reaction temperature was studied between 20 °C and 70 °C. The maximum absorptance at 654 nm was obtained when reaction temperature higher than 50 °C (Fig. 3b), and considering the decomposition of H2O2 at higher temperature, 50 °C was selected as the optimal reaction temperature.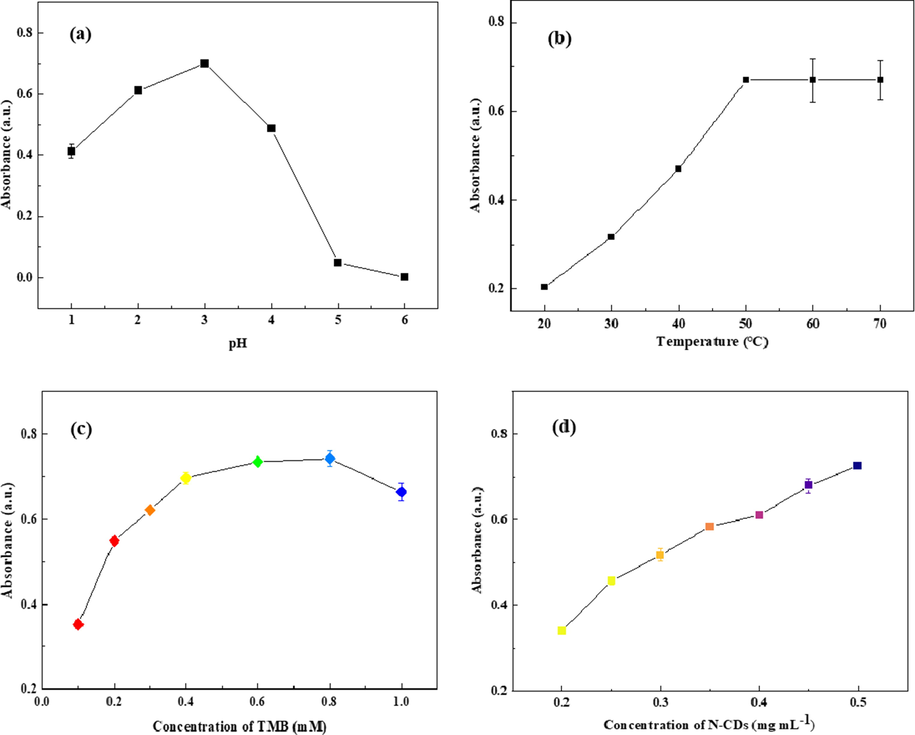
Optimized catalytic conditions for the oxidation of TMB by H2O2 (pH (a), temperature (b), and concentrations of TMB (c) and N-CDs (d)).
The concentrations of the substrate (TMB) and the catalyst (N-CDs) are also important factors for the catalytic oxidation reaction. Fig. 3c shows the effect of TMB concentrations on the absorptance at 654 nm in the range of 0.1–1.0 mM. The absorptance at 654 nm increased with the increase in the TMB concentration (0.1–0.4 mM) and then, the absorptance reached a plateau (0.4–0.8 mM). Based on these results, 0.6 mM was chosen as the optimal substrate concentration. The effect of the catalyst (N-CDs) concentration on the absorptance at 654 nm was also investigated. As shown in Fig. 3d, the absorptance at 654 nm increases with the increase in the concentration of N-CDs from 0.2 to 0.5 mg mL−1; this indicates that the catalytic activity of N-CDs depends on their concentration and a higher concentration leads to higher catalytic activity. When the concentration of N-CDs was greater than 0.45 mg mL−1, the solution appeared light yellow, which interfered with the color of the solution after the catalytic reaction. Therefore, it was inferred that the optimal concentration of N-CDs was 0.45 mg mL−1.
3.4 Steady-state kinetic study
The study of the effect of N-CDs as a peroxidase mimic on the reaction kinetics was based on Michaelis-Menten kinetics according to the procedure reported in section 2.4. The initial velocity was calculated from the absorptance at 654 nm, and the molar absorption coefficient (ε) for the oxidized product of TMB (TMBox, ε = 39000 M−1 cm−1) was calculated by the Lambert-Beer law. A typical Michaelis-Menten curve was obtained by fixing the H2O2 concentration at 0.1 mM (Fig. 4a) and by varying the concentration of TMB from 0.1 to 1.0 mM. Similarly, Fig. 4b shows the Michaelis-Menten curve obtained by fixing the TMB concentration at 0.6 mM and by varying the concentration of H2O2 from 0.05 to 10 mM. Then, the Lineweaver-Burk plots were obtained, and they are shown in Fig. 4c and Fig. 4d.
Steady-state kinetic study of the peroxidase-like activity of N-CDs for TMB oxidation by varying concentrations of (a) TMB and (b) H2O2 and (c, d) corresponding Lineweaver-Burk plots.
The Michaelis-Menten constant (km) reflects the affinity between the enzyme and the substrate; a lower value of km indicates stronger affinity of the enzyme for the substrate and higher catalytic performance. For N-CDs as a peroxidase mimic, the calculated km and Vmax values are listed in Table 1 along with the values of horseradish peroxidase (HRP) and other peroxidase mimics reported in the literature. The km values of N-CDs toward both TMB and H2O2 were significantly lower than those of HRP, indicating that N-CDs exhibited considerably higher affinity than HRP. The km value of N-CDs toward H2O2 was comparable to those of other previously reported CDs-based peroxidase mimics, whereas the km value of N-CDs with TMB as the substrate was the smallest among those of the previously reported CD-based peroxidase mimics; this suggested that the affinity between N-CDs and TMB was considerably higher than that between other previously reported CD-based peroxidase mimics and TMB. Furthermore, it should be pointed out that the N-CDs were obtained via only a self-exothermic reaction using locust powder as the carbon source within 10.0 min. On the contrary, other CD-based peroxidase mimics have been prepared by complicated and time-consuming synthesis procedures with high energy consumption.
Catalyst
Substrate
Vmax (10-8 M S-1)
km (mM)
Reaction time (min)
Ref
HRP
TMB
10.0
0.434
/
(Zhang et al., 2014)
H2O2
8.71
3.702
CDs
TMB
4.29
0.427
25
(Bano et al., 2018)
H2O2
22.2
0.244
N, S-CDs
TMB
0.0765
0.3096
50
(Tang et al., 2019)
H2O2
0.0488
0.6799
N, S-CDs
TMB
0.167
0.387
45
(Singh et al., 2018)
H2O2
0.530
0.106
B, N, S-CDs
TMB
9.467
0.435
30
(Peng et al., 2020)
H2O2
1.255
0.0233
N-CDs
TMB
2.48
0.115
15
This work
H2O2
17.15
0.764
Generally, the catalytic mechanism of peroxidase mimics can be ascribed to different factors such as the generation of reactive oxygen species including ·OH and enhanced electron transfer processes (Shi et al., 2019). To investigate the catalytic mechanism of N-CDs, electron spin resonance (ESR) spectroscopy was conducted to confirm the generation of hydroxyl radicals in the catalytic system. 5,5-Dimethyl-1-pyrroline N-oxide (DMPO) was used as the spin trapping agent to react with ·OH; this resulted in the generation of the stable DMPO/·OH spin adduct, which exhibited a typical four-line ESR spectrum with relative intensities in the ratio of 1:2:2:1. The typical ESR spectrum of the DMPO/·OH spin adduct shown in Fig.S3 suggests the generation of hydroxyl radicals in the catalytic oxidation of the substrate TMB by N-CDs.
3.5 Analytical performance of the smartphone-based method
To verify the analytical performance of the smartphone-based analytical method for Glu, images of the testing solutions were taken by a smartphone and then, the color space parameter values were read through an iPhone application (Color Analyzer). To determine the most suitable relationship for quantification by the images of the testing solutions, different color space parameters, including RGB, CMYK, grayscale and HSL, were analyzed. Among all the dependence between the concentration of Glu and the color space parameters, the linear relationship observed between the concentration of Glu and 1/L (here, L stands for lightness in HSL color space) was found to be excellent (Fig. 5a). The linear regression equation was 1/L = 0.000184C (μM) + 0.0148 with a correlation coefficient of 0.9984. The detection limit was calculated to be 1.09 μM (3σ/k), and the relative standard deviation (RSD) was 2.0 % (c = 5 × 10⁻⁵ M). With the increase in the Glu concentration, the color of the testing solutions gradually changed from colorless to blue-green (Fig. 5a, inset). When the concentration of Glu was higher than 20 μM, obvious blue color of the testing solutions was visible. Thus, the developed method has significant potential for the visual detection of Glu.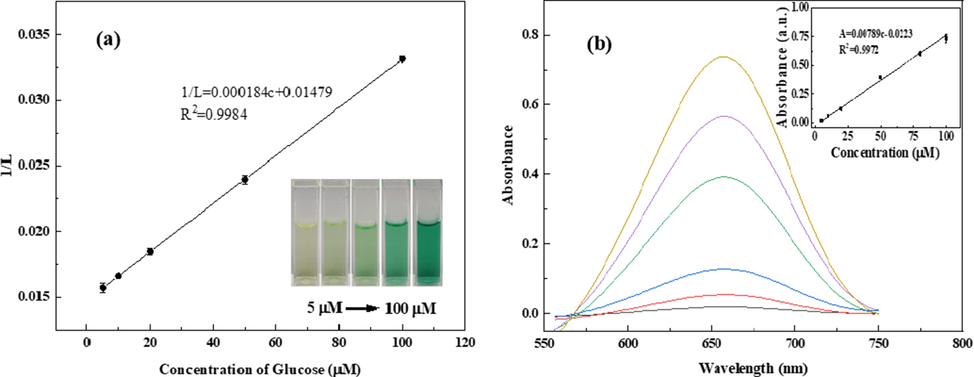
Linear relationship between 1/L and the concentration of Glu (a). Linear relationship between the concentration of Glu and absorptance at 654 nm (b).
For comparison, a standard calibration curve (the absorptance at 654 nm versus Glu concentrations) was also obtained using a UV–vis spectrophotometer under the same optimal reaction conditions. As shown in Fig. 5b, the linear regression equation is A = 0.00789C (μM) + 0.0223 in the range of 5–100 μM with a detection limit of 0.20 μM.
A comparison of some of the features of the developed method with those of other previously reported Glu assays based on CDs with peroxidase-like activity is presented in Table S1. It is clear that the smartphone-based method has a lower detection limit and comparable linear range, which can be explained by the higher affinity between N-CDs and TMB. Furthermore, it should be noted that serum samples are the most popular real samples used for Glu assays. In this study, the smartphone-based method was successfully applied for the analysis of different food samples, including fruits, vegetables, and grains, which can widen the application fields.
3.6 Selectivity of the smartphone-based method
To evaluate the selectivity of the smartphone-based method for Glu detection, the influence of the potential interfering substances, such as metal ions, common amino acids, sugars and Vc, on the absorptance at 654 nm was investigated. The catalytic system containing Glu (100 µM) and selected potential interfering substances was tested according to the recommended procedures. The tolerance concentration of a potential interfering substance was defined as the maximum concentration that causes < 10 % variation in the absorptance at 654 nm for the testing solutions. As evident from Fig. 6a, none of the metal ions (Hg2+, Pb2+, Na+, and K+, 100.0 µg mL−1; Ni2+, Co2+, Mn2+, Ca2+, Cr3+, and Zn2+, 50.0 µg mL−1) exhibit significant influence on the absorptance at 654 nm. Amino acids, sugars, and Vc were also used to investigate the selectivity of the method for Glu detection (Fig. 6b). The results indicated that the tolerance concentration of Vc was 1.0 µM, which was considerably lower than that of amino acids and sugars (100 µM). This could be explained by the fact that blue TMBox could be reduced to colorless TMB by Vc (Li and Zeng et al., 2021). Fortunately, the amount of Vc in many food samples, such as fruits, vegetables, and grains, is often 1000 times lower than that of glucose or even less. Therefore, the concentration of Vc in the testing solutions used in this method for Glu detection (Glu at the µM level) was considerably lower than 1.0 µM. From the above-mentioned results, it can be concluded that N-CDs can be employed as a highly selective colorimetric probe for Glu in food samples.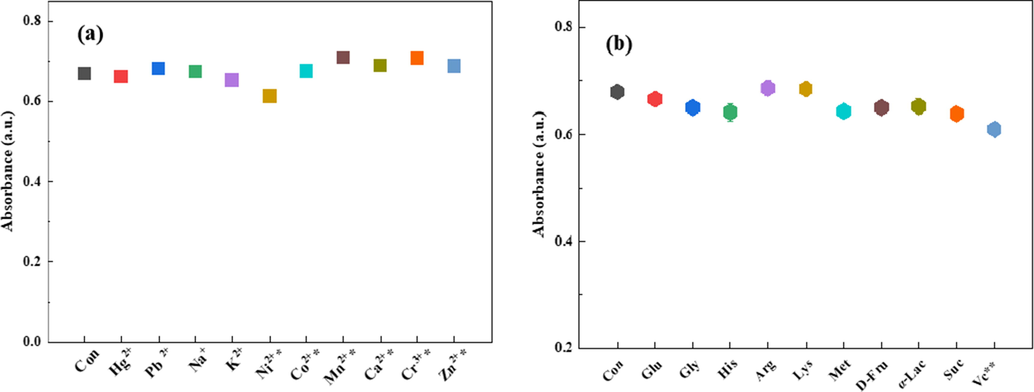
Selectivity investigation of Glu detection in the presence of (a) mental ions and (b) organic compounds in HAc-NaAc buffer (pH 3). Concentrations of organic compounds are 100 μM; concentrations of metal ions are 100 μg mL−1 (Concentrations for substances indicated with * are 50 μg mL−1 and for substances indicated with ** are 1 μM.).
3.7 Food sample analysis
The excellent feasibility of the smartphone-based colorimetric assay was verified by analyzing different food samples. The analytical results and recoveries for the spiked samples are given in Table 2. The recoveries were in the range of 88.5–109.0 % with the RSD values varying from 0.40 to 6.30 %.
Food samples
Added (mg·g−1)
Found (mg·g−1)
Recovery (%)
Chinese northeast rice
0
1.28 ± 0.039
3
4.28 ± 0.27
99.9 %
9
10.88 ± 0.17
106.6
Maize
0
1.46 ± 0.066
2
3.23 ± 0.011
88.5 %
4
5.02 ± 0.057
89.0 %
Red grape
0
54.79 ± 2.85
20
75.57 ± 1.48
103.9 %
40
98.39 ± 0.34
109.0 %
At the same time, the same samples were also analyzed based on the absorptance at 654 nm using a UV–vis spectrophotometer. Both the analytical results are shown in Fig. 7; it is clear from Fig. 7 that the analytical results obtained by the smartphone-based colorimetric method are in good agreement with those obtained by the UV–vis method. Moreover, the t values calculated by using the paired t-test were 0.66, 1.08, and 0.77, and these values were less than t95%, 4 = 2.78 (t-test with 95 % confidence level); this indicated that there were no statistically significant differences between the analytical results of the smartphone-based colorimetric method and the UV–vis method. To demonstrate the practical applications of the developed smartphone-based assay, the amounts of Glu in different fruits, vegetables, and grains were analyzed, and the analytical results are given in Table S2. From the above-mentioned results, it can be concluded that the smartphone-based colorimetric assay has excellent accuracy, sensitivity, and repeatability; moreover, the analytical process is very simple, and the analytical cost is considerably low.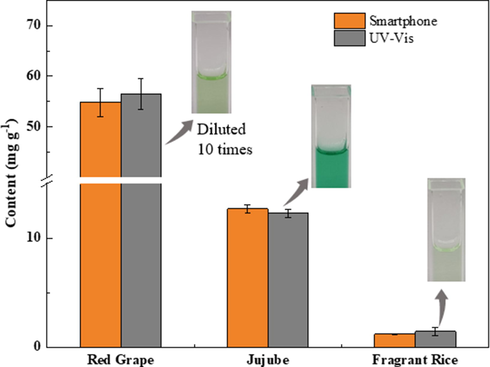
The analytical results for Glu in food samples by smartphone-based colorimetric and UV–vis methods.
4 Conclusions
In this study, we reported a facile smartphone-based colorimetric method using N-CDs as a peroxidase mimic for the determination of Glu in different food samples; the N-CDs were prepared using locust powder as the carbon source. The obtained N-CDs showed excellent peroxidase-like activity for the oxidation of TMB in the presence of H2O2. Michaelis-Menten kinetic analysis indicated that N-CDs showed higher affinity than HRP for the substrate TMB and H2O2. The developed smartphone-based colorimetric method was successfully applied for the determination of Glu in different food samples with low cost, simple operation, and excellent performance.
Funding
This work was financially supported by the Innovative Funds Plan of Henan University of Technology (Grant No. 2020ZKCJ03) and the open project of Engineering Technology Research Center for Grain & Oil Food, State Administration of Grain (Grant No. GA2018007).
Declaration of Competing Interest
The authors declare that they have no known competing financial interests or personal relationships that could have appeared to influence the work reported in this paper.
References
- Synthesis of carbon quantum dots from cabbage with down- and up-conversion photoluminescence properties: excellent imaging agent for biomedical applications. Green Chem.. 2015;17(7):3791-3797.
- [CrossRef] [Google Scholar]
- Development of an amperometric-based glucose biosensor to measure the glucose content of fruit. PLoS One. 2015;10(3):e0111859.
- [Google Scholar]
- Highly fluorescent nitrogen-doped carbon dots derived from Phyllanthus acidus utilized as a fluorescent probe for label-free selective detection of Fe(3+) ions, live cell imaging and fluorescent ink. Biosens. Bioelectron.. 2018;99:303-311.
- [CrossRef] [Google Scholar]
- Cellulose nanofibrils/carbon dots composite nanopapers for the smartphone-based colorimetric detection of hydrogen peroxide and glucose. Sensor Actuat. B-Chem.. 2021;330
- [CrossRef] [Google Scholar]
- A facile and simple strategy for the synthesis of label free carbon quantum dots from the latex of Euphorbia milii and its peroxidase-mimic activity for the naked eye detection of glutathione in a human blood serum. Acs Sustain. Chem. Eng.. 2018;7(2):1923-1932.
- [CrossRef] [Google Scholar]
- Sensitive fluorescent detection of H2O2 and glucose in human serum based on inner filter effect of squaric acid-iron(III) on the fluorescence of upconversion nanoparticle. Talanta. 2017;164:580-587.
- [CrossRef] [Google Scholar]
- Biocompatible bimetallic Au-Ni doped graphitic carbon nitride sheets: a novel peroxidase-mimicking artificial enzyme for rapid and highly sensitive colorimetric detection of glucose. Sensor Actuat. B-Chem.. 2019;285:277-290.
- [CrossRef] [Google Scholar]
- An insight into the mechanism of peroxidase-like activity of carbon dots. Opt. Mater.. 2021;115
- [CrossRef] [Google Scholar]
- Crab shell derived multi-hierarchical carbon materials as a typical recycling of waste for high performance supercapacitors. Carbon. 2019;141:748-757.
- [CrossRef] [Google Scholar]
- Ultralight flexible electrodes of nitrogen-doped carbon macrotube sponges for high-performance supercapacitors. Small. 2021;17(1):e2004827.
- [Google Scholar]
- Intrinsic peroxidase-like activity of ferromagnetic nanoparticles. Nat. Nanotechnol.. 2007;2(9):577-583.
- [CrossRef] [Google Scholar]
- GB 5009.8-2016. National food safety standards, Determination of fructose, glucose, sucrose, maltose, lactose in Foods [S].
- Determination of apparent amylose content in rice by using paper-based microfluidic chips. J. Agric. Food Chem.. 2015;63(44):9863-9868.
- [CrossRef] [Google Scholar]
- Colorimetric detection of ATP by inhibiting the Peroxidase-like activity of carbon dots. Spectrochim. Acta A. 2021;268(5):120658
- [CrossRef] [Google Scholar]
- Consumption of sweetened beverages and intakes of fructose and glucose predict type 2 diabetes occurrence. J. Nutr.. 2007;137(6):1447-1454.
- [CrossRef] [Google Scholar]
- Stainless steel electrode for sensitive luminol electrochemiluminescent detection of H2O2, glucose, and glucose oxidase activity. Anal. Chem.. 2017;89(18):9864-9869.
- [CrossRef] [Google Scholar]
- Polydopamine@electrochemically reduced graphene oxide-modified electrode for electrochemical detection of free-chlorine. Sensor Actuat. B-Chem.. 2017;240:818-828.
- [CrossRef] [Google Scholar]
- Hexagonal cobalt oxyhydroxide-carbon dots hybridized surface: high sensitive fluorescence turn-on probe for monitoring of ascorbic acid in rat brain following brain ischemia. Anal. Chem.. 2015;87(6):3404-3411.
- [CrossRef] [Google Scholar]
- Colorimetric detection of putrescine and cadaverine in aquatic products based on the mimic enzyme of (Fe, Co) codoped carbon dots. J. Food Meas. Charact.. 2021;15(2):1747-1753.
- [CrossRef] [Google Scholar]
- Cobalt-doped carbon quantum dots with peroxidase-mimetic activity for ascorbic acid detection through both fluorometric and colorimetric methods. ACS Appl. Mater. Interfaces. 2021;13(41):49453-49461.
- [CrossRef] [Google Scholar]
- In situ decorating of montmorillonite with ZnMn2O4 nanoparticles with enhanced oxidase-like activity and its application in constructing GSH colorimetric platform. Appl. Clay Sci.. 2022;229
- [CrossRef] [Google Scholar]
- Synthesis of carbon quantum dots with iron and nitrogen from Passiflora edulis and their peroxidase-mimicking activity for colorimetric determination of uric acid. Mikrochim. Acta. 2020;187(7):405.
- [CrossRef] [Google Scholar]
- Intrinsic peroxidase-like catalytic activity of nitrogen-doped graphene quantum dots and their application in the colorimetric detection of H2O2 and glucose. Anal. Chim. Acta. 2015;869:89-95.
- [CrossRef] [Google Scholar]
- A label-free fluorescence assay for hydrogen peroxide and glucose based on the bifunctional MIL-53(Fe) nanozyme. Chem. Commun. (Camb).. 2018;54(14):1762-1765.
- [CrossRef] [Google Scholar]
- A prospective study of fruit and vegetable intake and the risk of type 2 diabetes in women. Diabetes Care. 2004;27(12):2993-2996.
- [CrossRef] [Google Scholar]
- Comparison of the HPLC method and FT-NIR analysis for quantification of glucose, fructose, and sucrose in intact apple fruits. J. Agr. Food Chem.. 2006;54(8):2810-2815.
- [CrossRef] [Google Scholar]
- One-step synthesis of uniform nanoparticles of porphyrin functionalized ceria with promising peroxidase mimetics for H2O2 and glucose colorimetric detection. Sensor Actuat. B-Chem.. 2017;240:726-734.
- [CrossRef] [Google Scholar]
- Facile preparation of homogeneous copper nanoclusters exhibiting excellent tetraenzyme mimetic activities for colorimetric glutathione sensing and fluorimetric ascorbic acid sensing. ACS Appl. Mater. Interfaces. 2020;12(38):42521-42530.
- [CrossRef] [Google Scholar]
- Facile synthesis of magnetic hierarchical flower-like Co3O4 spheres: Mechanism, excellent tetra-enzyme mimics and their colorimetric biosensing applications. Biosens. Bioelectron.. 2020;165:112342
- [CrossRef] [Google Scholar]
- Novel flexible bifunctional amperometric biosensor based on laser engraved porous graphene array electrodes: Highly sensitive electrochemical determination of hydrogen peroxide and glucose. J. Hazard. Mater.. 2021;402:123774
- [CrossRef] [Google Scholar]
- Simultaneous separation and determination of fructose, sorbitol, glucose and sucrose in fruits by HPLC-ELSD. Food Chem.. 2014;145:784-788.
- [CrossRef] [Google Scholar]
- A novel, rapid and robust HPLC-ELSD method for simultaneous determination of fructose, glucose and sucrose in various food samples; method development and validation. J. Food Compos. Anal.. 2022;107:104400
- [CrossRef] [Google Scholar]
- Nickel-gold bimetallic nanostructures with the improved electrochemical performance for non-enzymatic glucose determination. J. Electroanal. Chem.. 2021;900:115729
- [CrossRef] [Google Scholar]
- Smartphone colorimetric determination of hydrogen peroxide in real samples based on B, N, and S co-doped carbon dots probe. Anal. Bioanal. Chem.. 2020;412(4):861-870.
- [CrossRef] [Google Scholar]
- Biomass-derived nitrogen-doped carbon quantum dots: highly selective fluorescent probe for detecting Fe(3+) ions and tetracyclines. J. Colloid Interface Sci.. 2019;539:332-341.
- [CrossRef] [Google Scholar]
- Effect of surface modification on the peroxidase-like behaviors of carbon dots. Colloid Surface B. 2019;178:163-169.
- [CrossRef] [Google Scholar]
- Determination of glucose by using MoS2 nanosheets as a peroxidase mimetic enzyme. New J. Chem.. 2021;45(38):18048-18053.
- [CrossRef] [Google Scholar]
- Colorimetric determination of ascorbic acid based on carbon quantum dots as peroxidase mimetic enzyme. RSC Adv.. 2020;10(25):14953-14957.
- [CrossRef] [Google Scholar]
- Colorimetric determination of sarcosine with carbon quantum dots as mimetic peroxidase. Chem. J. Chinese U.. 2021;42(6):1761-1767.
- [CrossRef] [Google Scholar]
- Peroxidase mimetic activity of fluorescent NS-carbon quantum dots and their application in colorimetric detection of H2O2 and glutathione in human blood serum. J. Mater. Chem. B. 2018;6(32):5256-5268.
- [CrossRef] [Google Scholar]
- Enzyme-triggered in situ formation of Ag nanoparticles with oxidase-mimicking activity for amplified detection of alkaline phosphatase activity. Analyst. 2019;144(7):2416-2422.
- [CrossRef] [Google Scholar]
- Gram-scale synthesis of nitrogen-doped carbon dots from locusts for selective determination of sunset yellow in food samples. Luminescence. 2022;37(1):118-126.
- [CrossRef] [Google Scholar]
- Nitrogen- and sulfur-doped carbon dots as peroxidase mimetics: colorimetric determination of hydrogen peroxide and glutathione, and fluorimetric determination of lead(II) Mikrochim. Acta. 2019;186(9):604.
- [CrossRef] [Google Scholar]
- A nanocomposite prepared from FeOOH and N-doped carbon nanosheets as a peroxidase mimic, and its application to enzymatic sensing of glucose in human urine. Mikrochim. Acta. 2018;185(5):270.
- [CrossRef] [Google Scholar]
- Silver nanoparticles-decorated reduced graphene oxide: a novel peroxidase-like activity nanomaterial for development of a colorimetric glucose biosensor. Arab. J. Chem.. 2020;13(7):6084-6091.
- [CrossRef] [Google Scholar]
- N, S, and P-Co-doped carbon quantum dots: intrinsic peroxidase activity in a wide pH range and its antibacterial applications. ACS Biomater. Sci. Eng.. 2020;6(10):5527-5537.
- [CrossRef] [Google Scholar]
- 3D V2O5-MoS2/rGO nanocomposites with enhanced peroxidase mimicking activity for sensitive colorimetric determination of H2O2 and glucose. Spectrochim. Acta A Mol. Biomol. Spectrosc.. 2022;269:120750
- [CrossRef] [Google Scholar]
- Carbon dots as artificial peroxidases for analytical applications. J. Food Drug Anal.. 2020;28(4):559-575.
- [CrossRef] [Google Scholar]
- Intake of fruit juice and incidence of type 2 diabetes: a systematic review and meta-analysis. PLoS One. 2014;9(3):e93471.
- [Google Scholar]
- Sensitive glucose biosensor based on cyclodextrin modified carbon nanotubes for detecting glucose in honey. J. Food Compos. Anal.. 2021;105:104221
- [CrossRef] [Google Scholar]
- Carbon dots synthesized by hydrothermal process via sodium citrate and NH4HCO3 for sensitive detection of temperature and sunset yellow. J. Colloid Interface Sci.. 2018;516:192-201.
- [CrossRef] [Google Scholar]
- A sensitive biosensor for glucose determination based on the unique catalytic chemiluminescence of sodium molybdate. Spectrochim. Acta A Mol.. 2022;265:120401
- [CrossRef] [Google Scholar]
- MnO2-nanosheet-modified upconversion nanosystem for sensitive turn-on fluorescence detection of H2O2 and glucose in blood. ACS Appl. Mater. Interfaces. 2015;7(19):10548-10555.
- [CrossRef] [Google Scholar]
- Nitrogen-doped carbon quantum dots: facile synthesis and application as a “turn-off” fluorescent probe for detection of Hg2+ ions. Biosens. Bioelectron.. 2014;55:83-90.
- [CrossRef] [Google Scholar]
- In situ growth of positively-charged gold nanoparticles on single-walled carbon nanotubes as a highly active peroxidase mimetic and its application in biosensing. Biosens. Bioelectron.. 2013;43:205-210.
- [CrossRef] [Google Scholar]
- Water-stable metal-organic frameworks with intrinsic peroxidase-like catalytic activity as a colorimetric biosensing platform. Chem. Commun. (Camb).. 2014;50(9):1092-1094.
- [CrossRef] [Google Scholar]
- Pd nanoparticle-decorated graphitic C3N4 nanosheets with bifunctional peroxidase mimicking and ON-OFF fluorescence enable naked-eye and fluorescent dual-readout sensing of glucose. J. Mater. Chem. B. 2019;7(2):233-239.
- [CrossRef] [Google Scholar]
- Facile immobilization of glucose oxidase with Cu3(PO4)2·3H2O for glucose biosensing via smartphone. Colloid Surface B. 2022;210:112259
- [CrossRef] [Google Scholar]
- Self-catalyzing chemiluminescence of luminol-diazonium ion and its application for catalyst-free hydrogen peroxide detection and rat arthritis imaging. Anal. Chem.. 2018;90(3):2201-2209.
- [CrossRef] [Google Scholar]
- FeNPs@Co3O4 hollow nanocages hybrids as effective peroxidase mimics for glucose biosensing. Sensor Actuat. B-Chem.. 2018;263:575-584.
- [CrossRef] [Google Scholar]
- High-activity Mo, S co-doped carbon quantum dot nanozyme-based cascade colorimetric biosensor for sensitive detection of cholesterol. J. Mater. Chem. B. 2019;7(44):7042-7051.
- [CrossRef] [Google Scholar]
- Microfluidic paper-based analytical device by using Pt nanoparticles as highly active peroxidase mimic for simultaneous detection of glucose and uric acid with use of a smartphone. Talanta. 2022;237:122954
- [CrossRef] [Google Scholar]
- Porphyrin-modified NiS2 nanoparticles anchored on graphene for the specific determination of cholesterol. ACS Appl. Nano Mater.. 2021;4(11):11960-11968.
- [CrossRef] [Google Scholar]
- In situ decorating the surface and interlayer of montmorillonite with Co0.5Ni0.5Fe2O4 nanoparticles: a sustainable, biocompatible colorimetric platform for H2O2 and acetylcholine. Nano Res.. 2022;15(10):9319-9326.
- [CrossRef] [Google Scholar]
Appendix A
Supplementary material
Supplementary data to this article can be found online at https://doi.org/10.1016/j.arabjc.2022.104538.
Appendix A
Supplementary material
The following are the Supplementary data to this article:Supplementary data 1
Supplementary data 1


