

Translate this page into:
Sol-gel powder synthesis in the TiO2-TeO2-ZnO system: Structural characterization and properties
⁎Corresponding author. albenadb@svr.igic.bas.bg (A. Bachvarova-Nedelcheva)
-
Received: ,
Accepted: ,
This article was originally published by Elsevier and was migrated to Scientific Scholar after the change of Publisher.
Peer review under responsibility of King Saud University.
Abstract
The present study deals with the gel formation tendency in the ternary TeO2-TiO2-ZnO system. Depending on the TiO2 amount, the gelation occurred at different times and subsequently several gel formation regions have been determined. Homogeneous, transparent and monolithic gels were obtained using combination of organic and inorganic precursors during the synthesis. Using XRD analysis it was established that upon the heating composites were obtained which contain an amorphous phase and different crystalline phases: TiO2 (anatase), TiO2 (rutile), α-TeO2 and ZnTeO3, depending on composition. The IR results showed that the short range order of the amorphous phases which are part of the composite materials consist of TiO6, ZnO4 and TeO4 structural units. Using UV–Vis spectroscopy it was established that the absorption edge of the gels varied from 330 nm to 364 mm and the increase in TiO2 content caused a red shifting of the cut-off. The calculated Eg values are in the range 3.41–3.75 eV higher than that of pure TiO2, TeO2 and ZnO oxides. The XPS results showed that the Te atoms in the surface layers of the samples studied exist in several chemical states as Te2+, Te0, but Te6+ dominates. Octahedrally coordinated Ti4+ ions are observed in the gels and in the samples annealed at 200 °C but a small amount of tetrahedrally coordinated Ti4+ is also detected, which indicates the incomplete polymerization of TiO6 units.
Keywords
Sol-gel
Telluric (VI) acid
Crystallization
IR
XPS

1 Introduction
The wide range of applications in physics, chemistry, materials science and engineering is the main reason which still provokes scientific interest in investigation of mixed oxide systems. Special attention is paid to the ternary mixed oxide systems containing TiO2 as well as to the multifunctional oxide systems which represents the possibility of synthesizing new materials with designed properties (Carp et al., 2004; Kubiak et al., 2018) especially applying the sol-gel synthesis. It is well known that, this method has several advantages (simple synthesis process, mild reaction conditions, high homogeneity of the product, low energy cost, versatility), which enable its use in a wide range of technological processes (Brinker and Scherer, 1990; Dimitriev et al., 2008; Pierre, 2002). Also, the sol-gel method is an interesting technique for preparing hybrid materials (mixed oxide systems and/or inorganic-organic systems), which involves hydrolysis and condensation reactions on the precursors (Brinker and Scherer, 1990). Additionally, synthesis of nanocomposites containing TiO2 using a facile and low-cost synthetic method is still a challenge. It is well known that titanium dioxide is a multifunctional material which is widely studied mainly due to its photocatalytical and antibacterial activity (Carp et al., 2004; Haider et al., 2019). It has been reported that TiO2 can be combined with selective elements, forming mixed oxide materials which could exhibit enhanced physicochemical and antimicrobial properties (Arrachart et al., 2009). However, ZnO is an intermediate oxide which has received a great deal of attention as an alternative photocatalyst owing to it’s nontoxicity, high catalytic efficiency, as well as low cost (Singh et al., 2017; Araujo et al., 2017; Thu et al., 2017). Also, it has previously been the preferred method of obtaining transparent glass-ceramics, applying the conventional melt-quenching method. These materials combine the unique properties of ZnO as well as it’s good network formation ability. Nevertheless, the interesting properties of TiO2 and ZnO are that they both possess high melting temperatures which often cause difficulties in obtaining composite powders due to the requirement of special equipment. Thus, the existence of such complications requires research for new alternative and reproducible routes to surmount the high melting temperatures. Another well-known conditional network-former is TeO2 which does not form glass alone, even at high cooling rates (Sarjeant and Roy, 1967). That is why the sol-gel method is an attractive alternative to the melt quenching one, as it may be used to extend application of new compositions containing TiO2, ZnO and TeO2. However, the sol-gel method has not been applied for the synthesis of TiO2/TeO2/ZnO nanocomposites which additionally motivated our investigations. Until now the thermal, optical and structural properties of glasses in the ternary TiO2-TeO2-ZnO system have been studied by Kabalci et al. (2011) as well as by Ghribi et al. (2015). There is also data for synthesis and structural investigations on binary glasses in each of the binary systems TiO2-TeO2 (Arnaudov et al., 1982; Iordanova et al., 2015; Udovic et al., 2006), TiO2-ZnO (Marci et al., 2001; Xu et al., 2011) and TeO2-ZnO (Ahmed et al., 2012; Sekiya et al., 1994; Burger et al., 1992; Duverger et al., 1997; Hoppe et al., 2004; Kozhukharov et al., 1986) forming the ternary one. Numerous investigations are devoted to the sol-gel obtaining of composite materials in the binary TiO2-ZnO as well as TiO2-TeO2 systems mainly due to the enhanced photodegradation efficiency of the TiO2 catalyst (Marci et al., 2001; Xu et al., 2011). Moreover, powders and films in the TeO2-PbO-TiO2 systems were reported in several papers irrespective of the high hydrolysis rate of the Te(VI) alkoxides (Weng et al., 2004; Hodgson and Weng, 2006; Hayakawa et al., 2012). It has been generalized that the sol-gel derived tellurite coatings and glasses exhibit greater resistance to devitrification than melt quenched glasses.
Our team has experience in the sol–gel synthesis of composite powders and in the previous investigations applying this technique we obtained binary and multicomponent composites with good photocatalytic and antibacterial properties (Shalaby et al., 2011, 2015; Stoyanova et al., 2012; Bachvarova-Nedelcheva et al., 2016; Iordanova et al., 2016). We continue extensive studies on the production of TiO2 containing powders and the investigation of their thermal, optical and structural properties as well as researching new combinations from compositions. The present survey is a continuation of our previous investigations on the sol-gel synthesis composite powders in the TiO2-TeO2-ZnO system, where phase transformation and structural evolution of only gels containing 40 mol % TiO2 have been examined (Gegova et al., 2015).
On the basis of the knowledge gained, we have developed a scheme for synthesis of TiO2/TeO2/ZnO nanocomposites via a modified sol–gel method which is presented in this study. The aim of this paper is to verify and refine the gel formation tendency in a larger concentration range in the TiO2-TeO2-ZnO oxide system. The correlation between conditions of preparation (molar ratio of precursors, temperature of calcination), phase and structural evolution of the gels upon heating has been verified as well. Attention has been paid to the coordination number and chemical states of the main components participating in the amorphous phase.
2 Experimental
2.1 Samples preparation
A combination of Te(VI) acid (Aldrich) along with Ti butoxide (Fluka AG), Zn acetate dihydrate (Merck) precursors dissolved in ethylene glycol (C2H6O2) (99% Aldrich) were used. Bearing in mind the high hydrolysis rate of tellurium(VI) alkoxide, the telluric acid (H6TeO6) is selected in order to overcome that problem (Weng et al., 2004; Hodgson and Weng, 2006; Lecomte et al., 2007; Weng and Hodgson, 2001). The precursor solutions were subjected to 5–30 min intensive stirring at room temperature in order to achieve complete dissolution. No direct addition of water was made to the precursors’ solutions. Sol-gel hydrolysis reaction was acquired from absorbed atmospheric moisture. The adjusting of the pH during the sol-gel processes is very important. Generally, this parameter influences the rate of hydrolysis and condensation processes. At strongly acidic values (pH up to 5) a slow gelation occurred which favors the formation of extended network while basic values of pH (up to 9) induce a fast gelation which is necessary for the formation of nanoparticles (Wright and Sommerdijk, 2000). In our experiments, the measured pH was 4–5 depending on composition. The gelation time for the investigated compositions differed varying from minutes and hours to days. The aging of gels was performed in air in order to achieve completeness of the processes. The obtained gels were subjected to the stepwise heating from 200 to 700 °C for one hour exposure time in air. The heat treatment at 200 °C was performed in air in order to hydrolyze any unreacted - OR groups as well as to decrease their content. Further increases of temperature (300–700 °C) were important to verify the phase and structural transformations of the gels.
2.2 Samples characterization
The thermal stability of selected gels (Table 2) was determined by differential thermal analysis (LABSYSTM EVO apparatus) with Pt–Pt/Rh thermocouple at a heating rate of 10 K/min in air flow, using Al2O3 as a reference material. The accuracy of the temperature was ±5 °C. The heating of the samples was limited up to 600 °C. Powder XRD patterns were registered at room temperature with a Bruker D8 Advance X-ray powder diffractometer with a Cu Kα radiation (λ = 1.54056 Å) with a LynxEye solid position sensitive detector and X-ray tube operated at 40 kV and 40 mA. X-ray diffraction patterns were recorded in the range of 5.3–80° 2θ with a step of 0.02° 2θ. The optical absorption spectra of the powdered samples in the wavelength range 200–1000 nm were recorded by a UV–VIS diffused reflectance Spectrophotometer “Evolution 300″ using a magnesium oxide reflectance standard as the baseline. The absorption edge and the optical band gap were determined following Dharma et al. instructions (Stoyanova et al., 2012). The band gap energies (Eg) of the samples were calculated by the Planck’s equation: , where Eg is the band gap energy (eV), h is the Planck’s constant, c is the light velocity (m/s), and λ is the wavelength (nm). The infrared spectra were registered in the range 1600–400 cm−1 using the KBr pellet technique on a Nicolet-320 FTIR spectrometer with 64 scans and a resolution of ±1 cm−1.
X-ray photoelectron spectroscopy (XPS) measurements were carried out on an AXIS Supra electron spectrometer (Kratos Analytical Ltd.) with base vacuum in the analysis chamber in the order of 10−9 Torr. The samples were irradiated with Al Kα photons with energy of 1486.6 eV. The photoemitted electrons were separated, according to their kinetic energy, by a 180° – hemispherical analyzer with a total instrumental resolution of 1.0 eV (as measured by the FWHM of Ag 3d5/2 line) at constant pass energy of 20 eV. Due to a charging effect the energy calibration was performed by normalizing the C 1s line of adventitious adsorbed hydrocarbons on silver folio to 284.8 eV. The concentrations (in at.%) of the observed chemical elements were calculated by normalizing the areas of their most intense photoelectron peaks to their relative sensitivity factors using the commercial software of the spectrometer.
3 Results and discussion
3.1 Thermal stability and phase transformations of the gels
All gels prepared at room temperature were transparent and monolithic. A wide gel formation region was determined consisting of several subregions depending on the gelation time of the compositions (Fig. 1). As one can see, the gel formation region is expanded toward ZnO corner and the obtained gels are situated between 20 and 100 mol % TiO2, up to 65 mol % TeO2 and 90 mol % ZnO. The first gelation region (A) comprises samples for which the gelation occurred immediately after mixing of the components. For the other two regions (B and C) this process took longer time, from hours and days to one month, respectively. In the binary ZnO-TeO2 system, gels were not obtained using H6TeO6 and Zn acetate as a combination of precursors. Table 1 shows all investigated compositions in the TiO2-TeO2-ZnO system.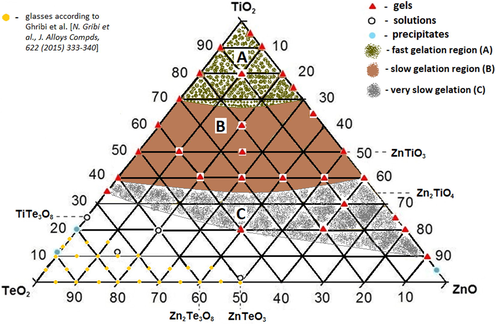
Gel formation region in the ternary TiO2-TeO2-ZnO system.
№
Samples abbreviation
Compositions
Gelation time
1.
TTZ1
20TiO2.40TeO2.40ZnO
3 months
2.
TTZ7
20TiO2.20TeO2.60ZnO
6 months
3.
TTZ2
40TiO2.30TeO2.30ZnO
1 day
4.
TTZ6
40TiO2.40TeO2.20ZnO
1 day
5.
TTZ8
40TiO2.10TeO2.50ZnO
4 h
6.
TTZ3
50TiO2.25TeO2.25ZnO
3 h
7.
TTZ9
50TiO2.40TeO2.10ZnO
2 h
8.
TTZ4
60TiO2.20TeO2.20ZnO
<1 h
9.
TTZ5
80TiO2.10TeO2.10ZnO
Immediately
The thermal decomposition data in air of selected gels for which the time for gelation was different are summarized in Table 2. Generally, several decomposition steps were observed and bearing in mind the similarity of the DTA/TG curves of the samples, only two selected gels TTZ1 and TTZ5 are presented (Fig. 2a, b). As is seen from the figure some peaks are well evident for both samples. For the interpretation of these results, DTA data for pure Ti (IV) n-butoxide and Zn acetate precursor discussed in the literature (Velasco et al., 1999; Yordanov et al., 2017; Arii and Kishi, 2003; McAdie, 1966) have been kept in mind. As is seen from Fig. 2 both gels are characterized by endothermic peaks in the range 100–200 °C with weight loss between 8 and 18% depending on composition. The mass loss is mainly related to the local elimination of water bonded with the surface of the materials as well as to the evaporation of organic solvent. Looking at the DTA/TG curves, several exothermic peaks are observed in the range 220–440 °C. The first one is observed about at 230 and at 300 °C for gels TTZ1 and TTZ2, respectively. The observed peak is sharper and more intensive for the sample containing the higher TeO2 amount (above 40 mol %, gels TTZ1 and TTZ3) and it could be related to the intense decomposition of both Ti(IV) butoxide and Zn acetate. Obviously, in the sample containing the higher TiO2 amount (TTZ2) the combustion of organics occurred at a higher temperature (300 °C). In both cases this peak is accompanied by a strong weight loss about 20% which according to the TG curve finished at nearly 450 °C. The next exothermic peak is registered at a higher temperature of about 440 °C in both samples. The last small exothermic effect at 440 °C and it’s presence in gel TTZ1 could be related to the oxidation of Te to TeO2 but in the other sample TTZ2 it could be attributed to the crystallization of TiO2 (anatase). Additionally, that peak is accompanied by a very low weight loss (2%) but the calculated total weight loss for the selected samples is about 40%.
–
Sample abbrev.
Compositions/gelation time
DTA results
Endothermic effect, °C
Exothermic effect, °C
Endo1
Endo2
Exo1
Exo2
Exo3
1.
TTZ1
20TiO2.40TeO2.40ZnO/3 months
115
–
226
–
440
2.
TTZ5
80TiO2.10TeO2.10ZnO /immed
120
210
–
300
440
3.
TTZ6
40TiO2.40TeO2.20ZnO/1 day
115
170
230
300
440
4.
TTZ8
40TiO2.10TeO2.50ZnO/4h
120
175
315
–
–
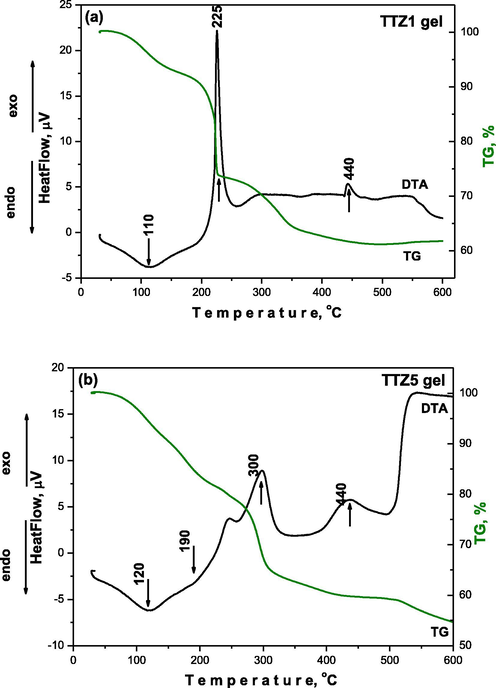
DTA/TG curves of two representative gels: (a) TTZ1 and (b) TTZ5.
X-ray diffraction (XRD) patterns of as-prepared ternary gels with different nominal compositions are shown in Fig. 3a and it is evident that they are amorphous. The investigated samples contain a different TiO2 amount aiming to verify it’s role in the formation of the amorphous network as well as in the phase formation with variation of temperature. As is seen from the figure the samples exhibit different behavior depending on the temperature (Fig. 3b). The XRD patterns of samples obtained below 200 °C are complicated due to the presence of organics and formation of intermediate metal-organic complexes, which are not considered in this paper. Generally, in the temperature range 200–400 °C composite materials containing an amorphous phase and different crystalline phases {metallic Te (JCPDS 78-2312), α-TeO2 (JCPDS 42-1365), anatase (JCPDS 78-2486)} are prepared. In contrast to the samples TTZ5, TTZ3 and TTZ2 where at 400 °C TiO2 (anatase) or α-TeO2 were observed, in the last sample TTZ1 only metallic tellurium has been found. Despite the low TiO2 content in the later sample, the amorphous state is more stable due to presence of higher amount of both TeO2 and ZnO (40 mol %). The oxidation of tellurium starts at about 400 °C and it is fully oxidized to TeO2 about 500 °C (samples TTZ1 and TTZ2). In the samples TTZ3 and TTZ5, anatase appears at 400 °C and a small amount is converted to rutile at 500 °C, while in the other two samples, anatase did not appeared in the XRD patterns. The average crystallite size (calculated using Sherrer’s equation) of TiO2 (anatase) in the powdered sample TTZ5 is about 10 nm (Fig. 3b) at 400 °C. At higher temperatures (500–700 °C) only crystalline phases (TiO2 – rutile, α-TeO2 and ZnTeO3) were found depending on the composition of the prepared composite materials (Fig. 3b). These investigations are upheld by the previous ones where TiO2/TeO2/ZnO composite powders containing constant TiO2 amount (40 mol%) have been prepared (Gegova et al., 2015).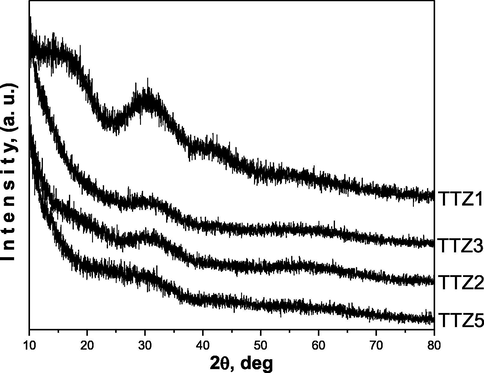
XRD patterns of the as prepared gels.
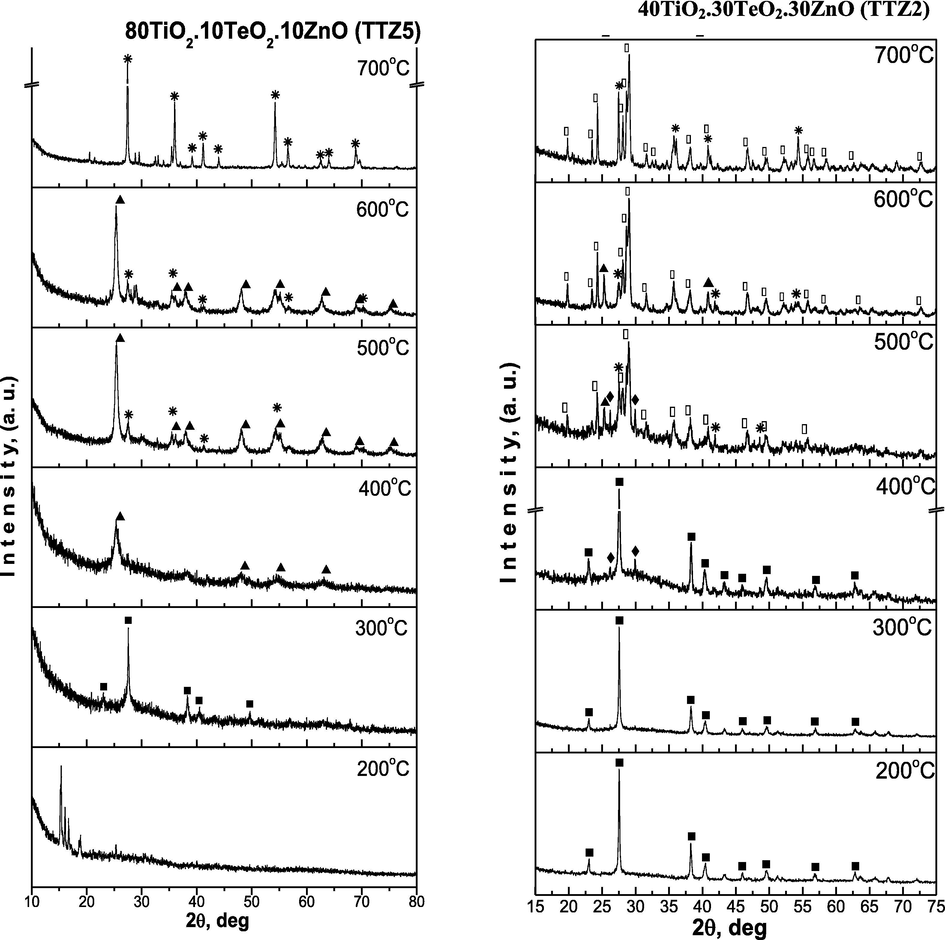
XRD patterns of the investigated samples: (■) Te, (♦) α-TeO2, (▴) TiO2-anatase, (
 ) TiO2-rutile, (○) ZnTeO3.
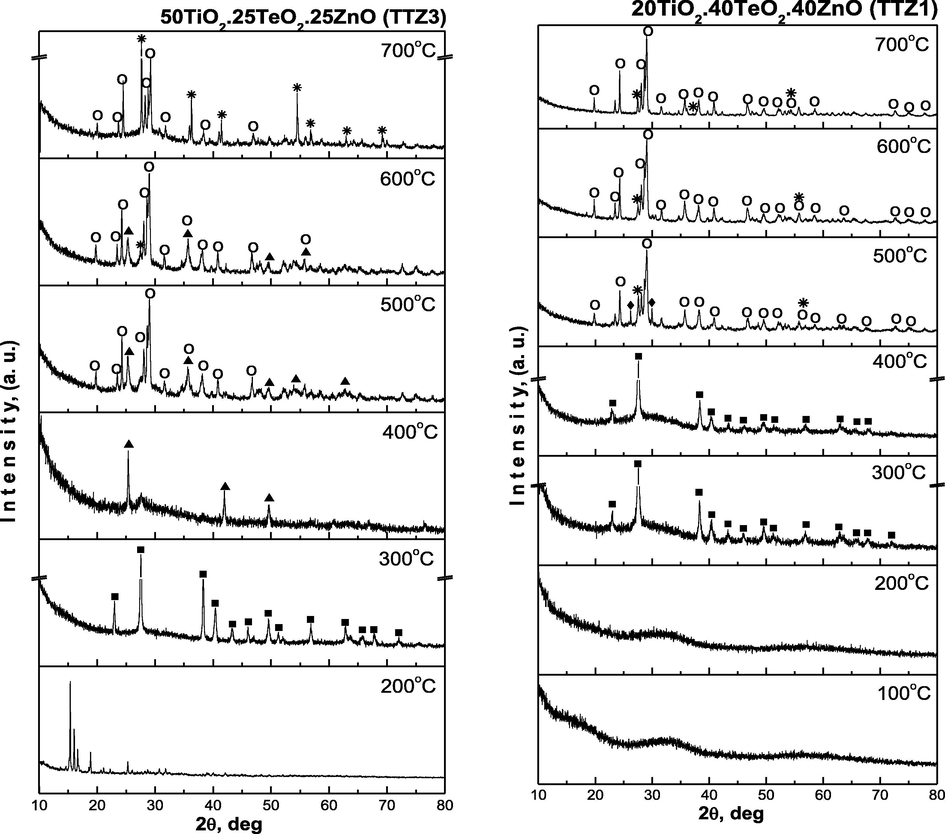
XRD patterns of the investigated samples: (■) Te, (♦) α-TeO2, (▴) TiO2-anatase, (
) TiO2-rutile, (○) ZnTeO3.
3.2 Optical properties and structural transformations
The diffuse reflectance absorption spectra of representative gels (aged at room temperature) as well as of pure Ti butoxide gel are illustrated in Fig. 4. The observed absorption edges and calculated optical band gap values are pointed out in Table 3. It is evident that the TTZ5 gel containing higher TiO2 content (80 mol%) exhibited the highest absorption in the UV region in comparison to the other ternary gels as well as pure Ti(IV) butoxide gel. Another peculiarity is the appearance of two absorption bands below and above 300 nm, the so called charge transfer bands. The optical properties of various ternary gels from the systems TiO2-TeO2-B2O3 and TiO2-TeO2-SeO2 were discussed in our previous papers (Iordanova et al., 2015, 2016). By analogy it could be accepted that for the isolated TiO4 units, the ligand to metal charge transfer band is in the region 200–260 nm, while in a titania network (anatase) the charge transfer in TiO6 is above 300 nm (Singh and Singh, 2001; Clarck, 1968; Klein et al., 1996). As is known the unhydrolyzed Ti butoxide consists mainly of TiO4 groups as main building units but after polymerization the coordination geometry changed to TiO6 as a result of formation of Ti-O-Ti links between TiO6 units (Klein et al., 1996). As can be seen from the figure, for gels TTZ5, TTZ3 and TTZ2 the more intensive absorption peak is that about 300–320 nm which is associated with an increase of the polymerization degree of Ti atoms in comparison to pure Ti butoxide gel. The UV–Vis spectrum of TTZ1 gel differs from the other ternary ones and pure Ti(IV) butoxide. One of the reasons could be that the lowest TiO2 content (20 mol%) is not sufficient for the fast formation of the amorphous network and resulted in a very slow gelation of that sample. On the other hand, the charge transfer of O → Ti is in the range 260–300 nm but it is known that the exciton absorption peak of bulk ZnO exists in the same region (300–360 nm, Eg ∼ 3.24 eV) (Bahnemann et al., 1987). Due to the overlapping of these absorption bands it is difficult to obtain more precise information for the influence of ZnO on the polymerization ability of Ti. The absorption edge of the investigated gels varies from 330 nm to 364 mm and the increase in TiO2 content caused a red shifting of the cut-off (Table 3). Among the ternary gels the TTZ5 (80 mol% TiO2) one exhibited the highest cut-off value 363.82 nm. Several authors (Kabalci et al., 2011; Ghribi et al., 2015) claimed that TiO2/TeO2/ZnO glasses (containing up to 35 mol % ZnO) exhibited an optical band gap value of about 2.94–3.00 eV. Our values for the investigated gels are higher (3.41–3.75 eV) than in the literature (Niu et al., 2018) for pure TiO2 (3.2 eV) and ZnO (3.37 eV) but lower than the value of melted bulk tellurite glass (∼3.79 eV). Obviously, the Eg of the obtained products is influenced by the simultaneous presence of TiO2, TeO2 and ZnO.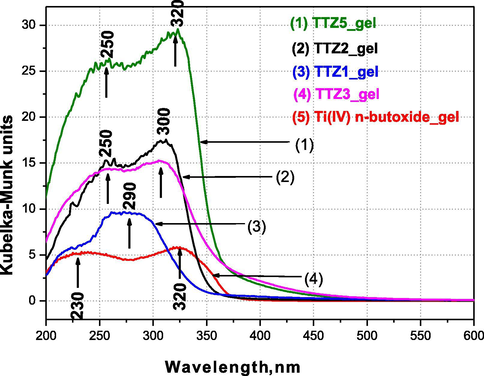
UV–Vis spectra of selected ternary TiO2/TeO2/ZnO gels compared to pure Ti(IV) n-butoxide gel.
–
Sample abbrev.
Compositions
Cut-off, nm
Eg, eV
1.
Ti(IV) n-butoxide gel
–
389.71
3.18
2.
TTZ5
80TiO2.10TeO2.10ZnO
363.82
3.41
3.
TTZ3
50TiO2.25TeO2.25ZnO
363.04
3.42
4.
TTZ2
40TiO2.30TeO2.30ZnO
348.90
3.55
5.
TTZ1
20TiO2.40TeO2.40ZnO
329.95
3.75
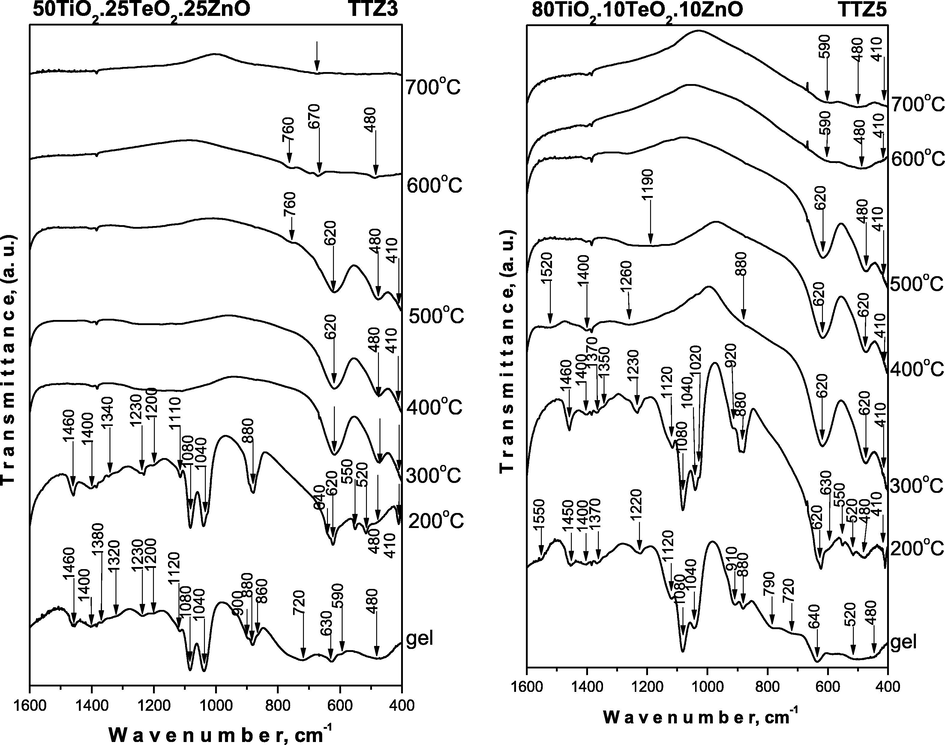
The IR spectroscopy was used for verifying the phase transformations during the heat treatment (in the temperature range 200–700 °C) as well as to evaluate the completeness of the hydrolysis – condensation reaction (Fig. 5). The assignments of the vibrational bands of the separate structural units are made on the basis of well-known spectral data of the precursors (Ti(IV) n-butoxide, H6TeO6 and Zn acetate – Fig. SI.1) and crystalline phases existing in the system (Iordanova et al., 2013, 2015, 2016; Yordanov et al., 2017). The measured by us spectra of the precursors were used only as supporting information. These spectra have been discussed in details elsewhere (Iordanova et al., 2016; Gegova et al., 2015a, 2015b).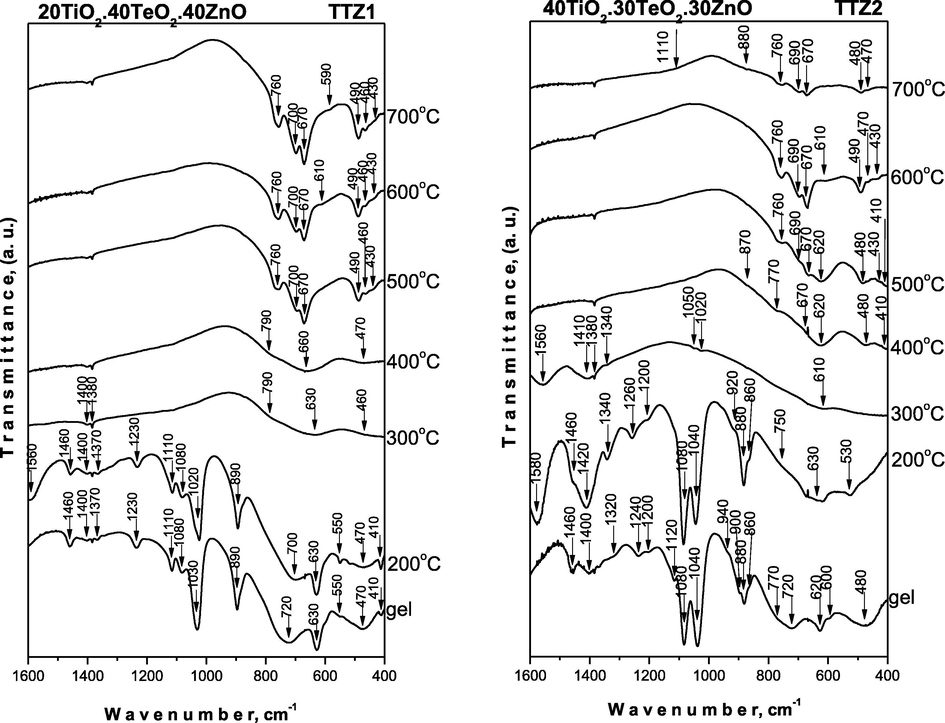
IR spectra of the representative samples heat treated in the range 200–700 °C.
IR spectra of the representative samples heat treated in the range 200–700 °C.
For evaluation of the completeness of the hydrolysis-condensation reactions, it is necessary to follow the changes of several bands in the range 1400–1000 cm−1 (Iordanova et al., 2016; Gegova et al., 2015a, 2015b). Moreover, it is known that the band at 1130 cm−1 is characteristic for the stretching vibrations of Ti—O—C (Iordanova et al., 2016), while those at 1100 and 1040 cm−1 are assigned to the vibrations of terminal and bridging C—O bonds in butoxy ligands (Iordanova et al., 2016). On the other hand, ethylene glycol possesses asymmetric and symmetric stretching vibrations of C—O bonds in CH2—OH group at 1090 and 1040 cm−1, while in the spectrum of butanol they appeared at 1110, 1050 cm−1 along with a very intensive band at 1070 cm−1 (Iordanova et al., 2016).
As it is seen from Fig. 5, the IR spectra of all gels and heat treated at 200 °C samples are very similar and they are characterized with very intensive bands in the 1120–1040 cm−1 region. The comparison between the IR spectra of the investigated gels showed differences regarding the intensity of the bands at 1080 and 1040–1030 cm−1 which could be related mainly to the C—O bonds in CH2—OH group. The band at 1040–1030 cm−1 is stronger in the spectra of TTZ1, TTZ2 and TTZ3 gels, while in TTZ5 this band exhibited lower intensity. Additionally, the other band at 1080 cm−1 possesses lowest intensity only in the IR spectrum of TTZ1 gel. Considering the experimental facts obtained, it could be suggested that a greater degree of hydrolysis and condensation processes is achieved in TTZ5, TTZ3 and TTZ2 samples containing 80, 50 and 40 mol% TiO2, respectively. Thus, despite the higher ZnO content (40 mol%), the lower amount of TiO2 (20 mol%) is not enough to complete these processes in TTZ1 gel. The band at 1120–110 cm−1 could be ascribed to Ti—O—C bonds and it has to be noted that this band did not change it’s intensity.
The other intensive band is at 890–880 cm−1 which is assigned to C—O or C—H stretching vibrations of the residual solvent ethylene glycol (Iordanova et al., 2016; Gegova et al., 2015a, 2015b; Zubkova and Shabadash, 1971; Kato et al., 1996). The bands located in the range of 1500–1300 cm−1 are assigned to the bending vibrations of CH3 and CH2 organic groups. Additionally, bands below 900 cm−1 which are typical for the inorganic units were registered as well up to 200 °C. Accordingly, we can suggest that at lower temperatures (200 °C) the amorphous phases consist both of organic and inorganic building units. The bands decreased with increasing the temperature but are still observed up to 300 °C then completely disappeared about 400 °C. This means that the hydrolysis-condensation processes are not completed at room temperature and continue in a wide temperature range along with the decomposition of the organic groups (Hayakawa et al., 2012). All bands above 1000 cm−1, characteristic for the organic groups are not visible above 300 °C and the spectra in the temperature range 300–500 °C are characterized mainly with bands below 900 cm−1. These bands have low intensity and are also broadened which are a peculiarity of the disordered systems. The obtained IR results give us a reason to suggest that the amorphous phase in the temperature range 400–700 °C consists only of inorganic building units: TeO4 (780–770 cm−1; 630–620 cm−1), TiO6 and ZnO4 (630–620 cm−1, 480 cm−1, 410 cm−1) (Murashkevich et al., 2008; Yurchenko et al., 1981; Yamaguchi et al., 1987; Shabalin, 1982; Mancheva et al., 2011; Andres-Verges and Martinez – Gailego, 1992; Dimitriev et al., 2009). As it has been mentioned above at this temperature range only crystalline phases TiO2 – rutile, α-TeO2 and ZnTeO3 were detected in the prepared composite materials (Figs. 3). It has to be noted that it is difficult to distinguish the vibrations of TiO6 and ZnO4 structural units due to their strong overlapping. In the IR spectra above 400 °C, vibrations were found which are characteristic of the inorganic structural units building up the crystalline phases (TeO2, TiO2 (anatase), TiO2 (rutile) and ZnTiO3. The obtained IR spectra proved the phase transition established by XRD (Figs. 3). Based on the IR results it is difficult to generalize which is the better network former TiO2, TeO2 or ZnO. Obviously, under the experimental conditions provided and the combination of precursors used in this study, the amorphous network is influenced by the simultaneous presence of all oxides. On the other hand, bearing in mind the peculiarity of the IR spectra of the TTZ1 gel and the lower intensity of the bands at 1110, 1080 and 1030 cm−1 it could be suggested that TiO2 behaves as a better non-traditional amorphous network former.
The chemical states of the main elements (C, Ti, Te and Zn) were determined by X-ray photoelectron spectroscopy (XPS) (Figs. 6–11) of selected gels containing different TiO2 amount. The concentrations of the observed chemical elements and the binding energies of their different valence states are listed in Table 4.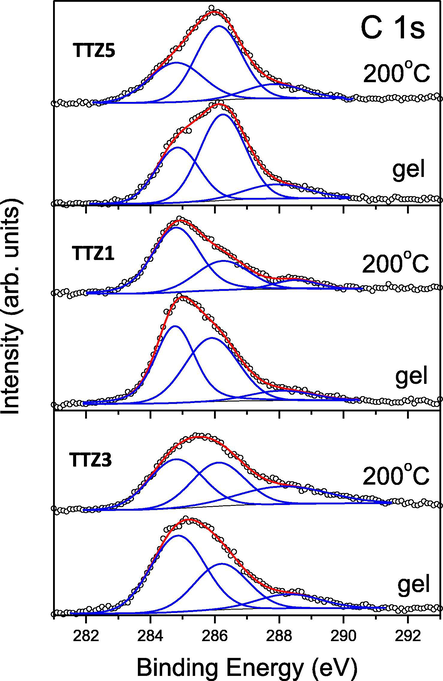
C 1s-photoelectron region of the studied B samples. The peak contributions to the C 1s peak structure and the sum of deconvolution peaks are marked in blue and red, respectively.
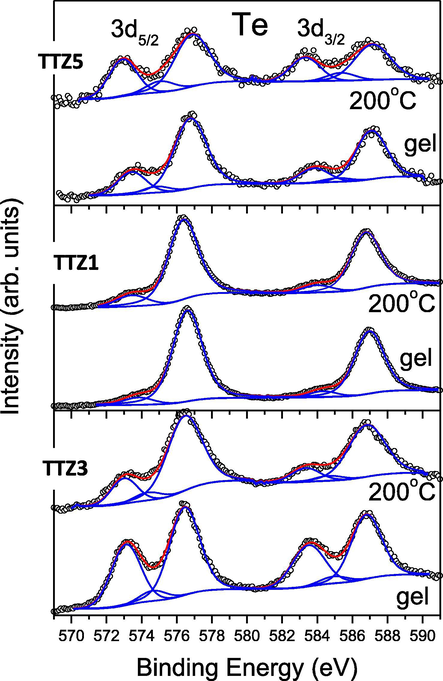
Te 3d-photoelectron region of the studied gel and annealed B samples. The peak contributions to the Te 3d doublet and the sum of deconvolution peaks are marked in blue and red, respectively.
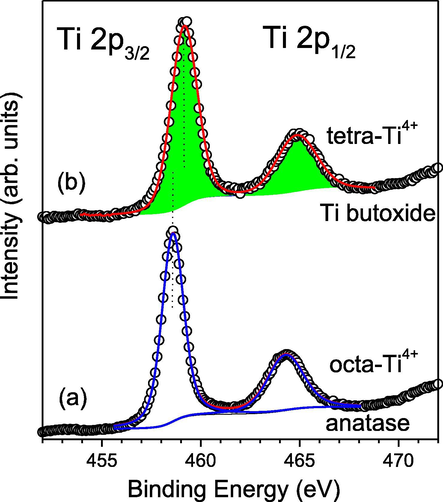
Ti 2p spectral regions of (a) anatase and (b) Ti butoxide. The curves in blue are the fit peak contributions and their sum is marked in red.
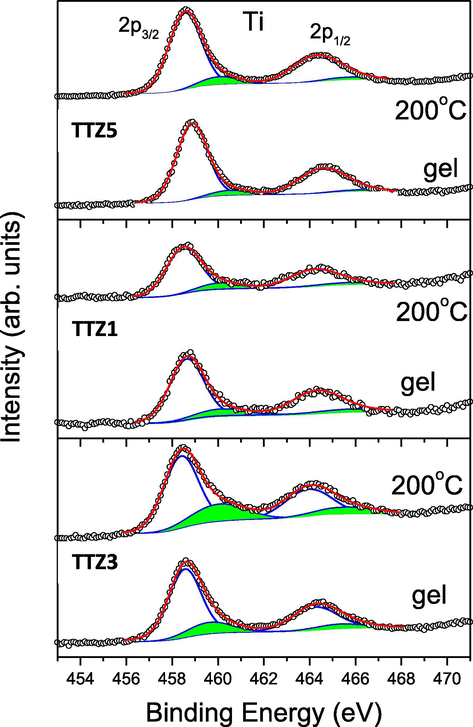
Ti 2p-photoelectron region of the studied gel and annealed B samples. The peak contributions to the Ti 2p doublet and the sum of deconvolution peaks are marked in blue and red, respectively. The peaks, colored in green, correspond to the contributions of tetrahedral coordinated Ti4+ ions.
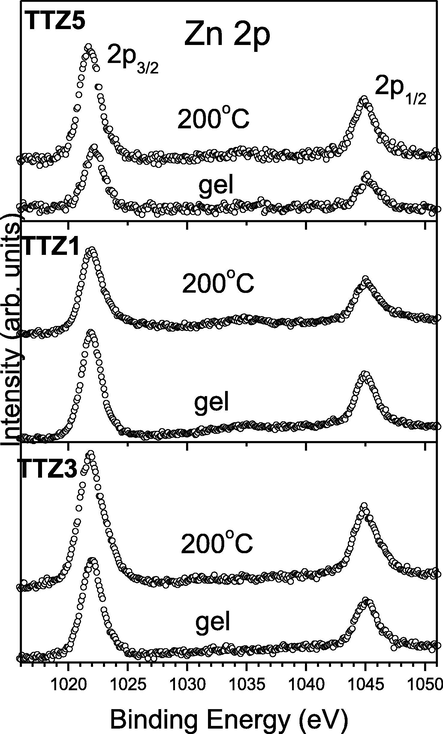
Zn 2p-photoelectron region of the studied gels and annealed at 200 °C samples.
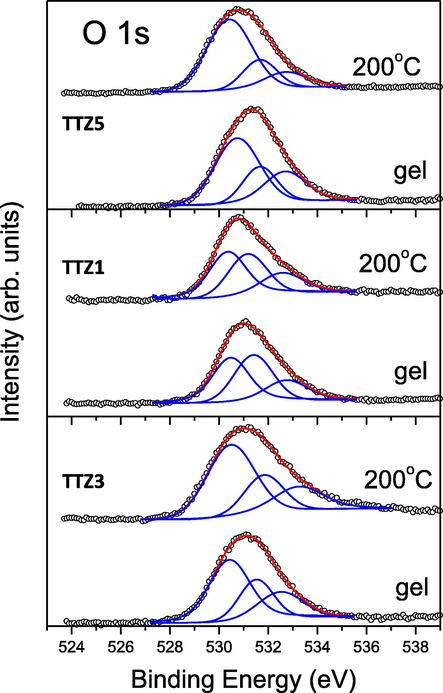
O 1s spectra, measured for the studied samples. The peak contributions and their sum are marked in blue and red, respectively.
Sample
C/C 1 s
O/O 1 s
Ti/Ti 2p3/2
Te/Te 3d5/2
Zn/Zn 2p
(Ti + Zn)/Te
TTZ3 (gel)
at.%
48.8
36.3
6.8
4.1
4.0
2.6
B.E (eV)
284.8
286.2
288.3530.4
531.5
532.5458.6
459.6573.1
574.7
576.41022.0
TTZ3 (200 °C)
at.%
43.5
40.1
7.7
2.9
5.8
4.6
B.E (eV)
284.8
286.1
288.1530.5
531.7
533.1458.4
460.0572.8
574.4
576.41021.9
TTZ1 (gel)
at.%
48.2
35.4
2.9
7.5
6.0
1.2
B.E (eV)
284.8
285.9
288.1530.5
531.4
532.7458.6
460.1573.8
576.61021.9
TTZ1 (200 °C)
at.%
43.8
37.9
3.3
8.5
6.5
1.1
B.E (eV)
284.8
286.2
288.5530.4
531.4
532.6458.5
460.1573.4
576.41022.0
TTZ5 (gel)
at.%
47.3
40.6
9.1
1.7
1.3
6.2
B.E (eV)
284.8
286.2
287.9530.6
531.6
532.7458.8
460.5573.4
574.9
576.81022.1
TTZ5 (200 °C)
at.%
39.0
45.7
11.7
1.2
2.4
11.8
B.E (eV)
284.8
286.1
287.8530.4
531.6
532.7458.6
460.1572.9
575.1
576.91021.8
For all samples studied, the C1s spectral regions show broad features which indicate the presence of organic components in the gels as well as in the samples annealed at 200 °C (Fig. 6). These spectra can be fitted with three peak contributions. The first component at 284.8 eV is ascribed to C—C and C—H bonds (Lu et al., 2013), while the second contribution at 285.9–286.2 eV can be attributed to C—OH bonds (Ohtsu et al., 2009; Zhong et al., 2010). The high binding – energy component at 287.8–288.5 eV can be related to —O—C bonds to the metal ions, for example Ti—O—C, which presence is an indication for the uncompleted hydrolysis at these experimental conditions (Dai et al., 2013; Ren et al., 2007; Stankovich et al., 2007). As can be seen from Table 4, the concentration of carbon atoms is highest relative to the other chemical elements found in the samples. For gels, it varies in the range of 47.3–48.8 at%. When heated to 200 °C, the carbon concentration decreases slightly to 39.0–43.8 at%. However, within each sample, the concentration ratio of the three carbon – containing species (suggested above) remains insignificantly changed.
Similarly, the Te 3d spectral regions also exhibit complex peak structures which can be fitted with several chemically shifted spin-orbital 3d5/2 and 3d3/2 doublets (Fig. 7). The chemical shifts between their binding-energy positions imply the presence of several valence states of tellurium atoms in the surface layers of the samples. For their identification the XPS spectrum of the H6TeO6 has been used (Gegova et al., 2015). It was already found that in H6TeO6 the tellurium has 6+ valence state (octahedral coordinated) and the Te 3d5/2 binding energy has been measured at 577.4 eV. In all samples a high binding-energy peak contribution in the range of 576.4–576.9 eV is observed which can be attributed to Te6+ ions in octahedral chemical environment (gels and annealed samples) (Fig. 7). As is seen the intensity of the characteristic for the Te6+ peak did not decrease in the heated samples (Fig. 7), which probably is proof of the higher stability of the amorphous state and the decomposition of the orthotelluric acid (H6TeO6) is postponed (Remy, 1963). For the TTZ3 and TTZ5 sample a relatively intense second peak with maximum at 572.8–573.4 eV is observed which could be associated with the presence of Te2+ ions on the sample surfaces (Häggblad et al., 2008) and/or of metallic tellurium (Te0) (Chang et al., 2014). As can be seen from Fig. 7, tellurium atoms in these two valence states exist not only in gels but also in the annealed samples. While it can be argued for the TTZ3 sample that heating to 200 °C causes a decrease in their concentration, in TTZ5 the reverse trend-increase may be observed (Fig. 7). Significantly lower concentrations of Te0/Te2+ valence states are observed for the TTZ1 sample compared to that of Te6+.
In order to obtain optimal deconvolutions of the Te 3d spectra of TTZ3 and TTZ5 samples, a peak contribution with binding energy in the range of 574.4–575.1 eV (Fig. 7) must be allowed. According to our previous studies of Te - containing systems (Bachvarova-Nedelcheva et al., 2014), this contribution may be due to the existence of Te3+ valence state.
The XPS spectra of investigated by us gels and annealed samples show Ti 2p3/2 peaks in the range of 458.5–458.9 eV (Fig. 8). It should be noted that these values are located between the Ti 2p3/2 binding energies characteristic for anatase and Ti butoxide, where the Ti4+ ions are octa- and tetrahedral coordinated, respectively. For anatase, containing TiO6 structural units, we measured Ti 2p3/2 binding energy at 458.6 eV (Iordanova et al., 2016; Sachse et al., 2015) which is lower than those of pure Ti butoxide (gel and annealed at 200 °C) (459.1 eV). Fig. 8 shows the corresponding Ti 2p spectral regions for both pure compounds. As can be seen, the spectra can be very well fitted with two pairs of Ti 2p doublets with spin-orbital splitting of 5.7 eV and two times higher 2p3/2 peak area than that of the 2p1/2 peak, according to the electron population of both core levels. The results show that for homogeneous substances (anatase and Ti butoxide) the Ti 2p3/2 binding-energies differ modestly by 0.5 eV. However, unlike anatase, the Ti 2p3/2 the binding energy of tetrahedral coordinated Ti4+ varies greatly with decrease of it’s relative concentration reaching high values of 460.5 eV (at below 1 at%) (Sachse et al., 2015). These considerations are very useful in analyzing the Ti 2p regions of the gels we studied (Fig. 9). The wide and somewhat asymmetrical peaks can be very well fitted with two pairs of Ti 2p3/2+1/2 doublets. The highly intense Ti 2p doublet has a 2p3/2 binding-energy of 458.4–458.6 eV, indicating that octahedrally coordinated Ti4+ ions predominate. The low intense Ti 2p doublet (colored in green) with a 2p3/2 binding-energies in the range of 459.6–460.5 eV corresponds to tetrahedral coordinated Ti4+ ions. According to the above considerations, these high binding-energies indicate that the concentrations of TiO4 units containing tetrahedral coordinated Ti4+ are isolated or form very small clusters. Indeed, the relative areas of the Ti 2p doublets allow one to estimate the concentrations of tetrahedral Ti4+ ions in the gels and they are in the range of 0.4–1.2 at %. Annealing at 200 °C leads to the increase of the total amount of Ti which is valid for both types of octa- and tetrahedral coordinated Ti4+ ions. These results sit well with the data discussed above, obtained by UV–Vis spectroscopy.
As a summary of the Ti 2p considerations it can be concluded that the studied samples contain predominantly TiO6 units. This can be as a result of a higher degree of polycondensation as suggested by Barlier et al. (2008) studying various Ti alkoxides. The authors related the slight shifting toward higher binding energies with uncompleted condensation reactions. In the present study our analysis suggests that the Ti 2p binding-energy shift to higher energies is due to the presence of isolated TiO4 units (or their small clusters) containing tetrahedral coordinated Ti4+ ions. Uncompleted condensation was another suggestion by us for the annealed binary 80TiO2.20SeO2 and 80TiO2.20TeO2 compositions (Iordanova et al., 2016).
The Zn 2p photoelectron regions are characterized by single 2p3/2 and 2p1/2 peaks [Fig. 10]. The binding energy (BE) of Zn 2p3/2 core – level is found in the region of 1021.9 ± 0.2 eV. It is worth to be mentioned that this value corresponds well to the binding energy of the Zn 2p3/2 core-level electrons in pure and Al,N co-doped ZnO films (Gao et al., 2013; Levtushenko et al., 2017). In order to determine the Zn valence state, an Auger Zn LMM region has been also measured. For all samples the kinetic energies (KE) of this Auger peak has been found to be 988.3 ± 0.2 eV which gives a modified Auger parameter of 2010.2 eV (defines as a sum of BE of Zn 2p3/2 and KE of Zn LMM Auger peak (Wagner et al., 1979). This value is characteristic for the Zn2+ valence state (Biesinger et al., 2010).
In the O 1s spectral regions of all samples, a wide asymmetric peak between 529 and 534 eV is observed, indicating the presence of oxygen atoms involved in different chemical bonds (Fig. 11). The lack of clear features of these peaks makes their deconvolutions difficult and respectively, the identification of various chemical bonds involving oxygen. One possible way out is to use the location of the O 1s peaks of appropriate standards. The Te 3d5/2-, Ti 2p3/2- and Zn 2p3/2- spectral regions discussed above (Figs. 7, 9, 10 and Table 2) indicate that the appropriate standards are anatase (standard for Ti4+), H6TeO6 (standard for Te6+), and ZnO (standard for Zn2+). However, these substances are insulators and are charged due to the electron photoemission in the XPS experiments, and therefore the absolute value of the O 1s binding – energy depends on the energy calibration. This problem is avoided, as Perez-Gonzales and Tomas proposed (Perez-Gonzales and Tomas, in press), if a relative difference Δ between the binding energies of the most intense photoelectron peaks and the O 1s energy is used. For our study these differences are: Δ(Te 3d5/2-O 1s) = 577.4–532.2 = 45.2 eV for the Te—O—H bonds (Iordanova et al., 2016), Δ(Te 3d5/2-O 1s) = 576.8–531.3 = 45.5 eV for Te—O—Te bonds (Bachvarova-Nedelcheva et al., 2014), Δ(Ti 2p3/2-O 1s) = 458.6–529.8 = −71.8 eV for the Ti—O—Ti bonds (Sachse et al., 2015) and Δ(Zn 2p3/2-O 1s) = 492.1 eV for ZnO (Perez-Gonzales and Tomas, in press).
In Fig. 11 the O 1s spectra as well as their deconvolutions of the gels and the heated samples are presented. These spectra can only be fitted with peak contributions with binding energies exceeding 530 eV. According to the research of Mekki et al. (2005); this is an indication of the existence of bridging oxygen bonds, for example Me—O—Me (Me = Te, Ti, Zn). In agreement with our considerations above, only the Te—O—Te bonds have clearly different binding energies at about 531.3 eV, while the Ti—O—Ti and Zn—O—Zn have similar energies close to 530 eV. The adsorbed OH groups are expected to contribute to the highest binding-energy peak, above 532 eV.
Indeed, according to these assumptions the O 1s spectra are well fitted with three peak contributions (Fig. 11). As can be seen from the figure, a broad and intense contribution exists at about 530.4–530 6 eV, which could be related to bridging oxygen bonds involving Ti and Zn. This assumption is also confirmed by the total concentrations of Ti and Zn (Table 4) relative to that of Zn in the various samples. Their ratio is in keeping with the relative peak area at 530.4–530.6 eV relative to the contribution area at about 531.4–531.7 eV, which we attribute to the Te—O—Te bridge connection. The peak contribution with the highest binding energy of about 532.5–533.0 eV is associated with the presence of adsorbed OH groups on the sample surface.
Considering the XPS results, especially for Te 3d (Fig. 7), O 1s and Table 4, one can see their similarity for the TTZ3 and TTZ5 samples, for which the ratio of the total concentration of Ti and Zn relative to that of Te is significantly more than 1. For the TTZ1 sample this ratio is almost 1 (Table 4). Completing the results of XPS analysis, it should be noted that the photoelectron spectroscopy is a surface-sensitive method, and therefore its results apply to the surface layers of samples with a thickness of about 6–8 nm.
4 Conclusions
The gel formation tendency in the ternary TeO2-TiO2-ZnO system has been verified and refined in a larger concentration range. A simple route for obtaining of complex homogeneous gels was offered using the new combination of organic and inorganic precursors. Gel derived nanocomposite materials consisting of amorphous and different crystalline phases: TiO2 (anatase), TiO2 (rutile) and ZnTeO3 were obtained depending on composition. Organic and OH groups participate in the amorphous organic–inorganic structure up to 300 °C approximately. According to the IR spectra, the main building units of inorganic amorphous phase are TiO6, ZnO4 and TeO4. It was established by UV–Vis spectroscopy that the absorption edge of the gels varies from 330 nm to 364 mm and the increase in TiO2 content caused a red shifting of the cut-off. Using XPS it was found that tellurium atoms exist in several chemical states Te2+, Te0 but the valence Te6+ is dominant. The samples containing higher TiO2 content (50 and 80 mol%) exhibited a comparable amount of Te2+ and Te0. However, octahedrally coordinated Ti4+ ions are observed in the gels and in the annealed at 200 °C samples but the detected small amount of tetrahedrally coordinated Ti4+ are responsible for the incomplete polymerization of TiO6 units. The O 1s spectra reveals the formation of bridging oxygen bonds involving Ti, Te and Zn. Obviously, under the experimental conditions provided and the combination of precursors used in this study, the amorphous network is influenced by the simultaneous presence of all oxides.
Declaration of Competing Interest
The authors declare that they have no known competing financial interests or personal relationships that could have appeared to influence the work reported in this paper.
References
- Physical and optical properties of zinc arsenic tellurite glasses. Res. Phys.. 2012;2:175-181.
- [CrossRef] [Google Scholar]
- Spherical and rod-like zinc oxide microcrystals: morphological characterization and microstructural evolution with temperature. J. Mater. Sci.. 1992;27:3756-3762.
- [CrossRef] [Google Scholar]
- Synthesis, growth mechanism, optical properties and catalytic activity of ZnO microcrystals obtained via hydrothermal processing. RSC Adv.. 2017;7:24263-24281.
- [CrossRef] [Google Scholar]
- The effect of humidity on thermal process of zinc acetate. Thermochim. Acta. 2003;400:175-185.
- [CrossRef] [Google Scholar]
- Infrared-spectral investigation of tellurites. Mater. Res. Bull.. 1982;17:1121-1129.
- [CrossRef] [Google Scholar]
- Nanostructural evolution of titania-based materials using modified titanium precursors. J. Am. Ceram. Soc.. 2009;92:2109.
- [CrossRef] [Google Scholar]
- Sol-gel synthesis of Se and Te containing TiO2 nanocomposites with photocatalytic and antibacterial properties. J. Optoel. Adv. Mater.. 2016;18(1–2):5-9.
- [Google Scholar]
- Synthesis, characterization and optical properties of non-traditional tellurite-selenite glasses. Opt. Mater.. 2014;36:1319-1328.
- [CrossRef] [Google Scholar]
- Preparation and characterization of quantum size zinc oxide: a detailed spectroscopic study. J. Phys. Chem. 1987;91:3789-3798.
- [CrossRef] [Google Scholar]
- Hydrolysis–condensation reactions of titanium alkoxides in thin films: a study of the steric hindrance effect by X-ray photoelectron spectroscopy. Appl. Surf. Sci.. 2008;254:5408-5412.
- [CrossRef] [Google Scholar]
- Resolving surface chemical states in XPS analysis of first row transition metals, oxides and hydroxides: Sc, Ti, V, Cu and Zn. Appl. Surf. Sci.. 2010;257:887-898.
- [CrossRef] [Google Scholar]
- Sol-gel Science: the Physics and Chemistry of Sol-gel Processing. San Diego, CA: Academic Press Inc; 1990.
- Glass formation, properties and structure of glasses in the TeO2-ZnO system. J. Non-Cryst. Sol.. 1992;151:134-142.
- [CrossRef] [Google Scholar]
- Photoinduced reactivity of titanium dioxide. Prog. Solid State Chem.. 2004;32(1–2):33-177.
- [CrossRef] [Google Scholar]
- Smart assembling of multi-scaled functional interfaces in thermoelectric Ga2Te3/Te hetero-nanocomposites. Nanoscale 2014
- [CrossRef] [Google Scholar]
- Chemistry of Titanium and Vanadium. Amsterdam: Elsevier; 1968.
- A simple preparation of carbon and nitrogen co-doped nanoscaled TiO2 with exposed 001 facets for enhanced visible-light photocatalytic activity. J. Mol. Catal. A, Chem.. 2013;368–369:38-42.
- [CrossRef] [Google Scholar]
- History of sol-gel science and technology. J. Univ. Chem. Techn. Metall.. 2008;43(2):181-192.
- [Google Scholar]
- Synthesis of submicron powders of ZnO and ZnO – MnOm (MnOm=TiO2, V2O5) by sol – gel methods. J. Univ. Chem. Tech. Metall.. 2009;44(3):235-242.
- [Google Scholar]
- Raman spectroscopic investigations of the effect of the doping metal on the structure of binary tellurium-oxide glasses. J. Non-Cryst. Sol.. 1997;220:169-177.
- [CrossRef] [Google Scholar]
- Fabrication of Si1-xGex alloy on silicon by Ge-Ion-implantation and short-time-annealing. Phys. Pol. A. 2013;123(5):858-861.
- [Google Scholar]
- Synthesis, structure and properties of TiO2-TeO2-MnOm (M= Zn, B) gels: a comparison. J. Chem. Technol. Metall.. 2015;50(4):449-458.
- [Google Scholar]
- Synthesis and crystallization of gels in the TiO2-TeO2-ZnO system. Bulg. Chem. Commun.. 2015;47(1):378-386.
- [Google Scholar]
- Thermal, optical and structural properties of glasses within the TeO2-TiO2-ZnO system. J. Alloys Compds. 2015;622:333-340.
- [CrossRef] [Google Scholar]
- Substituted Mo–V(Ti)–Te(Ce)-oxide M2 catalysts for propene ammoxidation. Top Catal.. 2008;50:52-65.
- [CrossRef] [Google Scholar]
- Review on: titanium dioxide applications. Energy Procedia. 2019;157:17-29.
- [CrossRef] [Google Scholar]
- Optical properties of TeO2-TiO2 thin films doped with Eu3+ ions fabricated by sol-gel processing. J. Univ. Chem. Techn. Metall.. 2012;47:381-386.
- [Google Scholar]
- Chemical and sol-gel processing of tellurite glasses for optoelectronics. J. Mater. Sci: Mater. Electron.. 2006;17:723-733.
- [CrossRef] [Google Scholar]
- Structure of zinc and niobium tellurite glasses by neutron and X-ray diffraction. J. Phys. Condens. Matter.. 2004;16:1645-1663.
- [CrossRef] [Google Scholar]
- Synthesis and characterization of TeO2/TiO2 powders obtained through Te(VI) acid. Bulg. Chem. Commun.. 2013;45(4):485-490.
- [Google Scholar]
- Sol-gel synthesis of composites in the ternary TiO2-TeO2-B2O3 system. Eur. J. Glass Sci. Techn. Part B Phys. Chem. Glasses. 2015;56(4):128-138.
- [CrossRef] [Google Scholar]
- Sol-gel synthesis of composite powders in the TiO2-TeO2-SeO2 system. J. Sol-Gel Sci. Technol.. 2016;79(1):12-28.
- [CrossRef] [Google Scholar]
- Optical properties and crystallization kinetics of (TeO2)(ZnO)(TiO2) glasses. Phys. Status Solidi. 2011;8:2629-2632.
- [CrossRef] [Google Scholar]
- Microstructure and crystallographic orientation of anatase coatings produced from chemically modified titanium tetraisopropoxide. J. Amer. Ceram. Soc.. 1996;79(6):1483-1488.
- [Google Scholar]
- Homogeneity of titania-silica mixed oxides: on UV-DRS studies as a function of titania content. J. Catal.. 1996;163:489-491.
- [CrossRef] [Google Scholar]
- Atomic arrangement of a zinc-tellurite glass. Polyhedron. 1986;5:771-777.
- [CrossRef] [Google Scholar]
- Titania-based hybrid materials with ZnO, ZrO2 and MoS2: a review. Materials. 2018;11:2295.
- [CrossRef] [Google Scholar]
- Sol–gel processing of TeO2 thin films from citric acid stabilised tellurium isopropoxide precursor. J. Europ. Cer. Soc.. 2007;27:1151-1158.
- [CrossRef] [Google Scholar]
- X-ray photoelectron spectroscopy study of highly-doped ZnO:Al, N films grown at O-rich conditions. J. Alloys Comp.. 2017;722:683-689.
- [CrossRef] [Google Scholar]
- TiO2-graphene composites with exposed 001 facets produced by a one-pot solvothermal approach for high performance photocatalyst. Phys. Chem. Chem. Phys.. 2013;15:12963-12970.
- [CrossRef] [Google Scholar]
- Mechanochemical synthesis of nanocrystalline ZnWO4 at room temperature. J. Alloys Compd.. 2011;509(1):15-20.
- [CrossRef] [Google Scholar]
- Preparation characterization and photocatalytic activity of polycrystalline ZnO/TiO2 systems. 1. Surface and bulk characterization. J. Phys. Chem. B. 2001;105:1026-1032.
- [CrossRef] [Google Scholar]
- The pyrosynthesis of stroncium zincate. J. Inorg. Nucl. Chem.. 1966;28:2801-2809.
- [CrossRef] [Google Scholar]
- Structural and magnetic properties of MoO3-TeO2 glasses. J. Non-Cryst. Sol.. 2005;351:2493-2500.
- [CrossRef] [Google Scholar]
- Infrared absorption spectra and structure of TiO2-SiO2 composites. J. Appl. Spectr.. 2008;75(5):730-734.
- [CrossRef] [Google Scholar]
- Mesoporous titanium dioxide: synthesis and applications in photocatalysis, energy and biology. Materials. 2018;11:1910-1932.
- [CrossRef] [Google Scholar]
- Hydrocarbon decomposition on a hydrophilic TiO2 surface by UV irradiation: spectral and quantitative analysis using in-situ XPS technique. Langmuir. 2009;25(19):11586-11591.
- [CrossRef] [Google Scholar]
- Surface chemistry of TiO2-ZnO thin films doped with Ag. Its role on the photocatalytic degradation of methylene blue. Cat. Today 2020 (in press)
- [CrossRef] [Google Scholar]
- Introduction to Sol-gel Chemistry. Kluwer Acad Publ; 2002.
- Remy, H., 1963. Course Inorganic Chemistry. vol I, Moskva, (in Russian)
- Low temperature preparation and visible light photocatalytic activity of mesoporous carbon-doped crystalline TiO2. Appl. Cat. B, Environ.. 2007;69:138-144.
- [CrossRef] [Google Scholar]
- Improved silica–titania catalysts by chitin biotemplating. Catal. Sci. Technol.. 2015;5:415-427.
- [CrossRef] [Google Scholar]
- New glassy and polymorphic oxide phases using rapid quenching techniques. J. Am. Ceram. Soc.. 1967;51:500-503.
- [CrossRef] [Google Scholar]
- Raman spectra of MO.TeO2 (M = Mg, Sr, Ba and Zn) glasses. J. Non-Cryst. Sol.. 1994;168:106-114.
- [CrossRef] [Google Scholar]
- Synthesis and IR spectra of some rare and new titanium and niobium minerals. Mineral. Zh.. 1982;4:54-61.
- [Google Scholar]
- Modified sol-gel synthesis of submicron powders in the system ZnO-TiO2. J. Univ. Chem. Technol. Metall.. 2011;46(2):137-142.
- [Google Scholar]
- Sol-gel synthesis and properties of nanocomposites in the Ag/TiO2/ZnO system”. J. Optoel. Adv. Mater.. 2015;17(1–2):248-256.
- [Google Scholar]
- Spectrochemical studies on charge transfer bands due to d0, d5 and d10 ions in a sodium silicate glass. J. Mater. Sci.. 2001;36:1555-1562.
- [CrossRef] [Google Scholar]
- Morphology-controlled green approach for synthesizing the hierarchical self-assembled 3D porous ZnO superstructure with excellent catalytic activity. Microporous Mesoporous Mater.. 2017;239:296-309.
- [CrossRef] [Google Scholar]
- Synthesis of graphene-based nanosheets via chemical reduction of exfoliated graphite oxide. Carbon. 2007;45(7):1558-1565.
- [CrossRef] [Google Scholar]
- Synthesis, photocatalytic and antibacterial properties of nanosized ZnTiO3 powders obtained by different sol–gel methods. Digest J. Nanomat. Biostr.. 2012;7(2):777-784.
- [Google Scholar]
- Correlation between photoluminescence spectra with gas sensing and photocatalytic activities in hierarchical ZnO nanostructures. RSC Adv.. 2017;7:9826-9832.
- [CrossRef] [Google Scholar]
- Thermal characteristics, Raman spectra and structural properties of new tellurite glasses within the Bi2O3–TiO2–TeO2 system. J. Solid State Chem.. 2006;179:3252-3259.
- [CrossRef] [Google Scholar]
- Hydrolysis of titanium tetrabutoxide. Study by FT-IR spectroscopy. Spectr. Lett.. 1999;32(2):289-304.
- [CrossRef] [Google Scholar]
- Two-dimensional chemical state plots: a standardized data set for use in identifying chemical states by x-ray photoelectron spectroscopy. Anal. Chem.. 1979;51:466-482.
- [CrossRef] [Google Scholar]
- Sol-gel processing of tellurite materials from tellurium ethoxide precursor. Mater. Sci. Eng. B. 2001;87:77-82.
- [CrossRef] [Google Scholar]
- Achieving controllable sol–gel processing of tellurite glasses through the use of Te(VI) precursors. Mater. Sci. Eng. B. 2004;107:89.
- [CrossRef] [Google Scholar]
- Sol – gel Materials: Chemistry and Applications. CRC Press; 2000.
- Hydrothermal and post-heat treatments of TiO2/ZnO composite powder and its photodegradation behavior on methyl orange. Ceram. Intern.. 2011;37:2201-2206.
- [CrossRef] [Google Scholar]
- Formation and transformation of ZnTiO3. J. Amer. Ceram. Soc.. 1987;70(5):c97-c98.
- [CrossRef] [Google Scholar]
- Yordanov, St. I., Bachvarova-Nedelcheva, A.D., Iordanova, R.S., 2017. Influence of ethylene glycol on the hydrolysis-condensation behavior of Ti(IV) butoxide, Bulg. Chem. Commun. 49 (sp. iss. D), 265–270.
- Vibrational Spectroscopy of Inorganic Compounds. Nauka; 1981. (in Russian)
- Carbon-deposited TiO2: synthesis, characterization, and visible photocatalytic performance. J. Phys. Chem. C. 2010;114:933-939.
- [CrossRef] [Google Scholar]
Appendix A
Supplementary material
Supplementary data to this article can be found online at https://doi.org/10.1016/j.arabjc.2020.07.018.
Appendix A
Supplementary material
The following are the Supplementary data to this article:Supplementary data 1
Supplementary data 1


