

Translate this page into:
Statistical analysis and optimization of photodegradation efficiency of methyl orange from aqueous solution using cellulose/zinc oxide hybrid aerogel by response surface methodology (RSM)
⁎Corresponding author. smotahari@ut.ac.ir (Siamak Motahari),
-
Received: ,
Accepted: ,
This article was originally published by Elsevier and was migrated to Scientific Scholar after the change of Publisher.
Abstract
The photodegradation efficiency of cellulose-X/zinc oxide-Y (CA-X/ZnO-Y) aerogels was studied to degrade methyl orange (MO) as an organic dye pollutant from an aqueous solution under UV light irradiation. In this study, the initial pH of the solution (3, 7, and 11), the photocatalyst dosage (3, 6, and 9 g L-1), the initial concentration of solution MO (10, 20, and 30 ppm), and the concentration of cellulose in CA-X/ZnO-Y hybrid aerogel (3, 6, and 9 wt%) were selected as four variable parameters, whereas the photoderadation performance was selected as the response. Moreover, the response surface methodology (RSM) analysis was carried out to investigate the influence of four various experimental factors at different times on the degradation of MO. The adequacy result of the proposed models displays that total of the proposed models can predict the photodegradation efficiency of MO by CA-x/ZnO-y aerogel. The optimization results of the process showed that pH = 3 and concentration of MO = 10 ppm, photocatalyst dosage (9 g L-1), and MCC concentration (9 g) are the optimal level of the studied parameters. Also, the results showed that desirability of 0.96 confirms the acceptance and applicability of the model where the RSM model is a helpful technique for the optimum conditions design.
Keywords
Photocatalysis
Methyl orange
Cellulose
Zinc oxide
Statistical analysis
Response surface methodology

1 Introduction
Pollution of water sources with various dyes is a crucial subject for the environment, which has harmful effects on human health, aquatic life, and the environment, so the removal of these pollutants is vital and necessary before entering the environment (Panda et al., 2021). Numerous techniques have been employed to remove the organic and inorganic contaminants from water/wastewater, such as precipitation, coagulation, ion exchange, reverse osmosis, membrane, electrochemistry, electrochemistry, advanced oxidation processes, and etc. (Singh et al., 2018; Kaykhaii et al., 2018; Dil et al., 2016). Among these techniques, the heterogeneous photodegradation technique is widely considered by researchers for the treatment of water/wastewater (Ahmad and Alahmad, 2021; Malika and Sonawane, 2021).
In the presence of various parameters, photodegradation tests provide various outcomes. Thus, it is challenging to form effective models for optimal photodegradation efficiency (Ahmad and Alahmad, 2021). In the last few years, response surface methodology (RSM) has been commonly used to optimize and study the interaction factors between the affecting independent parameters in chemical processes. The RSM statistical method is suitable for scheming the tests based on building models. This also estimates the influences of numerous parameters and decreases the number of required tests to transfer out the process (Senobari and Nezamzadeh-Ejhieh, 2020; Asfaram et al., 2016; Alipanahpour Dil et al., 2017). Various experimental plans, such as 3k factorial, Doehlert, Box–Behnken, and central composite design (CCD) have been employed for estimation these processes (Khataee et al., 2011). Among these models, CCD is the most common method. The CCD is employed to control the optimize conditions and influence of every independent variable, which is considered the best main advantage of this statistical method (Nasiri et al., 2021; Asfaram et al., 2018; Asfaram et al., 2018). Numerous studies have been used CCD–based RSM to optimize the photodegradation efficiency of organic and inorganic pollutants from aqueous solutions using photocatalysts-based aerogels and nanoparticles (Senobari and Nezamzadeh-Ejhieh, 2020; Qiu et al., 2021; Chaker et al., 2021; Zimmermann et al., 2020; Nadeem et al., 2021; Deriase et al., 2021; Younis et al., 2021). Roosta et al. (Roosta et al., 2015) investigated the effects of various factors such as sonication time, pH, adsorbent dosage and initial dyes concentrations on the dyes removal and optimized using CCD. Their results showed that a good agreement between experimental and predicted data was observed using optimal model. Alipanahpour Dil et al. (Alipanahpour Dil et al., 2017) investigated the effect of factors such as pH, extractor volume, disperser value and extraction time contribution on the removal of crystal violet (CV) and azure b (Az-B) and their numerical coefficient in quadratic model were calculated according to CCD. In another work by Afsaram et al. (Asfaram et al., 2016), effective variables were optimized according to RSM. They showed that the dye removal (100%) was achieved in temperature 25 °C, 24 h, pH 7 35 mg L−1 of malachite green (MG) concentration.
Aerogels are also a new topics in the dye removal which motivated the researchers to work on them widely due to their advantages and efficiencies. Anatase titania/Cellulose Aerogels were fabricated via a hydrothermal treatment by Wan et al. (Wan et al., 2015), and employed its performance on the photocatalytic degradation of rhodamine B and MO. In another work on cellulose aerogel by Jiao et al. (Jiao et al., 2018), Fe3O4@cellulose aerogel nanocomposite was synthesized using a facile hydrothermal method and investigated its application in the degradation of Rhodamine B. Jiao et al. (Jiao et al., 2015) successfully prepared anatase TiO2/cellulose (ATC) hybrid aerogel by immersing of cellulose hydrogel in anatase TiO2 nano sol solution. Their results indicated that synthesized hybrid aerogel exhibited the excellent photodegradation of indigo carmine dye under UV light irradiation. This improvement in the degradation was attributed to the excellent dispersion of anatase TiO2 in cellulose aerogel. In another similar study, Magnetic MnFe2O4-Cellulose aerogel composite was prepared via dipping cellulose hydrogel in Fe3+/Mn2+ metal ion solution by Cui et al. (Cui et al., 2018). Then, they applied the effect of kinetics and thermodynamics of Cu(II) adsorption for as-synthesized composite.
Ma et al. (Ma et al., 2019) fabricated a type of hybrid aerogel via dipping bacterial cellulose aerogel in metal–organic framework nanoparticles solution, and investigated the removal efficiency of the composite for Pb2+ ion. Nano-Ag/cellulose (NAC) aerogels were prepared through a two-step method, including first immersion of cellulose hydrogel in aqueous AgNO3 and then aqueous NaBH4 for 3 h and 10 min, respectively, by Wan et al. (Wan et al., 2016). Chong et al. (Chong et al., 2015) synthesized CaCO3-decorated cellulose aerogel via soaking of cellulose aerogel in CaCl2 aqueous solution for 24 h and then a mixture of Na2CO3 aqueous solution for 24 h. They showed that as-prepared composite aerogel exhibited the adsorption efficiency of Congo Red (CR) from aqueous solution.
In the present study, we investigated the effect of various concentrations of cellulose (3–9 wt%) on morphology, pore volume cellulose/ZnO hybrid aerogel. Also, the effect of various parameters such as pH, dye concentration, and cellulose concentration were studied on the photodegradation of MO solution. The photocatalytic results show that the as-prepared hybrid aerogel with concentration 9 wt% has the most performance (98%) for degrading MO and has high strength after three cycles. Additionally, response surface methodology (RSM) as a statistical tool was studied to develop an optimization model of the photodegradation of MO onto cellulose-x/ZnO hybrid aerogel. The optimal results showed that the most degradation of MO (98%) was obtained at the concentration of 9 wt%, pH of 11, the degradation time of 120 min, and concentration 10 mg/L.
2 Experimental
2.1 Materials
Different types of aerogels containing microcrystalline cellulose and ZnO nanoparticles prepared in our previous work, and are applied in the present study as photocatalyst (Hasanpour et al., 2021). Briefly, the weight ratios of the initial materials used to synthesis the samples are shown in Table 1. The amount of microcrystalline cellulose in these photocatalysts is equal to 3, 6 and, 9 wt%, respectively. The concentration of Zn2+ ions is equivalent to 0.4 mol L-1 as a precursor to form ZnO nanoparticles on the surface of the cellulose aerogel matrix during the hydrothermal treatment for all of the synthesized aerogel. These photocatalysts are coded as CA-X/ZnO-Y aerogel (i.e., CA-3/ZnO-0.4, CA-6/ZnO-0.4, and CA-9/ZnO-0.4) aerogel, where X and Y are the weight ratio of microcrystalline cellulose and the concentration of Zn2+ ions, respectively. In the present work, the dimensions of the prepared aerogels are 2.5 * 0.5 cm2. The schematic of CA-X/ZnO-Y aerogel prepared with different concentration of microcrystalline cellulose is presented via Fig. 1.
Samples
Purity (%)
CA-3/ZnO-0.4 aerogel
CA-6/ZnO-0.4 aerogel
CA-9/ZnO-0.4 aerogel
Microcrystalline cellulose (gr)
99
3
6
9
NaOH (gr)
96
7
7
7
Urea (gr)
99
13
13
13
Distilled water (gr)
–
77
74
71
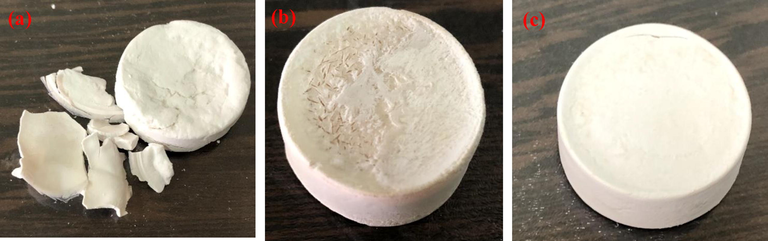
Schematic of as-prepared samples CA-X/ZnO-Y aerogel with different weight ratios of MCC. a) 3 wt%, b) 6 wt% and c) 9 wt%.
2.2 Materials characterization
The as-prepared samples were characterized by field emission scanning electron microscopy (FE-SEM) (TESCAN Vega3 Model) and Brunauer-Emmett-Teller (BET) (Belsorp mini Model, Japan).
2.3 The photodegradation efficiency of as-prepared samples
The used dye organic pollutant is methyl orange (MO) to study the photodegradation efficiency of as-prepared samples. To achieve a typical photodegradtion activity of CA-X/ZnO-Y aerogels, 100 ml of MO solution is poured into a beaker with different concentrations (10, 20, and 30 ppm) and in certain amount of synthesized photocatalysts (in the range of 3, 6, and 9 g) at desired pH (3, 7, and 11). Then different as-prepared samples (CA-X/ZnO-Y aerogel) were added during separate experiments into dye contaminant. The tests for estimation of the photodegradation are carried out under UV irradiation using an Hg vapor lamp (300 W) as the light source. Before irradiation, the as-prepared solution was magnetically stirred for approximately 3 h in the dark environment to achieve the adsorption–desorption equilibrium between the photocatalyst and MO to ensure that the photocatalyst surface was soaked with MO molecules. Then, the solution is continuously exposed to irradiation at intervals of 30 min, and 3 ml of the solution was taken out, so its absorbance was measured with a UV–vis spectrophotometer (Lambda EZ 201, Perkin Elmer Company) at a wavelength of 464 nm. The degradation efficiency of dyes was expressed in terms of decolorization and mineralization. The decolorization performance of MO can be evaluated according to the following Eq. (1):
2.4 Experimental design
To evaluate the influence of key factors and also achieve the optimum point of the efficient factors in the photocatalytic degradation efficiency of MO using cellulose/zinc oxide aerogel, the experimental analysis was designed through Design Expert Software, version 11 (DOE) software (Senobari and Nezamzadeh-Ejhieh, 2020; Moztahida and Lee, 2020; Saghi et al., 2020). Response surface methodology (RSM) is a set of statistical and mathematical tools which are used for studying the impact of independent parameters on the response and fitting experimental models to reach the best system efficiency (Bezerra et al., 2008; Azari et al., 2019). Additionally, RSM was used to investigate the influence of single-parameter and multi-parameter interactions and relations between effective operation parameters of the degradation on the photocatalytic degradation rate of MO to achieve the best conditions (Shaykhi and Zinatizadeh, 2014). In this study, the influence of four various parameters in three levels, pH (A), initial dye concentration (mg/L) (B), photocatalyst dosage (C), the concentration of MCC (C), were studied (Table 2). In accordance with RSM analysis, a total of 27 experimental runs were considered as the empirical model. The main factors and the variety of experiment design levels considered in this study are presented in Table 2.
Factors
Symbol
Unite
Coded level
Low level
Central point
High level
pH
A
–
3
7
11
Initial MO concentration
B
mg/L
10
20
30
Phototcatalyst dosage
C
g/L
3
6
9
Cellulose concentration in sol–gel
D
g
3
6
9
Response
Degradation efficiency of MO
3 Results
3.1 Morphology of as-prepared samples
The surface morphologies of CA-3/ZnO-0.4, CA-6/ZnO-0.4, and CA-9/ZnO-0.4 aerogels were investigated using FE-SEM analysis and were presented at low and high magnification in Fig. 2 (a and b), (c and d), and (e and f), respectively. As revealed in Fig. 2 b, d, and f at high magnification (2 µm), the CA-X/ZnO-Y aerogels showed the existence of the three-dimensional porous and network-like structure, which was probably shaped during the freeze-drying method (Fig. 2 b, d, and f). As shown in Fig. 2, ZnO rice grains-like were formed on the porous structure of the cellulose aerogel matrix during hydrothermal treatment. Furthermore, the FE-SEM images of CA-X/ZnO-Y aerogels reveal the change of morphology and structure of as-prepared samples with increasing the concentration of cellulose from 3 to 9 wt%. From the FE-SEM images, it can be obtained that the three-dimensional porous structure of CA-X/ZnO-Y aerogel was reduced, and a closely packed structure at a low concentration of cellulose (3 wt%) (Fig. 2 b). This might be attributed to the closure of pores by the growth of ZnO rice grains-like on the surface of cellulose aerogel matrix. In contrast, the CA-9/ZnO-0.4 aerogel exhibited a porous structure with more pores than CA-3/ZnO-0.4 aerogel. Also, ZnO particles are uniformly distributed on the cellulose matrix with increasing the concentration of cellulose, which is a benefit of more adsorption and degradation of MO dye molecule during the photodegradation experiment.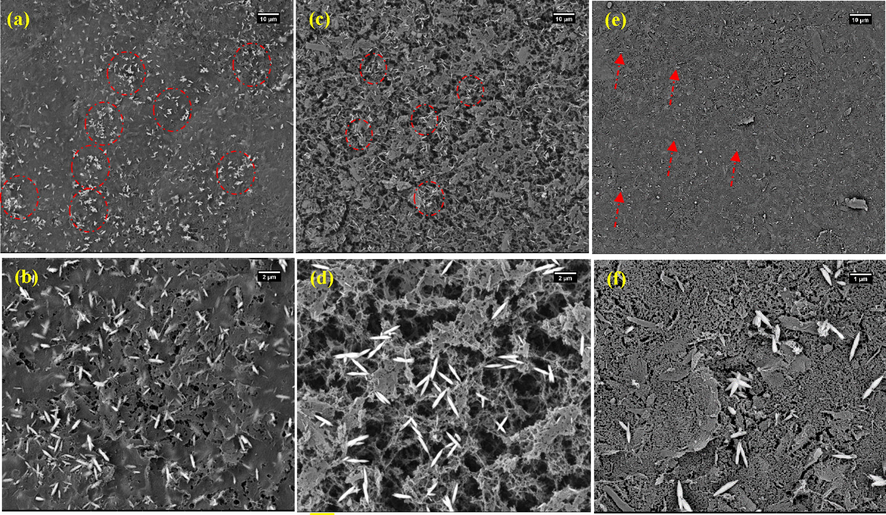
FE-SEM images of the surface of CA-X/ZnO-Y aerogel synthesized from various cellulose concentrations: (a-b) 3 wt%, (c-d) 6 wt%, and (e-f) 9 wt%. Images of (b), (d), and (f) at higher magnification of (a), (c), and (e), respectively.
3.2 Brunauer–Emmett–Teller (BET) and porosity characterization
The nitrogen adsorption–desorption isotherm curve and BJH pore size distribution curve of the as-prepared samples are revealed in Fig. 3. Results corresponding to N2 adsorption–desorption curve in Fig. 3 a showed that the as-prepared CA-X/ZnO-Y aerogels exhibited a type of IV isotherm (Luo et al., 2018). The BET specific surface areas of CA-3/ZnO-0.4, CA-6/ZnO-0.4, and CA-9/ZnO-0.4 aerogels are 104, 194, and 352 m2 g−1, respectively. As shown in Fig. 3 a, the specific surface area of CA-X/ZnO-Y aerogels decreases with the decreasing concentration of cellulose. These decreasing in the surface area could be attributed to block the pores of the aerogels due to overgrowth of ZnO rice grain-like during the hydrothermal process in the lower concentration of cellulose. These results confirm the influence of the concentration of cellulose on the morphologies and BET-specific surface area of the CA-X/ZnO-Y aerogels. Also, the average pore size and total pore volume of the as-prepared samples obtained from the nitrogen adsorption–desorption analysis are presented in Table 3. According to the presented results in Table 3, the as-prepared samples are categorized as mesoporous materials with an average pore diameter of 15–20 nm under the classification of IUPAC (E et al., 2019). The results show that CA-9/ZnO-0.4 aerogel has the maximum specific surface area in the present study.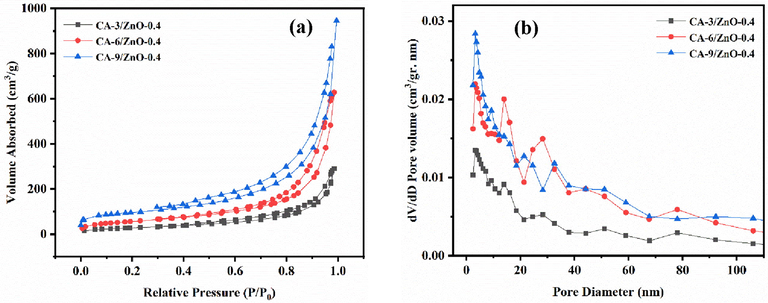
(a) The nitrogen adsorption/desorption curves and (b) the pore size distribution curves of CA-X/ZnO-Y aerogels.
Samples
Specific surface area (m2/g)
Average pore size (nm)
Total pore volume (cm3/g)
CA-3/ZnO-0.4 aerogel
104
17.218
0.448
CA-6/ZnO-0.4 aerogel
194
20.024
0.97
CA-9/ZnO-0.4 aerogel
352
15.458
1.36
3.3 Optimization by analysis of RSM for the degradation activity of MO
Based on the batch experiment, the influence of various parameters such as pH of MO solution (A), the initial concentration of MO dye pollutant (B), photocatalyst dosage (C), and the concentration of MCC (D) on the photodegradation performance of MO was investigated by the RSM. Using Design of Expert 11 software, the tests were planned through the CCD model to adjust the main operation parameters for attaining maximum MO photodegradation rate in aqueous solutions. The CCD matrix gained with 27 random arrays of experimental runs besides the actual and predicted outcomes as shown in Table 4. The highest degradation efficiency of MO at time of 120 min was achieved about 99.15% for the actual results with a residual of 3.41% approximately more than the predicted value. The achieved results from the experimental study (Table 4) can be fitted with a quadratic model as displayed in Eq. (2):
Run No.
pH
Initial concentration of MO (ppm)
Photocatalyst dosage (g)
Concentration of MCC (g)
Degradation efficiency of MO (%)
Residual
Observed
Predicted
1
7
30
6
6
45.78
38.54
7.24
2
11
30
9
9
43.12
49.96
−6.84
3
3
30
3
9
68.34
62.42
5.92
4
7
20
9
6
49.72
45.30
4.42
5
11
30
9
3
25.65
22.50
3.15
6
11
10
3
3
42.65
37.96
4.69
7
3
30
9
3
51.21
50.27
0.94
8
7
20
6
6
40.27
40.44
−0.17
9
7
20
6
3
33.52
30.32
3.2
10
11
20
6
6
36.74
30.09
6.65
11
11
30
3
3
18.65
23.76
−5.11
12
3
30
3
3
43.43
47.58
−4.15
13
3
10
3
9
80.43
81.92
−1.49
14
7
20
6
6
39.8
40.44
−0.64
15
7
20
3
6
34.76
39.01
−4.25
16
3
10
9
3
65.54
65.77
−0.23
17
3
20
6
6
58.85
65.34
−6.49
18
3
10
9
9
99.15
95.74
3.41
19
11
10
9
9
54.87
49.06
5.81
20
3
30
9
9
82.76
85.79
−3.03
21
7
20
6
9
45.65
48.69
−3.4
22
7
10
6
6
43.54
50.61
−7.07
23
3
10
3
3
77.76
72.63
5.13
24
11
30
3
9
32.43
30.53
1.9
25
11
10
3
9
36.54
39.18
−2.64
26
11
10
9
3
19.54
27.16
−7.62
27
7
20
6
6
42.2
40.44
1.76
The Eq. (3) is expressed with the actual values of the input factors (pH, the concentration of MO (CMO), photocatalyst dosage (Dos), and the concentration of MCC (CMCC)), their interaction (pH Dos, pH CMCC, pH CMO, Dos CMCC, Dos CMO, and CMCC CMO), and quadratic (pH2, Dos2, CMCC2, and CMO2) terms as a function of the degradation efficiency (%) of MO to define the responsibility for practical levels of each various parameters. The positive and negative coefficients were shown in the above equation represent the synergistic influence of the various parameters on the degradation efficiency (%) of MO. In contrast, the coefficients with positive and negative values have a positive effect and an adverse effect on the response, respectively.
The relationship among, normal, predicted, and actual charts of the residual related to the experimental data in the degradation performance of MO are shown in Fig. 4 using CA-X/ZnO-Y aerogel. As shown in Fig. 4a and b, there is a straight line for data scattering, representing that the experimental data were dependent on the predicted values of the response. Additionally, the curves of residuals versus run number and residuals versus predicted amount for the photodegradation efficiency of MO were presented in Fig. 4c and d, respectively. As seen in Fig. 4 c, the residuals versus run number plot show a random scattering nearby zero with a change of ± 3.0. This outcome confirms that the data were usually dispersed in the model responses (Song et al., 2020). Fig. 4d also confirms that the difference of the studentized residuals versus predicted has no individual form. Thus, it can be concluded that the achieved residuals have the usual scattering and the adequacy of the proposed model (Abolhasani et al., 2019). As seen in Fig. 5a, from the Box–Cox plot for power transforms, lambda value of nearly 1 proposes that no transformation is recommended for the response of the photodegradation efficiency of MO. Cook’s distance values lower than 0.50 (<0.50) validate that our model does not have effect points (Fig. 5b) (Igwegbe et al., 2019).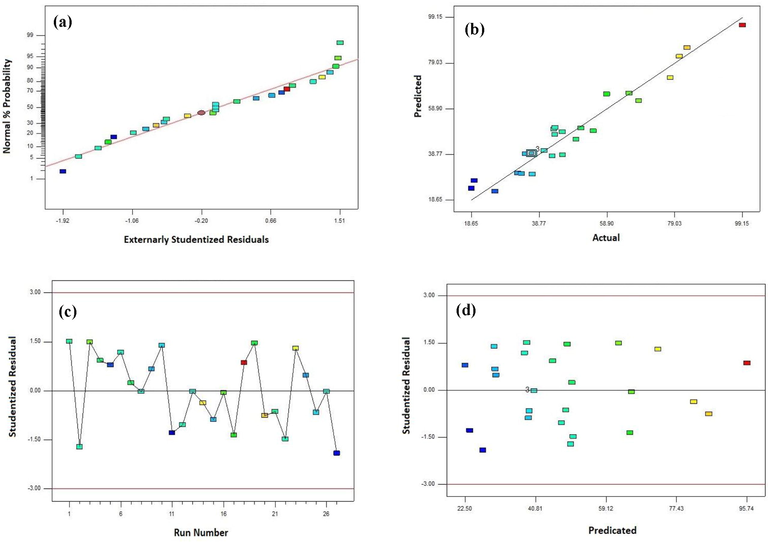
(a) Normal probability plot of the residual, (b) predicted versus actual amounts diagram, (c) residual versus run number, and (d) residual versus predicated amount for the photodegradation performance of MO.
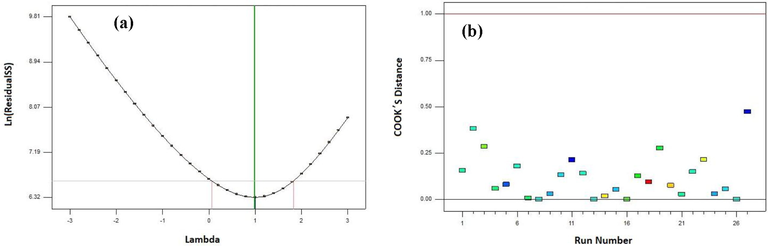
(a) Box–Cox versus Lambda plot for the Power transformation and (b) Cook,S Distance versus Run Number for the photodegradation performance of MO.
3.4 Model selection
To choose a model and regression equations for the photodegradation performance of MO, linear, two factors (2F), quadratic, and cubic models were studied in order to predict the results with suitable power. The matching of each model was observed, and the results showed in Table 5. According to the presented result in Table 5, both quadratic and linear models are suggested as proper the models in the present work to predict the photodegradation performance of MO due to having a higher F-value than cubic and 2FI models. Among these two models, the quadratic model is chosen as an optimum model for the present study.
Source
Sum of Squares
df
Mean Square
F Value
P Value
Mean vs Total
63699.07
1
63699.07
Linear vs Mean
7944.94
4
1986.23
21.35
< 0.0001
Suggested
2FI vs Linear
747.78
6
124.63
1.53
0.2298
Quadratic vs 2FI
743.56
4
185.89
4.01
0.0271
Suggested
Cubic vs Quadratic
544.28
8
68.04
23.78
0.0041
Aliased
Residual
11.45
4
2.86
Total
73691.08
27
2729.30
3.5 Analysis of variance (ANOVA) and model fitting
The model factors were investigated using the ANOVA analysis. The purpose of this statistical analysis was to control the individual and interactive effects of the factors on the photodegradation performance of MO. This investigates were confirmed by ANOVA, and a quadratic model was proposed. Furthermore, a quadratic model was applied to assist know the significance of the factors and the differences in the model obtained from statistics, which displayed in the model. In the present study, the influence of four various parameters on the photodegradation efficiency of MO was investigated through ANOVA, and the results of the analysis ANOVA are showed in Table 6. The quality of the quadratic model fit for an estimate of photodegradation performance as the response was studied by statistical evidence (Table 6), including Fisher variation ratio (F-value), probability value (P-value), and Lack of Fit (Jalali et al., 2019). Also, the degrees of freedom (DF), the mean squares (MS), and the sum of squares (SS) were computed. The Model F-value of 14.55 implies the model is significant. There is only a 0.01% chance that a “Model F-value” could occur due to noise. Values of “Probability > F” <0.0500 indicate that model terms are significant. The results exhibited that the four terms A, B, D, and CD are significant model terms, while the terms C, AB, AC, AD, BC, BD, A2, B2, C2, and D2 were no significant. Furthermore, values greater than 0.1000 indicate that the model terms are not significant. If there are many insignificant model terms (not counting those required to support hierarchy), model reduction may improve your model (Yang et al., 2020).
Source
Sum Squares
Df (Dgrees of freedom)
Mean Square
F Value
P Value
Model
9436.29
14
674.02
14.55
< 0.0001
significant
A
5592.59
1
5592.59
120.76
< 0.0001
significant
B
655.82
1
655.82
14.16
0.0027
C
177.79
1
177.79
3.84
0.0737
D
1518.74
1
1518.74
32.79
< 0.0001
significant
AB
117.67
1
117.67
2.54
0.1369
AC
15.58
1
15.58
0.34
0.5726
AD
65.08
1
65.08
1.41
0.2588
BC
91.06
1
91.06
1.97
0.1862
BD
30.83
1
30.83
0.67
0.4304
CD
427.56
1
427.56
9.23
0.0103
A2
136.13
1
136.13
2.94
0.1121
B2
44.09
1
44.09
0.95
0.3484
C2
7.62
1
7.62
0.16
0.6922
D2
555.73
12
46.31
–
–
Residual
555.73
12
46.31
–
–
–
Lack of fit
555.73
10
55.57
–
–
Pure error
0.000
2
0.000
–
–
–
Cor Total
9992.01
26
–
–
–
–
3.6 Model validation
The observed statistical factors such as mean, standard deviation, and coefficient of variation were calculated from ANOVA analysis, and results were mentioned in Table 7. According to the presented results in Table 7, the coefficient of variation, which represents the standard error of estimate, is 6.81% and indicates the precision of evaluation and credibility of the experimental data. Moreover, the standard deviation between the measured and modeled results is only 14.01%. PRESS is the proportion of the model in each of the points so that the lower is the better.
R2
Adjusted R2
Predicted R2
Adequate Precision
Mean
Coefficient of variance (C.V. %)
Standard deviation
Press
0.9444
0.8795
0.6326
14.493
48.57
14.01
6.81
367.24
The correlation coefficient (R2) was applied to validate the precision of the quadratic model. As shown in Table 7, the R2 value is 0.9444, which confirms the stable fitting of the experimental data for the photodegradation of MO. The Predicted R2 of 0.6326 is not as close to the Adjusted R2 of 0.8795 as one might generally expect. This may indicate a significant block effect or a possible problem with the present model or data. Model reduction, response transformation, outliers, and etc. most be considered Adequate Precision measures the signal to noise ratio, which is resolute by dividing the range of the predicted values (difference between the maximum and the minimum of the predicted response) at the design points to the average prediction error. Adequate precision of the photodegradation performance of MO is 14.439 which indicates an adequate signal. A ratio greater than 4 is desirable, indicating which the mean of the model is capable of providing proper performance according to the prediction (Hosseini-Nasab et al., 2019). The results showed that this model could be used to navigate the design space.
3.7 Interaction study between studied variables
In the present study, the 3D surface response plots and 2D contour plots were presented as graphical representations of the regression equation used to identify the best amounts of different factors and are usually applied to attain well comprehend of the interactions between the different parameters on the response. The outcomes of the interactions between the four different factors and the 3D surface response and 2D contour plots are presented in Figs. 6 and 7. As shown in Fig. 6 a, the photodegradation efficiency of MO increases by decreasing MO concentration and pH value. The influence of interaction between photocatalyst dosage and MCC concentration on the photodegradation efficiency of MO is revealed in Fig. 6b. The photogedradation rate increased with increasing MCC concentration and photocatalyst dosage amount. Fig. 6c displays that the photdegradation rate decreased when the photocatalyst dosage amount and pH decreased and increased, respectively. Fig. 6d demonstrates the 3D plot of response (the photodegradation efficiency of MO) as a function of the MO concentration and MCC concentration, while the photocatalyst dosage and pH are kept constant at 9 gr L−1 and 3, respectively. The results represented that decreasing the concentration of MO and increasing the concentration of MCC causes to increase the degradation of MO. The interaction effect between the photocatalyst dosage amount and the concentration MO on the degradation of MO is shown in Fig. 6e, while the concentration of MCC and pH are kept constant at optimum value 9g and 3, respectively. The outcomes indicated that decreasing the concentration of MO and increasing the photocatalyst dosage amount causes to increase the degradation of MO. In Fig. 6f, the interaction between pH and the photocatalyst dosage on the degradation efficiency of MO shows that the photodegradation was increased by increasing the photocatalyst dosage amount and decreasing the pH. Also, similarity results in the present study were observed by other researchers that the photodegradation efficiency of MO increased with decreasing pH (at acidity condition), decreasing the concentration of dye pollutants and increasing photocatalyst dosage (Chaker et al., 2021; Abbasa and Trarib, 2021; Rafiq et al., 2021).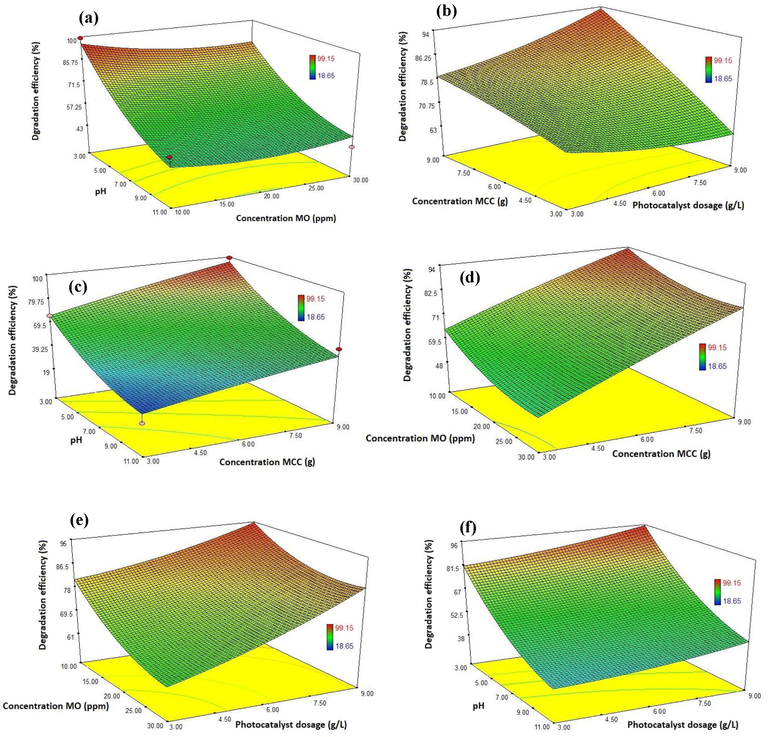
3D surface response plots for the photodegradation efficiency of MO onto CA-X/ZnO-Y aerogel: a) effect of pH and MO concentration (condition: MCC concentration 9 gr and photocatalyst dosage 9 gr L-1), b) effect of MCC concentration and photocatalyst dosage (condition: pH 3 and concentration MO 10 ppm), c) effect of pH and MCC concentration (condition: MO concentration 10 ppm and photocatalyst dosage 9 gr L-1), d) effect of MCC concentration and MO concentration (condition: pH 3 and photocatalyst dosage 9 gr L-1), e) effect of MO concentration and photocatalyst dosage (condition: pH 3 and MCC concentration: 9 gr) and f) effect of pH and photocatalyst dosage (condition: MCC concentration 9 gr and MO concentration 10 ppm).
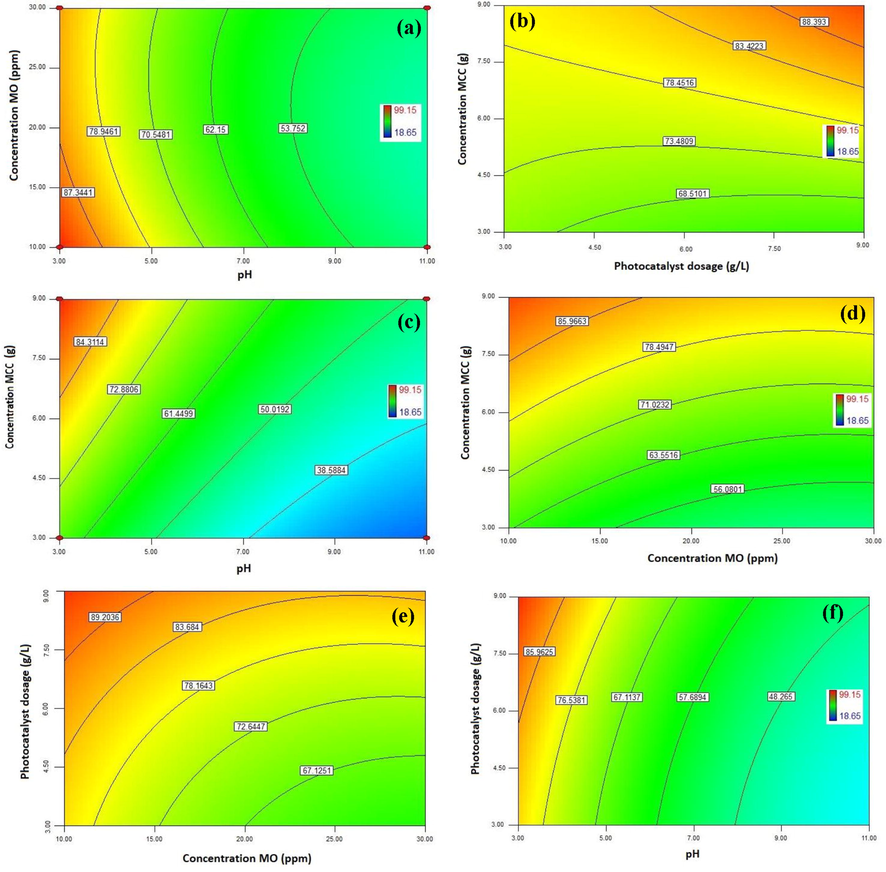
2D contours plots for the photodegradation efficiency of MO onto CA-X/ZnO-Y aerogel: a) effect of pH and concentration of MO (condition: MCC concentration 9 gr and photocatalyst dosage 9 gr L-1), b) effect of MCC concentration and photocatalyst dosage (condition: pH 3 and MO concentration 10 ppm), c) effect of pH and MCC concentration (condition: concentration of MO 10 ppm and photocatalyst dosage 9 gr L-1), d) effect of concentration of MCC and concentration of MO (condition: pH 3 and photocatalyst dosage 9 gr L-1), e) effect of concentration of MO and photocatalyst dosage (condition: pH 3 and MCC concentration 9 gr) and f) effect of pH and photocatalyst dosage (condition: MCC concentration 9 gr and concentration of MO 10 ppm).
3.8 Optimization of the photodegradation efficiency of MO
In order to numerical optimization, the optimal conditions of different factors such as pH, MO concentration, MCC concentration and photocatalyst dosage for the photodegradation efficiency of MO were predicted by using Design Expert software through the RSM model. The desirable purpose in the RSM model was fixed on the maximum degradation efficiency of MO. The 3D surface response plot and 2D contour plot of the desirability in the optimum condition are shown in Fig. 8. The results show that the interaction between the concentration of MO and pH has the most significant effect on the decomposition. The optimum value of each different parameter and desirability function is revealed in Fig. 9. As seen in Fig. 9, the maximum photodegradation rate of MO is approximately 99.15% with the overall desirability of 0.96 which is obtained under the conditions of pH: 3, photocatalyst dosage: 9 g L-1, MO concentration: 10 ppm, and concentration MCC: 9 g. The desirability function of 0.960 exhibited appropriate conditions for the photodegradation efficiency of MO by CA-X/ZnO-Y aerogel as photocatalyst. Desirability of 0.96 confirms the acceptance and applicability of the model that the RSM model is a helpful technique for the optimum conditions design. Also, it was in a good agreement with the predicted result, which confirms the adequacy and validity of the model. Results of RSM optimization for the photodegradtion efficiency of MO are showed in Table 8. As seen from the RSM results, the highest degradation performance of MO occurs at conditions of pH = 3, CMCC = 9 g, CMO = 10 ppm and Dos = 9 g.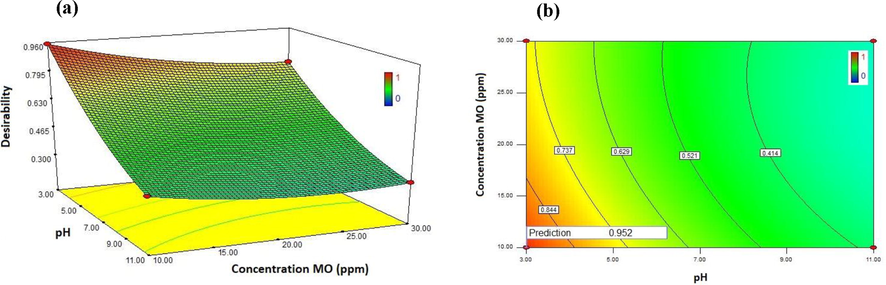
The desirability in optimum condition (pH: 3 and concentration MO: 10 ppm). a) 3D surface response plots and b) 2D contours plot.
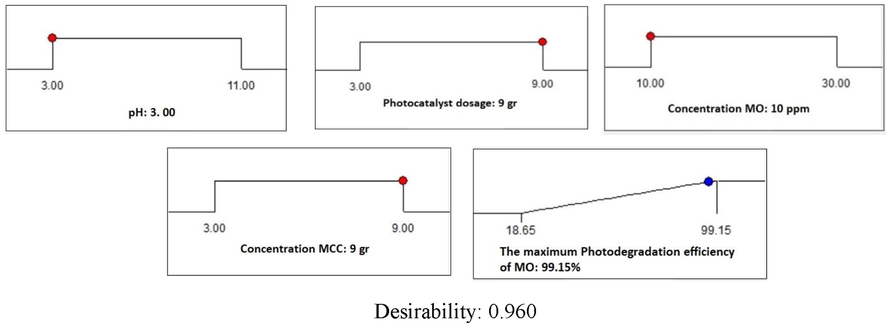
The desirability in optimal conditions (pH: 3, photocatalyst dosage: 9 gr, concentration MCC: 9 gr and concentration MO: 10 ppm).
Number
pH
CMO (ppm)
Dos (g)
CMCC (g)
Degradation efficiency (%)
Desirability
selected
1
3
10
9
9
95.7421
0.952
*
2
3
10.51
9
9
95.0707
0.942
3
3.03
10
9
8.88
94.925
0.937
4
3
10.85
9
8.97
94.0176
0.933
5
3
10
8.6
9
94.4696
0.931
6
3.06
10.81
9
9
94.1092
0.931
7
3.21
10
9
9
93.7291
0.930
8
3.14
10.4
9
9
93.8589
0.930
9
3.03
11.39
9
9
93.6823
0.923
10
3
11.79
9
9
93.3968
0.918
4 Conclusion
In the present study, the optimization and modeling of the photodegradation performance of methyl orange (MO) from aqueous solutions were investigated by CA-X/ZnO-Y aerogel as photocatalyst under UV light irradiation. The interaction effect between the various factors such pH, MO concentration, MCC concentration, and photocatalyst dosage on the degradation of MO were studied through Response Surface Methodology (RSM) based on the central composite design (CCD) method. According to the ANOVA analysis of results, the maximum photodegradation efficiency of MO (approximately 99.15%) with the overall desirability of 0.96 was obtained under the conditions of pH: 3, photocatalyst dosage: 9 g L-1, MO concentration: 10 ppm, and MCC concentration: 9 g. Also, the results of ANOVA display that the influence of the concentration of MO and pH on the removal performance of pollutant is reasonable. Furthermore, the statistical parameters including the coefficient of determination, adjusted R2, predicted R2 and adequate precision justify the adequacy of all suggested models.
5 Authors agreement
We the undersigned declare that this manuscript is original, has not been published before and is not currently being considered for publication elsewhere. We confirm that the manuscript has been read and approved by all named authors and that there are no other persons who satisfied the criteria for authorship but are not listed. We further confirm that the order of authors listed in the manuscript has been approved by all of us.
Declaration of Competing Interest
The authors declare that they have no known competing financial interests or personal relationships that could have appeared to influence the work reported in this paper.
References
- Panda, S.K., Aggarwal, I., Kumar, H., Prasad, L., Kumar, A., Sharma, A., Vo, D.V.N., Van Thuan, D. and Mishra, V., 2021. Magnetite nanoparticles as sorbents for dye removal: a review. Environmental Chemistry Letters, pp.1-39. https://doi.org/10.1007/s10311-020-01173-9.
- Water purification by using adsorbents: a review. Environ. Technol. Innovation. 2018;11:187-240.
- [CrossRef] [Google Scholar]
- Removal of dyes from the environment by adsorption process. Chem. Mater. Eng. 2018;6(2):31-35.
- [CrossRef] [Google Scholar]
- Modeling and optimization of Hg 2+ ion biosorption by live yeast Yarrowia lipolytica 70562 from aqueous solutions under artificial neural network-genetic algorithm and response surface methodology: kinetic and equilibrium study. RSC Adv.. 2016;6(59):54149-54161.
- [CrossRef] [Google Scholar]
- Ahmad, H.H., Alahmad, W., 2021. Modeling the removal of methylene blue dye using a graphene oxide/TiO2/SiO2 nanocomposite under sunlight irradiation by intelligent system. Open Chemistry, 19(1), pp.157-173. 10.1515/chem-2021-0025.
- Malika, M., Sonawane, S.S., 2021. Statistical modelling for the Ultrasonic photodegradation of Rhodamine B dye using aqueous based Bi-metal doped TiO2 supported montmorillonite hybrid nanofluid via RSM. Sustainable Energy Technologies and Assessments, 44, p.100980. 10.1016/j.seta.2020.100980.
- Senobari, S., Nezamzadeh-Ejhieh, A., 2020. A novel ternary nano-composite with a high photocatalyitic activity: characterization, effect of calcination temperature and designing the experiments. J. Photochem. Photobiol. A: Chem. 394, 112455. https://doi.org/10.1016/j.jphotochem.2020.112455.
- Asfaram, A., Ghaedi, M., Ghezelbash, G.R., Dil, E.A., Tyagi, I., Agarwal, S., Gupta, V.K., 2016. Biosorption of malachite green by novel biosorbent Yarrowia lipolytica isf7: application of response surface methodology. J. Mol. Liquids, 214, pp. 249–258. https://doi.org/10.1016/j.molliq.2015.12.075.
- Dil, E.A., Ghaedi, M., Asfaram, A., 2017. Optimization and modeling of preconcentration and determination of dyes based on ultrasound assisted-dispersive liquid–liquid microextraction coupled with derivative spectrophotometry. Ultrasonics Sonochem. 34, 27–36. https://doi.org/10.1016/j.ultsonch.2016.05.013.
- Khataee, A.R., Kasiri, M.B., Alidokht, L., 2011. Application of response surface methodology in the optimization of photocatalytic removal of environmental pollutants using nanocatalysts. Environ. Technol. 32(15), pp.1669–1684. https://doi.org/10.1080/09593330.2011.597432.
- Nasiri, A., Malakootian, M., Shiri, M.A., Yazdanpanah, G., Nozari, M., 2021. CoFe 2 O 4@ methylcellulose synthesized as a new magnetic nanocomposite to tetracycline adsorption: modeling, analysis, and optimization by response surface methodology. J. Polym. Res. 28(5), 1–23. https://doi.org/10.1007/s10965-021-02540-y.
- Asfaram, A., Ghaedi, M., Abidi, H., Javadian, H., Zoladl, M., Sadeghfar, F., 2018. Synthesis of Fe3O4@ CuS@ Ni2P-CNTs magnetic nanocomposite for sonochemical-assisted sorption and pre-concentration of trace Allura Red from aqueous samples prior to HPLC-UV detection: CCD-RSM design. Ultrason. Sonochem. 44, 240–250. https://doi.org/10.1016/j.ultsonch.2018.02.011.
- Asfaram, A., Ghaedi, M., Javadian, H., Goudarzi, A., 2018. Cu-and S-@ SnO2 nanoparticles loaded on activated carbon for efficient ultrasound assisted dispersive µSPE-spectrophotometric detection of quercetin in Nasturtium officinale extract and fruit juice samples: CCD-RSM design. Ultrasonics sonochemistry, 47, pp.1-9. https://doi.org/10.1016/j.ultsonch.2018.04.008.
- Qiu, Y., Zhang, Q., Wang, Z., Gao, B., Fan, Z., Li, M., Hao, H., Wei, X., Zhong, M., 2021. Degradation of anthraquinone dye reactive blue 19 using persulfate activated with Fe/Mn modified biochar: Radical/non-radical mechanisms and fixed-bed reactor study. Science of The Total Environment, 758, p.143584. https://doi.org/10.1016/j.scitotenv.2020.143584.
- Chaker, H., Attar, A.E., Djennas, M., Fourmentin, S., 2021. A statistical modeling-optimization approach for efficiency photocatalytic degradation of textile azo dye using cerium-doped mesoporous ZnO: a central composite design in response surface methodology. Chem. Eng. Res. Des. 171, 198–212. https://doi.org/ 10.1016/j.cherd.2021.05.008.
- Zimmermann, B.M., Peres, E.C., Dotto, G.L., Foletto, E.L., 2020. Decolorization and degradation of methylene blue by photo-Fenton reaction under visible light using an iron-rich clay as catalyst: CCD-RSM design and LC-MS technique. Revista Eletrônica em Gestão, Educação e Tecnologia Ambiental, 24, p.27. https://doi.org/10.5902/2236117040800.
- Nadeem, N., Zahid, M., Rehan, Z.A., Hanif, M.A., Yaseen, M., 2021. Improved photocatalytic degradation of dye using coal fly ash-based zinc ferrite (CFA/ZnFe 2 O 4) composite. Int. J. Environ. Sci. Technol., 1–16. https://doi.org/ 10.1007/s13762-021-03255-9.
- Statistical optimization of photocatalytic degradation process of methylene blue dye by SnO–TiO2–AC composite using response surface methodology. Environ. Prog. Sustain. Energy 2021e13639
- [CrossRef] [Google Scholar]
- Younis, S.A., Amdeha, E. and El-Salamony, R.A., 2021. Enhanced removal of p-nitrophenol by β-Ga2O3-TiO2 photocatalyst immobilized onto rice straw-based SiO2 via factorial optimization of the synergy between adsorption and photocatalysis. J. Environ. Chem. Eng. 9(1), p.104619. https://doi.org/10.1016/j.jece.2020.104619.
- Roosta, M., Ghaedi, M., Asfaram, A., 2015. Simultaneous ultrasonic-assisted removal of malachite green and safranin O by copper nanowires loaded on activated carbon: central composite design optimization. RSC Adv. 5(70), 57021–57029. https://doi.org/ 10.1039/C5RA03519H.
- Wan, C., Lu, Y., Jin, C., Sun, Q., Li, J., 2015. A facile low-temperature hydrothermal method to prepare anatase titania/cellulose aerogels with strong photocatalytic activities for rhodamine B and methyl orange degradations. J. Nanomater. 2015. https://doi.org/ 10.1155/2015/717016.
- Jiao, Y., Wan, C., Bao, W., Gao, H., Liang, D. and Li, J., 2018. Facile hydrothermal synthesis of Fe3O4@ cellulose aerogel nanocomposite and its application in Fenton-like degradation of Rhodamine B. Carbohydrate polymers, 189, pp.371-378. https://doi.org/10.1016/j.carbpol.2018.02.028.
- Jiao, Y., Wan, C., Li, J., 2015. Room-temperature embedment of anatase titania nanoparticles into porous cellulose aerogels. Appl. Phys. A, 120(1), 341–347. https://doi.org/10.1007/s00339-015-9192-2.
- Cui, S., Wang, X., Zhang, X., Xia, W., Tang, X., Lin, B., Wu, Q., Shen, X., 2018. Preparation of magnetic MnFe 2 O 4-Cellulose aerogel composite and its kinetics and thermodynamics of Cu (II) adsorption. Cellulose, 25(1), pp.735-751. https://doi.org/ 10.1007/s10570-017-1598-x.
- Ma, X., Lou, Y., Chen, X.B., Shi, Z., Xu, Y., 2019. Multifunctional flexible composite aerogels constructed through in-situ growth of metal-organic framework nanoparticles on bacterial cellulose. Chem. Eng. J. 356, 227–235. https://doi.org/10.1016/j.cej.2018.09.034.
- Wan, C., Jiao, Y., Sun, Q., Li, J., 2016. Preparation, characterization, and antibacterial properties of silver nanoparticles embedded into cellulose aerogels. Polym. Compos. 37(4) 1137–1142. https://doi.org/10.1002/pc.23276.
- Chong, K.Y., Chia, C.H., Zakaria, S., Sajab, M.S., Chook, S.W., Khiew, P.S., 2015. CaCO 3-decorated cellulose aerogel for removal of Congo Red from aqueous solution. Cellulose, 22(4), 2683–2691. https://doi.org/10.1007/s10570-015-0675-2.
- Hasanpour, M., Motahari, S., Jing, D., Hatami, M., 2021. Numerical modeling for the photocatalytic degradation of methyl orange from aqueous solution using cellulose/zinc oxide hybrid aerogel: comparison with experimental data. Top. Catal. pp. 1–14. https://doi.org/10.1007/s11244-021-01451-y.
- Hasanpour, M., Motahari, S., Jing, D., Hatami, M., 2021. Investigation of operation parameters on the removal efficiency of methyl orange pollutant by cellulose/zinc oxide hybrid aerogel. Chemosphere, 284, p.131320. https://doi.org/10.1016/j.chemosphere.2021.131320.
- Moztahida, M., Lee, D.S., 2020. Photocatalytic degradation of methylene blue with P25/graphene/polyacrylamide hydrogels: optimization using response surface methodology, J. Hazard. Mater. 400, 123314. https://doi.org/10.1016/j.jhazmat.2020.123314.
- Saghi, M.H., Qasemi, M., Alidadi, H., Alahabadi, A., Rastegar, A., Kowsari, M.H., Shams, M., Aziznezhad, M., Goharshadi, E.K., Barczak, M., Anastopoulos, I., 2020. Vanadium oxide nanoparticles for methylene blue water remediation: Exploring the effect of physicochemical parameters by process modeling. J. Mol. Liquids, 318, 114046. https://doi.org/10.1016/j.molliq.2020.114046.
- Bezerra, M.A., Santelli, R.E., Oliveira, E.P., Villar, L.S. and Escaleira, L.A., 2008. Response surface methodology (RSM) as a tool for optimization in analytical chemistry. Talanta, 76(5), 965–977. https://doi.org/10.1016/j.talanta.2008.05.019.
- Azari, A., Noorisepehr, M., Dehghanifard, E., Karimyan, K., Hashemi, S.Y., Kalhori, E.M., Norouzi, R., Agarwal, S., Gupta, V.K., 2019. Experimental design, modeling and mechanism of cationic dyes biosorption on to magnetic chitosan-lutaraldehyde composite. Int. J. Biol. Macromol. 131, 633–645. https://doi.org/10.1016/j.ijbiomac.2019.03.058.
- Shaykhi, Z.M., Zinatizadeh, A.A.L., 2014. Statistical modeling of photocatalytic degradation of synthetic amoxicillin wastewater (SAW) in an immobilized TiO2 photocatalytic reactor using response surface methodology (RSM). J. Taiwan Inst. Chem. Eng. 45(4), 1717–1726. https://doi.org/10.1016/j.jtice.2013.12.024.
- Luo, H., Dong, J., Yao, F., Yang, Z., Li, W., Wang, J., Xu, X., Hu, J., Wan, Y., 2018. Layer-by-layer assembled bacterial cellulose/graphene oxide hydrogels with extremely enhanced mechanical properties. Nano-micro Lett. 10(3), 1–10. https://doi.org/ 10.1007/s40820-018-0195-3.
- Gopi, S., Rajeswari, A., Sudharsan, G., Pius, A., 2019. Highly crosslinked 3-D hydrogels based on graphene oxide for enhanced remediation of multi contaminant wastewater. J. Water Process Eng. 31, p.100850. https://doi.org/10.1016/j.jwpe.2019.100850.
- Song, W., Li, J., Wang, Z., Fu, C., Zhang, X., Feng, J., Xu, Z., Song, Q., 2020. Degradation of bisphenol A by persulfate coupled with dithionite: optimization using response surface methodology and pathway. Science of The Total Environment, 699, p.134258. https://doi.org/10.1016/j.scitotenv.2019.134258.
- Abolhasani, S., Ahmadpour, A., Bastami, T.R. and Yaqubzadeh, A., 2019. Facile synthesis of mesoporous carbon aerogel for the removal of ibuprofen from aqueous solution by central composite experimental design (CCD). Journal of Molecular Liquids, 281, pp.261-268. https://doi.org/10.1016/j.molliq.2019.02.084.
- Modeling of adsorption of methylene blue dye on Ho-CaWO4 nanoparticles using response surface methodology (RSM) and artificial neural network (ANN) techniques. MethodsX. 2019;6:1779-1797.
- [CrossRef] [Google Scholar]
- One step integration of plasmonic Ag2CrO4/Ag/AgCl into HKUST-1-MOF as novel visible-light driven photocatalyst for highly efficient degradation of mixture dyes pollutants: Its photocatalytic mechanism and modeling. Polyhedron. 2019;166:217-225.
- [CrossRef] [Google Scholar]
- In-situ fabrication of a spherical-shaped Zn-Al hydrotalcite with BiOCl and study on its enhanced photocatalytic mechanism for perfluorooctanoic acid removal performed with a response surface methodology. J. Hazard. Mater.. 2020;399:123070.
- [CrossRef] [Google Scholar]
- Hosseini-Nasab, S.J., Saber-Tehrani, M., Haghgoo, M., Aberoomand-Azar, P., 2019. Control of porous properties of ambient dried sodium silicate-based aerogels using response surface methodology. J. Thermoplast. Compos. Mater. p.0892705719876316. https://doi.org/10.1177/0892705719876316.
- Modeling and Box-Behnken design optimization of photocatalytic parameters for efficient removal of dye by lanthanum-doped mesoporous TiO2. J. Environ. Chem. Eng.. 2021;9(1):104584.
- [CrossRef] [Google Scholar]
- Abbasa, M., Trarib, M., 2021. Contribution of photocatalysis for the elimination of Methyl Orange (MO) in aqueous medium using TiO. Desalination and water treatment. P.413-419. https://doi.org/10.5004/dwt.2021.26741.
- Photocatalytic degradation of dyes using semiconductor photocatalysts to clean industrial water pollution. J. Ind. Eng. Chem.. 2021;97:111-128.
- [CrossRef] [Google Scholar]


