

Translate this page into:
Structural and electrical properties of polyvinyl alcohol (PVA):Methyl cellulose (MC) based solid polymer blend electrolytes inserted with sodium iodide (NaI) salt
⁎Corresponding author at: Hameed Majid Advanced Polymeric Materials Research Lab., Physics Department, College of Science, University of Sulaimani, Qlyasan Street, Sulaimani 46001, Kurdistan Regional Government, Iraq. shujahadeenaziz@gmail.com (Shujahadeen B. Aziz)
-
Received: ,
Accepted: ,
This article was originally published by Elsevier and was migrated to Scientific Scholar after the change of Publisher.
Abstract
This paper studies the structural and electrical properties of solid polymer blend electrolytes based on polyvinyl alcohol (PVA) and methylcellulose (MC) incorporated with sodium iodide (NaI). The polymer electrolyte films were assembled through a solution casting technique. The host matrix, which is doped with different NaI salt concentrations between 10 and 50 wt%, utilizes the most amorphous blend compositions (60 wt% Polyvinyl alcohol and 40 wt% methylcellulose). The structural behaviour of the electrolyte films was examined utilizing X-ray diffraction (XRD) and Fourier transformation infrared (FTIR) techniques. The semi crystalline nature of PVA:MC with inserted NaI was derived from the X-ray diffraction studies, while the XRD analysis suggests that the highest ion conductive sample displays the minimum crystalline nature. The interaction between polymer blends and inserted salt was conceived from the FTIR investigation. Shifting of peaks and variation in the intensity of FTIR bands was detected. To investigate the structural properties and calculate the degree of crystallinity of the films, the (XRD) technique was employed, while electrical impedance spectroscopy (EIS) was utilized for studying the conductivity of the samples. In order to comprehend all of the electrical properties of the ion-conducting systems, the EIS outcome of each electrolyte was matched with Equivalent Electrical Circuits (EEC) s. Ion transport parameters including mobility, carrier density and diffusion are well assessed for the samples and the dielectric properties were compared with the conductivity measurement. At lower frequencies, the dielectric constant was elevated and dielectric loss was detected. Loss tangent and electric modulus plots were used to study the relaxation nature of the samples. The highest ambient temperature conductivity of PVA loaded 50 wt% of NaI was determined to be 1.53 × 10⁻⁵ S/cm. The loss tangent relaxation peak shifts towards high-frequency side which indicates the decrease of relaxation time and faster ion dynamics.
Keywords
PVA and MC polymers
NaI salt
Polymer blending
FTIR, and XRD methods
Impedance spectroscopy study

1 Introduction
After realizing the disadvantages, directly and indirectly, related to the utilization of electrolyte materials in energy storage/conversion, such as batteries and electrochemical supercapacitors (ESs), and the need for suitable devices compatible with the advancements of new display technology and portable devices, researchers and industrial centers alike have attempted the search for natural, eco-friendly/non-toxic, abundant, non-expensive electrolytes. (Kim et al., ; Liu et al., 2017 Nov 15; Pan et al., 2019; Zhong et al., 2015). Over the last few decades, the focus on bio-based polymers (BBPs) is growing considerably as potential alternatives to conventional polymers. These materials would be used to solve global concerns. Generally, bio-based polymers refer to those obtained naturally from living organisms (Tanase et al., 2014). Polymers, due to their superior flexibility, good compatibility with electrodes, high dielectric strength, non-expensive and easy fabrication, and ionic conduction ability (since it was discovered by Wright in 1975 and the announcement of utilizing possibilities in batteries by Armand), have become a promising class of materials utilized as matrices and host polymers in the manufacturing of solid polymer electrolytes (SPEs) through the dissolution of salts in suitable high molecular weight polymers (Yao et al., 2019; Agrawal and Pandey, 2008; Di Noto et al., 2011). Researchers are committed to developing polymer electrolytes with excellent conductivity for application as separators in electrochemical devices, as ionic conductivity is considered the most significant characteristic of SPEs (Wang et al., 2016). In polymer electrolytes, however, the amorphous phase rather than the crystalline phase dominates ionic conduction. Non-toxicity, biodegradability, and sustainability are characteristics of natural polymers. Based on their synthesis and origin of source, BBPs can be classified into three main categories. First, those are extracted directly from the biomass, for example, starch, cellulose, chitosan, and alginates. This category is the most abundant and a significant resource of bio-based polymers. Secondly, polymers from bio-derived monomers are synthesized. Third, some polymers are derived from microorganisms/bacteria (Malhotra et al., 2015).
It is worth noting that biopolymers, including polyvinyl alcohol (PVA), methylcellulose (MC), starch, dextran, gum, and carrageenan, are considered a strong alternative to non-biodegradable synthetic polymers. Their electrochemical stability and their ability to form a stable film can be regarded as their most impressive characteristics to employ them in electrochemical devices, such as batteries, capacitors, and solar cells since these properties are decisive (Saito et al., 2017; Ngai et al., 2016; Zeiger et al., 2016). Poly (vinyl alcohol) (PVA) is a water-soluble synthetic polymer that is known for its resistance to organic solvents. It is a partially crystalline polymer. The crystalline phase consists of plate-like single crystals (lamellae), 10–20 nm thick, that are bound to each other by disordered polymer chains and form an amorphous polymer phase. (Tretinnikov and Zagorskaya, 2012)
PVA is widely used and accepted as a host polymer, mainly due to the abundance (low cost), its good film-forming, high flexibility with superior chemicals and the thermal stability of the materials, as well as the greater extent of polar hydroxyl groups and it's high chain flexibility which aids the salt-solvation process (Polu and Kumar, 2013; BalajiBhargav et al., 2007; Rani et al., 2020). The ability of PVA to form electrolytes is associated with its hydrophilic properties and several hydroxyl groups attached to methane carbons (CH2-CH) on the PVA backbone (Remiš et al., 2021). Several investigations have been carried out on blending PVA with other biopolymers, It was observed that the addition of PVA could improve the film’s flexibility and wettability. (Gao et al., 2014). Rani et al. (Rani et al., 2021) prepared Polyvinyl alcohol (PVA)/Chitosan (CS)/graphite oxide (GO)/ nickel oxide (NiO) nanocomposites using the solution casting technique. The author showed that the addition of both nanofillers to the PVA/CS blend enhanced the thermal stability of the nanocomposites by the interaction between the OH groups of the polymers and the nano-fillers. Most PVA properties depend on molecular weight and hydrolyzation (Baker et al., 2012). The execution of earlier studies has shown that the blending of two polymers is an effective method to modify the polymer properties and obtain specific unique characteristics otherwise impossible to be achieved using single polymers in order to avoid inherent limitations of neat polymers. Thus, instead of using a single polymer to produce SPEs, the blending of two or more different polymers can improve mechanical properties, thermal stability, and the availability of ion hopping sites (Park and Park, 2001; Zhu et al., ; Rebia et al., 2018). Therefore, blending PVA with other polymers which have similar solubility parameters can improve blend material performance, which is owed to the formation of strong hydrogen bonds instead of weak van der Waals interaction (Abdullah Zainab Waheed, 2019). In contrast, methylcellulose (MC) contains numerous hydrophilic carboxyl groups and a hydrophobic polysaccharide backbone. It has been used to make solid biopolymer electrolytes as a polymer host. The lone pair of electrons of the MC at its oxygen atoms easily interacts with the cation of the salt to form polymer electrolytes based on MC (Park and Park, 2001). Additionally, MC is an amorphous polymer possessing a relatively high glass transition temperature. It has an excellent ability to reduce the degree of crystallinity of the used polymer in the blending process (Sugantha Kumari et al., 2012). Polymer blend based on MC and PVA is easy to prepare since they are both water soluble, and they are miscible with each other.
The availability and abundance at a lower cost than lithium reflect the main advantage of using sodium metal ions in the electrolyte preparation. Another advantage is the softness of the material, which makes it easier to achieve good contact with other components in the electrochemical device (Tănase et al., 2015; Abiddin and Ahmad, 2015). In the present study, PVA and MC were utilized in an excellent blending process by incorporating sodium iodide (NaI). This work intends to derive films with a large proportion of the amorphous phase with far better conductivity than crystalline. Electrochemical impedance spectroscopy (EIS), X-ray diffraction (XRD) and FTIR were used to study the prepared PVA:MC systems incorporated with various NaI amounts.
From the fundamental and industrial points of view, the synthesis and development of biopolymers are vitally important. Studies of BBPs attempt to develop new systems of polymer electrolytes for possible applications at a large scale, including electrochemical devices. The current study's findings are critical for comprehending the fundamental links between DC conductivity and dielectric characteristics. In addition, the tan δ and electric modulus studies provide insight into the ion conduction mechanism in polymer electrolytes as a function of salt concentrations, expecting the system's possible applications. Singh et al. (xxxx) synthesized SPEs based on PVA/ ionic liquid (IL)/ 1-Butyl-2, 3-dimethylimidazolium tetraflouroborate [BDMITFB] and characterized the films using AC impedance spectroscopy technique. The authors showed that the mobility, number density of charge carriers, dielectric constant, and DC conductivity considerably increased for the higher IL (20 and 25 wt%) loaded films. The aim of this work is to obtain high ionic conductivity and stabilized electrochemical properties from the PVA:MC blend polymer electrolytes by the dissolution of NaI salt. The prime novelty of this study is to progress and characterize the prepared blend polymer electrolytes with improved structural and electrical properties.
2 Materials and methods
2.1 Materials
PVA (Mw 89,000–98,000, 99+% hydrolyzed), Methyl cellulose (MC) (M0262 Sigma-Aldrich) and Sodium Iodide (NaI) (Sigma-Aldrich, molecular weight g/mol) were purchased from Sigma‐Aldrich Kuala Lumpur, Malaysia) and they were used as received without further purification.
2.2 Polymer blend electrolyte preparation
The first solution set was prepared using a solution cast technique by dissolving 0.4 g of MC in room temperature and 0.6 g of PVA (at 90 °C) in (40 ml) distilled water, separately. The solutions were stirred continuously with the magnetic stirrer for 24 h until an identical aqueous solution was obtained. Next, the PVA solution was cooled down to the ambient temperature and mixed with MC. The process is finalized by stirring the blending of PVA:MC until clear solutions are attained. Finally, the sodium salt was used to prepare ion-conducting polymer electrolytes. Various quantities of NaI salt (10, 20, 30, 40, and 50 wt%) were added separately to the PVA MC solution, followed by continuous stirring for 24 h until clear solutions were obtained. The solutions were put into several plastic Petri dishes (8 cm in diameter) and then rested to allow the formation of a dry film exempt from solvent at ambient temperature. Then, flexible films with a thickness around 0.026 mm were formed.
The blend systems of PVA:MC doped with various amounts of NaI were coded as PVMCNI, PVMCNI1, PVMCNI2, PVMCNI3, PVMCNI4 and PVMCNI5, which corresponded to 0, 10, 20, 30, 40, and 50 wt% of NaI, respectively.
The composition of the prepared films are illustrated in Table 1.
Designation
PVA:MC (g)
NaI Wt.%
NaI (g)
PVMCNI0
PVMCNI1(0.6: 0.4)
(0.6: 0.4)0.0
100.000
0.111
PVMCNI2
(0.6: 0.4)
20
0.250
PVMCNI3
(0.6: 0.4)
30
0.428
PVMCNI4
(0.6: 0.4)
40
0.666
PVMCNI5
(0.6: 0.4)
50
1.000
2.3 XRD and FTIR characterization
The XRD patterns of the pure and composition polymer films have been recorded using X'Pert Pro diffractometer (PanAnalytical) with a CuKα radiation source (λ = 1.54 Å), in the 2θ range (10°–70°), to report the information concerning the crystal structure of the prepared films. To know the nature of the interaction between the components of the composites, a Perkin Elmer FTIR spectrometer was used with running in the area between 400 and 4000 cm−1 with a resolution of 2 cm−1.
2.4 Impedance and dielectric properties
The impedance analysis is an appropriate method to study electrochemical properties and dynamics of ions through the operation of an LCR meter (HIOKI 3531 Z Hi-tester Japan) linked to a computer. The procedure requires preparing small disc-shaped films with a diameter of around 2.0 cm and inserting them between two stainless steel electrodes with spring pressure to make proper contact. By connecting the cell with a computer program, the imaginary (Z'') and real (Z') parts of the complex impedance (Z*) data were measured. In addition, the Nyquist plot intercept with the axis of Z' shows and determines the resultant bulk resistance (Rb), which is critical to determine the electrolytes' conductivity. From Eq. (1), the electrical characteristics of electrolytes can be estimated by measuring the ionic conductivity (σ). The calculation also includes Rb, t, and A, respectively, as charge resistance, thickness and surface area (Daniel et al., 2018).
The dielectric study of each electrolyte is beneficial for further understanding of the conductivity behaviour and the polarization effects. The dielectric constant, ɛr, is the number of charges stored. In contrast, the dielectric loss, ɛi is the energy loss during the movement of ions within the electrolytes. Both dielectric parameters can be expressed using the following equations (Ibrahim et al., 2012).
3 Results and discussion
3.1 XRD analysis
Early studies showed that the XRD spectrum of pure PVA possesses various peaks at 2θ = 19.42°, which is a typical sharp peak attributed to (1 0 1) plane. Also, there is a broad diffraction peak at 2θ = 41.31° which is attributed to the (1 1 1) plane and indicates the semi-crystalline nature within the PVA structure (Jiang et al., 2015). The XRD diffraction patterns of pure PVA and pure MC and their blended films are presented in Fig. 1(a-c).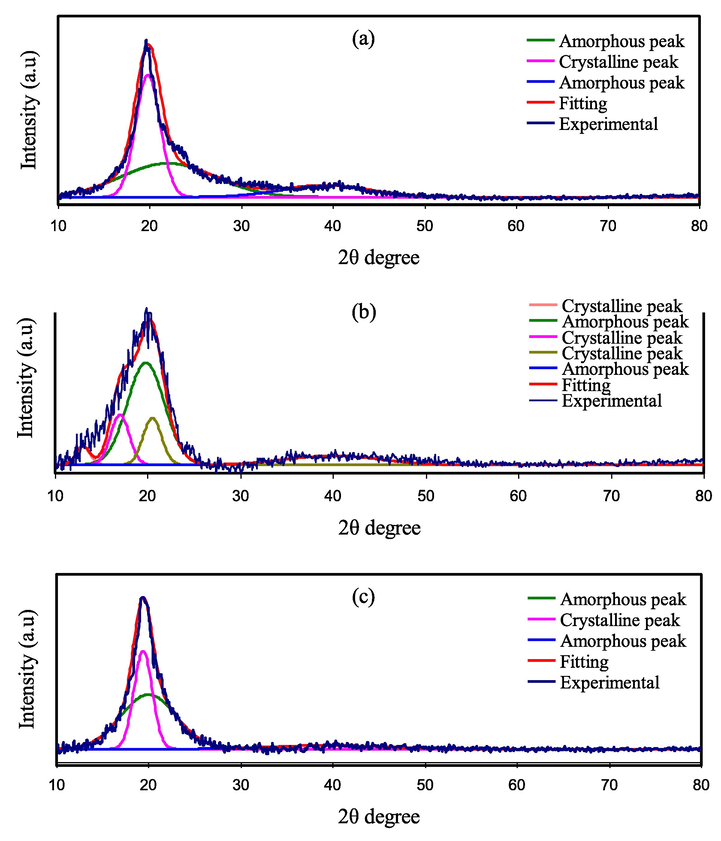
XRD pattern of (a) pure PVA film, (b) pure MC, and (c) PVA: MC blend (60:40) films.
Reddy et al. (Reddy et al., 2020) prepared PVA/ cadmium sulphide nanoparticles (CdS) via solution castingF technique. The authors observed that there was a decrease in the intensity of the diffraction peaks with loading nanofiller concentration. They mentioned that this decrement might be due to substantial interaction between PVA chains and CdS nanoparticles. Reddy et al. (Reddy et al., 2019) in another study fabricated PVA/zinc sulphide nanoparticle (ZnS) nanocomposite films and studied the structure of the films using XRD mthod. In their study showed that the crystallinity of PVA considerably decreased with increasing ZnS nanoparticles.
The XRD pattern of the neat MC is also shown in Fig. 1(b). In the earlier investigations, pure MC exhibited broad humps and multiple weak peaks centred at 2θ = 13°, 17° and 20° (Saeed and Abdullah, 2020). Fig. 1(c) shows that the intensity of the XRD spectrum in the PVA main peak region is gradually reduced and extended by the addition of MC. This could be attributed to the disruption of the crystalline phase of PVA and the disturbance of the ordered arrangements of the PVA chains.
Furthermore, the molecular chain packing rearrangement has occurred, and the distorted structure appears after blending (Senna et al., 2018). This phenomenon is due to the significant hydrogen bonding interaction between PVA, and MC molecules, signifying that the fractional crystallinity of PVA has shrank, which can be taken as evidence for the increase of amorphous state and good miscibility between the PVA and MC polymers (Kotobuki, 2020). It is generally acknowledged that hydrogen bonding occurs when electron-deficient hydrogen interacts with an area of high electron density. As an intermolecular interaction, hydrogen bondings (H-bonding), in fact, are expressed as X–H…Y, where X and Y are electronegative elements and Y has one or more lone electron pairs, i.e., X and Y are F, O, and N atoms (Singh et al., 2018). Therefore, the complexation between the PVA and MC polymers is well confirmed by our XRD analyses.
The XRD pattern of pure NaI is demonstrating in Fig. 2. It can be seen from Fig. 2 that the crystalline peaks of pure NaI salt are detected at 2θ = 18.5∘, 20.6∘, 23.67∘, 29.74∘, 32.69∘, 37.84∘, 39.12∘, and 46.5∘, 56.75∘, 64.27∘, 71.24∘, 76.33∘. In the NaI complexed PVA-MC films, the diffraction peaks have disappeared and changed to smaller diffraction peaks compared to the pure NaI pattern. Also, the degree of polymers crystallinity has found to be reduced with inclusion of the NaI salt. The absence of sharp peaks for high NaI ratios indicated that the amorphous phase is dominating, which is providing a clear suggestion of blend polymers-salt complexation. Fig. 3(a-d) shows the X-ray diffraction patterns of the PVA:MC blend incorporated with various concentrations of the NaI salt from (10–50) % in steps of 10. Fig. 3(a) shows a broad peak at 19.42∘ attributed to the PVA/MC blend polymer. It may be noted that with increasing NaI concentration, the intensity of the main peak PVA:MC polymer blends progressively decreases and the peak broadness increases, indicating the presence of molecular interactions between the polymer's functional groups and Na+ cations (Rani et al., 2014). Clearly, the peaks for the NaI disappear within the electrolyte spectrum. It is noteworthy to mention the increase in background noise indicating the enhancement in the amorphous phase, or in other words, the crystallinity of the sample gets reduced to a lesser degree (based on Braggs’ law), which may be due to the cation coordination with an electron-rich group of PVA:MC host polymer (Arya and Sharma, 2017). The absence of any sharp peaks related to pure sodium iodide (NaI) confirms the complete dissolution of NaI salt within the polymeric matrix.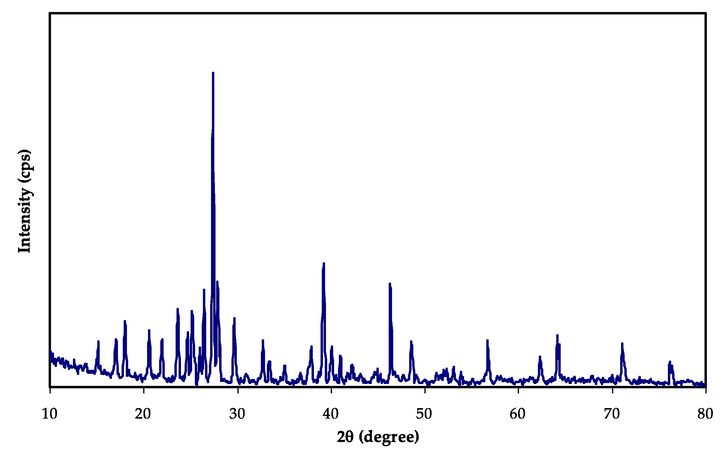
XRD pattern of pure NaI.
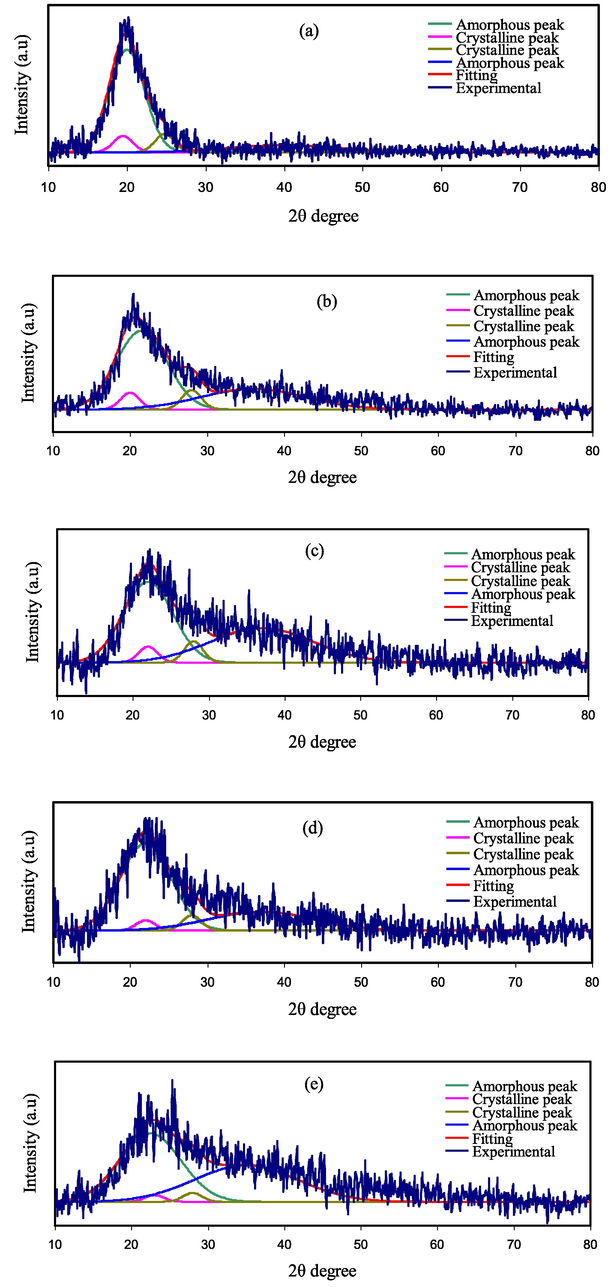
X‐ray diffraction (XRD) spectra for (a) PVMCNI1, (b) PVMCNI2, (c) PVMCNI3, (d) PVMCNI4, and (e) PVMCNI5 electrolyte films.
To measure the degree of crystallinity (Xc) of pure and electrolyte films, Origin 8 software has been used to estimate the amorphous areas and the areas of crystalline peaks. The per cent relative crystallinities (Xc) were calculated from the following relationship and shown in Table 2 (Brza et al., 2021).
Electrolytes
Degree of crystallinity
Pure PVA
41.68
Pure MC
30.67
PVA:MC blend
34.61
PVMCNI1
13.38
PVMCNI2
10.15
PVMCNI3
8.53
PVMCNI4
7.14
PVMCNI5
3.55
3.2 FTIR study
The Fourier transform infrared (FTIR) spectroscopy has been utilized to investigate the compositional, structural and possible interactions between the functional groups of PVA and MC polymers in PVA:MC polymer blend films and to investigate the interaction between the blended (PVA:MC) host polymer with NaI salt, through the observed changes in the position, shape, and intensity of the IR transmittance bands in the wavenumber range from 400 to 4000 cm−1. The vibrational frequency peaks of OH, C- O, C-H, CH2, and C = O can be used as the characteristic bands for polymers PVA and MC (Olewnik-Kruszkowska, et al., 2093). Their changing considered as evidence of the compatibility in the blend polymer, which has an essential role in the amorphous phase enhancement inside the PVA:MC blend system. Fig. 4 shows the FTIR spectra of neat MC, PVA and their blending. Table 3 lists the FTIR peaks and their assignments for the pure polymers. As seen in Fig. 4, in the PVA:MC system, the OH bands become broader with less intensity, suggesting a decrease of PVA crystallinity. This observation is well consistent with the findings of the study of XRD. In the FTIR spectrum, the major peaks of pure PVA are comparable to the position of the characteristic bands mentioned in the previous works and earlier investigations (Rozali et al., 2012). The shift in the O–H peak position and intensity indicates that hydrogen bonds between the PVA hydrogen atoms and the MC oxygen atom are formed and, hence, PVA blending with MC. On blending with MC, the crystalline peak in the PVA structure corresponded to the C-O stretching mode is broadened at about 1061 cm−1, and its intensity is also reduced (Negim, 2014). In addition, the absorption band intensity at 847 cm−1, which corresponds to the C–C stretching of (PVA), decreases with MC incorporation within the blend.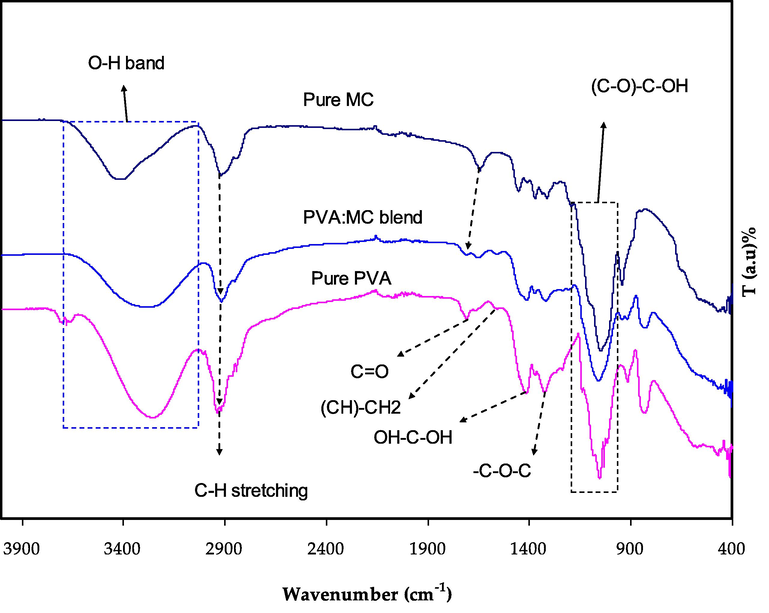
FTIR spectra for pure PVA, pure MC, PVA:MC (0.6:0.4) blend.
Wavenumber (cm-1)
Vibrational modes
Pure PVA Pure MC PVMCNI0
3283
3424
3259
2937
1709
1559
1414
1331
1054O-H stretching
C-H stretching
C = O
(C-H)–CH2
OH-C-OH
-C-O-C
(C-O)-C-OH
2910
2920
1712
–
1553
–
1416
1410
1320
1315
1061
1050
In contrast, the peak is absent in the pure MC film spectrum. This implies that the presence of physical blends and chemical interactions produces modifications to typical peaks of the spectrum when two or more polymers are blended. These observations show that between PVA and MC, there is good miscibility.
Fig. 5 shows the group frequencies of NaI at 560, 720, 890, 1014, 1176, 1603, 1620, 1742, 2021 and 3208 cm−1. In the wavenumber range between 400 and 4000 cm−1, the FTIR spectra of blended PVA:MC polymer mixed with different wt.% ratios of NaI in are shown in Fig. 5. The interaction happens by integrating salt into the polymer matrix. Between the salt and host polymers matrix, complex nature takes place. Singh and Saroj (Singh and Saroj, 2020). prepared plasticized polymer blend electrolytes based on PVA- polyvinyl pyrrolidone (PVP)-polyethylene glycol (PEG)-NaI- SiO2. Through the FTIR results the authors showed the interaction and complexation between SiO2 nano-particles and the functional groups of the polymer blend electrolytes. When combined with PVA:MC, sodium iodide peaks are lost. The removal of these peaks confirms the macromolecular salt complexation. The interaction between PVA and NaI was therefore validated by FTIR spectroscopy and their complex formation. Table 4 reveals that the hydroxyl group (–OH) of blended PVA:MC is greatly affected by the salt (NaI), where it was established to change the band after incorporation with NaI, and this result is agreed with previous studies (OmedGh. Abdullah, Shujahadeen B. Aziz, Mariwan A. Rasheed, Structural and optical characterization of PVA:KMnO4 based solid polymer electrolyte, Results in Physics,Volume 6, ,2016) Because of the complex formation between the host polymer and added (NaI) salt, the change in the absorption frequency of the hydroxyl group (–OH). The C = O stretching of carboxyl is assigned to the stretching absorption band at 1709 cm−1. Carboxyls in the films are thought to mostly form intra‐ or intermolecular hydrogen bonding with hydroxyl groups or other carboxyl groups (Choo et al., 2016 Jul 29). The complex building process between the functional groups of the host polymer and salt cations is implied by the apparent drop in transmittance intensity and band shifting. The vibration of the polar groups can be decreased as a result of the electrostatic interaction between salt cations and the functional groups (Negim, 2014). When comparing the spectrum of a complexed electrolyte to a pristine blended sample and NaI, the following alterations in the spectral characteristics were observed. In complexed films, the strong absorption peak of NaI salt at 1620 cm−1 is shifted to 1625 cm−1. All these alterations in the FTIR spectrum provide clear evidence of PVA:MC complexation with NaI. The reduction in the intensity of the transmittance peak often signifies that the amount of the functional group (per unit volume) related to the molecular bond increases, while shifting in peak position generally signifies that the state of hybridization or electron distribution has changed in the molecular bond (OmedGh. Abdullah, Shujahadeen B. Aziz, Mariwan A. Rasheed, Structural and optical characterization of PVA:KMnO4 based solid polymer electrolyte, Results in Physics,Volume 6, ,2016). Another interesting finding, induced by strong hydrogen bonds of intra and inter-type, is the formation of high-intensity bands of 1051 cm−1 in PVA:MC:NaI electrolytes (Aziz, 2020). The C–O–C stretching vibration peak of pure PVA, based on previous studies (Fan, 2019), splits into three peaks at 1086, 1055, and 1032 cm−1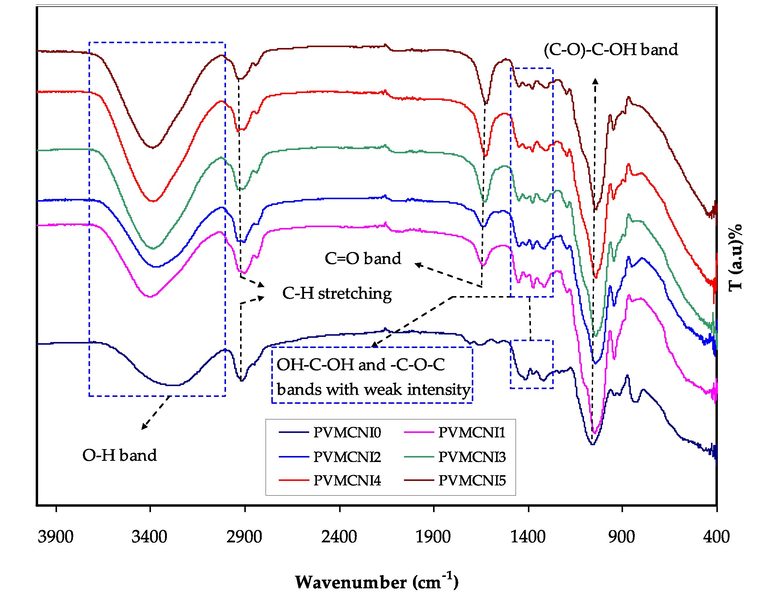
FTIR spectra of pure PVA-MC blend (0.6:0.4), and PVA: MC: NaI polymer electrolytes for 10, 20, 30, 40, and 50 wt% systems.
Vibrational modes
Wavenumber (cm−1)
PVMCNI0 PVMCNI1 PVMCNI2 PVMCNI3 PVMCNI4 PVMCNI5
O-H stretching
3283
3405
3386
3386
3386
3397
C-H stretching
2910
2904
2905
2936
2938
2940
C = O
1712
–
–
–
–
–
(C-H)–CH2
1553
–
–
–
–
–
OH-C-OH
1416
1412
1412
1412
1412
1413
-C-O-C
1321
1315.9
1316
1314
1312
1312
(C-O)-C-OH
1061
1050
1046
1046
1045.5
1045
3.3 Electrical impedance spectroscopy (EIS)
Fig. 6(a-e) shows the complex impedance planes (i.e., Z'' vs Z') of the PVA:MC blend samples incorporated with different NaI ratios. Starting from the origin, the Nyquist plots consist of only small initial parts of semicircle at 10 and 20 wt% of NaI. In contrast, at 30 to 50 wt%, the semicircle and inclined tail at varied angles to the real axis were seen. There is evidence that high-frequency response provides information on the electrolyte characteristics, including bulk resistance and long-range ordering. On the other hand, the electrode/electrolyte interface can be characterized by low-frequency responses. The electrical behaviour of blended electrolyte films appears to be altered by adding salt to a blend polymer matrix.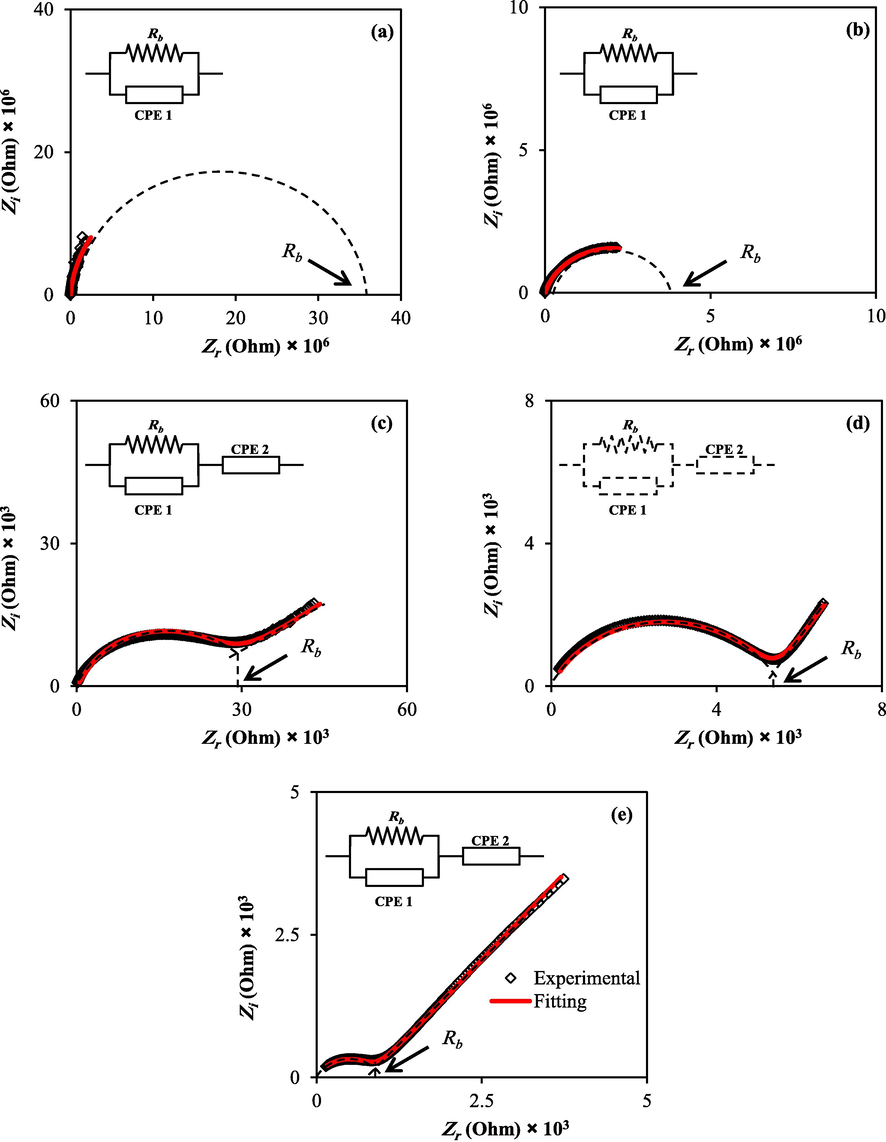
EIS plots for (a) PVMCNI1 (b), PVMCNI2 (c) PVMCNI3, (d) PVMCNI4, and (e) PVMCNI5 electrolyte films.
The semicircle shows the bulk response of the sample at high frequencies, whilst the abrupt rise at low frequencies may be traced back to the double-layer charges accumulated at the solid polymer electrolyte/electrode interfaces. Collectively, this behaviour may be explained by the fact that the capacitor's impedance increases dramatically at lower frequencies (XC = 1/2πfc), implying that the resistor receives the majority of the current, causing its attributes to be dominated. However, at extremely high frequencies, the capacitor's impedance decreases to where the resistor is effectively shorted out, resulting in zero net impedance (Aziz et al., 2018). The decreasing semicircles at high frequency, specifying low resistance of the bulk resistance (Rb), is displayed in the intercept of the arc with the Zr axis and essentially vanishes at about 50 wt%. Within the impedance plot, the disappearing semicircular region at high frequency allows the conclusion that the total conductivity implies dominating ionic conduction of the whole conductivity at elevated salt concentration (Wani and Rafiuddin, 2018). As depicted in Fig. 6, a rise in salt concentration is followed by a decline in bulk resistance. The evaluation of the data shows that the value of Rb can be assessed from the intersection of the semicircle with the real axis (Zr) (Aziz, 2020). Eq. (1) was used to determine the DC conductivity of the films, and their values are exhibited in Table 5.
Sample
DC Conductivity (S/cm)
D (cm2/S)
µ (cm2.S /V)
N (cm−3)
PVMCNI1
4.11 × 10⁻¹⁰
–
–
–
PVMCNI2
3.76 × 10⁻⁹
–
–
–
PVMCNI3
5.28 × 10⁻⁷
1.40 × 10⁻⁸
5.43 × 10⁻⁷
6.06 × 10¹⁸
PVMCNI4
2.78 × 10⁻⁶
2.10 × 10⁻⁸
8.18 × 10⁻⁷
2.12 × 10¹⁹
PVMCNI5
1.53 × 10⁻⁵
7.42 × 10⁻⁸
2.88 × 10⁻⁶
3.31 × 10¹⁹
An increase in salt concentration will result in increased DC conductivity. Consequently, two distinct zones within the plots can be identified, one corresponding to electrode polarization in low-frequency ranges and the other to bulk material characteristics in high-frequency ranges (Aziz et al., 2020). The involvement of ionic conduction from bulk material gives rise to electrical processes within the material, indicated by the existence of the semicircle. The off-centred shape of the semicircles represents the non-Debye type relaxation process. In contrast, the low frequency restrained arc corresponds to the double-layer capacitance effect due to the ion's blocking at the end of the stainless-steel blocking electrodes. As a result, the movement of the charges is strictly restrained within a limited volume of the matter. Therefore, a polarization phenomenon happens, or the electrical charges within the respective material are completely diffused. Diffusion is therefore likely to occur, and a DC conductivity, σdc, develops (Aziz et al., 2017).
From a physics viewpoint, the dissipative part of the dielectric response is attributable to resistance. In contrast, the storage part of the dielectric material is shown by a capacitance (Aziz et al., 2019). The semicircle is produced at high by the parallel combination of bulk resistance (Rb) and bulk capacitance induced by ion migration and static (immobile) polymer chains. The sharp increase at lower frequencies, on the other hand, is due to polarization at the electrode/electrolyte interface region (Basha and Rao, 2018, 2018.). At lower frequencies, mobile charges possess enough time to move under the influence of the applied external electrical field, causing the massing of charges at the polymer electrode interface. Once the salt is introduced to the polymer host, the decline in the curve shifts to the lower impedance value, suggesting lower bulk resistance and hence improved ionic conductivity. Furthermore, it is known that the complex impedance is dominated by the ionic conductivity in cases where the phase angle nears zero (Aziz et al., 2019).
The calculated ion transport parameters value of mobility (μ), number density of carrier (n), and diffusion coefficient (D) are also presenting in Table 5. All the values have found to be optimum for a highest conducting sample. The value of D increases when the amount of salt is increased from 30 to 50 wt% and a similar tendency is also seen for μ. The increases in D and μ can be attributed to the enhancement of chain flexibility and hydrogen bonds disruption in the solid electrolytes. When the amount of salt is increased, the values of D, μ, and n increase, resulting in a rise in conductivity.
Further understanding of the electrical properties of each electrolyte can be investigated using the electrical equivalent circuits (EECs) as shown in the impedance plots (Fig. 6). At high frequencies, the semicircle is a result of the parallel combination of bulk resistance (Rb) and bulk capacitance, caused through ion migration and static (immobile) polymer chains. At lower frequencies, however, the sharp increase results from polarization at the electrode/electrolyte interfacial region from the EECs modeling, the values of circuit elements can be identified where the expression of CPE impedance (ZCPE) as followed (Teo et al., (Kiel)0.2012,; Rani et al., 2020):
In Eq. (8), C and ω represent the CPE capacitance and the angular frequency. At the same time, p is the deviation of the plot from the axis. The Zr and Zi of the impedance associated with the EEC are represented as:
The real impedance, Zr and imaginary impedance, Zi of the plots that consist of both spike and semicircle [PVMCNI1 and PVMCNI2] can be calculated using the equations below (Aziz et al., 2019):
Sample
p1
p2
CPE1
CPE2
PVMCNI1
0.95
–
1.25 × 10⁻¹⁰
–
PVMCNI2
0.83
–
5.88 × 10⁻¹⁰
–
PVMCNI3
0.86
0.43
1.67 × 10⁻⁹
1.75 × 10⁻⁶
PVMCNI4
0.74
0.66
1.11 × 10⁻⁸
3.57 × 10⁻⁶
PVMCNI5
0.76
0.56
1.43 × 10⁻⁸
4.03 × 10⁻⁶
Several formulae can be used to calculate the diffusion coefficient (D), mobility (μ), and number density (n) of ions using impedance data containing a spike (Arof et al., 2014; Yusof et al., 2019). To begin, the following relationship is used to calculate D of ionic species:
The following Eq. (15) is used to calculate the mobility (µ) of the ionic species,
Since the DC conductivity of ions is shown by,
Hence, Eq. (17) can be used to determine the density of ion carriers (n).
3.4 Dielectric properties
The study of dielectric constants can be used to investigate and evaluate the conductivity nature of polymer electrolytes (Tamilselvi and Hema, 2016). The investigations of the dielectric permittivity and electric modulus will play a key role in understanding the ion transport mechanism, attributing to the presence of the dissociated salt, NaI, in PVA-MC based electrolyte films (Bharati et al., 2019; Hadi et al., 2020). The real part of dielectric permittivity (ε′) measures dipole alignment or polarization and is proportional to the capacitance. The imaginary part (ε“), on the other hand, is dielectric loss, which is related to conductance and reflects the energy needed for the alignment of the dipoles (Aziz et al., 2019). The study and detection of the development of neutral ion pairs formed from the association of dissolved ion pairs are of particular importance; as such formations can reduce the electrical conductivity (Aziz, 2016). As shown previously in XRD and FTIR studies, that increase of NaI quantity reduced the crystalline region. Thus, their impedance results showed that DC conductivity increased drastically. The real (ε′) and imaginary (ε′′) parts of the dielectric permittivity (dielectric constant and dielectric loss) were calculated from Eqs. (2) and (3). The dielectric constant and dielectric loss in the low-frequency region were found to be high, as shown in figures (7) and (8), which depict changes for the blend electrolyte samples. This has resulted from the accumulation of charge carrier or the polarization of space charges at the electrode/electrolyte interface (Aziz et al., 2020; Teo et al., (Kiel)0.2012,; Bharati et al., 2019; Lokanatha Reddy et al., 2020). At a high frequency, this phenomenon lowers dielectric properties (i.e., the bulk property). In other words, reducing the applied electric field frequency increases the available drift time for charge carriers, which increases the dielectric constant and dielectric loss (Aziz et al., 2018). At high frequencies, the periodic reversal of the electric field occurs so quickly that no excess ion diffusion occurs in the field’s direction and polarization reduces owing to the charge accumulation, causing the region to shrink and become frequency independent (Teo et al., (Kiel)0.2012). When compared to the other samples, the system incorporated with 50 wt% of NaI had the highest dielectric constant. This is due to the fact that amorphous regions in the system contribute significantly to both dielectric constant (ε') and dielectric loss (ε”) (Awasthi and Das, 2019; Khiar et al., 2016). The highest concentration of NaI salt has a large number of free charge carriers. Thus, due to the ions motion from one side to another, the electric potential of the surroundings will be perturbed (Bharati et al., 2019). The value of dielectric loss is more than the value of dielectric constant, as seen in the figures. This might be owing to the fact that the dielectric loss is affected by two contributions: the first is the dielectric polarization processes and the other is the DC conduction. Reddy et al. (Hadi et al., 2020) prepared PVA:NiS nano-composites using green approach. The authors showed that the dielectric constant of the nano-composites noticeably increased by loading NiS.
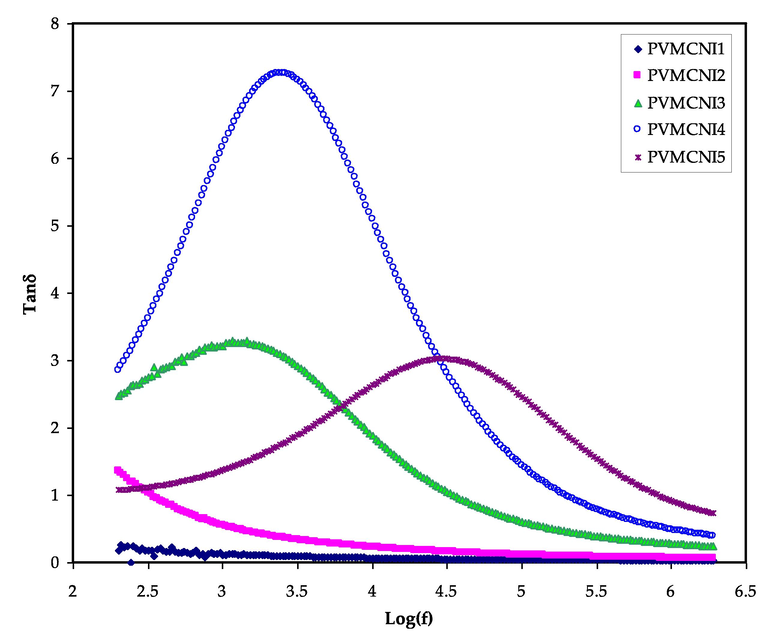
3.5 Tangent delta analysis
The loss tangent (tan δ), also known as the dissipation factor, is the ratio of energy loss to energy stored in a periodical field that may be determined using Eq. (4). The investigation of dielectric relaxation is essential to interpret the relaxation of dipoles in polymer electrolytes. As can be deduced from Fig. 9, the loss in the maximum tangent shifts to a higher frequency region as NaI concentration increases and approaches 50 wt%. The relaxation induced by the polarization of charge carriers existing in the material may mask the dielectric relaxation peaks due to permanent or induced dipoles in polymer electrolytes with considerable electrical conductivity (Hadi et al., 2020; Pritam and Sharma, 2019). Fig. 9 demonstrates the loss tangent varies with frequency for various solid polymer electrolytes. The single relaxation peak signature is a fingerprint of ionic conduction through polymer chain segmental motion (Arya and Sharma, 2018). The interpretation of the loss tangent shape can be based on Koops phenomenological model, whereby, assuming a homogeneous system, the negative slope of the low-frequency dispersion curve implied conduction dominated loss at lower frequencies through a parallel RC circuit. As a consequence, loss tangent grows with rising frequency, depicting a maximum at specific frequencies due to a more rapid rise of the active component (ohmic) than its reactive component (capacitive). Since the active component of the current is essentially (Ayesh, 2010; Morsi, 2019). At high frequencies, the loss tangent declines with the increase of frequency due to the independence of the active component of the current and the proportional rise of the reactive component with frequency. The broadness of the loss tangent peaks shows the presence of more than one relaxation process of the non-Debye type. These conclusions are supported by EEC fitting carried of impedance data, which showed that shifting the loss tangent relaxation peak towards a high frequency side indicates the decrease of the relaxation time which is owed to faster ion dynamics. The breakdown of bond formation from the dipoles was shown to be reflected by an increase in peak intensity (Arya and Sharma, 2018; Ayesh, 2010). Earlier studies have demonstrated the importance of estimating ion transport parameters, such as diffusion coefficient, carrier density and mobility. The relaxation time (τ = 1⁄2πfmax), where fmax is the relaxation frequency, can be determined using the single relaxation peak of tan δ spectra as shown in Fig. 9 (Kumar and Bhat, 2009).
From loss tangent and electric modulus plots, the broad nature of the peaks appeared in the tan δ and imaginary parts of the electric modulus, indicating the distribution of relaxation times.
The mentioned analysis of variation of different relaxation times is in agreement with the ionic conductivity value and follows the same trend. This exploration of various relaxation times and their correlation is sufficient to briefly explore the ion dynamics using the dielectric analysis. So, due to their various relaxation peak position a relaxation peak may be seen in one process and absent in another as in modulus spectra.
3.6 Modulus study
The comprehensive use of the modulus study allows a better understanding of the dielectric properties of the solid polymer electrolytes, particularly at low frequencies, by the transformation of the permittivity data into modulus data (M*=jωCoZ*) using the Eqs. (5) and (6) (Rajendran et al., 2004).
From this converting, which deals to suppress the effects of electrode polarization at low frequency, it can investigate the conductivity relaxation. From the graph, it observes that for both types, there are two different regions corresponding to the high and low frequency. Figs. 10 and 11 show the variation of real (Mr) and imaginary (Mi) parts of electric modulus for the electrolyte films against frequency at ambient temperature.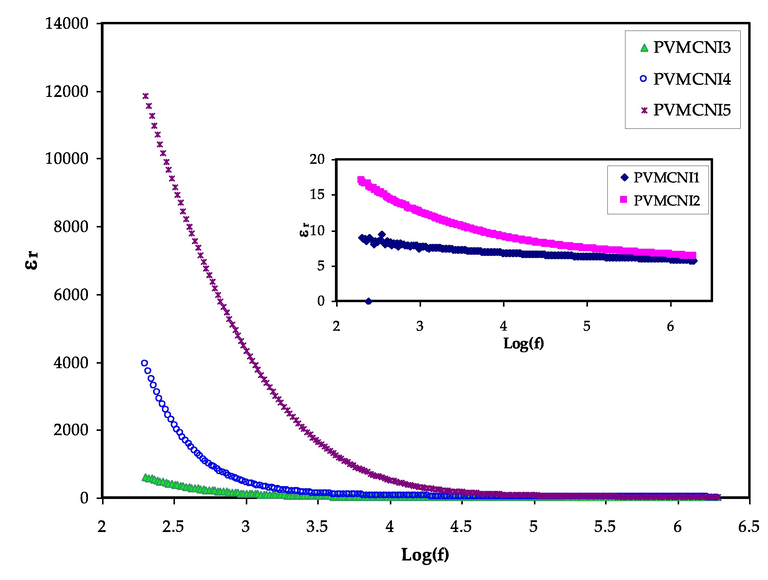
Dielectric constant versus log (f) for all electrolyte samples.
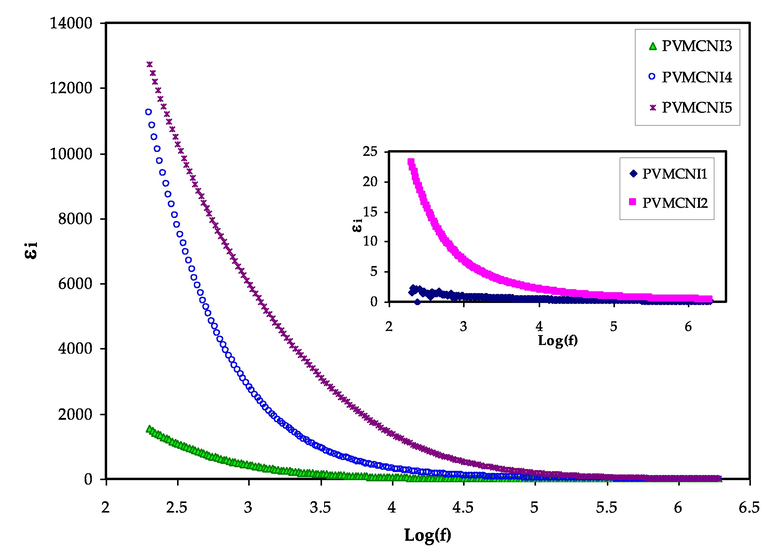
Dielectric loss versus log (f) for all electrolyte samples.
Loss tangent versus log (f) for all electrolyte samples.
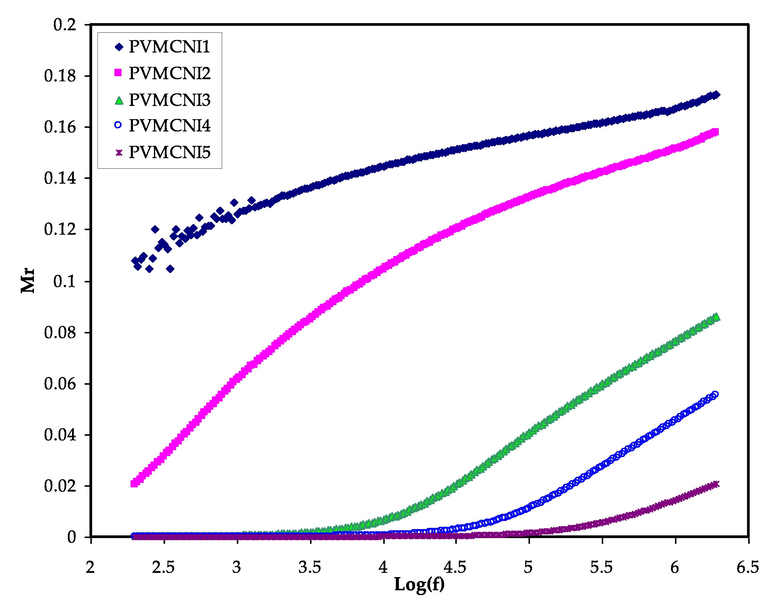
The real part of the electric modulus versus log (f) for all electrolyte samples.
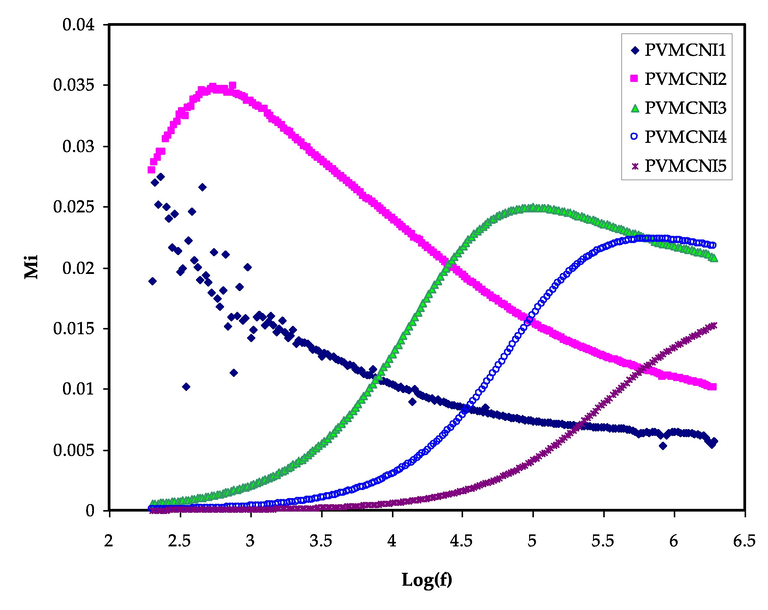
The imaginary part of the electric modulus versus log (f) for all electrolyte samples.
As can be seen from the figures, both Mr and Mi increase as the frequency increase. Both Mr and Mi tend to have zero values with extended tails in low-frequency regions, implying that the polarization of electrodes, which induces charges to increase at stainless steel electrodes, is eliminated, and minimum participation is created. The large capacitance associated with the electrodes is mainly responsible for the formation of this long tail at low frequencies, confirming a non-Debye behaviour (Marf et al., 2020).
The Mr and Mi graphs, as illustrated in Figs. 10 and 11, indicate contrast (opposite) behaviour when compared to the εr and εi patterns. At the low-frequency range, large εr and εi values were seen (see Figs. 7 and 8). At the low-frequency region, the Mr and Mi point to the lowest values, indicating capacitive behaviour. Due to the addition of NaI in the polymer system, the modulus relaxation time (τm) was found to be reduced. The low value of relaxation time suggests that cations migrate quickly from one coordinating site of the host polymer to another, resulting in an increase in the ionic conductivity of solid polymer electrolyte. The value of M'' is smaller at lower frequencies than at higher frequencies, which might be due to ion accumulation and, consequently, increased capacitance formation at the interfacial region.
As reported in previous work (Aziz and Abdullah, 2018; Aziz et al., 2019; Aziz et al., 2019; Aziz, 2018; Pradhan et al., 2008; Aziz et al., 2019), it has been documented that the relaxation time decreases as the ionic mobility and conductivity increases. It was discovered that the Mi spectra contains conductivity relaxation peaks, which moved to the higher frequency side with increasing NaI concentration in PVA:MC-based films. The concentration of NaI affects the mobility of charge carriers and the segmental motion of polymer chains. The appearance of peaks in the imaginary part (Mi) spectra, indicates the existence and contribution of huge amounts of electrode polarization in the dielectric loss parameter which hidden the peaks in ɛi spectra as a result of a couple of species motions, namely ionic and polymer segmental motions (Sengwa et al., 2008; Aziz, 2016). There is a directly proportional relationship between the relaxation time and salt concentration, which can be observed from the relaxation peak shifting to the lower frequency side with increasing the NaI salt concentration.
The Argand plot (Mi-Mr) for NaI-doped PVA:MC samples is shown in Fig. 12. The plots clearly reveal an incomplete half semicircle, indicating that the relaxation process is the non-Debaye type (Mohomed et al., 2005). The non-Debye behaviour is owing to the fact that there are several types of polarization mechanisms in areal materials, as well as numerous interactions between ions and dipoles. As a result, a relaxation time distribution emerges. Furthermore, because of the reduction in resistivity, the Mi-Mr curve deviates further from the semicircular arc as the NaI concentration increases, and the tail depresses more towards the Mi axis. This supported by the fact that the dielectric constant is significant at low frequencies (see Fig. 7). It was stated that if Argand's plot shows semicircular behaviour, relaxation is a result of the process of conductivity relaxation; otherwise, the relaxation is due to viscoelastic relaxation (or polymer molecular relaxation) (Sharma et al., 2013). In the Argand plots, depressed semicircles are a signature of deviation from ideal Debye behaviour. The intersection of plots with the real axis moves towards the origin as the concentration of NaI increases, showing an increase in mobility and, consequently, conductivity Sharma et al., 2013. This coincides with the results of the XRD analysis. To distinguish between conductivity relaxation and viscoelastic relaxations, an understanding of the Argand plot is crucial. As the temperature increases, the Zi and Zr values decrease, causing the Mi and Mr values (
,
) to deviate further towards the origin. Fig. 12 shows that the diameter of the semicircles is substantially below the real axis, revealing the relaxation time distribution. Ion transport takes place as a result of viscoelastic relaxation processes.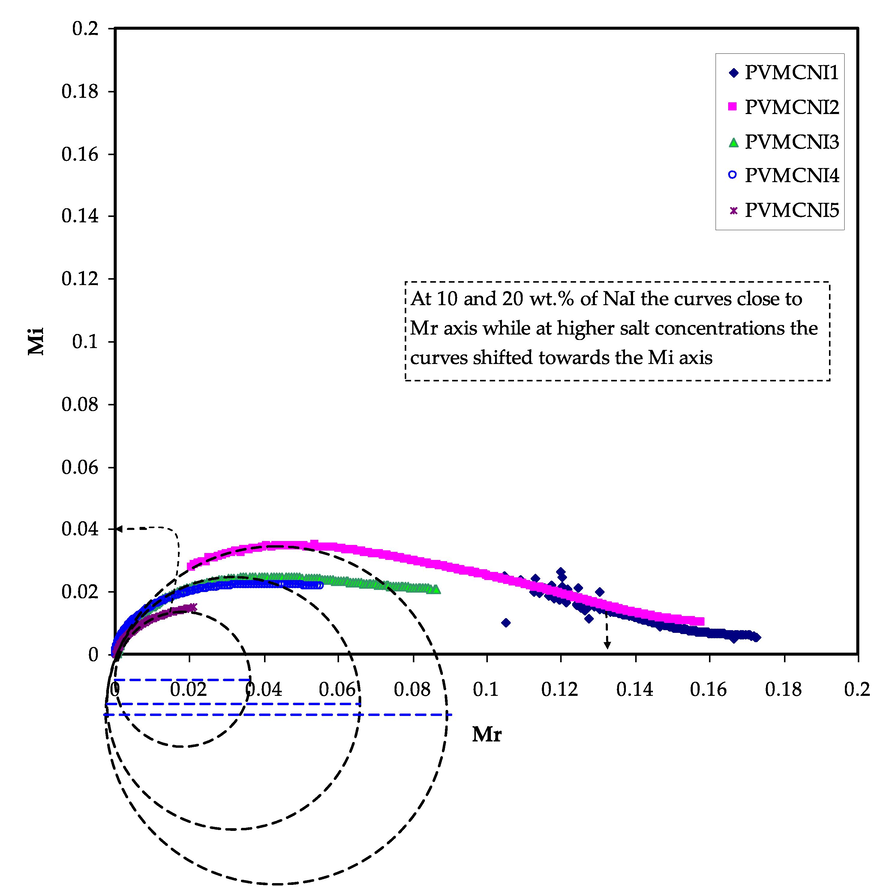
Argand plot at ambient temperature for all the samples.
4 Conclusions
In conclusion, the casting technique was used to prepare polymer blend electrolytes based on polyvinyl alcohol (PVA): Methyl Cellulose (MC) polymers incorporated with varied ratios of sodium iodide (NaI) salt. The structural and electrical behaviors of the prepared samples were studied through different characterization techniques. The amorphousness of the samples was determined by the presence of a broad hum in the XRD pattern. The semicrystalline behavior of the PVA and MC polymers is revealed by the XRD findings. The degree of crystallinity is reduced more efficiently with increasing the NaI due to the complexation between functional groups of the PVA:MC and the cations of the NaI salt. The interaction at the molecular level is evidenced by shifting peaks and variations in the strength of FTIR bands. The EIS technique has exhibited a highest ionic conductivity of 1.53 × 10⁻⁵ S/cm for a sample containing 50 wt% of NaI salt. To understand the whole electrical characteristics of the ion-conducting systems, the EIS results of each electrolyte were fitted with EECs.
The ion transport parameters, such as mobility, number density of carrier, and diffusion coefficient have found to be optimum for a highest conducting sample. The conductivity measurement was associated with the dielectric properties. At low frequencies, high dielectric constant and dielectric loss were observed. In terms of loss tangent and electric modulus plots, the relaxation behaviours of the samples are investigated.
Acknowledgments
We would like to acknowledge all support for this work by the University of Sulaimani, Charmo University and Komar University of Science and Technology.
References
- Pankaj Singh, Devesh Chandra Bharati, Horesh Kumar and A. L. Saroj, Ion transport mechanism and dielectric relaxation behavior of PVA-Imidazolium ionic liquid based polymer electrolytes, Physica Scripta
- Dong Yu, Biodegradable and Water Resistant Poly(vinyl) Alcohol (PVA)/Starch (ST)/Glycerol (GL)/Halloysite Nanotube (HNT) Nanocomposite Films for Sustainable Food Packaging. Front. Mater.. 2019;6:58. ISSN=2296-8016
- [CrossRef] [Google Scholar]
- Fourier transform infrared spectroscopy and electrical characterization of methylcellulose based solid polymer electrolyte doped with sodium iodide JurnalTeknologi. 2015;76(3):41-45.
- Solid polymer electrolytes: materials designing and all-solid-state battery applications: an overview. J Phys D Appl Phys.. 2008;41(22):223001.
- [CrossRef] [Google Scholar]
- A method based on impedance spectroscopy to determine transport properties of polymer electrolytes. PhysChemChemPhys. 2014;16:1856-1867.
- [Google Scholar]
- Polymer electrolytes for lithium ion batteries: a critical study. Ionics. 2017;23:497-540.
- [CrossRef] [Google Scholar]
- Effect of salt concentration on dielectric properties of Lion conducting blend polymer electrolytes. J Mater Sci: Mater Electron. 2018;29:17903-17920.
- [CrossRef] [Google Scholar]
- Awasthi, P.; Das, S. Reduced electrode polarization at electrode and analyte interface in impedance spectroscopy using carbon paste and paper. Rev. Sci. Instrum.2019, 90, doi:10.1063/1.5123585.
- Electrical and optical characterization of PMMA doped with Y0.0025Si0.025Ba0.9725 (Ti(0.9)Sn0.1)O3 ceramic. Chinese J PolymSci. 2010;28:537-546.
- [Google Scholar]
- Occurrence of electrical percolation threshold and observation of phase transition in chitosan (1–x):AgI x (0.05 ≤ x ≤ 0.2)-based ion-conducting solid polymer composites. Appl. Phys. A. 2016;122:706.
- [CrossRef] [Google Scholar]
- Role of dielectric constant on ion transport: Reformulated Arrhenius equation. Adv. Mater. Sci. Eng.. 2016;2016
- [Google Scholar]
- The mixed contribution of ionic and electronic carriers to conductivity in chitosan based solid electrolytes mediated by CuNt salt. J. Inorg. Organomet. Polym.. 2018;28:1942-1952.
- [Google Scholar]
- Fabrication of high performance energy storage EDLC device from proton conducting methylcellulose: dextran polymer blend electrolytes. J. Mater. Res. Technol.. 2020;9:1137-1150.
- [Google Scholar]
- Effect of High Salt Concentration (HSC) on Structural, Morphological, and Electrical Characteristics of Chitosan Based Solid Polymer Electrolytes. Polymers.. 2017;9(6):187.
- [CrossRef] [Google Scholar]
- Crystalline and amorphous phase identification from the tan_ relaxation peaks and impedance plots in polymer blend electrolytes based on [CS: AgNt] x: PEO (x–1)(10_ x _ 50) Electrochim. Acta. 2018;285:30-46.
- [Google Scholar]
- Increase of metallic silver nanoparticles in Chitosan: AgNt based polymer electrolytes incorporated with alumina filler. Results Phys.. 2019;13:102326
- [Google Scholar]
- Aziz, S.B., Kadir, M.F.Z., Hamsan, M.H. et al. Development of Polymer Blends Based on PVA:POZ with Low Dielectric Constant for Microelectronic Applications. Sci Rep 9, 13163 (2019). https://doi.org/10.1038/s41598-019-49715-8
- Employing of Trukhan Model to Estimate Ion Transport Parameters in PVA Based Solid Polymer Electrolyte. Polymers. 2019;11:1694.
- [Google Scholar]
- A conceptual review on polymer electrolytes and ion transport models. J Sci. 2018;3:1-17.
- [CrossRef] [Google Scholar]
- Ion Transport Study in CS: POZ Based Polymer Membrane Electrolytes Using Trukhan Model. Int. J. Mol. Sci.. 2019;20:5265.
- [Google Scholar]
- Study of Dielectric Properties and Ion Transport Parameters in Chitosan-Barium Nitrate Based Solid Polymer Electrolytes. Int. J. Electrochem. Sci.. 2019;14:11580-11595.
- [Google Scholar]
- Promising polymer blend electrolytes based on chitosan: Methyl cellulose for EDLC application with high specific capacitance and energy density. Molecules. 2019;24:2503.
- [Google Scholar]
- Effect of ohmic-drop on electrochemical performance of EDLC fabricated from PVA: Dextran: NH4I based polymer blend electrolytes. J. Mater. Res. Technol.. 2020;9:3734-3745.
- [Google Scholar]
- “A review of polyvinyl alcohol and its uses in cartilage and orthopedic applications” Jornal of Biomedical Materials Research Part B: Applied. Biomaterials. 2012;100B(5):1451-1457.
- [Google Scholar]
- Structural, electrical and optical characterization of pure and doped poly (vinyl alcohol) (PVA) polymer electrolyte films. Int. J. Polym. Mater. Polym. Biomater.. 2007;56(6):579-591.
- [Google Scholar]
- Spectroscopic and Electrochemical Properties of [PVA/PVP] : [MgCl26H2O] Blend Polymer Electrolyte Films. Int. J. Polym. Sci. 2018, 2018.
- [Google Scholar]
- Chitosan-PEG-NaI based bio-polymer electrolytes: Structural, thermal and ion dynamics studies. Mater. Res. Express. 2019;6
- [CrossRef] [Google Scholar]
- Green coordination chemistry as a novel approach to fabricate polymer: Cd (II)-complex composites: Structural and optical properties. Opt. Mater.. 2021;116:111062
- [Google Scholar]
- Preparation and Characterization of Polyvinyl Alcohol-Chitosan Composite Films Reinforced with Cellulose Nanofiber. Materials (Basel).. 2016 Jul 29;9(8):644. PMID: 28773763; PMCID: PMC5509094
- [CrossRef] [Google Scholar]
- Daniel, R., S. Priscilla, S. Karthikeyan, S. Selvasekarapandian, S. Madeswaran and K. Sivaji. “Structural and Electrical Studies on PVP - Pan Blend Polymer System for Energy Storage Devices.” International journal of current research and review 10 (2018): 19-24. P22(4 of 6)
- Investigation of the Environmental Stability of Poly(vinyl alcohol)-KOH Polymer Electrolytes for Flexible Zinc-Air Batteries. Front. Chem.. 2019;7(678), 22:Oct.
- [CrossRef] [Google Scholar]
- Cun-dian Gao, Jun-li Ren, Shuai-yang Wang, Run-cang Sun, Li-hong Zhao, “Preparation of Polyvinyl Alcohol/Xylan Blending Films with 1,2,3,4-Butane Tetracarboxylic Acid as a New Plasticizer”, Journal of Nanomaterials, vol. 2014, ArticleID 764031, 8 pages, 2014. https://doi.org/10.1155/2014/764031
- Investigation of ion transport parameters and electrochemical performance of plasticized biocompatible chitosan-based proton conducting polymer composite electrolytes. Membranes (Basel).. 2020;10:1-27.
- [CrossRef] [Google Scholar]
- Role of nano-capacitor on dielectric constant enhancement in PEO:NH4SCN:xCeO2 polymer nano-composites: Electrical and electrochemical properties. J. Mater. Res. Technol.. 2020;9:9283-9294.
- [CrossRef] [Google Scholar]
- Electrochemical impedance study of proton conducting polymer electrolytes based on PVC doped with thiocyanate and plasticized with glycerol. Int. J. Electrochem. Sci.. 2020;15:4671-4683.
- [Google Scholar]
- Conductivity and dielectric behavior of PVA based solid nanocomposite polymer electrolytes. Solid State Commun. 2012;152:426-434.
- [Google Scholar]
- Ion pair formation and its effect in PEO: Mg solid polymer electrolyte system. J. Power Sources. 2002;109(2):340-346.
- [CrossRef] [Google Scholar]
- Acrylamide modified poly(vinyl alcohol): Crystalline and enhanced water solubility. RSC Adv.. 2015;5:86598-86605.
- [Google Scholar]
- Effect of 1-ethyl-3-methylimidazolium nitrate on the electrical properties of starch/chitosan blend polymer electrolyte. Mater. Sci. Forum. 2016;846:510-516.
- [CrossRef] [Google Scholar]
- Kim, B.K., Sy, S., Yu, A. and Zhang, J. (2015). Electrochemical Supercapacitors for Energy Storage and Conversion. In Handbook of Clean Energy Systems, J. Yan
- Kotobuki, M. (2020). Polymer Electrolytes. In Polymer Electrolytes (eds T. Winie, A.K. Arof and S.Thomas). https://doi.org/10.1002/9783527805457.ch1 P5 (20 of 417)
- LiClO4-doped plasticized chitosan as biodegradable polymer gel electrolyte for supercapacitors. J. Appl. Polym. Sci.. 2009;114:2445-2454.
- [CrossRef] [Google Scholar]
- The effects of cations and anions on the ionic conductivity of poly[bis(2-(2-methoxyethoxy)ethoxy)phosphazene] doped with lithium and magnesium salts of trifluoromethanesulfonate and bis(trifluoromethanesulfonyl)imidate. Solid State Ionics. 2010;181:1721-1726.
- [CrossRef] [Google Scholar]
- Advanced Energy Storage Devices: Basic Principles, Analytical Methods, and Rational Materials Design. AdvSci (Weinh).. 2017 Nov 15;5(1):1700322.
- [CrossRef] [Google Scholar]
- Enhanced dielectric properties of green synthesized Nickel Sulphide (NiS) nanoparticles integrated polyvinylalcohol nanocomposites. Mater. Res. Express. 2020;7:064007
- [Google Scholar]
- Natural polymer based cling films for food packaging. Int. J. Pharm. Pharm. Sci.. 2015;7:10-18.
- [Google Scholar]
- Structural, Morphological, Electrical and Electrochemical Properties of PVA:CS-Based Proton-Conducting Polymer Blend Electrolytes. Membranes. 2020;10:71.
- [Google Scholar]
- A broad spectrum analysis of the dielectric properties of poly(2-hydroxyethyl methacrylate) Polymer. 2005;46:3847-3855.
- [Google Scholar]
- Preparation, structural analysis, morphological investigation and electrical properties of gold nanoparticles filled polyvinyl alcohol/carboxymethyl cellulose blend. J Mater Res Technol. 2019
- [CrossRef] [Google Scholar]
- Improving biodegradability of polyvinyl alcohol/starch blend films for packaging applications. International Journal of Basic and Applied Sciences. 2014;3:263-273.
- [Google Scholar]
- A review of polymer electrolytes: fundamental, approaches and applications. Ionics. 2016;22(8):1259-1279.
- [CrossRef] [Google Scholar]
- Olewnik-Kruszkowska, Ewa et al. “Antibacterial Films Based on PVA and PVA-Chitosan Modified with Poly(Hexamethylene Guanidine).” Polymers vol. 11,12 2093. 13 Dec. 2019, doi:10.3390/polym11122093
- OmedGh. Abdullah, Shujahadeen B. Aziz, Mariwan A. Rasheed, Structural and optical characterization of PVA:KMnO4 based solid polymer electrolyte, Results in Physics,Volume 6,2016, Pages 1103-1108, ISSN 2211-3797,https://doi.org/10.1016/j.rinp.2016.11.050.
- Recent progress in supercapacitors based on the advanced carbon electrodes. Nanotechnology Reviews. 2019;8(Issue 1):299-314.
- [CrossRef] [Google Scholar]
- Ruckenstein, E, Thermal and dynamic mechanical analyses of PVA/MC blend hydrogels. Polymer. 2001;42:4271-4280.
- [Google Scholar]
- Preparation and characterization of pva based solid polymer electrolytes for electrochemical cell applications. Chin J PolymSci. 2013;31(4):641-648.
- [CrossRef] [Google Scholar]
- Studies of Dielectric Relaxation and AC Conductivity Behavior of Plasticized Polymer Nanocomposite Electrolytes. Int. J. Electrochem. Sci.. 2008;3:597-608.
- [Google Scholar]
- Dielectric relaxations and transport properties parameter analysis of novel blended solid polymer electrolyte for sodium-ion rechargeable batteries. J. Mater. Sci.. 2019;54:7131-7155.
- [CrossRef] [Google Scholar]
- Investigations on the effect of various plasticizers in PVA–PMMA solid polymer blend electrolytes. Mater. Lett.. 2004;58:641-649.
- [Google Scholar]
- Dielectric and electromagnetic interference shielding properties of carbon black nanoparticles reinforced PVA/PEG blend nanocomposite films. Mater. Res. Express. 2020;7(6):064008.
- [CrossRef] [Google Scholar]
- Structural, dielectric and EMI shielding properties of polyvinyl alcohol/chitosan blend nanocomposites integrated with graphite oxide and nickel oxide nanofillers. J. Mater. Sci.: Mater. Electron.. 2021;32(1):764-779.
- [CrossRef] [Google Scholar]
- Rani, P., Ahamed, B., & Deshmukh, K. (2020). Electromagnetic interference shielding properties of graphene quantum‐dots reinforced poly(vinyl alcohol)/polypyrrole blend nanocomposites. Journal of Applied Polymer Science, 49392. doi:10.1002/app.49392
- Structural, thermal, and electrical studies of sodium iodide (NaI)-doped hydroxypropyl methylcellulose (HPMC) polymer electrolyte films. Ionics. 2014;20:201-207.
- [CrossRef] [Google Scholar]
- Rina Afiani Rebia, SélèneRozet, Yasushi Tamada, Toshihisa Tanaka,Biodegradable PHBH/PVA blend nanofibers: Fabrication, characterization, in vitro degradation, and in vitro biocompatibility, Polymer Degradation and Stability,Volume 154,2018,Pages 124-136, ISSN 0141-3910, https://doi.org/10.1016/j.polymdegradstab.2018.05.018.
- Dielectric properties of polyvinyl alcohol (PVA) nanocomposites filled with green synthesized zinc sulphide (ZnS) nanoparticles. J. Mater. Sci.: Mater. Electron.. 2019;30(5):4676-4687.
- [CrossRef] [Google Scholar]
- Green chemistry mediated synthesis of cadmium sulphide/polyvinyl alcohol nanocomposites: Assessment of microstructural, thermal, and dielectric properties. Polym. Compos.. 2020;41(5):2054-2067.
- [CrossRef] [Google Scholar]
- Petr Bˇelský, Tomáš Kováˇrík, Jaroslav Kadlec, Mina Ghafouri Azar, Rostislav Medlín, Veronika Vavruˇnková, Kalim Deshmukh and Kishor Kumar Sadasivuni, Study on Structure, Thermal Behavior, and Viscoelastic Properties of Nanodiamond-Reinforced Poly (vinyl alcohol) Nanocomposites. Polymers. 2021;13(9):1426.
- [CrossRef] [Google Scholar]
- Ion conducting mechanism of carboxy methylcellulose doped with ionic dopant salicylic acid based solid polymer electrolytes. Int J ApplSciTechnol. 2012;2:113-121.
- [Google Scholar]
- Effect of High Ammonium Salt Concentration and Temperature on the Structure, Morphology, and Ionic Conductivity of Proton-Conductor Solid Polymer Electrolytes Based PVA. Membranes.. 2020;10(10):262.
- [CrossRef] [Google Scholar]
- Strategies for fast ion transport in electrochemical capacitor electrolytes from diffusion coefficients, ionic conductivity, viscosity, density and interaction energies based on HSAB theory. RSC. Advances. 2017;7(24):14528-14535.
- [CrossRef] [Google Scholar]
- Low frequency dielectric relaxation processes and ionic conductivity of montmorillonite clay nanoparticles colloidal suspension in poly(vinyl pyrrolidone)-ethylene glycol blends. Express Polym. Lett.. 2008;2:800-809.
- [Google Scholar]
- Senna, M., Helal, R., Mostafa, T., El-Naggar, A. (2018). 'Thermal Decomposition Properties of Gamma-Irradiated Polyvinyl Alcohol (PVA)/Methyl Cellulose (MC) Blends', The International Conference on Chemical and Environmental Engineering, 9(9th International Conference on Chemical & Environmental Engineering), pp. 339-357. doi: 10.21608/iccee. 2018.34676
- Conductivity relaxation in Ag+ ion conducting PEO–PMMA–PEG polymer blends. Ionics. 2013;19:301-307.
- [Google Scholar]
- Effect of SiO2 Nano-particles on Plasticized Polymer Blend Electrolytes: Vibrational, Thermal, and Ionic Conductivity Study. Polymer-Plastics Technology and Materials. 2020;1–8
- [CrossRef] [Google Scholar]
- Vibrational, thermal and ion transport properties of PVA-PVP-PEG-MeSO4Na based polymer blend electrolyte films. J Non-Cryst Solids. 2018;494:21-30.
- [Google Scholar]
- Physicochemical and morphological evaluation of chitosan/poly(vinyl alcohol)/methylcellulose chemically cross-linked ternary blends. Polym. Bull.. 2012;68(5):1387-1393.
- [CrossRef] [Google Scholar]
- Structural, thermal, vibrational, and electrochemical behavior of lithium ion conducting solid polymer electrolyte based on poly(vinyl alcohol)/poly(vinylidene fluoride) blend. Polym. Sci. Ser. A. 2016;58:776-784.
- [CrossRef] [Google Scholar]
- Preparation and Characterization of Biopolymer Blends Based on Polyvinyl Alcohol and Starch. Romanian Biotechnological Letters. 2015;20(20):10306-10315.
- [Google Scholar]
- Biopolymers based on renewable resources—A review. Sci. Bull. Ser. F Biotechnol.. 2014;18:188-195.
- [Google Scholar]
- Conductivity and dielectric studies of Li 2SnO 3. Ionics. (Kiel).2012,;18:655-665.
- [CrossRef] [Google Scholar]
- Determination of the degree of crystallinity of poly(vinyl alcohol) by FTIR spectroscopy. J. Appl. Spectrosc.. 2012;79(4):521-526.
- [Google Scholar]
- Electrochemical capacitors: Mechanism, materials, systems, characterization and applications. Chem. Soc. Rev.. 2016;45:5925-5950.
- [Google Scholar]
- Impedance spectroscopy and conductivity studies of KCl-doped solid electrolyte. J TheorApplPhys. 2018;12:141-146.
- [CrossRef] [Google Scholar]
- Effect of oleic acid plasticizer on chitosan-lithium acetate solid polymer electrolytes. Eur. Polym. J.. 2003;39:897-902.
- [CrossRef] [Google Scholar]
- Review on Polymer-Based Composite Electrolytes for Lithium Batteries. Front. Chem.. 2019;7:522.
- [CrossRef] [Google Scholar]
- Plasticized solid polymer electrolyte based on natural polymer blend incorporated with lithium perchlorate for electrical double-layer capacitor fabrication. Ionics 2019
- [CrossRef] [Google Scholar]
- Marco Zeiger, Simon Fleischmann, Benjamin Krüner, Aura Tolosa, Stephan Bechtel, Mathias Baltes, AnnaSchreiber, RikoMoroni, SeverinVierrath, Simon Thiele, Volker Presser. Influence of carbon substrate on the electrochemical performance of carbon/manganese oxide hybrids in aqueous and organic electrolytes. RSC Advances 2016, 6 (109) , 107163-107179. https://doi.org/ 10.1039/ C6RA24181F
- Zhong, Cheng, Yida Deng, Wen-bin Hu, JinliQiao, Lei Zhang and J. Zhang. “A review of electrolyte materials and compositions for electrochemical supercapacitors.” Chemical Society reviews 44 21 (2015): 7484-539 . p11 (9 of 58)
- Zhu, Guoquan, Wang, Fagang, Xu, Kejing, Gao, Qiaochun, & Liu, Yuying. (2013). Study on properties of poly(vinyl alcohol)/polyacrylonitrile blend film. Polímeros, 23(2), 146-151. Epub April 16, 2013. https://doi.org/10.4322/polimeros.2013.076.


