

Translate this page into:
Structural, optical and photocatalytic properties under UV-A and visible lights of Co–, Ni- and Cu-doped ZnO nanomaterials. Comparative study
⁎Corresponding author. o.zegaoui@umi.ac.ma (Omar Zegaoui),
-
Received: ,
Accepted: ,
This article was originally published by Elsevier and was migrated to Scientific Scholar after the change of Publisher.
Peer review under responsibility of King Saud University.
Abstract
In this investigation, Co–, Ni- and Cu-doped ZnO nanoparticles were prepared using precipitation methods. The characterization of the as-prepared nanomaterials was carried out using XRD, FT-IR, DRS, XPS and SEM. The XRD analysis showed that the insertion of foreign metal ions into the matrix of ZnO caused a slight shift of the positions of (1 0 0), (0 0 2) and (1 0 1) diffraction peaks of ZnO towards the lower 2θ, by comparison with pure ZnO. The DRS results showed that Co-doped ZnO nanoparticles absorb wavelengths higher than 400 nm. The estimated band gaps (eV) were 2.48, 3.17 and 3.14 for 10 %Co-ZnO, 10 %Ni-ZnO and 10 %Cu-ZnO respectively. The XPS results showed the existence of two valence states for Co and Ni (Co2+/Co3+ and Ni2+/Ni3+) while Cu exists in the form of Cu2+. The photocatalytic efficiency was evaluated under UV and visible irradiations in aqueous solution using methyl orange (MO) as an organic pollutant probe molecule. The results showed that, under visible light, the MO degradation increased significantly by doping ZnO (10 %Co-ZnO: 33.2 %; 10 %Ni-ZnO: 19.8 % and 10 %Cu-ZnO: 52.5 %) by comparison with undoped ZnO (9.3 %). The important increase in photocatalytic activity observed for the doped ZnO by comparison with pure ZnO, particularly for 10 %Cu-ZnO, has been linked to a synergistic effect of both the band gap narrowing and the increase in the lifetime of photogenerated charge carriers.
Keywords
ZnO
Metal ion doping
Photocatalytic degradation
Azo-dye
Visible light

1 Introduction
The main sources of aquatic pollution come from the discharge of industrial wastes such as those from the synthetic dyes (azo-dyes) or the production of pesticides, herbicides, … These discharged organic compounds are often resistant to the biodegradation, and thereby pose a threat to humans and the aquatic organisms (Samadi et al., 2016; Wang,C.C. et al., 2014). One of the most promising environmentally friendly and low-cost way for the treatment of these wastwaters is their epuration using advanced oxidative processes such as heterogeneous photocatalysis under UV and visible light (Abebe et al., 2023a; Abebe et al., 2023b; Belver et al., 2019; Byrne et al., 2015; Kisch, 2013; Liu et al., 2020; Mohaghegh et al., 2023; Ohtani et al., 2010; Tsao et al., 2021; Wong et al., 2020). It is well known that the heterogeneous photocatalysis is based on the irradiation of a semiconductor (e.g: metal oxide, chalocogenides) by radiation with an energy at least equal to that of the band gap. The electrons (e-) are then excited from the valence band (VB) to the conduction band (CB) leaving thus holes (h+) in the VB. The generated (e-/h+) pairs (Jin et al., 2018) can react with adsorbed molecules (e.g.: water, oxygen, hydroxyl groups) to form oxidizing radicals like hydroxyl radical (OH•) and superoxide anion (O2•-) (Moreira et al., 2017). Afterwards, a succession of reactions is initiated to produce hydroperoxyl radical, then H2O2 and OH•. These oxidative species as well as the photogenerated holes are involved in the degradation of the pollutants (Moreira et al., 2017). On the other hand, it has been reported in the literature (Colmenares and Xu, 2016; Pichat, 2016) that the crystalline structure, the morphology, the solid-state defects, the pH, the lifetime of the charge carriers, etc affect the photocatalytic effectiveness of a photocatalyst. However, the inability to absorb visible light and the fast recombination of photo-generated (e-/h+) pairs are the two main problems to be overcome in order to use metal oxide semiconductors as photocatalysts in the visible range.
Among the various metal oxide semiconductors used as photocatalysts, pure or modified ZnO nanomaterials has been widely studied for water and wastewater treatment (Abebe et al., 2023a; Abebe et al., 2023b; Deepthi et al., 2023; Santos et al., 2023; Abebe et al., 2022; Iqbal et al., 2021; Samadi et al., 2016). In fact, ZnO exhibits suitable optical and electronic properties, high redox potential, non-toxicity, and low-cost (Deng et al., 2020). It received a special attention due to its environmental friendliness, thermal and chemical stability, etc (Deng et al., 2020). However, due to its wide band gap (Eg = 3.1–3.32 eV) (Daou et al., 2017; Wang et al., 2019), the photo-response of ZnO photocatalysts under solar radiation still very weak (Wang, Z. et al., 2014; Kisch et al., 2013). To overcome these drawbacks, numerous researches including dye sensitization, doping ZnO with metals ions and non-metals, and modifying its surface have been published (Abebe et al., 2023a; Abebe et al., 2023b; Kedir et al., 2023; Abebe et al., 2022; Aadnan et al., 2022; Samadi et al., 2016; Li and Wu, 2015). On the other hand, synthesis heterostructures by integrating two or more materials at the nanoscal level such as p-n junctions, n-n heterostructures, p-p heterostructures, Schottky junctions, Janus structures, type II heterostructures, and Z-scheme heterostructures have been reported (Iqbal et al., 2021; Tsao et al., 2021; Liu et al., 2020; Yuan et al., 2014; Pang et al., 2014). On the other hand, doping of ZnO with metal ions can cause a reduction in the bandgap by generating intermediate energy levels (IEL) and makes it a visible-light-active photocatalyst (Aadnan et al., 2022; Lv et al., 2019; Ravichandran et al., 2018; Thi and Lee, 2017). It has been reported that the interaction between s–d and p–d orbitals by doping ZnO with metal ions significantly alters the optical properties of ZnO (Baylan and Altintas Yildirim, 2019). In this topic, the present work tends to bring some clarifications about the effect of the nature of the metal ion on the structural, optical, morphological, and photocatalytic properties of the synthesized metal-doped ZnO nanomaterials. In general, the commonly used transition-metal as dopant elements have often non-full d or f orbitals (Peng et al., 2013). Herein,the The used transition metals (Co: 3d74s2, Ni: 3d84s2 and Cu: 3d104s1) belong to the fourth period of the periodic table. The substitution of Zn2+ in ZnO crystal lattice by metal ions may improve the optical properties of the doped ZnO. This has been explained by the formation of intermediate energy levels (IEL) and/or by the narrowing of the band gap (Aadnan et al., 2022; Yang et al., 2016). Indeed, when the IEL are just below the conduction band minimum (CBM), the excited electrons are quenched but the holes are not. However, if the IEL are just above the valence band maximum (VBM), an opposite situation takes place (Aadnan et al., 2022; Yang et al., 2016). In a previous paper, Aadnan et al. (2022) have studied the influence of the Mn loading on the physicochemical and photocatalytic properties of ZnO. The results highlighted that a substitution of Zn2+ by Mn2+/Mn3+ in ZnO occurred, and the best photocatalytic activity towards methyl orange (MO) degradation in the presence of Mn-ZnO nanomaterials is obtained by using 10 wt% of Mn. Therefore, the major goal of the present investigation is to report the influence of the modification of ZnO by doping it with 10 wt% of Co, Ni and Cu on its structural, optical and photocatalytic properties. The synthesis of the nanoparticles was made using precipitation methods. The prepared nanomaterials were calcined at 500 °C for 3 h and characterized using X-ray diffraction (XRD), Fourier-transform infrared (FT-IR) spectroscopy, UV–Vis diffuse reflectance spectroscopy (DRS), scanning electron microscopy (SEM) and X-ray photoelectron spectroscopy (XPS). The UV and visible light photocatalytic capabilities of the prepared nanomaterials were evaluated using methyl orange, as a typical azo dye, in an aqueous solution. As it is well known, MO is widely used in chemical, textile and paper industries (Selvaraj et al., 2021). This type of dye is harmful to the environment because it contains –N = N– bond in association with aromatic structures containing (–OH) and (–SO3H) functional groups. The combination of these various functional groups makes the azo dye molecules more recalcitrant to remove from the industrial liquid effluents (Selvaraj et al., 2021).
2 Materials and methods
2.1 Chemicals
All chemicals are analytical grade and were used in this work without purification. Zn(CH3COO)2·2H2O (Scharlau Chemie, Spain; purity = 99 %), CoCl2·6H2O (Sigma Aldrich Chemicals, USA, purity > 99.99 %), NiCl2·6H2O (Lobachemie reagents, India; purity > 97 %), Cu(CH3COO)2·H2O (Sigma Aldrich Chemicals, USA, purity: 99 %), Methyl orange (C14H14N3NaO3S; Fisher Scientific International Company, USA; purity > 95 %) and Sodium hydroxide (Fisher Scientific International Company, USA; purity > 98 %). Deionized water was used in all experiments.
2.2 Procedures
2.2.1 Preparation of undoped and doped ZnO
In the present investigation, ZnO and 10 %M−ZnO nanomaterials (M = Co, Ni and Cu) have been elaborated using precipitation methods following the same procedures reported by Aadnan et al. (2022) and El Mragui et al. (2019b). Briefly, ZnO nanoparticles were synthesized by dissolving Zinc acetate (24.3 g) in distilled water (100 mL). After that, a molar solution of NaOH (20 mL) was added dropwise to the solution at 70 °C while maintaining a constant agitation. The obtained precipitate was filtered, washed three times using distilled water, and dried overnight in an oven at 100 °C. Regarding the preparation of 10 %M−ZnO nanomaterials, an aqueous suspension of ZnO was prepared following the same procedure described above. Simultaneously, the required amounts of the CoCl2 (3.17 g), NiCl2 (3.18 g) and Cu(CH3COO)2·H2O (2.51 g) were dissolved separately in deionized water under constant stirring to which molar sodium hydroxide solutions were added dropwise at 70 °C. Then, the solutions were continuously stirred for 90 min. The obtained solutions were added dropwise to the solutions of ZnO while respecting the desired weight percent (10 wt%) of the doping elements. The resulting suspensions containing 10 %M−ZnO were left under stirring for 2 h, then filtered and washed with deionized water and dried overnight in an oven at 100 °C. All of the obtained nanomaterials were ground and calcined at 500 °C for 3 h.
2.2.2 Characterization of materials
X-ray diffraction (XRD) (X’PERT MPD_PRO Malvern Panalytical Ltd., UK). Fourier-transform infra-red (FT-IR) spectrometer (JASCO 4100 Jasco International, Japan), diffuse reflectance spectroscopy (DRS) (JASCO V-570 Jasco International, Japan), X-ray photoelectron spectroscopy (XPS) (Kratos AXIS Ultra HAS Japan) and scanning electron microscopy (Quanta 200 from FEI Company, Hillsboro, USA) were used for the structural, optical, chemical states and morphological characterization of the synthesized samples.
2.2.3 Photocatalytic degradation experiments
The photocatalytic effectiveness of the prepared photocatalysts was studied using methyl orange at room temperature (about 26 °C) under UV-A and visible lights. The UV-A and visible lights radiations were provided using a low-pressure lamp (40 W, VL-340.BL) and a commercial Feit White Compact Fluorescent lamp (23 W, cool daylight, 6500 K), respectively. The lamps were positioned at about 10 cm above a Batch reactor (250 mL) containing a MO aqueous solution (10−5 M) and 0.5 g/L of photocatalyst. The pH of the solution was adjusted to 4 by 0.1 mol/L of HCl. Prior to lighting the lamps, the solution containing catalyst and the pollutant was stirred in the dark for 30 min to reach adsorption/desorption equilibrium. For experiments under visible light, the UV radiations (λ < 400 nm) were cut-off by placing an aqueous solution containing 0.73 M of NaNO2 (Aadnan et al., 2022) between the visible lamp and the reactor. At preset time intervals, samples were taken using a syringe and filtered through a 0.45 μm Millipore filter. The MO removal percentage was calculated from dye concentration monitored using a UV–vis spectrophotometer (Shimadzu 2100) at the wavelength of maximum absorbance of MO (λmax = 464 nm). The MO removal and the apparent pseudo-first-order rate constant (kap) from the Langmuir–Hinshelwood kinetic model were calculated using Equations (1) and (2) (Aadnan et al., 2022), respectively:
2.2.4 Identification of the active species
The radical-quenching experiments were carried out using electron (e-) scavenger (K2S2O8: 10-2 M) (Ajmal et al., 2014), hydroxyl radical (OH•) scavenger (isopropyl alcohol:10-2 M) (Qiu et al., 2019) and hole (h+) scavenger (KI:10-2 M) (Jin et al., 2018).
3 Results and discussion
3.1 Characterization
3.1.1 XRD analysis
The XRD spectra of Co–, Ni-, and Cu-doped ZnO (Fig. S1) display peaks belonging to the hexagonal wurtzite ZnO phase (JCPDS file N°: 01–075-0576) along with low intensity peaks revealing the presence of Co3O4 (JCPDS file N°: 43–1003), NiO (JCPDS file N°: 01–071-1179), and CuO (JCPDS file N°:048–1548; Abebe et al., 2023b), respectively. Moreover, compared with undoped ZnO, the positions of the (1 0 0), (0 0 2) and (1 0 1) diffraction peaks of the Co–, Ni- and Cu-doped ZnO materials shifted towards the lower 2θ (Fig. 1). Analogous behavior was reported for Mn-ZnO (Aadnan et al., 2022). This suggests that a replacement of Zn2+ by the doping elements was happened causing an increase in the lattice parameters due to the difference in the ionic radii of Zn2+ (0.74 Å) (Aadnan et al., 2022; Basnet et al., 2021), Co2+ (0.72 Å) (Kabbur et al., 2018), Ni2+ (0.69 Å) (Mugundan et al., 2015) and Cu2+ (0.73 Å) (Sivakumar et al., 2022), as showed in Table 1. Several authors such as Aadnan et al. (2022), Basnet et al. (2021) and Kumar et al. (2016) have reported that doping ZnO with Mn caused a significant shift of XRD peaks towards higher or lower 2θ. They linked this behavior to the lattice distortion of the ZnO provoked by the heterogeneous distribution of Mn2+ into the crystal structure (Basnet et al., 2021; Kumar et al., 2016).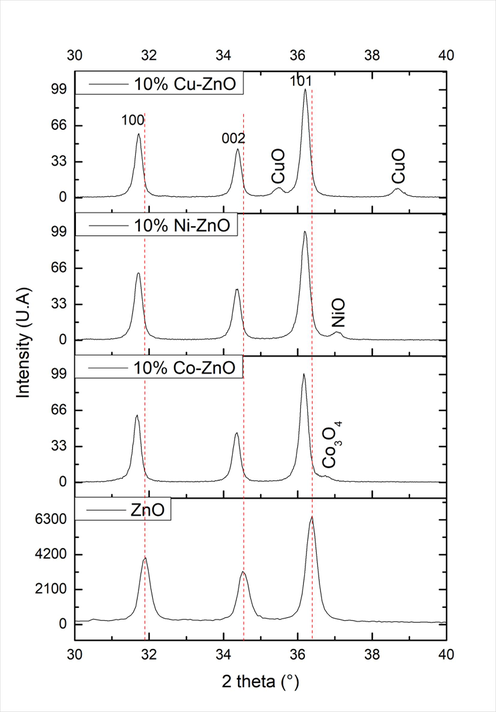
XRD patterns of pure and doped-ZnO nanomaterials.
Lattice parameters
Sample
2θ(°)
dhkl (nm)
a (nm)
c (nm)
ZnO
34.530
0.25954
0.2997
0.5191
10 %Co-ZnO
34.360
0.26079
0.3011
0.5216
10 %Ni-ZnO
34.370
0.26071
0.3010
0.5214
10 %Cu-ZnO
34.380
0.26064
0.3010
0.5213
3.1.2 FT-IR analysis
Fig. 2 shows that all the spectra of the analyzed samples exhibit two strong overlapped bands appearing at about 450 and 500 cm−1 which can be attributed to ZnO wurtzite (El Mragui et al., 2019a) and (Zn, metal)-O stretching modes (Kumar and Pandey, 2016; Soni et al., 2013). The band at 500 cm−1 may be also associated with oxygen deficiency and/or oxygen vacancy defect complex in ZnO (Yan et al., 2016). From the FT-IR spectra of Fig. 2 (inset), it is observed that the intensity of the band at 450 cm−1 decreases while that at 500 cm−1 increases by doping ZnO suggesting that the incorporation of doping metal ions favors the creation of oxygen vacancy defects (Yan et al. (2016). A Similar observation has been reported for Mn-ZnO (Aadnan et al., 2022) for which the band at 500 cm−1 increased when the weight percent of Mn increased in the sample from 1 to 10 %, meanwhile the band at 450 cm−1 decreased. Other FT-IR bands at about 1440 and 1540 cm−1 are also observed (Fig. 2) and attributed to the residual acetate groups stemming from zinc acetate precursor (Daou et al., 2017). The bands at about 3440 and 1640 cm−1 observed in all spectra (Fig. 2) are due to the stretching and bending vibrations, respectively of the O–H in the H2O adsorbed on the surface of the solids (Daou et al., 2017). On the other hand, the spectrum of 10 %Co-ZnO shows two very weak bands at 680 and 597 cm−1 which are due to the vibration of O-Co-O (in Co3O4) and Co3+-O (Harish Kumar et al., 2017; Kumar and Pandey, 2016; Fouad et al., 2011), respectively. These results confirm the presence of Co3+ in the solids in metal oxide form, and confirm the XRD results.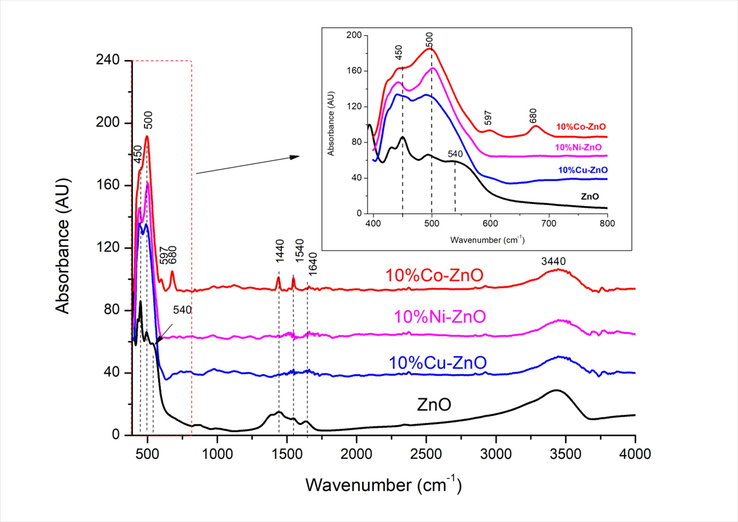
FT-IR spectra of undoped and doped ZnO nanomaterials.
3.1.3 UV–Vis diffuse reflectance spectroscopy (DRS)
The optical properties of the synthesized photocatalysts were probed by DRS. As observed in Fig. 3, the spectra of the analyzed nanomaterials exhibit strong absorption in ultraviolet region (λ ≤ 370 nm). This indicates that all of these materials can absorb wavelengths below 370 nm. However, Fig. 3 shows that between 370 and 400 nm, the absorbency decreases sharply for ZnO (−48 %) and for 10 %Ni-ZnO (−63 %) when the wavelength increases up to 400 nm while that of the solids containing Co and Cu, it only loses 4 and 27 % respectively. These results indicate that Co– and Cu-doped ZnO can absorb efficiently UV-A light up to 400 nm. Their absorbance in this spectral domain is in the order: Co-ZnO > Cu-ZnO > ZnO > Ni-ZnO. Furthermore, the spectrum of Co-ZnO exhibits an absorption tail in the visible light region (λ > 400 nm) unlike ZnO. Analogous results were reported for Mn-ZnO nanomaterials (Aadnan et al., 2022). This result confirms that the undoped ZnO does not absorb above 400 nm and, the optical features clearly depend on the type of the doping metal ion. The optical comportment of Co-ZnO observed between 400 and 500 nm suggests a potential modification of the photocatalytic effectiveness of these photocatalysts under visible light. The calculation of the band-gap energies (Eg) has been made by plotting (αhν)n = A(hν-Eg), where A is a proportionality constant, α is the linear absorption constant, h is the Planck’s constant, and n = 2 and 0.5 for direct and indirect band-gap transition respectively (Shahsavandi et al., 2022; Naseeb et al., 2021; El Mragui et al., 2019a; Budigi et al., 2015). The inset of Fig. 3 shows the plots of (αhν)2 versus hν assuming a direct band-gap transition for all samples (El Mragui et al., 2019a; Budigi et al., 2015). The extrapolation of the linear region of the curves to α = 0 (the intercept of the extrapolation of the linear part of the curve with the hν axis) gives the Eg values. The obtained Eg values (Table 2) clearly show that doping ZnO strongly affects the band gap energy. Indeed, the Eg value decreases by doping ZnO with Co while it increases when Cu and Ni were used.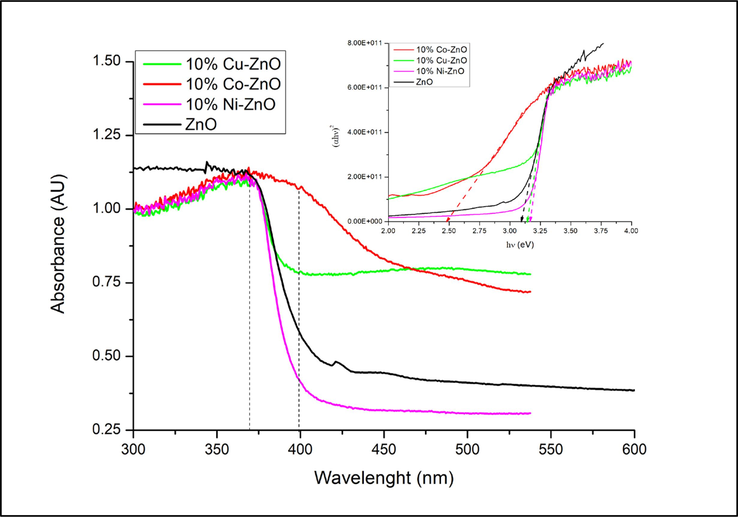
Diffuse reflectance spectra and Tauc’s plots (figure inset) of doped and undoped ZnO nanomaterials.
Sample
Eg (eV)
UV light
Visible light
MO removal (%)
Rate constant kap (min−1)
R2
MO removal (%)
Rate constant kap (min−1)
R2
ZnO
3.09
74.3(3 3 0)2
0.0035
0.9731
9.3(3 3 0)2
0.0006
0.8011
10 %Co-ZnO
2.48
26.7(3 3 0)2
0.0029
0.8311
33.2(4 5 0)2
0.0042
0.9491
10 %Ni-ZnO
3.17
18.8(3 3 0)2
0.0018
0.8211
19.8(3 9 0)2
0.0047
0.9171
10 %Cu-ZnO
3.14
45.6(3 9 0)2
0.0022
0.9711
52.5(4 5 0)2
0.0021
0.9751
3.1.4 XPS analysis
The valences of the metal ions on the surfaces of the prepared nanomaterials were analyzed by XPS. The full scan spectra (Fig. S2) clearly show the presence of Zn, O, Co, Ni, Cu, C, and the Na in the samples. Na comes from NaOH used as precipitation agent. In Fig. S3, the Zn2p doublet peaks at 1021 eV and 1044.1 eV are identical to the binding energies of Zn2p1/2 and Zn2p3/2 respectively, thereby verifying the presence of Zn2+ in the composite (Tkachenko et al., 2023). Fig. S4 shows the high resolution O1s spectra obtained for all studied samples. The deconvolution of the O1s spectra evidenced the presence of three peaks for all samples at about 529.8, 531.0 and 531.8 eV which are due to the O2– ions in wurtzite structure of hexagonal Zn2+ ion array, to the oxygen vacancies (V0) in the oxygen-deficient regions within the ZnO matrix, and to the adsorption of various kinds of O2 (Tkachenko et al., 2023; Aadnan et al., 2022; Gao et al., 2016), respectively. Figs. S4 shows also that the area of the peak of oxygen vacancies (V0) (at about 531.0 eV) increased markedly for the doped ZnO materials by comparison with pure ZnO (8.5 % (Aadnan et al., 2022)). This result highlights that the number of oxygen vacancies increases by doping ZnO and depends on the nature of the doping element. Therefore, the sample 10 %Cu-ZnO (Fig. S4c) exhibits the highest percentage of V0 (66.8 %) followed by Ni-ZnO (Fig. S4b: 57 % of V0) and Co-ZnO (Fig. S4a: 35.3 % of V0). The XPS spectrum of Co2p presented in Fig. 4a shows four peaks at 780, 785.4,795.9 and 802.8 eV. Those at 780 and 785.4 eV are related to Co2p3/2 of Co(OH)2 and Co3O4 (Yang et al., 2010), and those at 795.9 and 802.8 eV are associated with Co2p1/2 of Co(OH)2 and/or Co3O4 (Yang et al., 2010). The peak at 780 eV may be dissociated into two peaks centered at 779.8 (Co2p3/2 of Co(OH)2) and 781 eV (Co2p3/2 of Co3O4) respectively (Kim et al., 2017). Therefore, these results highlighted two oxidation states of Co (Co2+ and Co3+) (El Mragui et al., 2021). These results corroborate those obtained by XRD and FT-IR analyses. Fig. 4b shows the Ni2p core-level spectrum of Ni-doped ZnO nanomaterial. Its deconvolution reveals the presence of five binding energy positions at around 853, 855, 860, 872 and 879.6 eV. Those at around 855 and 872 eV correspond to Ni2p3/2 and Ni2p1/2 signals respectively, which match exactly with the reported values of NiO (Tkachenko et al. 2023). They are accompanied by satellites at around 860 and 879.6 eV which highlights the presence of Ni in the form of oxide and hydroxide phases (Abdel-wahab et al., 2016). The presence of the peak at 855 eV reveals the existence of Ni3+ (in Ni2O3 phase) along with Ni2+ (in NiO phase) as reported by Chen et al. (2012) and Yan et al. (2011). These results highlight that Ni exists in the solid under two oxidation states Ni2+ and Ni3+. The spectrum of Cu2p (Fig. 4c) shows two peaks at 953 eV and 932.9 eV which may be assigned to Cu2+2p1/2 and Cu2+2p3/2 respectively (Khan et al., 2020). In addition, two shake-up peaks appearing on the spectrum demonstrate the formation of CuO in accordance with the XRD and FT-IR results. Analogous results were reported by Khan et al. (2020) and Shinde et al. (2014) who reported that the presence of these shake-up peaks suggests the existence of an unfilled orbital d (3d9) and confirms the presence of Cu2+ in the sample.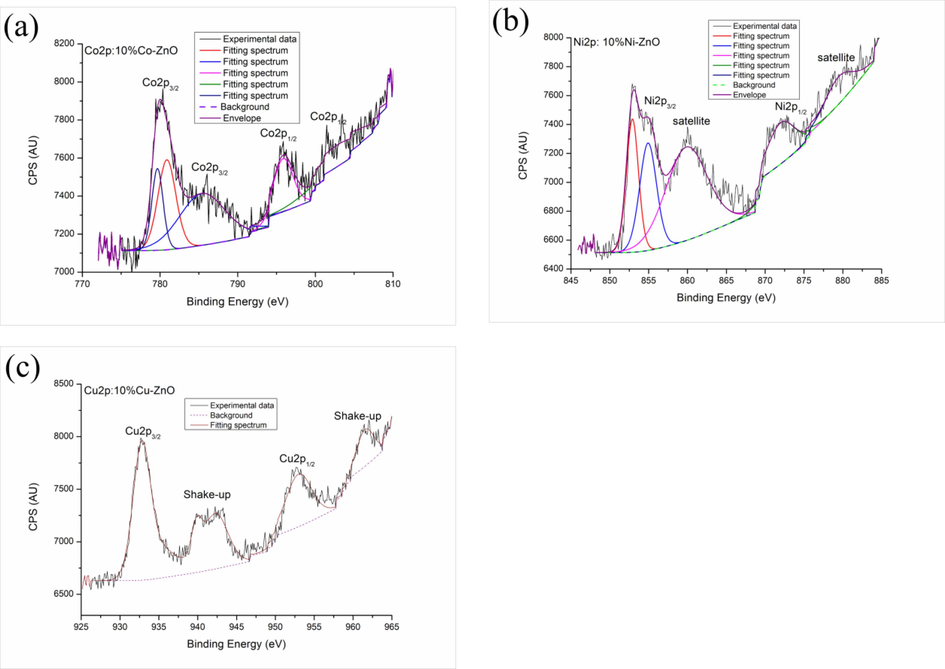
High-resolution XPS spectra of Co2p (a), Ni2p (b) and Cu2p (c) in the synthesized 10%Co-ZnO, 10%Ni-ZnO and 10%Cu-ZnO nanomaterials, respectively.
3.1.5 SEM observations
Fig. 5 shows the SEM images of Co–, Ni- and Cu-doped ZnO nanomaterials. All the images of this figure show that the samples are made of highly agglomerated particles with irregular rounded shapes. On the other hand, the average particle size, estimated by the granulometric method, of the doped ZnO nanoparticles increased slightly to about 180 nm (Fig. S5) by comparison with ZnO nanoparticles whose average particle size was estimated at about 100 nm (Aadnan et al., 2022). This suggests that doping ZnO could promote the crystalline growth of ZnO particle.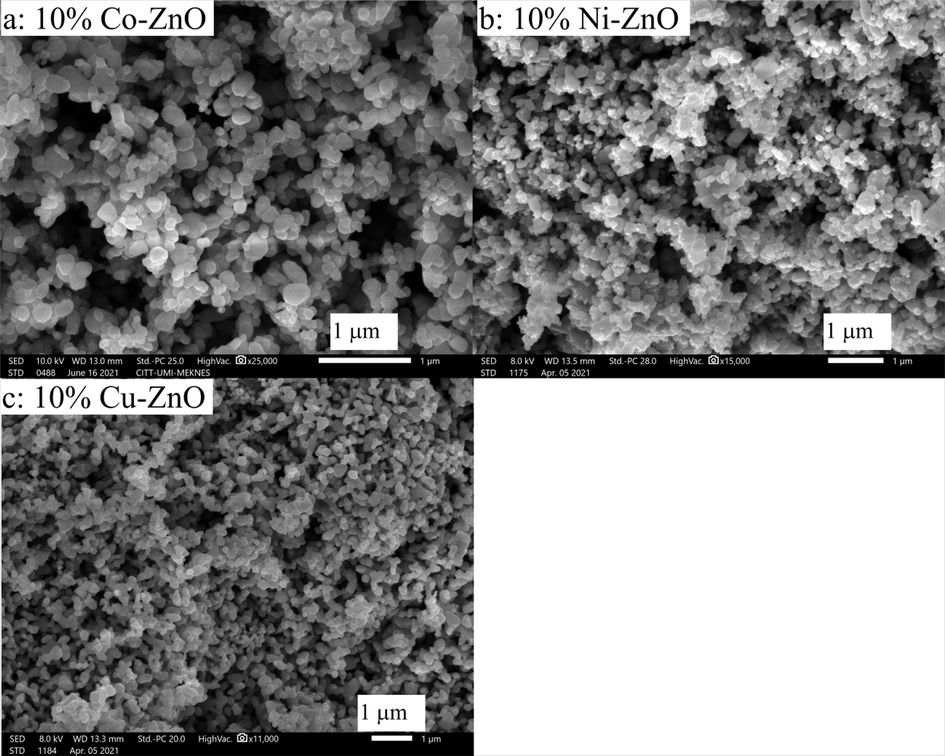
SEM images of 10%Co-ZnO (a), 10%Ni-ZnO (b) and 10%Cu-ZnO (c).
3.2 Photocatalytic activity
The evaluation of the photocatalytic activity of the prepared photocatalysts was done using methyl orange discoloration reaction under both UV-A and visible light irradiation. The blank experiments carried out in the absence of the photocatalysts for 6 h showed that about 3 % of the MO was photodegraded (Fig. S6), indicating the necessary presence of both the photocatalyst and light to initiate the photocatalytic discoloration reaction.
3.2.1 UV-A light
Fig. 6a presents the MO removal as a function of irradiation time obtained under UV-A in the presence of the synthesized photocatalysts. From the results presented in Fig. 6a and Table 2, ZnO exhibits 74.3 % as a MO conversion after 330 min of irradiation. Doping ZnO with Co, Ni or Cu has a negative effect on the photocatalytic efficiency. The activity order obtained under UV-A irradiation for the used photocatalysts is ZnO > 10 %Cu-ZnO > 10 %Co-ZnO > 10 %Ni-ZnO. The obtained results are comparable to those reported previously by Aadnan et al. (2020) regarding the photocatalytic degradation of MO in the presence of ZnO-chitosan. In addition, El Mragui et al. (2019c) reported that doping TiO2 with 1 wt% of Fe improved the photocatalytic degradation of carbamazepine on TiO2 while doping it with 1 wt% of Co decreased the MO conversion under UV-A irradiation. On the other hand, data shown in Fig. 6a were fitted to the pseudo-first-order kinetic model by the linear method described by the Eq. (2). The obtained kinetic curves (Fig. S7a) suggests that the photocatalytic discoloration reactions of MO are pseudo-first-order reactions during the first 3 h of irradiation in agreement with Langmuir-Hinshelwood mechanism (Rauf et al., 2011). The constants of the apparent rate calculated from the slopes of the linear plot of Ln(C0/Ct) versus irradiation time and the coefficient of regression are shown in Table 2. From these results, it is noted that the kinetic degradation of MO in the presence of ZnO is slightly faster than that on 10 %Co-ZnO (1.2 times), 10 %Cu-ZnO (1.9 times) and 10 %Ni-ZnO (1.6 times).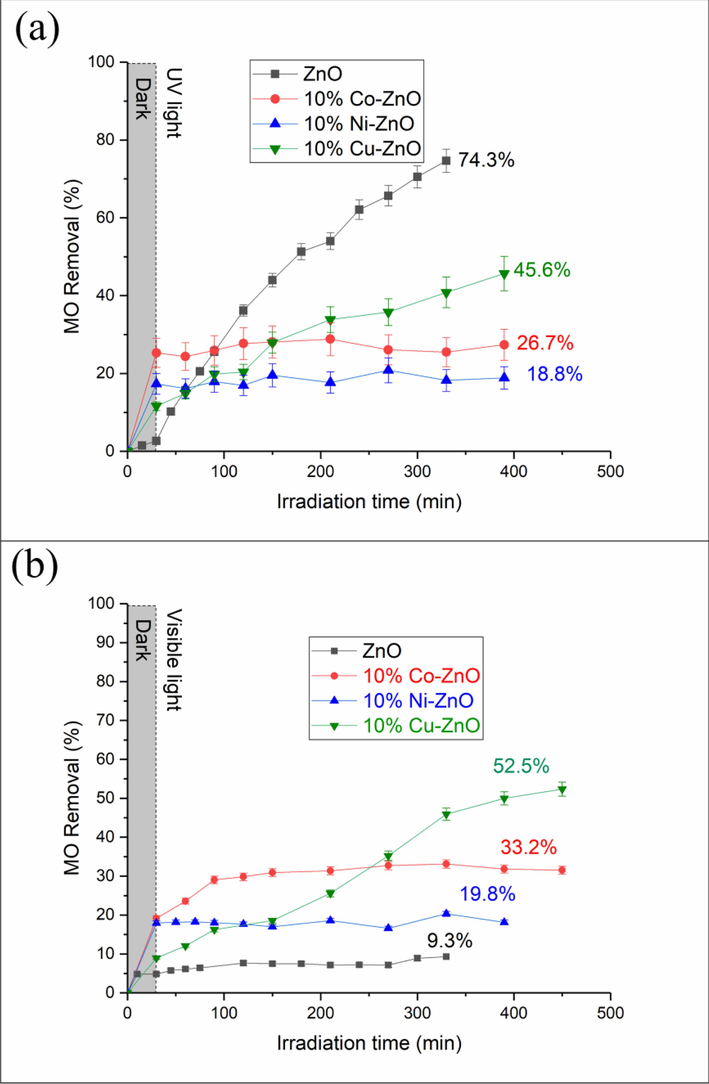
MO removal vs irradiation time under UV-A (a) and visible (b) light for undoped and doped ZnO nanomaterials. C0(MO) = 10-5 M, mphotocatalyst = 0.5 g/L, pH = 4.
MO conversion obtained for doped ZnO nanomaterials under visible light irradiation in the presence of various scavengers. C0(MO) = 10-5 M, mphotocatalyst = 0.5 g/L, pH = 4.
3.2.2 Visible light
Fig. 6b presents the curves representing the evolution of the MO conversion vs irradiation time. Table 2 presents the obtained final MO conversions. These results highlight that under visible light irradiation, the MO removal in the presence of undoped ZnO (9.3 %) significantly decreases (about 8 times) by comparison with UV light irradiation (74.3 %). This is expected since the absorbency of ZnO drastically decreased in the visible spectral domain. Also, the obtained band gap of ZnO (3.09 eV) suggested that ZnO does not absorb irradiation for λ > 400 nm. Meanwhile, the MO conversion obtained for all doped ZnO nanomaterials is higher than undoped ZnO. These results agree with those reported recently for Mn-ZnO photocatalyst which showed a better MO conversion (95.8 %) by comparison with pristine ZnO (Aadnan et al., 2022). It has been reported that the defect concentrations of oxygen vacancies play a major role in photocatalytic processes (Samadi et al., 2016; Mahmood et al., 2011). These defects actively contribute to the separation of charge carriers and increase the lifetime photo-induced electrons and holes. On the other hand, the MO removal reached 33.2 % on 10 %Co-ZnO sample which exhibited a marked band gap narrowing (Eg = 2.48 eV) as compared with pure ZnO. Some authors reported that the photocatalytic activity of Co-ZnO nanomaterials is linked to both the concentration of oxygen vacancies and defects (Kuriakose et al., 2014; Rajbongshi and Samdarshi, 2014; Thennarasu and Sivasamy, 2013). Also, the photocatalytic effectiveness of Co-ZnO photocatalysts depended on the doping concentration of Co (He et al., 2012). In contrast, doping ZnO with Cu improves the MO conversion (52.5 %) despite the fact that the optical studies indicated its inability to absorb visible wavelengths (Eg = 3.14 eV). Mittal et al. (2014) reported that the insertion of Cu2+ in the crystal lattice of ZnO causes a modification of the absorption and emission spectrum in the visible domain which is a result of the induction of localized Cu3d states in ZnO band gap (Polat et al., 2014). These authors indicated that the transition band between Cu3d and Zn4s is responsible for the absorption of visible-light in Cu-doped ZnO (Gao et al., 2014), enhancing thus the photosensitivity of the solid in the visible domain. The behaviors of the tested nanomaterials suggest that the decrease of the band gap of a photocatalyst is not the unique parameter which affects the MO photocatalytic degradation. In fact, various factors can affect the photocatalytic activity such as the creation of traps of charge carriers, the oxygen vacancies, the creation of impurity energy levels, the crystalline structure, the size of the crystallites, and the morphology of the photocatalyst (Aftab et al., 2022; El Mragui et al., 2021; Colmenares and Xu, 2016; Pichat, 2016; Ajmal et al., 2014; Gao et al., 2014). On the other hand, we recently reported that the insertion of Mn2+/Mn3+ into the crystal lattice of ZnO (Aadnan et al., 2022) and Co2+/Co3+ into the crystal lattice of TiO2 (El Mragui et al., 2021) markedly increased the photocatalytic performance of ZnO and TiO2 respectively. This generates acceptor levels in the band gap of ZnO and TiO2 by creating impurity energy levels just below the CBM. In the present paper, it was observed that doping ZnO with metal ions increased the MO photocatalytic degradation. A combination of several factors is probably responsible for this increase. Indeed, the important increases in photocatalytic activity observed for the doped ZnO by comparison with pure ZnO, particularly for 10 %Cu-ZnO, could be the result of the increase in the lifetime of photogenerated (e−/h+) pairs. Analogous results were reported for 10 %Mn-ZnO studied under the same operating conditions (Aadnan et al., 2022). Therefore, the high photocatalytic activity obtained for the doped ZnO samples as compared with ZnO may be the result of a synergistic effect of both the high visible light absorbency and the low recombination rate of the photo-induced charge carriers. The apparent rate constants kap (Fig. S7b and Table 2), calculated from the equation (2), show that the catalyzed degradation reactions of the MO in the presence of the doped-ZnO nanomaterials are all pseudo-first-order reactions. All of these results showed that the MO conversion has been improved by doping ZnO with Co (3.6 times), Ni (2.2 times) and Cu (5.6 times). Besides, it was found that the MO degradation on 10 %Co-ZnO, 10 %Ni-ZnO and 10 %Cu-ZnO is about 7, 7.8 and 3.5 times faster than that of pure ZnO respectively.
3.2.3 Mechanism of the photocatalytic degradation of MO under visible light irradiation
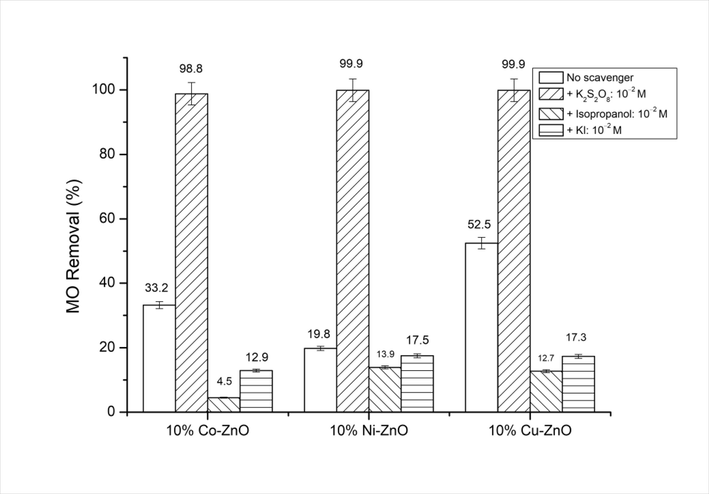
In order to identify what degree of importance played by each of the active species involved in the degradation of MO for the synthesized doped ZnO nanomaterials, some active species’ (e-, OH• and h+) quenching experiments were carried out under visible light, and the obtained results were compared with those obtained in the absence of any quenchers. Fig. 7 shows that the addition of K2S2O8 as electrons’ trapper, increases significantly the MO conversion for all doped ZnO. In contrast, the addition of isopropyl alcohol and KI as hydroxyl radicals and holes scavengers, respectively decreases the MO conversion, particularly for hydroxyl radicals. This behavior suggests that OH• play the major role while h+ play the minor role in the MO discoloration.
4 Conclusions
Herein, the obtained results showed that the synthesized ZnO nanomaterials were successfully doped, at a 10 wt% level, with Co2+, Ni2+ and Cu2+ metal ions. The XRD results showed the presence of ZnO (hexagonal wurtzite) along with Co3O4, NiO and CuO in the solids. On the other hand, an increase in the lattice parameters due to the difference in the ionic radii of Zn2+ Co2+, Ni2+ and Cu2+ was observed. This is a result of a lattice distortion of the ZnO structure due to the replacement of Zn2+ by Co2+, Ni2+ and Cu2+. The DRS results suggested a modification has occurred regarding the optical properties of modified ZnO nanoparticles. The obtained band gaps of 10 %Co-ZnO, 10 %Ni-ZnO and 10 %Cu-ZnO were 2.48 eV, 3.17 eV and 3.14 eV respectively. It has been observed that the doping ions enhanced the photocatalytic capability of ZnO to degrade MO under visible light. The results showed that the obtained MO conversion were 33.2 %, 19.8 % and 52.5 % for 10 %Co-ZnO, 10 %Ni-ZnO, and 10 %Cu-ZnO respectively. As the visible photocatalytic performance of doped ZnO nanoparticles changes, when compared with bare ZnO, due to several factors, a combination of both the high visible light absorbency and the low recombination rate of photogenerated charge carriers (e-/h+) is probably responsible for the improvement of the photocatalytic degradation of MO.
CRediT authorship contribution statement
Imane Aadnan: Investigation, Methodology. Omar Zegaoui: Conceptualization, Validation, Visualization, Writing – original draft, Writing – review & editing. Abderrahim El Mragui: Investigation, Methodology. Hamou Moussout: Investigation, Methodology. Joaquim C.G. Esteves da Silva: Writing – review & editing.
Acknowledgments
The authors thank the CCA (Faculty of Sciences, Moulay Ismail University of Meknes, Morocco), the CITT (Moulay Ismail University of Meknes, Morocco), the UATRS (CNRST, Rabat, Morocco), and the CEMUP (University of Porto, Portugal) for their technical supports. The Portuguese “Fundação para a Ciência e Tecnologia” (FCT, Lisbon) is acknowledged - R&D Units CIQUP (UIDB/000081/2020) and the Associated Laboratory IMS (LA/P/0056/2020).
Declaration of Competing Interest
The authors declare that they have no known competing financial interests or personal relationships that could have appeared to influence the work reported in this paper.
References
- Synthesis and physicochemical characterization of a ZnO-Chitosan hybrid-biocomposite used as an environmentally friendly photocatalyst under UV-A and visible light irradiations. J. Environ. Chem. Eng.. 2020;8
- [CrossRef] [Google Scholar]
- Structural, optical and photocatalytic properties of Mn doped ZnO nanoparticles used as photocatalysts for azo-dye degradation under visible light. Catalysts. 2022;12:1382.
- [CrossRef] [Google Scholar]
- Enhanced the photocatalytic activity of Ni-doped ZnO thin films: Morphological, optical and XPS analysis. Superlattice. Microst.. 2016;94:108-118.
- [CrossRef] [Google Scholar]
- Insight into nanocrystal synthesis: from precursor decomposition to combustion. RSC Adv.. 2022;12:24374-24389.
- [CrossRef] [Google Scholar]
- Synthesis of optically enriched cobalt-doped zinc oxide nanocomposites: Reduction of methylene blue dye. Opt. Mater.. 2023;142
- [CrossRef] [Google Scholar]
- Cu/CuO-doped ZnO nanocomposites via solution combustion synthesis for catalytic 4–nitrophenol reduction. ACS Omega. 2023;8:9597-9606.
- [CrossRef] [Google Scholar]
- Highly efficient visible light active doped ZnO photocatalysts for the treatment of wastewater contaminated with dyes and pathogens of emerging concern. Nanomaterials 2022
- [CrossRef] [Google Scholar]
- Principles and mechanisms of photocatalytic dye degradation on TiO2 based photocatalysts: a comparative overview. RSC Adv.. 2014;4:37003-37026.
- [CrossRef] [Google Scholar]
- Visible light facilitated degradation of alternate dye solutions by highly reusable Mn-ZnO nano-photocatalyst. J. Alloy. Compd.. 2021;867
- [CrossRef] [Google Scholar]
- Highly efficient photocatalytic activity of stable manganese-doped zinc oxide (Mn:ZnO) nanofibers via electrospinning method. Mater. Sci. Semicond. Process.. 2019;103
- [CrossRef] [Google Scholar]
- Belver, C., Bedia, J., Gómez-Avilés, A., Peñas-Garzón, M., Rodriguez, J.J., 2019. Chapter 22-Semiconductor Photocatalysis for Water Purification, Nanoscale Materials in Water Purification: Micro and Nano Technologies, pp. 581–651. https://doi.org/10.1016/B978-0-12-813926-4.00028-8.
- Structural and optical properties of zinc titanates synthesized by precipitation method. J. Chem. Sci.. 2015;127:509-518.
- [CrossRef] [Google Scholar]
- A review of heterogeneous photocatalysis for water and surface disinfection. Molecules. 2015;20:5574-5615.
- [CrossRef] [Google Scholar]
- Microscopic mechanism for unipolar resistive switching behaviour of nickel oxides. J. Phys. D Appl. Phys.. 2012;45
- [CrossRef] [Google Scholar]
- Colmenares, J.C., Xu, Y.-J. (Eds.), 2016. Heterogeneous Photocatalysis, Green Chemistry and Sustainable Technology. Springer Berlin Heidelberg, Berlin, Heidelberg. https://doi.org/10.1007/978-3-662-48719-8.
- Physicochemical and photocatalytic properties of the ZnO particles synthesized by two different methods using three different precursors. C.R. Chim.. 2017;20:47-54.
- [CrossRef] [Google Scholar]
- Photocatalytic degradation of model pollutants using ZnO/Ag3PO4 heterostructure thin films under visible and solar irradiation. Opt. Mater.. 2023;138
- [CrossRef] [Google Scholar]
- Photocatalytic CO2 reduction of C/ZnO nanofibers enhanced by an Ni-NiS cocatalyst. Nanoscale. 2020;12:7206-7213.
- [CrossRef] [Google Scholar]
- Influence of the preparation method and ZnO/(ZnO + TiO2) weight ratio on the physicochemical and photocatalytic properties of ZnO-TiO2 nanomaterials. Catal. Today. 2019;321–322:41-51.
- [CrossRef] [Google Scholar]
- El Mragui, A., Zegaoui, O., Daou, I., Esteves da Silva, J.C.G., 2019b. Preparation, characterization, and photocatalytic activity under UV and visible light of Co, Mn, and Ni mono-doped and (P,Mo) and (P,W) co-doped TiO2 nanoparticles: a comparative study. Environmental Science and Pollution Research 2019 28:20 28, 25130–25145. https://doi.org/10.1007/S11356-019-04754-6.
- El Mragui, A., Logvina, Y., Pinto da Silva, L., Zegaoui, O., da Silva, J.C.G.E., 2019c. Synthesis of Fe- and Co-Doped TiO2 with Improved Photocatalytic Activity Under Visible Irradiation Toward Carbamazepine Degradation. Materials 2019, Vol. 12, Page 3874 12, 3874. https://doi.org/10.3390/MA12233874.
- Elucidation of the photocatalytic degradation mechanism of an azo dye under visible light in the presence of cobalt doped TiO2 nanomaterials. Chemosphere. 2021;266
- [CrossRef] [Google Scholar]
- Fouad, O. A., Makhlouf, S. A., Ali, G. A. M., El-Sayed, A. Y., 2011. Cobalt/silica nanocomposite via thermal calcination-reduction of gel precursors, Materials Chemistry and Physics 128(1–2), 70-76. Doi. 10.1016/j.matchemphys.2011.02.072.
- Synthesis of BiFeO3 nanoparticles for the visible-light induced photocatalytic property. Mater. Res. Bull.. 2014;59:6-12.
- [CrossRef] [Google Scholar]
- Correlation between oxygen vacancies and dopant concentration in Mn-doped ZnO nanoparticles synthesized by co-precipitation technique. J. Alloy. Compd.. 2016;684:669-676.
- [CrossRef] [Google Scholar]
- Harish Kumar, Poonam Sangwan, Manisha, 2017. Advances in Applied Physical and Chemical Sciences -A Sustainable Approach, Advances in Applied Physical and Chemical Sciences -A Sustainable Approach.
- Co-doped ZnO nanopowders: Location of cobalt and reduction in photocatalytic activity. Mater. Chem. Phys.. 2012;132:1035-1040.
- [CrossRef] [Google Scholar]
- Critical role of the heterojunction interface of silver decorated ZnO nanocomposite with sulfurized graphitic carbon nitride heterostructure materials for photocatalytic applications. J. Alloy. Compd.. 2021;858
- [CrossRef] [Google Scholar]
- Improved photocatalytic NO removal activity of SrTiO3 by using SrCO3 as a new co-catalyst. Appl. Catal. B. 2018;227:24-34.
- [CrossRef] [Google Scholar]
- Synthesis, morphology and electrical properties of Co2+ substituted NiCuZn ferrites for MLCI applications. AIP Conf. Proc.. 2018;1942
- [CrossRef] [Google Scholar]
- Synergistically augmented ZnO via cobalt and copper simultaneous doping for pollutant reduction. ChemistrySelect. 2023;8(14)
- [CrossRef] [Google Scholar]
- Khan, M.A., Nayan, N., Shadiullah, Ahmad, M.K., Soon, C.F., 2020. Surface Study of CuO Nanopetals by Advanced Nanocharacterization Techniques with Enhanced Optical and Catalytic Properties. Nanomaterials 2020, Vol. 10, Page 1298 10, 1298. https://doi.org/10.3390/NANO10071298.
- Kim, J.W., Lee, S.J., Biswas, P., Lee, T. il, Myoung, J.M., 2017. Solution-processed n-ZnO nanorod/p-Co3O4 nanoplate heterojunction light-emitting diode. Appl Surf Sci 406, 192–198. https://doi.org/10.1016/J.APSUSC.2017.02.129.
- Semiconductor photocatalysis-mechanistic and synthetic aspects. Angew. Chem. Int. Ed. Engl.. 2013;52:812-847.
- [CrossRef] [Google Scholar]
- Kumar, P., Pandey, P.C., 2016. Investigations on absorption, photoluminescence and magnetic properties of ZnO: Co nanoparticles. Journal of Sol-Gel Science and Technology 2016 80:2 80, 342–352. https://doi.org/10.1007/S10971-016-4119-8.
- Correlation between structural, optical and magnetic properties of Mn-doped ZnO. Appl. Phys. A Mater. Sci. Process.. 2016;122:1-12.
- [CrossRef] [Google Scholar]
- Enhanced photocatalytic activity of Co doped ZnO nanodisks and nanorods prepared by a facile wet chemical method. PCCP. 2014;16:12741-12749.
- [CrossRef] [Google Scholar]
- Semiconductor-based photocatalysts and photoelectrochemical cells for solar fuel generation: a review. Cat. Sci. Technol.. 2015;5:1360-1384.
- [CrossRef] [Google Scholar]
- Recent progress on photocatalytic heterostructures with full solar spectral responses. Chem. Eng. J.. 2020;393
- [CrossRef] [Google Scholar]
- Effective ways to enhance the photocatalytic activity of ZnO nanopowders: high crystalline degree, more oxygen vacancies, and preferential growth. New J. Chem.. 2019;43:19223-19231.
- [CrossRef] [Google Scholar]
- Enhanced visible light photocatalysis by manganese doping or rapid crystallization with ZnO nanoparticles. Mater. Chem. Phys.. 2011;130:531-535.
- [CrossRef] [Google Scholar]
- UV–Visible light induced photocatalytic studies of Cu doped ZnO nanoparticles prepared by co-precipitation method. Sol. Energy. 2014;110:386-397.
- [CrossRef] [Google Scholar]
- Apatite-coated Ag/AgBr/TiO2 nanocomposites: Insights into the antimicrobial mechanism in the dark and under visible-light irradiation. Appl. Surf. Sci.. 2023;617
- [CrossRef] [Google Scholar]
- Electrochemical advanced oxidation processes: a review on their application to synthetic and real wastewaters. Appl. Catal. B Environ.. 2017;202:217-261.
- [CrossRef] [Google Scholar]
- Synthesis and characterization of undoped and cobalt-doped TiO2 nanoparticles via sol–gel technique. Appl. Nanosci. (switzerland). 2015;5:449-456.
- [CrossRef] [Google Scholar]
- Photocatalytic degradation of organic dyes by U3MnO10 nanoparticles under UV and sunlight. Inorg. Chem. Commun.. 2021;134
- [CrossRef] [Google Scholar]
- What are titania photocatalysts?-An exploratory correlation of photocatalytic activity with structural and physical properties. J. Adv. Oxid. Technol.. 2010;13:247-261.
- [CrossRef] [Google Scholar]
- Strictly biphasic soft and hard janus structures, synthesis, properties, and applications. Angew. Chem. Int. Ed.. 2014;53:5524-5538.
- [CrossRef] [Google Scholar]
- Fabrication of porous Cd-doped ZnO nanorods with enhanced photocatalytic activity and stability. CrstEngComm. 2013;15:6518-6525.
- [CrossRef] [Google Scholar]
- Pichat, P., 2016. Photocatalysis Fundamentals, Materials and Potential, Photocatalysis. MDPI, Basel. https://doi.org/10.3390/BOOKS978-3-03842-184-9.
- The influence of Cu-doping on structural, optical and photocatalytic properties of ZnO nanorods. Mater. Chem. Phys.. 2014;148:528-532.
- [CrossRef] [Google Scholar]
- A recyclable nanosheet of Mo/N-doped TiO2 nanorods decorated on carbon nanofibers for organic pollutants degradation under simulated sunlight irradiation. Chemosphere. 2019;215:280-293.
- [CrossRef] [Google Scholar]
- ZnO and Co-ZnO nanorods—Complementary role of oxygen vacancy in photocatalytic activity of under UV and visible radiation flux. Mater. Sci. Eng. B. 2014;182:21-28.
- [CrossRef] [Google Scholar]
- An overview on the photocatalytic degradation of azo dyes in the presence of TiO2 doped with selective transition metals. Desalination. 2011;276:13-27.
- [CrossRef] [Google Scholar]
- Cost-effective fabrication of ZnO/g-C3N4 composite film coated stainless steel meshes for visible light responsive photocatalysis. Mater. Res. Bull.. 2018;99:268-280.
- [CrossRef] [Google Scholar]
- Recent progress on doped ZnO nanostructures for visible-light photocatalysis. Thin Solid Films. 2016;605:2-19.
- [CrossRef] [Google Scholar]
- Photocatalytic degradation of ciprofloxacin using semiconductor derived from heterostructured ZIF-8-based materials. Microporous Mesoporous Mater.. 2023;359
- [CrossRef] [Google Scholar]
- An over review on recently developed techniques, mechanisms and intermediate involved in the advanced azo dye degradation for industrial applications. J. Mol. Struct.. 2021;1224
- [CrossRef] [Google Scholar]
- Plasmon-enhanced photocatalytic activity in the visible range using AgNPs/ polydopamine/graphitic carbon nitride nanocomposite. Appl. Surf. Sci.. 2022;585
- [CrossRef] [Google Scholar]
- Hierarchical 3D-flower-like CuO nanostructure on copper foil for supercapacitors. RSC Adv.. 2014;5:4443-4447.
- [CrossRef] [Google Scholar]
- Studies on photocatalytic performance and supercapacitor applications of undoped and Cu-doped ZnO nanoparticles. Appl. Surf. Sci. Adv.. 2022;12
- [CrossRef] [Google Scholar]
- Soni, B.H., Deshpande, M.P., Bhatt, S. v., Garg, N., Pandya, N.N., Chaki, S.H., 2013. Influence of Mn doping on optical properties of ZnO nanoparticles synthesized by microwave irradiation. Journal of Optics 2013 42:4 42, 328–334. https://doi.org/10.1007/S12596-013-0136-Y.
- Metal ion doped semiconductor metal oxide nanosphere particles prepared by soft chemical method and its visible light photocatalytic activity in degradation of phenol. Powder Technol.. 2013;250:1-12.
- [CrossRef] [Google Scholar]
- Great improvement on tetracycline removal using ZnO rod-activated carbon fiber composite prepared with a facile microwave method. J. Hazard. Mater.. 2017;324(2017):329-339.
- [CrossRef] [Google Scholar]
- Influence of doping with Co, Cu and Ni on the morphological and structural parameters and functional properties of ZnO nanoobjects. Mater. Chem. Phys.. 2023;308
- [CrossRef] [Google Scholar]
- Modulation of interfacial charge dynamics of semiconductor heterostructures for advanced photocatalytic applications. Coord. Chem. Rev.. 2021;438
- [CrossRef] [Google Scholar]
- Photocatalytic organic pollutants degradation in metal–organic frameworks. Energy Environ. Sci.. 2014;7:2831-2867.
- [CrossRef] [Google Scholar]
- Progress on extending the light absorption spectra of photocatalysts. PCCP. 2014;16:2758-2774.
- [CrossRef] [Google Scholar]
- Direct Z-scheme ZnO/CdS hierarchical photocatalyst for enhanced photocatalytic H2-production activity. Appl. Catal. B: Environ.. 2019;243:19-26.
- [CrossRef] [Google Scholar]
- Understanding the potential band position and e–/h+ separation lifetime for Z-scheme and type-II heterojunction mechanisms for effective micropollutant mineralization: comparative experimental and DFT studies. Appl. Catal. B Environ.. 2020;273
- [CrossRef] [Google Scholar]
- Nanostructure and optical properties of M doped ZnO (M=Ni, Mn) thin films prepared by sol–gel process. Phys. B Condens. Matter. 2011;406:3956-3962.
- [CrossRef] [Google Scholar]
- Oxygen vacancy induced structure change and interface reaction in HfO2 films on native SiO2/Si substrate. Appl. Surf. Sci.. 2016;390:260-265.
- [CrossRef] [Google Scholar]
- Yang, J.H., Shi, L., Wang, L.W., Wei, S.H., 2016. Non-Radiative Carrier Recombination Enhanced by Two-Level Process: A First-Principles Study. Scientific Reports 2016 6:1 6, 1–10. https://doi.org/10.1038/srep21712.
- Synthesis and characterization of Cobalt hydroxide, cobalt oxyhydroxide, and cobalt oxide nanodiscs. J. Phys. Chem. C. 2010;114:111-119.
- [CrossRef] [Google Scholar]
- Hetero-nanostructured suspended photocatalysts for solar-to-fuel conversion. Energy Environ. Sci.. 2014;7:3934-3951.
- [CrossRef] [Google Scholar]
Appendix A
Supplementary material
Supplementary data to this article can be found online at https://doi.org/10.1016/j.arabjc.2023.105336.
Appendix A
Supplementary material
The following are the Supplementary data to this article:Supplementary data 1
Supplementary data 1


