Translate this page into:
Structural studies, dielectric and electrical properties of (1-x) Pb(Zr0.52Ti0.48)O3– xCoFe2O4 multiferroics materials
⁎Corresponding author. malikasmp2013@gmail.com (Malika Ahabboud)
-
Received: ,
Accepted: ,
This article was originally published by Elsevier and was migrated to Scientific Scholar after the change of Publisher.
Peer review under responsibility of King Saud University.
Abstract
This work aimed to develop a better combination of PbZr0.52Ti0.48O3 (PZT) and CoFe2O4 (CFO) ceramics with enhanced structural, dielectric, and electric properties. For this aim, (1-x)PZT-xCFO nanocomposites at (0.00, 0.10, 0.20, 0.30, 0.40, 0.50, and 1.00) were synthesized using the combination before calcination of sol–gel (for PZT ceramic) and solid-state (for CFO material) methods. The powder X-ray diffraction analysis reveals that the CFO crystallizes in a spinel cubic structure with the Fd3m space group structure, while the PZT compound crystallizes in two tetragonal and rhombohedral structures with P4mm and R3m space groups respectively, which is confirmed by Raman spectra which also demonstrate that CFO content in (1-x)PZT-xCFO composites affects the vibration types. The scanning electron micrographs (SEM) show that the grains are homogeneous and irregular, with several pores on the surface of ceramics. The dielectric properties of the ceramics were investigated as a function of temperature (from 25 to 500 °C) and frequency (from 100 Hz to 2 MHz) using complex impedance spectroscopy. It shows that with the increase of CFO ratio, the dielectric permittivity values increase in the composites until the composition corresponding to x = 0.3 From 485 to 1620 at 5KHz) and then decreases until 65 for x = 1.00. The dielectric constant a function of frequency at different temperatures of (1-x)CFO-xPZT composites indicated that the dielectric constant increases with the increase of CFO content. The impedance spectrum is characterized by simple semicircular arcs and shows a non-Debye relaxation. The electric conductivity reveals that as CFO increases, conductivity remains constant, and the frequency dependence of conductivity shifts away from high frequencies. Also, the value of the exponent n decreases from 1.44 to 0.26 with an increasing CFO concentration. The activation energy is between 0.32 and 0.16 which confirms that electron hopping is responsible for electrical conduction.
Keywords
Ceramics
X-ray diffraction
Raman spectra
Dielectric properties
Activation energy
Conductivity
1 Introduction
At present, multiferroic materials have drawn increasing interest due to their multifunctionality, which provides an important potential for applications as next-generation smart devices (Roy, 2015)(Salami et al., 2017). Multiferroic composites are defined by the coexistence of at least two ferroic orders: ferromagnetic, ferroelectric, or ferroelastic (Schmid, 2008; Spaldin and Fiebig, 2005; Mitoseriu et al., 2007). The coupling interaction between ferroelectric and ferromagnetic orders realizes the magnetoelectric (ME) effect (Hua et al., 2008; Mandal et al., 2013). As a familiar ferroelectric material, PbZr xTi1-xO3 (PZT) has been studied significantly. It displays solid solution formation between lead zirconate and lead titanate over a complete range of x. At x = 0.52, near the morphotropic phase boundary (MPB), the system PZT shows excellent piezoelectric properties (Noheda and Gonzalo, 2000;Ragini et al., 2002;Sattar et al.,2015). On the other hand, Cobalt ferrite CoFe2O4 (CFO) is one such material ferromagnetic with cubic spinel structure (Fd3m space group) (Atif et al., 2015). The lattice parameters and angles of the CFO material are a = b = c = 8.38\AA and α = β = γ = 90°, respectively (Fernándeza et al., 2017). It has received much attention from throughout the world for a variety of applications like magneto-optics, data storage equipment, sensors, catalytic and medical applications, high curie temperature, suitable mechanical hardness, high wear resistance, and good chemical and mechanical stability (Chen et al., 2009; Peng et al., 2015).
The spinel CoFe2O4 ferrite has a higher Ms, and it has a relatively higher Hc compared with other spinels including Fe3O4, NiFe2O4, MnFe2O4, and so on (Fernándeza et al., 2016; Nejati and Zabihi, 2012; Liang et al., 2017; Wan et al., 2006). Different methods such as the sol–gel procedure (Wu et al., 2009), and the solid-state reaction method (Majid et al., 2021) have been applied for the synthesis of multiferroic composites (Liu et al., 2005). The ME composites (1–x)PZT-xCFO were reported in the literature, and the electrical and dielectric behavior of these ceramic samples is studied with the help of impedance spectroscopy (Ni et al., 2007; Testino et al., 2006). These materials reveal a Debye-like relaxation, and their dielectric constant is almost temperature- and frequency-independent. The (1–x)PZT-xCFO multiferroic composite was synthesized by Testino et al (Majid et al., 2021) using different methods such as co-precipitation and ball mill methods. They indicated the combined effect of ferroelectric and magnetic order on the multiferroic properties of the composites and explained the role of interfaces on the dielectric properties. In the literature, studies indicate that the ME coupling is mainly dependent on the lattice deformation developing at the interface between two different ferroic phases (Ali et al., 2021; Ahabboud et al., 2018). In this paper, we synthesized the (1–x)PZT-xCFO materials and studied the structural, dielectric, and electric properties of the composites. We are interested in the preparation of these two materials by two different methods (sol–gel for PZT ceramic and solid-state for CFO) and mixing them before the calcination step to study their effect on the physicochemical properties of multiferroics.
2 Experimental procedures
Multiferroic ceramics with composition x = 0.00, 0.10, 0.20, 0.30, 0.40,0.50 and 1.00 in the system (1-x)PbZr0.52Ti0.48O3–xCoFe2O4 [i.e.(1–x)PZT-xCFO] were prepared by combination of the sol–gel method for PZT and solid state for CFO. The raw materials of high-purity reagents) [PbC2H3O2)2·3H2O] with 99 % purity (BDH ChemicalsL/D), [Zr(CH3COO)4] with 99 % purity (Sigma Alderich) and [Ti (OCH (CH3)2)4] with 98 % purity (Sigma Alderich), were used as the starting precursors, the detail of the preparation process is described somewhere else (Ahabboud et al., 2021; Salami et al., 2017). The dried gels of these compositions were crushed into powders. The Cobalt ferrite (CFO) precursor was fabricated from the starting materials: Co3O4 with 98 % purity (Aldirich) and Fe2O3 with 98.9 % purity (Aldirich). The starting materials were mixed and homogenized by milling (for 4 h) under acetone according to the formulae of CoFe2O4. The obtained powders were dried at 80 °C for 24 h and mixed using agate mortar. The PZT and CFO powders were mixed in a stoichiometric ratio according to the formula (1-x)PbZr0.52Ti0.48O3–xCoFe2O4 (x = 0.00, 0.10, 0.20, 0.30, 0.40,0.50 and 1.00) and then placed in an alumina nacelle for calcination in air at 900 °C for 12 h to obtain a crystalline powder. The calcined powders were mixed with 2 % PVA binder and pressed into cylindrical pellets of 12 mm diameter using a co-axial hydraulic press. These pellets were sintered in the air at 950 °C for 4 h.
2.1 Characterizations of (1–x)PZT-xCFO
The crystal structure and phase composition of the samples were determined by x-ray diffraction XRD using (an XPERT-PRO diffractometer system with CuKα radiation with (λ = 1.5406 Å). Data were recorded at room temperature in the angular range 20°-80° in 2θ with steps of 0.04°.X-ray diffraction patterns of the multiferroic composites were analyzed using the Rietveld refinement program. The pseudo-Voigt function was used to define peak profiles. Raman spectroscopy was measured at room temperature using spectromètre Raman LabRAM Horiba Jobin Yvon type. The morphology of the ceramics was observed using a scanning electronic microscope (SEM) by a model JSM-IT500HR. The dielectric and electrical properties of the composites were investigated as a function of temperature (50–500°C) and as a function of frequency range from 50 to 2 MHz using an Agilent impedance analyzer (Agilent E4980A).
3 Results and discussion
3.1 Structural and microstructural studies of ceramics
Fig. 1 presents the XRD patterns of the (1–x)PZT-xCFO powders. All the observed peaks of the composites are indexed by the Bragg peaks which correspond to the piezoelectric PZT and ferrite CFO phases with a small peak due to Fe2O3 (Singh et al., 2016; Weng et al., 2007; Chaudhuri and Mandal, 2015). For x = 0.00 and x = 1.00, we notice the presence of peaks characteristic of the perovskite phase ABO3 (JCPDS data no 01–070-4265) and the structure AB2O4 (JCPDS data no 22–1086) respectively. For intermediate composites, it’s observed the existence, in the XRD diffractograms, of peaks characteristic of both PZT and CFO phases, the intensities of the peaks associated with each phase tend to increase or decrease depending on the proportion of the phase associated. It’s also observed that the intensity of the peak (3 1 1), the principal peak associated with the CFO structure, absent for x = 0.00, increases while the intensity of the peak (1 0 1), the principal peak corresponding to the PZT structure, decreases with the increase of the CFO content in the (1-x)PZT-xCFO composites until it disappears for x = 1.00. The same results are obtained for the BaTiO3-CoFe2O4 composite system and those of other works achieved on the (1-x)PZT-xCFO composite (Fernández et al., 2016)(Iordan et al., 2009)(Deluca et al., 2011). All these composites show the characteristic peaks of ferroelectric and ferromagnetic materials, and no reaction occurs between them, which shows a good magnetoelectric coupling.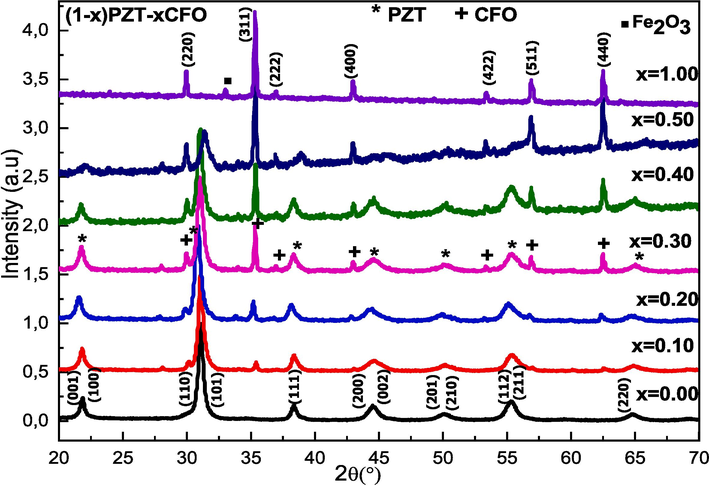
X-ray diffractograms of composites (1-x)PZT-xCFO.
To confirm the presence of the phases in the (1-x) PZT-xCFO composites, we performed a fit by the Rietveld method. The results obtained are presented in Fig. 2. These results show that all the (1-x) PZT-xCFO powders for x = 0.00, 0.10, 0.20, 0.30, 0.40, 0.50, and 1.00 crystallize in the tetragonal and rhombohedral phases with space groups P4mm and R3C for PZT, and the cubic phase of space groups Fd3m for CFO. On the other hand, the refined structural parameters ̏a˝ and ̏c˝, as well as the goodness-of-fit values χ2, Rp, Rwp, and Rexp are given in Table 1. The fit parameter values χ2 and R factors obtained show a good fit. With increasing CFO content, the lattice parameters ̏a˝ and ̏c˝ of both tetragonal and rhombohedral phases were observed to fluctuate while for CFO the parameter ̏a˝ increases up to x = 0.40 and decreases for x = 0.50, and then increases again.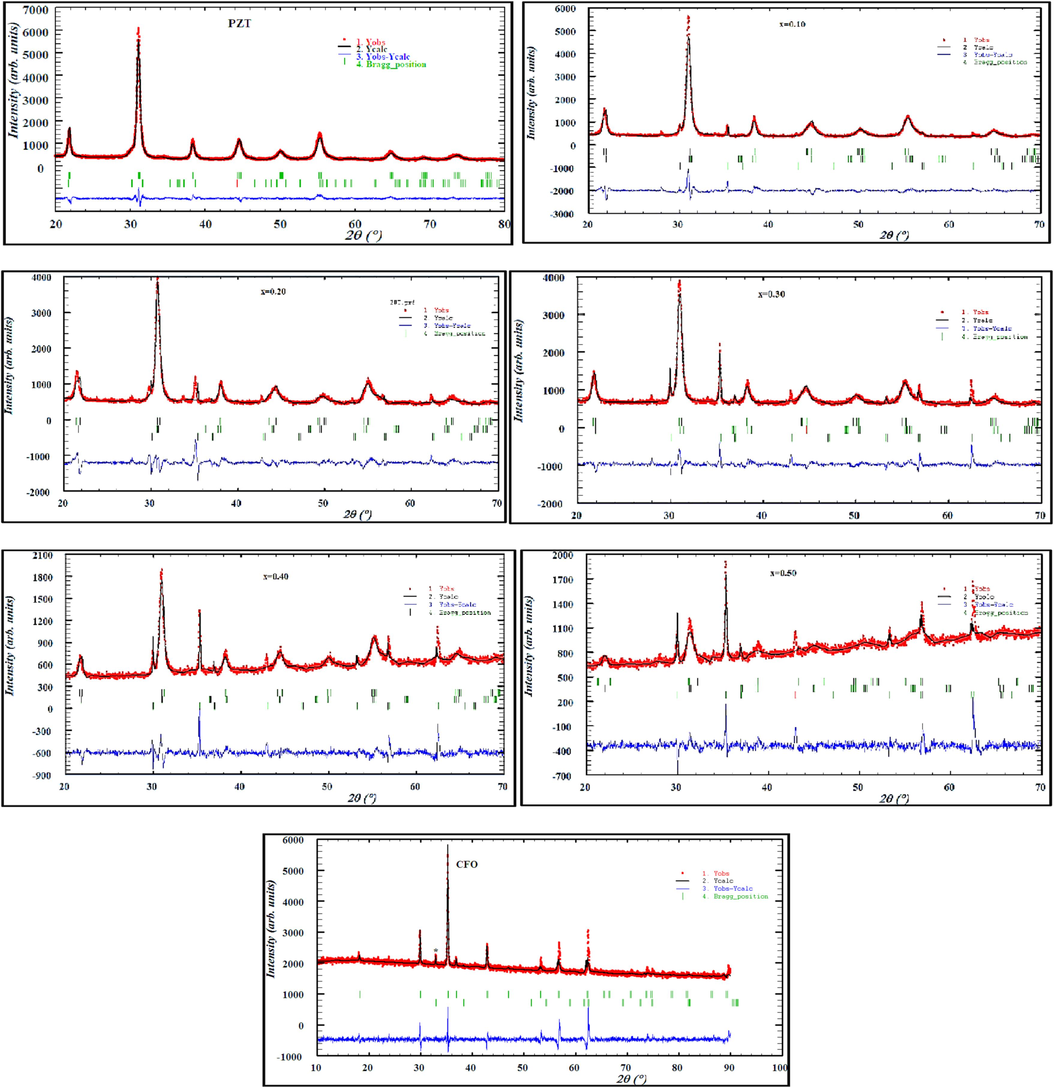
Rietveld refinement of X-ray spectra of (1-x) PZT-x CFO ceramics.
x
Lattice Parameters (Å)
χ2,RP, Rwp
CFO(cubic) Fd-3 m
PZT(tetra) P4mm
PZT(Rhm) R3c
χ2
Rp (%)
Rwp
Rexp
0.00
---------
a = 4.0402c = 4.1098
a = 5.7510c = 14.1262
1.12
3.92
4.97
4.70
0.10
a = 8.4000
a = 4.0558c = 4.1063
a = 5.7147c = 14.1529
2.89
5.68
7.86
4.62
0.20
a = 8.4057
a = 4.0757c = 4.1461
a = 5.8024c = 14.3129
3.83
5.43
8.32
4.25
0.30
a = 8.4234
a = 4.0579c = 4.1042
a = 5.7515c = 13.9572
2.39
4.06
5.78
3.74
0.40
a = 8.4242
a = 4.0600c = 4.1077
a = 5.7842c = 14.1019
1.91
3.70
5.50
3.97
0.50
a = 8.4227
a = 3.9245c = 4.1786
a = 5.6965c = 13.9819
1.85
3.00
4.44
3.26
1.00
a = 8.4347
---------
---------
2.44
2.23
3.65
2.33
Raman spectra of (1-x)PZT-xCFO composites are measured at room temperature and are shown in Fig. 3. The Raman peaks of pure PZT and CFO powders are observed. PZT shows the typical 3A1 + B1 + 4E modes. The peaks are situated at 203, 274, 331, 507, 552, 597, 717, and 775 cm−1, and are assigned to the E(2TO), E + B1, A1(2TO), E(3TO), E(4TO), A1(3TO), E(4LO) and A1(3LO) modes (Buixaderas et al., 2013)(Kumar et al., 2019). For CFO with spinel structure, the Fd3m space group analysis gives 6 Raman modes 2A1g + 3T2g + Eg. The CFO Raman peaks at 205, 300, 463, 550, 616, and 682 cm−1 correspond to the T2g(3), Eg, T2g(2), T2g(1), A1g(2), and A1g(1) modes respectively (Chandramohan et al., 2011)(Tang et al., 2017). The peaks obtained for the pure PZT and CFO samples are also observed in the (1-x) PZT-xCFO composites but with lower intensity. Comparing the Raman spectra, we observed a high wavenumber shift for the E(2TO) (2 0 3) and E + B1 (2 7 4) vibrational modes of PZT in the spectrum of (1-x) PZT-x CFO composites. The shift of the Raman peaks mainly results from different residual stress states. In general, the thermal effect and lattice disorder are considered two essential facts for residual stress (Park et al., 2009). Besides, for the samples x = 0.30 and 0.40, we can identify all the modes associated with PZT and CFO ceramics. As we can see, the peak found at 331 cm−1 is decreased in the mixture when the CFO content increases. The vibration types are influenced by the CFO content in the (1-x)PZT-xCFO composites.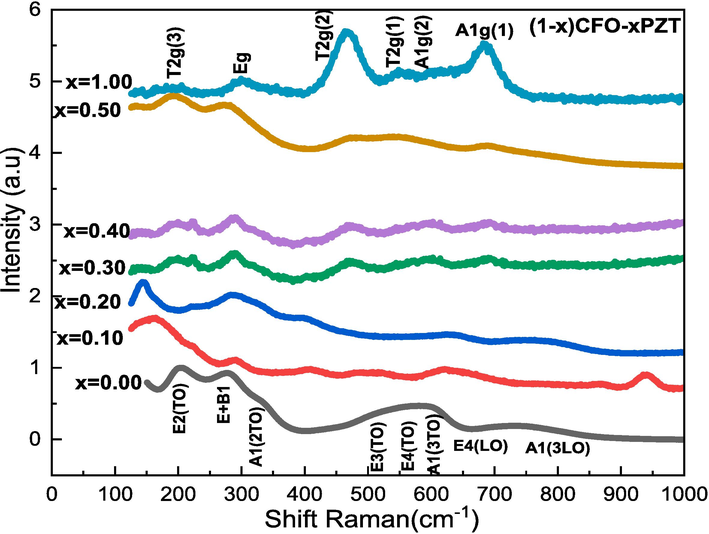
Raman spectra of (1-x)PZT-xCFO powders.
To study the microstructure and morphology of the (1-x)PZT-xCFO composites with x = 0.00, 0.10, 0.20, 0.30, 0.40, 0.50, and 1.00, scanning electron micrographs (SEM) were taken on the fractured inner surface of the sintered pellets, as shown in Fig. 4. It can be seen in this figure that the grains are homogeneous and irregular, with a significant difference in grain size, as well as the presence of some pores on the surface of ceramics. The formation of these pores would be due to different causes: the pressure is not high enough, and the structure is then relaxed. In addition, the other factors that can affect the formation of pores are the grain boundaries between the two materials of ferric orders, namely and as indicated on the X-ray diffractograms, there is no obvious chemical reaction between the two phases of the two materials, so there should be many grain boundaries in the composites. These joints can inhibit the growth of grains of both materials.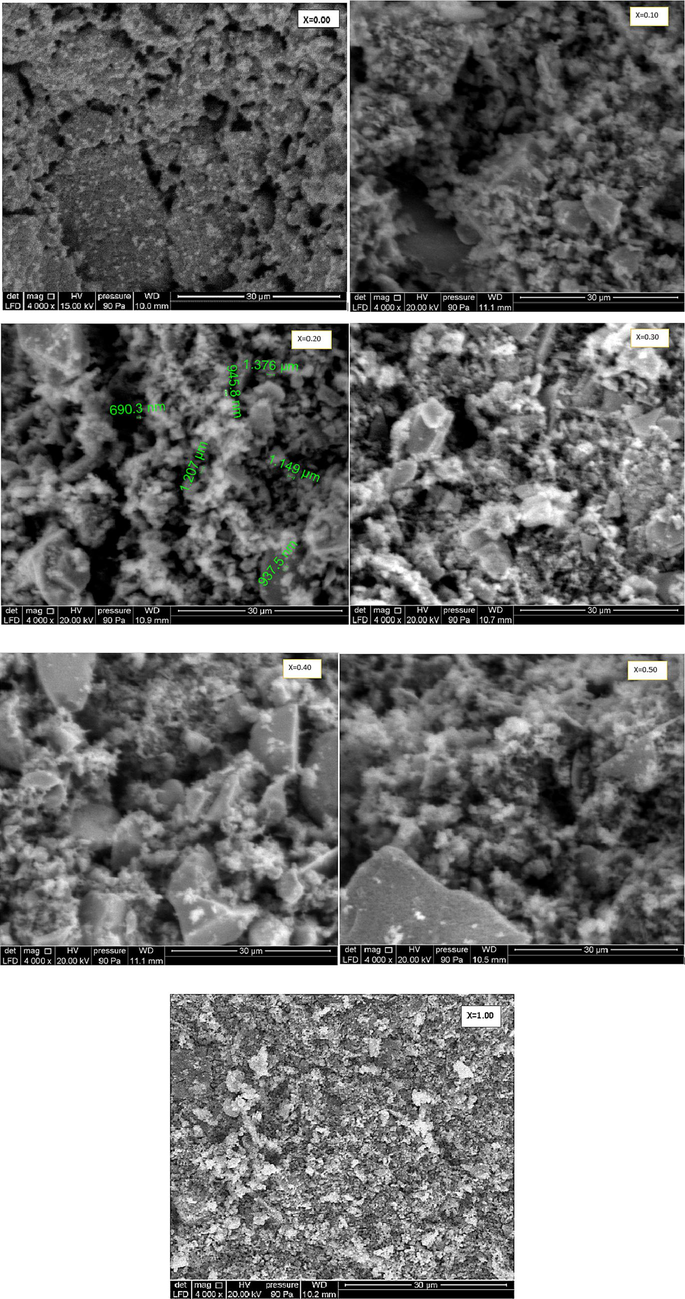
Scanning electron micrographs (SEM) of (1-x)PZT-xCFO ceramics.
3.2 Dielectric properties of (1-x)PZT-xCFO composites
In general, the dielectric constants of materials are considered to be complex parameters, i.e. ε* = ε′r – jε“.
where ε“ indicates the degree of dissipation of a material in the face of an external electric field and εr′ indicates the amount of energy of an external electric field stored in a material. In this case, the loss tangent is as follows: tan δ = εr” /ε′r.
Relative permittivity is indicated by the ratio of the dielectric material's permittivity ε to the dielectric permittivity of vacuum ε0 (ε0 = 8.85 x 10⁻¹⁴ Farads /cm).
The capacitance (C) of the condenser is expressed by the following equation: C = ɛrɛ0A⁄d.
A for the surface and d for the thickness) and the relative permittivity εr of the dielectric under consideration.
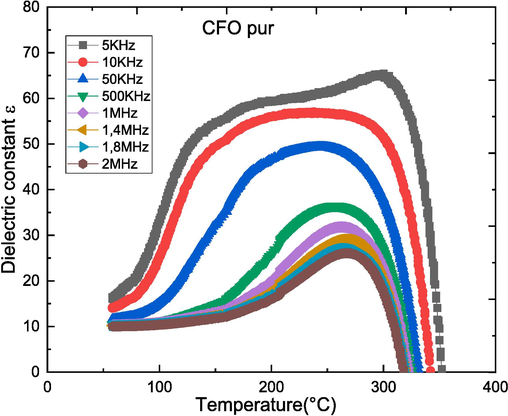
Fig. 5 shows the evolution of the relative dielectric permittivity as a function of temperature at different frequencies for (1-x)PZT-xCFO composites with x = 0.00, 0.10, 0.20, 0.30, 0.40, 0.50, and 1.00. For pure PZT, ɛr increases with the increase of temperature, and reaches a maximum at temperature Tm, indicating a Ferro-para electric phase transition. The temperature of the maximum of ɛr is the same for all frequencies showing the absence of dispersion. For other compositions, the dielectric constant graphs show the broadest peak around 350 °C (for f = 5KHz), the position of this peak shifts with temperature revealing a relaxor-like behavior. The peak moves towards high temperatures when the frequency increases up to 1 MHz and towards low temperatures beyond this frequency. This behavior is associated with a dielectric resonance observed in all samples and is well marked for x = 0.4 and 0.5. On the other hand, Fig. 5 and Table 2 show that with the increase of CFO rate, the values of εmax increase in the composites until the composition corresponding to x = 0.3 and then decreases. At the 5KHz frequency, the 0.7CFO-0.3PZT composite (x = 0.3) shows a second anomaly at 454 °C. This anomaly is, according to Jung H et al, linked to a rapid release of latent magnetization immediately below the magnetic transition temperature (Chien et al., 2016). The decline in magnetization induces a change in dielectric permittivity and thus indicates the presence of an ME coupling in the (1-x)PZT-xCFO composite. We also notice that the dielectric peak becomes wider. This is due to the microscopic heterogeneity of the composites, i.e. to the presence of two ferroic orders (Van Uitert, 1957).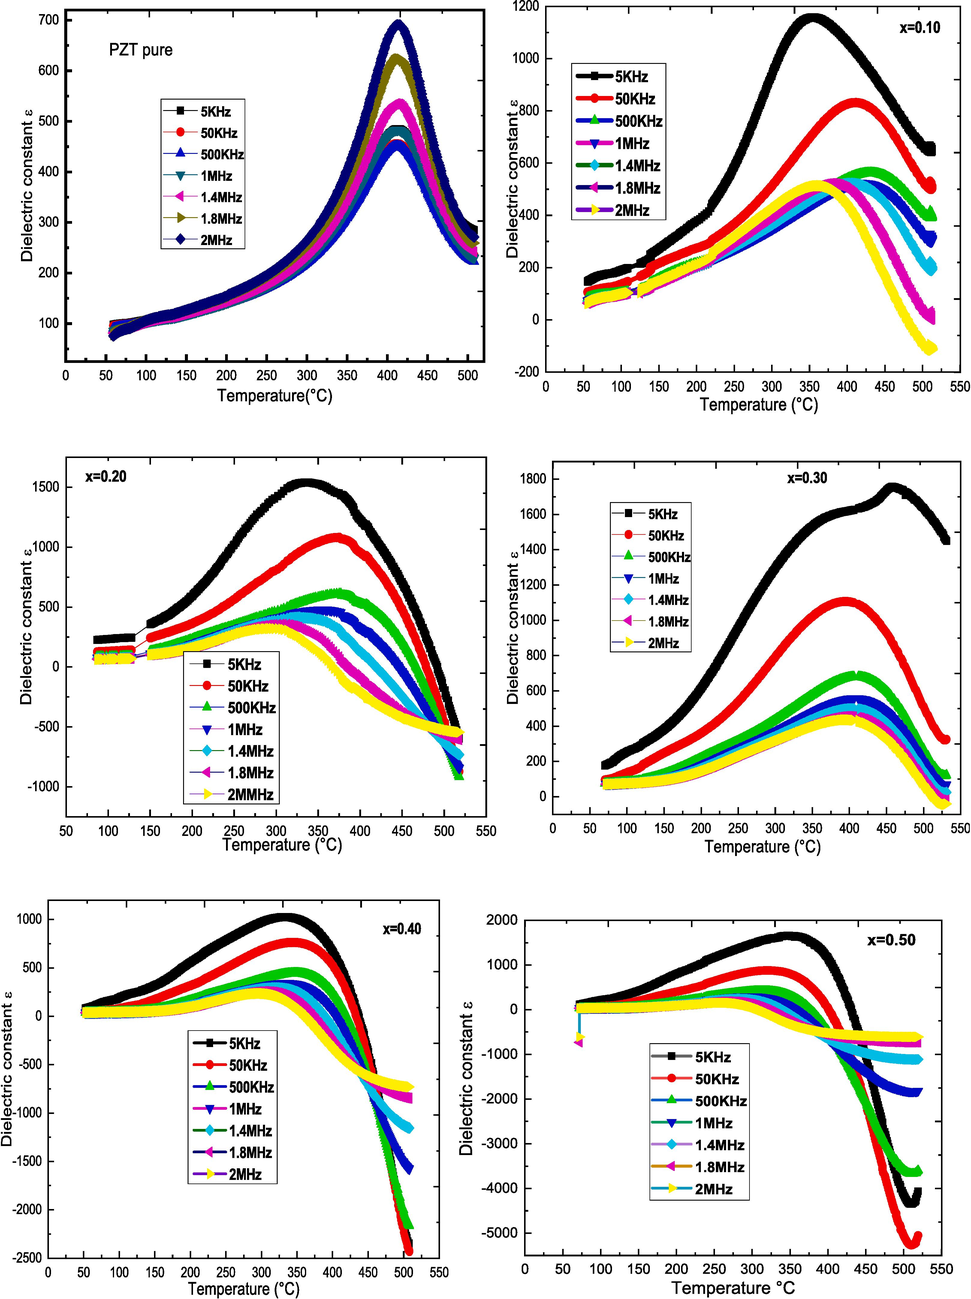
Evolution of ɛr with frequency of (1-x)PZT-xCFO ceramics sintered at 900 °C for 4 h.
Evolution of ɛr with frequency of (1-x)PZT-xCFO ceramics sintered at 900 °C for 4 h.
Frequencies x
5KHz
50KHz
1 MHz
2 MHz
Tm(°C)
εr (Tc)
Tm(°C)
εr(Tm)
Tm(°C)
εr(Tm)
Tm(°C)
εr(Tm)
0.00
410
485
410
456
410
483
410
690
0.10
349
1160
403
840
414
530
357
522
0.20
322
1570
370
1117
339
503
280
359
0.30
356
1620
388
1134
391
572
380
461
0.40
322
1051
331
811
323
375
279
286
0.50
336
1732
304
974
277
378
249
253
1.00
299
65
243
49
260
31
264
26
The variation of the dielectric constant of (1-x)CFO-xPZT composites sintered at 900 °C for 4 has a function of frequency at different temperatures as shown in Fig. 6. It can be seen that for most of the graphs, the value of the dielectric constant decreases rapidly with increasing frequency indicating a dispersion in the low-frequency region and reaching saturation in the high-frequency region which is a normal dielectric behavior. The rapid decrease of the dielectric constant with increasing frequency can be attributed to the dipolar relaxation process (Koops, 1951). This dispersion is also due to an interfacial polarization of the Maxwell-Wagner type, by the phenomenological theory of Koop (Ikyumbur et al., 2019). For all samples, the dielectric constant increases with increasing temperature up to 440 °C. Above this temperature, it decreases (an increase of charge liberation energy Fe2+→Fe3++e-). Also, we note that the dielectric constant of the composites increases with the increase of CFO content, which may be due to the increase in the number of space charges provided by the CFO at the interface of the two phases, thus giving a higher value of the dielectric constant at low frequencies. Also with the increase in CFO content, the PZT phase ratio decreases, which reduces the value of the dielectric constant at high frequencies. Whereas for x = 0.50 and x = 1.00 it decreases from 420 °C and tends towards negative values, which may be due to the high conductivity of CFO and/or the fluctuation of Fe valence, in particular the transition from Fe3+ to Fe4+ ions. Furthermore, the dielectric constant decreases with increasing CFO content in composites, which is due to the additional polarization of space charges, provided by CFO, at the interface of the two ferroic orders.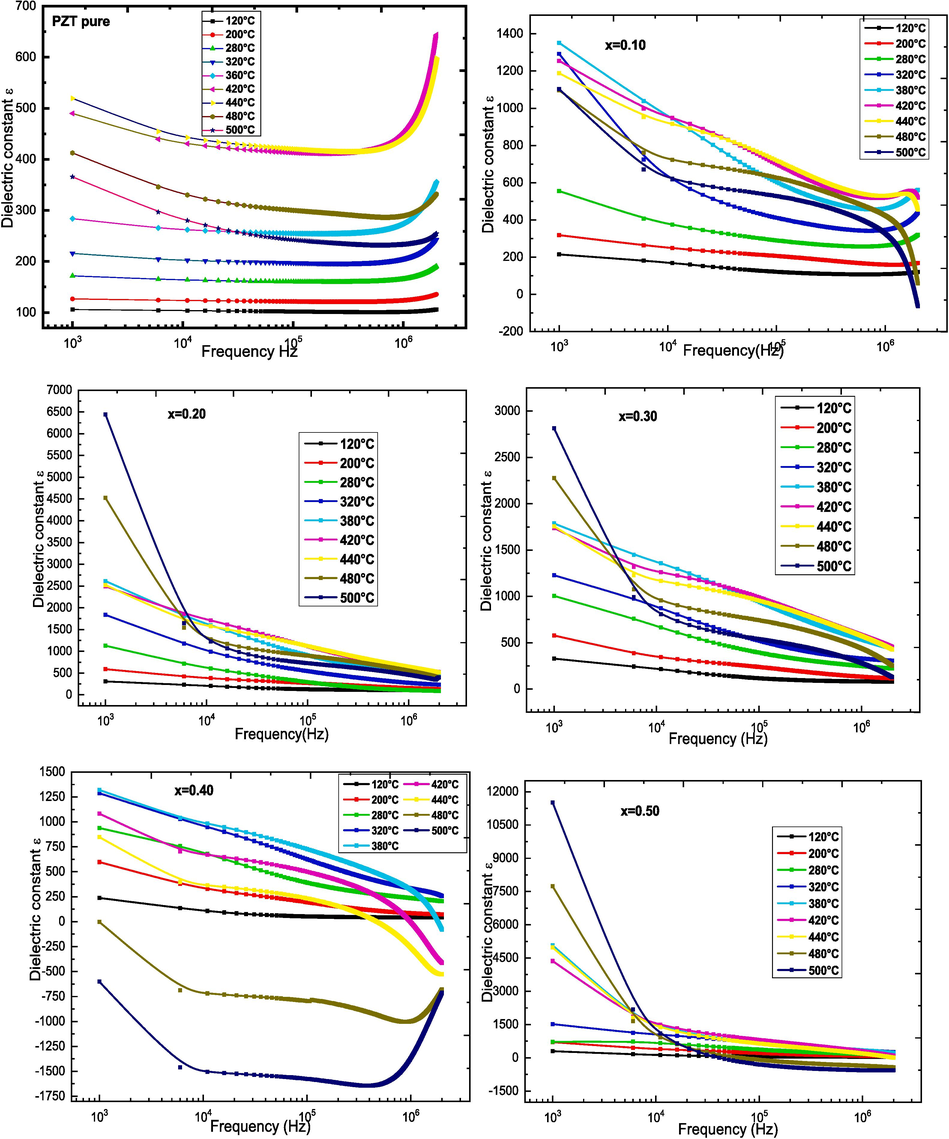
The dielectric constant as a function of frequency in the temperature range 120 to 500 °C.

The dielectric constant as a function of frequency in the temperature range 120 to 500 °C.
3.3 Electrical properties of (1-x) PZT-x CFO composites
To investigate the behavior of these two ferroic competitive orders in the (1-x)PZT-xCFO composite, impedance spectroscopy as a function of temperature is performed.
Zre represents the real part, and Zim the imaginary part of the impedance. ω is the pulsation
Fig. 7 shows the complex impedance curves (Nyquist plots) between the real and imaginary components of the impedance at different temperatures in the frequency range 50 Hz-2 MHz for the (1-x) PZT-xCFO samples. The spectra show a clear change in the impedances of the composites. For all ceramics, the impedance spectrum is characterized by simple semicircular arcs, the pattern of which changes with composition, indicating a change in resistance as the CFO ratio increases. The presence of the semicircular arcs is due to the voluminous properties (grains and grain boundaries) of the composites. The radii of the arcs decrease with increasing temperature and shift to low Zʹ values, indicating the presence of a thermally activated conduction mechanism in this system, which is characteristic of semiconductors. For composites and across the temperature range, the center of the semicircles is below the real axis, suggesting a non-Debye response (Chen et al., 2010). It is also noted that the radii of the semicircles (or the intersection of the arcs with the real axes) decrease with increasing temperature, so the electrical resistances due to the grains and grain boundaries decrease with increasing temperature, which can be explained by an increase of the electrical conductivity of the material with temperature, which is a typical behavior of semiconductors.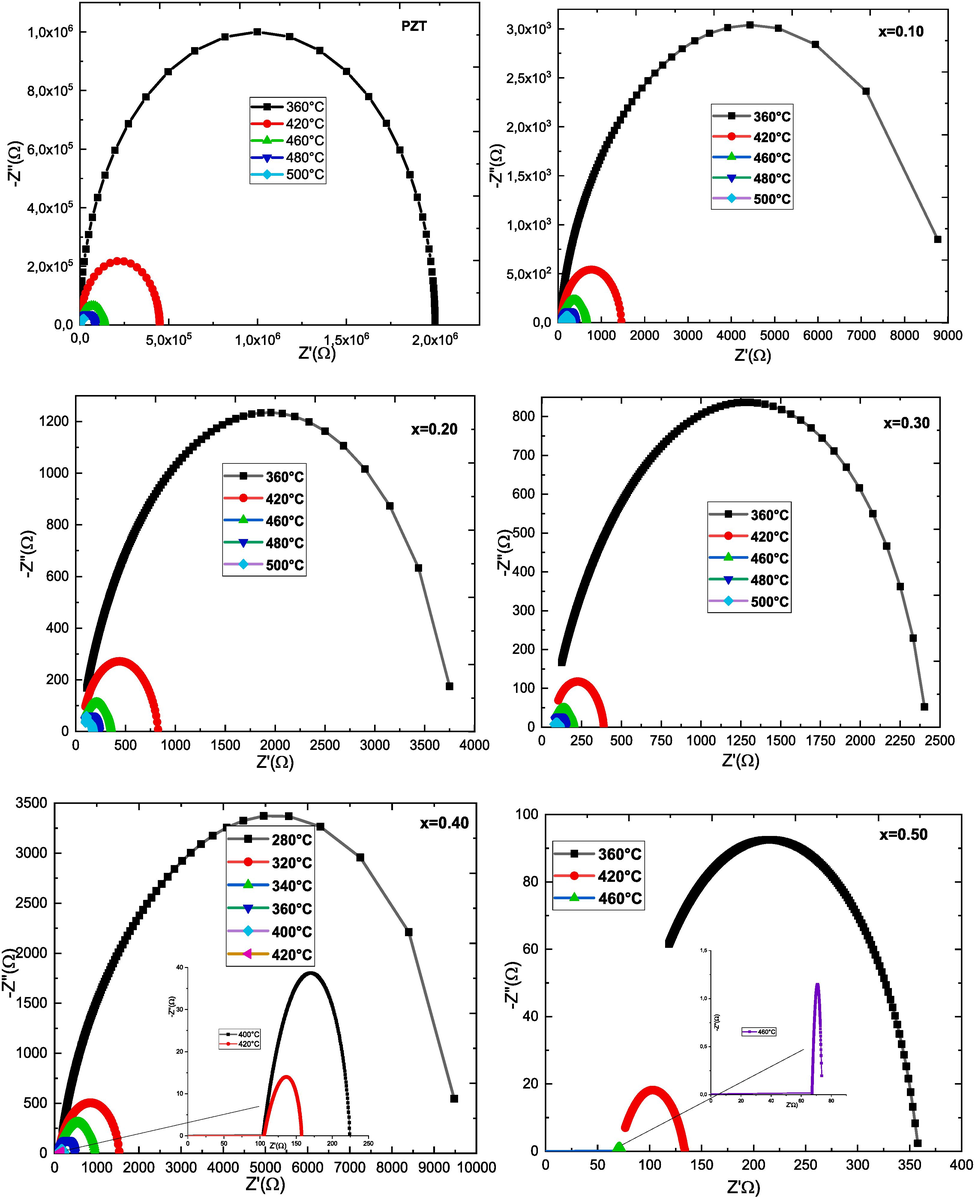
The complex impedance spectra Z' versus Z'' at different temperatures of (1-x)PZT-xCFO samples sintered at 900 °C/4h.
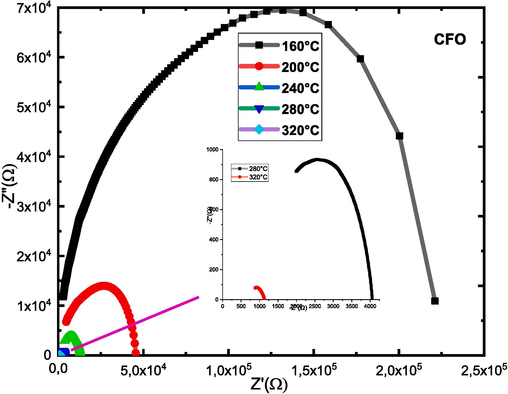
The complex impedance spectra Z' versus Z'' at different temperatures of (1-x)PZT-xCFO samples sintered at 900 °C/4h.
Fig. 8 shows the conductivity as a function of frequency at different temperatures for (1-x) PZT-xCFO ceramics. For pure PZT, we notice that the conductivity increases rapidly with the increase of the frequency and those for temperatures lower or to 320 °C. Above 320 °C the conductivity increases with the increase of the temperature and tends towards a stable zone independent of the frequency and those in the low frequencies. At high frequencies, the conductivity σac (σω) increases with increasing frequency. The linear variation of the σAC (σω) conductivity indicates that conduction is occurring through charge carrier jumps between localized states. For composites, we notice the same type of evolution as pure PZT, and the more the CFO rate increases, the more the conductivity remains stable and the conductivity–frequency dependence shifts further towards high frequencies. This evolution of the conductivity can be explained based on the relaxation model by hopping and conduction through the grain boundaries (Ortega et al., 2008). The conductivity results obtained for the studied (1-x)PZT-xCFO ceramics are following Jonscher's law σω = σdc + Aωn. Table 3 shows the values of the exponent n as a function of temperature obtained from the fitted data for all (1-x)PZT-xCFO ceramics. We observe that the value of the exponent n decreases with an increasing CFO rate. Several researchers have reported different hopping mechanisms and these mechanisms provide different dependencies of the exponent n as a function of temperature and frequency. For a small polaron hopping mechanism, n increases with temperature, while for a large polaron hopping mechanism, n decreases with increasing temperature (Gul et al., 2010). The localized orientation hopping at high frequency can be attributed to the formation of dipoles; the coexistence of the low dielectric constant CFO phase with the high dielectric constant PZT phase can influence the interface stacking charges and thus the polarization is of Maxwell Wagner type.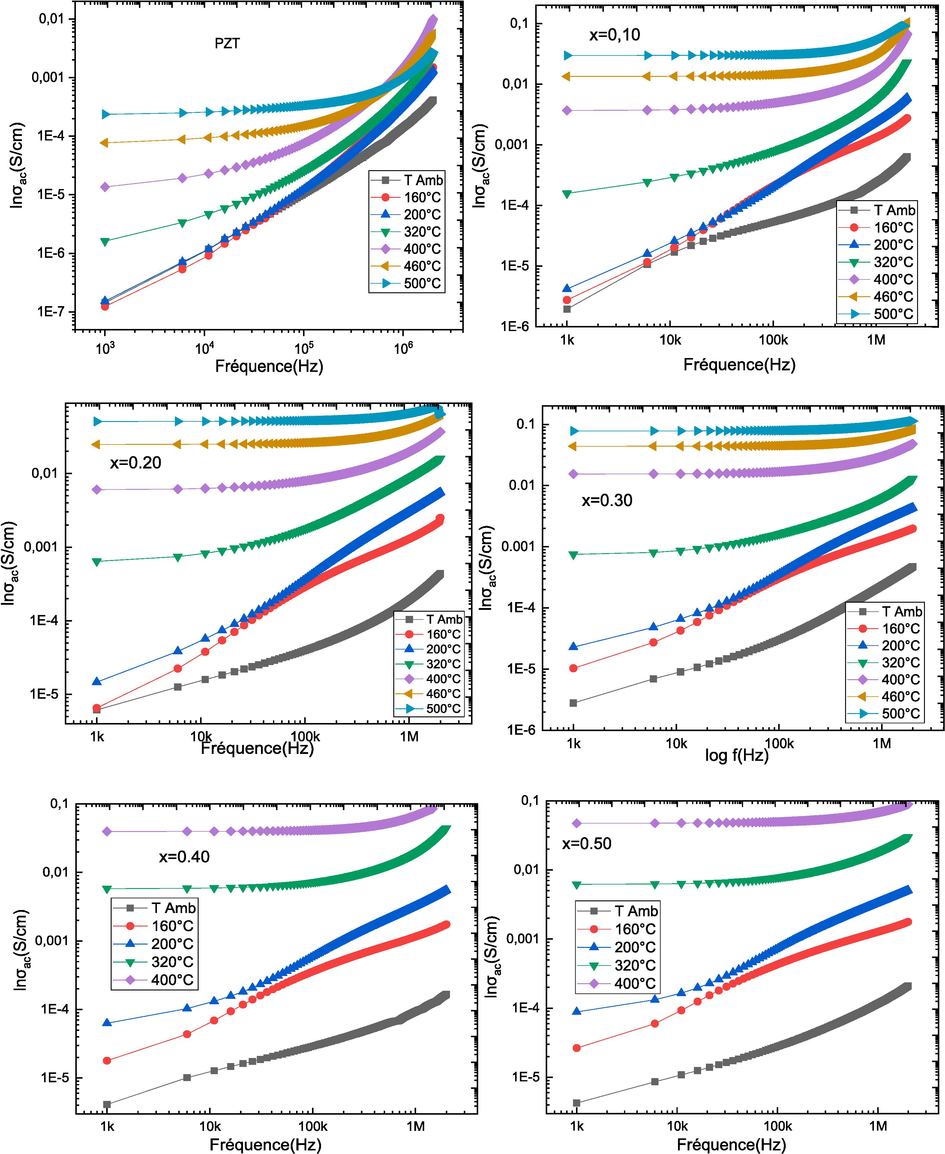
Evolution of σas a function of frequency for (1-x)PZT-xCFO composites.
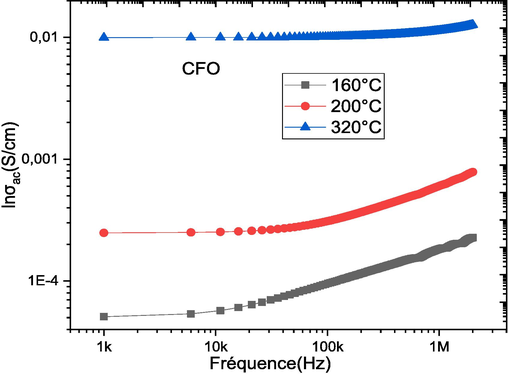
Evolution of σas a function of frequency for (1-x)PZT-xCFO composites.
X
Temperature
160 °C
200 °C
320 °C
0.00
1.01
1.44
1.32
0.10
0.85
1.06
0.93
0.20
0.70
0.88
0.64
0.30
0.65
0.80
0.59
0.40
0.55
0.71
0.47
0.50
0.49
0.63
0.37
1.00
0.26
0.26
0.06
Fig. 9 shows the conductivity curves σac versus temperature (103/T) for all (1-x)PZT-xCFO samples at 1 MHz. The activation energy was calculated by plotting the curve between log σac and 103/T and evaluating the slope of the straight line:
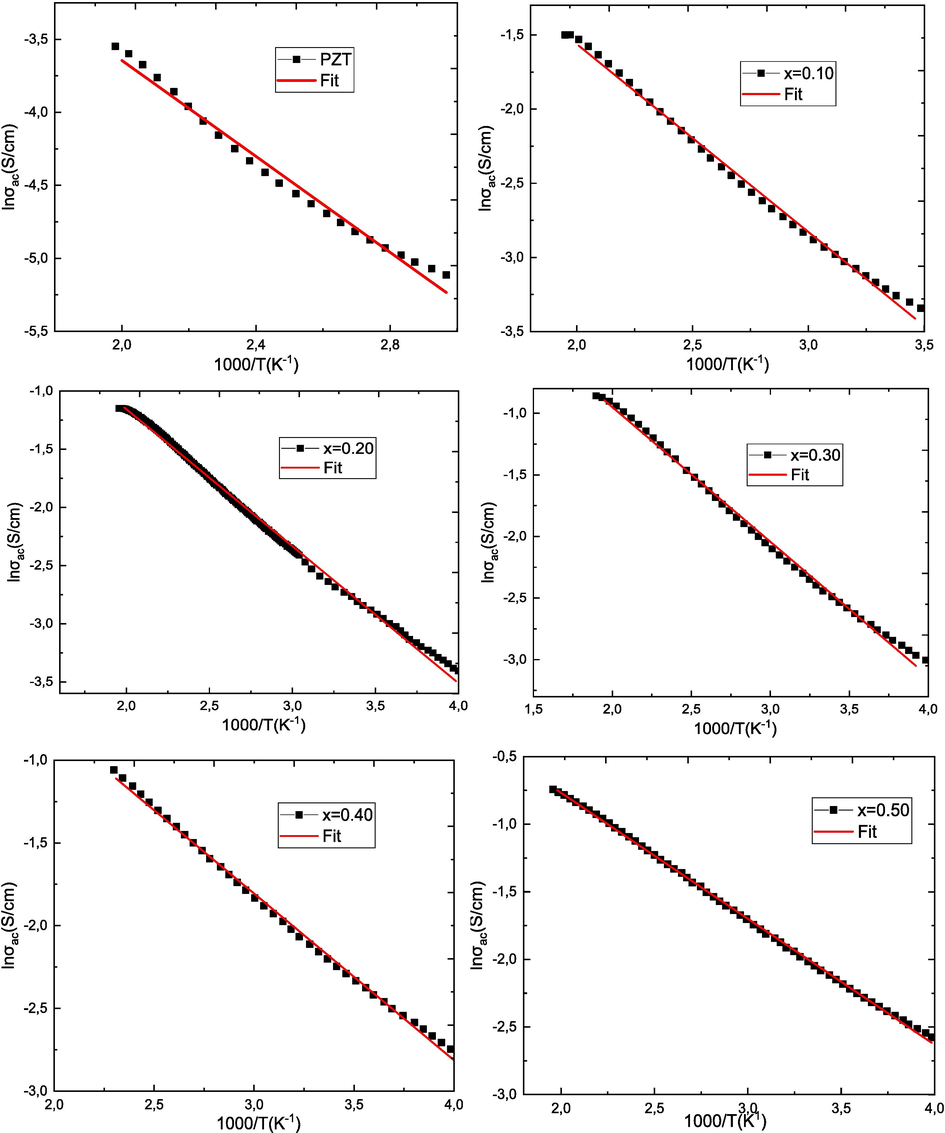
Activation energy (Ea) of (1-x)PZT-xCFO ceramics obtained by fitting to the Arrhenius equation.
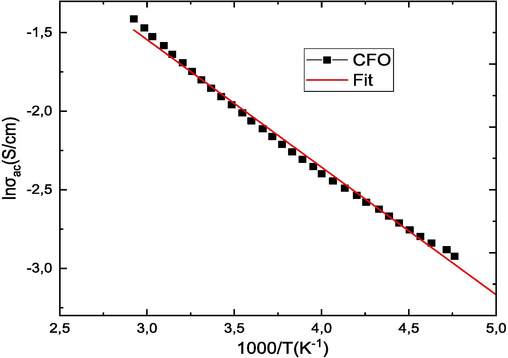
Activation energy (Ea) of (1-x)PZT-xCFO ceramics obtained by fitting to the Arrhenius equation.
σ0 is the pre-exponential factor, T is the temperature, KB is the Boltzmann constant KB = 1.38065 × 10⁻²³ J/K or 8.6173 x 10⁻⁵ eV/K) and Ea is the activation energy which is calculated using the following relationship
Where m is the value of the slope and e is the electron charge and the results are shown in Fig. 10 and Table 4. It can be seen that all samples have a decreasing linear behavior with increasing temperature. The type of temperature dependence of the conductivity indicates that electrical conduction in the material is a thermally activated process. It is observed that when the CFO rate increases, the activation energy decreases relatively. The decrease in activation energy when the CFO rate increases confirms the improvement in conductivity (Samad et al., 2019). This decrease is attributed to the novel cation distribution due to the small particle size. In ferrite materials, the activation energy is often associated with the change in charge carrier mobility rather than their concentration. The charge carriers are considered to be localized on the ions or vacant sites and conduction occurs by a hopping process. The calculated values of the activation energy are between 0.32 and 0.16. These values confirm that electron hopping is responsible for electrical conduction. Indeed, electron hopping between Fe2+↔ Fe3+ ions and hole hopping between Co3+↔ Co2+ ions in octahedral sites are responsible for electrical conduction and dielectric polarization in cobalt ferrite (De Boer and Verwey, 1937). The conduction mechanism in ferrites occurs mainly by hopping between Fe2+ and Fe3+ in the B sites according to Verwey [49]. The possibility of hopping depends on the separation between the ions involved and the activation energy.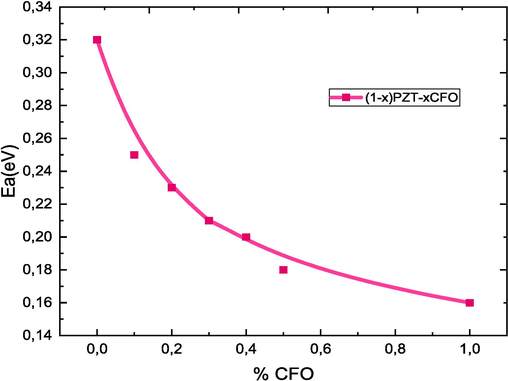
Evolution of the activation energy as a function of the CFO rate for (1-x)PZT-xCFO ceramics.
Valeurs de x
Energie d’activation(eV)
0.00
0.32
0.10
0.25
0.20
0.23
0.30
0.21
0.40
0.20
0.50
0.18
1.00
0.16
4 Conclusion
In summary, we have investigated DRX measurements, Raman spectra, SEM, frequency and temperature dependencies of the dielectric constant, impedance spectroscopy, and conductivity spectra of (1-x)PZT–xCFO multiferroic composites. DRX analysis and Rietveld refinement had been performed to indicate the coexistence of spinel CFO and perovskite PZT (tetragonal and Rhombohedral) phases in the (1-x)PZT–xCFO and no chemical reaction occurred between the PZT and CFO structures wich confirmed by Raman spectroscopy. The morphological studies have been performed using SEM and the study shows that the grain. The variation of the dielectric constant as a function of the temperature of PZT–CFO composites indicates that the Tm shifts to a higher temperature when the frequency increases, indicating frequency dispersion of the dielectric constant over a wide temperature range, and the dielectric permittivity values increase in the composites until the composition corresponding to x = 0.3 From 485 To 1620 at 5KHz) and then decreases until 65 for x = 1.00. Impedance spectroscopy analysis was effected under a wide range of frequencies and temperatures. The Cole–Cole plots exhibit Debye-type relaxation. The frequency-dependent dielectric dispersion behavior of the composite indicates the possibility of many relaxation processes, which Koop's phenomenological theory can explain. The activation energy of the sample was calculated from Arrhenius’s plot of σdc conductivity versus the inverse of temperature and when the CFO rate increases, it decreases from 0.32 at x = 0.00 to 0.16 at x = 0.00.
Declaration of competing interest
The authors declare that they have no known competing financial interests or personal relationships that could have appeared to influence the work reported in this paper.
References
- Asian J. Chem.. 2018;30(18):2424-2430.
- IOP Conf. Ser. Mater. Sci. Eng. 2021:1-3.
- Dielectric and electrical properties of synthesized PBGO/Fe3O4 nanocomposite. Ceram. Int.. 2021;47(18):26224-26232.
- [Google Scholar]
- Magnetic, dielectric and magnetoelectric properties in (1–x)Pb(Zr0.52Ti0.48)O3 + (x)CoFe2O4 composites. J. Mater. Sci.: Mater. Electron. 2015
- [Google Scholar]
- E. Buixaderas, M. Berta, L. Kozielski, and I. Gregora, “Phase Transitions : A Multinational Raman spectroscopy of Pb (Zr1-x Ti x) O 3 graded ceramics around the morphotropic phase boundary,” Phase Transitions, no. July 2013, pp. 37–41, doi: 10.1080/01411594.2011.552049.
- Cation distribution and particle size effect on Raman spectrum of CoFe2O4. J. Solid State Chem.. 2011;184(1):89-96.
- [CrossRef] [Google Scholar]
- Large magnetoelectric properties in CoFe2O4:BaTiO3 core-shell nanocomposites. J. Magn. Magn. Mater.. 2015;377:441-445.
- [CrossRef] [Google Scholar]
- Impedance spectroscopy and conductivity mechanism of CoFe2O4-Pb(Zr0.53Ti0.47)O3 composite thick films. J. Alloys Compd.. 2010;508(1):141-146.
- [CrossRef] [Google Scholar]
- W Chen, Z H Wang, W Zhu, and O K Tan, Ferromagnetic, ferroelectric and dielectric properties of Pb(Zr0 .53Ti0 .47)O3/CoFe2O4 multiferroic composite thick films, J. Phys. D: Appl. Phys. 42 (2009) 075421 (5pp).
- D. Chien et al., “Tuning magnetoelectric coupling using porosity in multiferroic nanocomposites of ALD-grown Pb(Zr,Ti)O3 and templated mesoporous CoFe2O4,” Appl. Phys. Lett., vol. 109,no. 11, 2016, doi: 10.1063/1.4962536.
- J. H. De Boer and E. J. W. Verwey, “Semi-conductors with partially and with completely filled 3 d -lattice bands,” IOPscience, vol. 59, 1937.
- Raman spectroscopic study of phase transitions in undoped morphotropic PbZr1 -xTixO3. J. Raman Spectrosc.. 2011;42(3):488-495.
- [CrossRef] [Google Scholar]
- In situ sol–gel synthesis under controlled pH and microwave sintering of PZT/CoFe2O4 magnetoelectric composite ceramics. Ceram. Int.. 2016;42(2):3239-3249.
- [CrossRef] [Google Scholar]
- In situ sol-gel co-synthesis under controlled pH and microwave sintering of PZT/CoFe2O4 magnetoelectric composite ceramics. Ceram. Int.. 2016;42:3239-3249.
- [Google Scholar]
- In situ sol-gel co-synthesis at as low hydrolysis rate and microwave sintering of PZT/Fe2CoO4 magnetoelectric composite ceramics. Ceram. Int.. 2017;43:5925-5933.
- [Google Scholar]
- Optical, magnetic and electrical investigation of cobalt ferrite nanoparticles synthesized by co-precipitation route. J. Alloys Compd.. 2010;507(1):201-206.
- [CrossRef] [Google Scholar]
- Zhenghe Hua, Pan Yang, Hongbo Huang, Jianguo Wan, Zhong-Zhen Yu, Shaoguang Yang, Mu Lu, Benxi Gu, Yeiwei Du, Sol-gel template synthesis and characterization of magnetoelectric CoFe2O4/Pb(Zr0.52Ti0.48)O3 nanotubes, Materials Chemistry and Physics 107 (2008) 541–546.
- The dielectric study of ethylene glycol as a coolant using davidson- cole relaxation model. Curr. J. Appl. Sci. Technol.. 2019;32(5):1-7.
- [CrossRef] [Google Scholar]
- In situ preparation of CoFe2O4-Pb(ZrTi)O3 multiferroic composites by gelcombustion technique. J. Eur. Ceram. Soc.. 2009;29(13):2807-2813.
- [CrossRef] [Google Scholar]
- On the dispersion of resistivity and dielectric constant of some semiconductors at audiofrequencies. Phys. Rev.. 1951;83(1):121-124.
- [CrossRef] [Google Scholar]
- Impact of different morphologies of CoFe2O4 nanoparticles for tuning of structural, optical and magnetic properties. J. Alloys Compd.. 2019;778(December):398-409.
- [CrossRef] [Google Scholar]
- Hydrothermal synthesis and electrochemical properties of MnFe2O4 nanoplates. Adv. Mater. Lett.. 2017;8(11):1052-1056.
- [Google Scholar]
- J. Appl. Phys.. 2005;98:093703.
- Cationic distribution of nickel doped NixCoX-1Fe2O4 nanoparticles prepared by hydrothermal approach: Effect of doping on dielectric properties. Mater. Chem. Phys.. 2021;264:124451
- [Google Scholar]
- Cobalt doping of nickel ferrites via sol-gel approach: effect of doping on the structural and dielectric properties. Z. Phys. Chem.. 2021;235(12):1811-1829.
- [Google Scholar]
- Avinandan Mandal, Debasis Ghosh, Asish Malas, Parthajit Pal, and Chapal Kumar Das, Synthesis and Microwave Absorbing Properties of Cu-Doped Nickel Zinc Ferrite/Pb(Zr0.52Ti0.48)O3 Nanocomposites, Journal of Engineering Volume 2013, Article ID 391083, 8 pages.
- BaTiO3–Ni0.5Zn0.5Fe2O4 ceramic composites with ferroelectric and magnetic properties. J. Eur. Ceram. Soc.. 2007;27:4379-4382.
- [Google Scholar]
- Preparation and magnetic properties of nano-size nickel ferrite particles using hydrothermal method. Chem. Cent. J.. 2012;6:23.
- [Google Scholar]
- J. Mater. Sci.. 2007;42:1037.
- [CrossRef]
- B. Noheda and J. A. Gonzalo, Tetragonal-to-monoclinic phase transition in a ferroelectric perovskite: The structure of PbZr0.52Ti0.48O3, Physical Review B volume 61, number 13 1 April 2000.
- Impedance spectroscopy of multiferroic Pb ZrxTi1-x O3/Co Fe2 O4 layered thin films. Phys. Rev. B Condens. Matter Mater. Phys.. 2008;77(1):1-10.
- [CrossRef] [Google Scholar]
- Interfacial strain-mediated magnetoelectric coupling as reflected in extended X-ray absorption spectra of CoFe2O4-dispersed Pb(Zr, Ti)O3 matrix composites. J. Magn. Magn. Mater.. 2009;321(13):1971-1974.
- [CrossRef] [Google Scholar]
- Jian-hong Peng, Mirabbos Hojamberdiev, Hai-qing Li, Duo-lu Mao, Yuan-Juan Zhao, Peng Liu, Jian-ping Zhou, Gang-qiang Zhu, Electrical, magnetic, and direct and converse magnetoelectric properties of (1- x)Pb(Zr0.52Ti0.48)O3 (x)CoFe2O4 (PZT–CFO) magnetoelectric composites, Journal of Magnetism and Magnetic Materials 378 (2015) 298–305.
- Room temperature structure of PbZrxTi1-xO3 around the morphotropic phase boundary region: A Rietveld study. J. Appl. Phys.. September 2002;92(6):15.
- [Google Scholar]
- K. Roy, separating read and write units in multiferroic devices. Nature 5, 10822 (2015) [2] M. Liu, O. Obi, J. Lou, N. Sun, Tunable magnetoresistance devices based on multiferroic heterostructures. J. Appl. Phys. 109, 07D913 (2010).
- Structural, morphological and magnetic parameters investigation of multiferroic (1–x)Bi2Fe4O9-xCoFe2O4 nanocomposite ceramics. Ceram. Int.. 2017;43(17):14701-14709.
- [CrossRef] [Google Scholar]
- Structural, morphological and magnetic parameters investigation of multiferroic (1–x)Bi2Fe4O9- xCoFe2O4 nanocomposite ceramics. Ceram. Int.. 2017;43:14701-14709.
- [Google Scholar]
- R. Samad, M. ud D. Rather, K. Asokan, and B. Want, “Dielectric and magnetic properties of rare-earth-doped cobalt ferrites and their first-order reversal curve analysis,” Appl. Phys. A Mater. Sci. Process., vol. 125, no. 8, pp. 22–25, 2019, doi: 10.1007/s00339-019-2804-5.
- A.A.Sattar, H.M.EL-Sayed1 and Ibrahim.ALsuqia, Structural and Magnetic Properties of CoFe2O4/NiFe2O4 Core/Shell Nanocomposite Prepared By Hydrothermal Method, Journal ofMagnetism and Magnetic Materials.2015.
- Some symmetry aspects of ferroics and single phase multiferroics. J. Phys.: Condens. Matter. 2008;20:434201
- [Google Scholar]
- Synthesis and characterization of PZT : CF magnetoelectric composites Synthesis and characterization of PZT : CF magnetoelectric. Integr. Ferroelectr.. 2016;176(1):109-117.
- [CrossRef] [Google Scholar]
- Ordered multiferroic CoFe2O4-Pb(Zr0.52Ti0.48)O3 coaxial nanotube arrays with enhanced magnetoelectric coupling. RSC Adv.. 2017;7(46):29096-29102.
- [CrossRef] [Google Scholar]
- J. Eur. Ceram. Soc.. 2006;26:3031.
- Effects of annealing on the saturation induction of ferrites containing nickel and/or copper. J. Appl. Phys.. 1957;28(4):478-481.
- [CrossRef] [Google Scholar]
- Magnetoelectric CoFe2O4-lead zirconate titanate thick films prepared by a polyvinylpyrrolidone-assisted sol-gel method. Appl. Phys. Lett.. 2006;89:122914
- [Google Scholar]
- Synthesis of lead zirconate titanate-cobalt ferrite magnetoelectric particulate composites via an ethylene diamine tetra acetic acid-citrate gel process. Scr. Mater.. 2007;56(6):465-468.
- [CrossRef] [Google Scholar]
- Xiaobo Wu, Wei Cai, Yi Kan, Pan Yang, Yunfei Liu, Huifeng Bo, Xiaomei Lu, And Jinsong Zhu, Multiferroic Properties of CoFe2O4/PbZr0.52Ti0.48O3 Composite Ceramics, Ferroelectrics, 380:48–55, 2009.


