

Translate this page into:
Study of adsorption property and mechanism of lead(II) and cadmium(II) onto sulfhydryl modified attapulgite
⁎Corresponding author at: Erxianqiao Dongsan Road 1#, Chengdu, China. zhuxiaping@cdut.edu.cn (Xiaping Zhu)
-
Received: ,
Accepted: ,
This article was originally published by Elsevier and was migrated to Scientific Scholar after the change of Publisher.
Abstract
Study of the adsorption property and mechanism about the environmental functional material can provide theoretical guidance for its actual application. The sulfhydryl attapulgite (SH-ATP) was prepared by solution blending method. The saturated adsorption capacity to Pb2+ and Cd2+ in the experiment were 65.57 and 22.71 mg/g, which increased by 57.74% and 31.96% comparing with the attapulgite (ATP), respectively. The adsorption kinetics experiments illustrated that the adsorption of Pb2+ and Cd2+ onto SH-ATP accorded with multiple kinetic models. Among them, the pseudo second-order model had the best correlation, the correlation coefficients were all above 0.998. The adsorption thermodynamics experiments testified that the adsorption of Pb2+ and Cd2+ onto SH-ATP conformed to the Langmuir, Tempkin and Dubinin-Radushkevich models, those models indicated that the adsorption processes belonged to the monolayer adsorption, the adsorbent surface was homogeneous, and the micropore distribution of the adsorbent was also relatively uniform. Various thermodynamic parameters (ΔH > 0, ΔS > 0, ΔG < 0) under 25-45℃ indicated that the adsorption processes of Pb2+ and Cd2+ onto SH-ATP were endothermic and spontaneous.
Keywords
Sulfhydryl modified attapulgite
Lead and cadmium
Adsorption properties
Adsorption mechanism

1 Introduction
In recent decades, the development of industry and agriculture has caused heavy metals pollution such as lead and cadmium in soil and water, which poses a serious threat to the human living environment. The lead and cadmium are toxic metals, which are extremely harmful. Once lead and cadmium are introduced into the environment, which can hardly be degraded by chemical reactions or microbial activities (Zeng et al., 2017). The large-scale pollution accidents were caused by lead and cadmium, which occurred frequently in the history of human health. Japanese Itai-Itai Disease event was caused by cadmium poison. In Australia and New Zealand, cadmium accumulated in the viscera of grazing animals, making them inedible for human. Moreover, the lead-contaminated water event in Flint Michigan made a large number of local residents suffer from diseases such as nerves, hematopoiesis and kidneys.
At present, the remediation methods of lead and cadmium pollution soil and water mainly include electrochemical repair, adsorption, chemical precipitation and phytoremediation. Among them, the adsorption method has received great attention due to its high efficiency and low cost (Mondal, 2009). Now researchers have developed various adsorbents. Such as the maximal adsorption capacities for lead and cadmium by lipopeptides modified Na-montmorillonite were 20.3 and 19.5 mg/g, respectively (Zhu et al., 2013b). For another example, peat as a low-cost adsorbent removed Ni2+ and Pb2+ from aqueous solutions, and the adsorption capacities for Ni2+ and Pb2+ were 61.27 and 82.31 mg/g (Bartczak et al., 2018). Also, Bhattacharyya explored the various modified clays, in which the maximal adsorption capacities of lead and cadmium onto acidified modified montmorillonite reached 34.0 and 21.4 mg/g (Bhattacharyya and Sen Gupta, 2008). Other adsorbents such as Graphene Oxides, coconut, coir and biochar (Aliabadi et al., 2014; Yang et al., 2015; Revathi et al., 2016; Karunanayake et al., 2018) were also often used to restore lead and cadmium pollution in soil and water.
Now more and more attention focuses on removal of heavy metals from soil and wastewater by clay (Zhang et al., 2010; Arancibia-Miranda et al., 2016; Ma et al., 2017). It is because clay mineral has large surface areas, stable chemical, mechanical properties and a wide range of sources (Wang et al., 2007). Palygorskite is a clay mineral, also known as attapulgite (ATP), it is a kind of 2:1 layered hydrated magnesium aluminum silicate minerals with two bands of silica tetrahedra linked by magnesium ions in octahedral coordination (Yariv et al., 2011; Zhu et al., 2016). The ATP mainly contains Mg2+ and other cations such as Fe3+ and Al3+ (Gionis et al., 2007), which is fibrous, porous, charge in the lattice, abundant in reserve and environmentally friendly, and it has adsorption properties, cation exchangeability (Zhang et al., 2015). However, natural ATP often contains many impurities, so the adsorption capacity to heavy metals is low, the adsorptive force is weak, and natural ATP has non-specific adsorptivity. In order to improve its absorptivity, it is often modified, such as acid modification to remove impurities and increase specific surface area (Barrios et al., 1995), thermal modification to remove water molecules in the pore canal (Wang et al., 2012), and organic modification to enhance chemisorption capacity, etc. (Sarkar et al., 2011; Liang et al., 2013).
At present, there are few reports on sulfhydryl functionalized ATP. In addition to, the study on the adsorption mechanism to heavy metals is also very scarce. Krikorian used azeotropic distillation to treat attapulgite with 2-mercaptoethanol, the obtained material could remove>90% of 1.57 mmol/L of Pb2+ and Cd2+ (Krikorian and Martin, 2005). Liang successfully prepared sulfhydryl functionalized ATP by high-speed shearing method based on the rheological properties, and increased the adsorption capacities of Pb2+, Cd2+ and Cu2+ to 66.30, 30.35 and 25.42 mg/g (Liang et al., 2013). These modifications are complicated and expensive.
We used the solution blending method to modify the ATP (without any purification) with 3-mercaptopropyltrimethoxysilane, adding polyethylene glycol to improve the solid-liquid interface properties and enhance the dispersion effect of the ATP. The sulfhydryl groups grafted on the surface and interlayer of ATP markedly enhanced the adsorption to lead and cadmium. And we deeply explored the adsorption capacity, adsorption kinetics and adsorption thermodynamics, and clarified adsorption mechanism of modified material (SH-ATP) to lead and cadmium. All adsorption experiments were carried out on the condition of adding a certain amount of KNO3 which simulate the interference of other ions in the actual application. The study provides theoretical guidance for the application of SH-ATP in the remediation of lead and cadmium contaminated soil or water.
2 Experimental
2.1 Instruments and reagents
Tensor-27 Fourier transform infrared spectrometer (Bruker Daltonik GmbH, Germany), DX- 2700 X-ray diffractometer (Dandong Fangyuan Instrument Company, China), STA409PCLuxx Simultaneous thermal gravimetric analyzer (NETZSCH Machinery and Instruments Co., Ltd., Germany), AA1700 atomic absorption spectrometer (Zhejiang Fuli Analytical Instruments Inc, China).
The attapulgite was from Baiyin City, Gansu, China. The specific compositions are showed in Table 1. 3-Mercaptopropyltrimethoxysilane (SH) (>98%), Pb(NO3)2, Cd(NO3)2·4H2O, KNO3 and KOH were provided by Chengdu Chron Chemicals Co,.Ltd (Chengdu, China), and were of analytical grade.
Composition
Na2O
MgO
Al2O3
SiO2
K2O
CaO
Fe2O3
Total
Content (%)
0.70
7.68
8.50
40.44
1.47
15.96
5.02
79.77
2.2 Preparation of SH-ATP
SH-ATP was prepared with SH as modifier. 1.000 g of dry ATP was dispersed in 50.00 mL of ethanol solution with 5% 3-mercaptopropyltrimethoxysilane, and a small amount of polyethylene glycol was added, then the mixed solution was stirred for 7 h at room temperature. The precipitate was filtered, washed with distilled water, dried in vacuum at 60 °C, and then ground into powder.
2.3 Adsorption experiments
The solutions of Pb2+ and Cd2+ were prepared by dissolving the corresponding amount of metal salt in deionized water. The solutions and 0.250 g of SH-ATP were shaken on a rotary shaker. Adding KNO3 as an adsorption medium, the concentration of KNO3 was kept to 0.1 mol/L. According to the experimental results--the effect of pH on the adsorption of lead and cadmium by SH-ATP, it was finally determined that the pH of solutions were adjusted to 6.0 (Pb2+) and 6.5 (Cd2+) with 0.1 mol/L NaOH and 0.1 mol/L HCl. The mixed solutions were vibrated for 2 h at room temperature, and were centrifuged at 3500 r/min for 10 min, then the supernatant was kept for analyzing Pb2+ and Cd2+ with an atomic adsorption spectrometer. The adsorption rate η (%) and the adsorption capacity Qa (mg/g) were calculated according to formula (2-1) and (2-2).
2.4 Adsorption kinetics experiment
Adsorption kinetics is one of the important characteristics that defines the efficiency of an adsorbent, which can describe the adsorption rate of an adsorbent and explore the adsorption mechanism. The adsorption rate of the adsorbent is evidently controlled by the diffusion process and the residence time of the adsorbate adsorbed at the solid solution interface. Adsorption kinetics can be controlled by several independent processes acting in parallels or in series. These processes are externally mass transfer, bulk diffusion, intra-particle diffusion, and chemisorption. In order to determine the solute uptake rate and explain the transport of Pb2+ and Cd2+ to the surfaces of SH-ATP, different kinetic models were employed (see Table 2). Where qe is adsorption capacity at equilibrium (mg/g), qt is adsorption capacity at any time t (mg/g), t is time (min), k1 is rate constant of first-order adsorption (min−1), k2 is rate constant of second-order adsorption (g/mg·min), α is related to rate of chemisorption, τ is related to surface coverage, b is constant related to the extent of adsorption (L/mg) and kid is intraparticle diffusion rate constants.
Adsorption kinetics
Expression
Pseudo first-order model
Pseudo second-order model
Elovich model
Dual constant model
Webber–Morris model
Referring to the content of 2.3 above, the Pb2+ concentrations were 400, 600 and 800 mg/L, respectively, the adsorption time were 2, 5, 10, 20, 30, 45, 60, 120, 180, 240, 360, 540, 720, 1080, 1440, 1800, 2160 min. The Cd2+ concentrations were 100, 200 and 400 mg/L, respectively, the adsorption time were 2, 5, 10, 20, 30, 45, 60, 120, 180, 240, 360, 540, 720, 1080, 1440 min. Adsorption datum were fitted with pseudo first-order model, pseudo second-order model, Elovich model, dual constant model and Webber–Morris model (Ijagbemi et al., 2010; Javadian et al., 2015).
2.5 Adsorption thermodynamics experiment
Referring to the content of 2.3 above, the experiments were carried out at temperature of 288.15, 298.15, 308.15 and 318.15 K, respectively. The Pb2+ concentrations were 10, 20, 50, 100, 200, 400, 600, 800, 1200, 1600, and 2000 mg/L, respectively. The Cd2+ concentrations were 20, 50, 100, 200, 300, 400, 500, 600, 650, 700, 750 and 800 mg/L, respectively.
Acquired equilibrium data were fitted with different adsorption isotherm models (see Table 3), in order to have insight into the sorption mechanisms, surface properties and affinities of SH-AT for Pb2+ and Cd2+ adsorption. The adsorption datum were fitted by the Langmuir model, the Freundlich model, the D-R (Dubinin-Radushkevich) model, the Tempkin model, and the Florry-Huggins model (Freundlich, 1906; Langmuir, 1918; Eren, 2009). Where ce is equilibrium concentration (mg/L), KL is intensity of adsorption (L/mg), Qm is maximum adsorption at monolayer coverage (mg/g), RL is dimensionless separation factor, c0 is initial concentration (mg/L), Kf is freundlich adsorption constant, 1/n is adsorption index, QDR is D–R adsorption capacity (mg/g), ε is polanyi potential, γ is D–R adsorption energy constant (mol2/kJ2), E is sorption energy (kJ/mol), BT is tempkin isotherm energy constant (dimensionless), AT is tempkin adsorption potential (L/mg), bT is tempkin heat of sorption (kJ/mol), θ is rate of surface coverage, λ is the amount of adsorbate occupying the active sites of the adsorbent and KFH is equilibrium constant.
Adsorption isotherm models
Expression
Langmuir model
Freundlich model
D-R model
Tempkin model
,BT = RT/bT
Florry–Huggins model
,θ = 1−ce/c0
3 Results and discussion
3.1 The saturated adsorption of Pb2+ and Cd2+ onto ATP and SH-ATP
The saturated adsorption curves of Pb2+ and Cd2+ onto ATP and SH-ATP were exhibited in Fig. 1. With the increase of Pb2+ and Cd2+ concentrations, the adsorption capacities of ATP and SH-ATP were increasing, and the adsorption capacity of SH-ATP was more than that of ATP. ATP and SH-ATP reached the maximal adsorption capacity at Pb2+ concentration of 800 mg/L and Cd2+ concentration of 400 mg/L. The saturated adsorption capacities of ATP and SH-ATP to Pb2+ and Cd2+ (25 °C) were 41.57 and 65.57 mg/g, 17.21 and 22.71 mg/g, respectively. Compared with the ATP, the saturated adsorption capacities of Pb2+ and Cd2+ had a significant enhancement, and increased by 57.74% and 31.96%, respectively.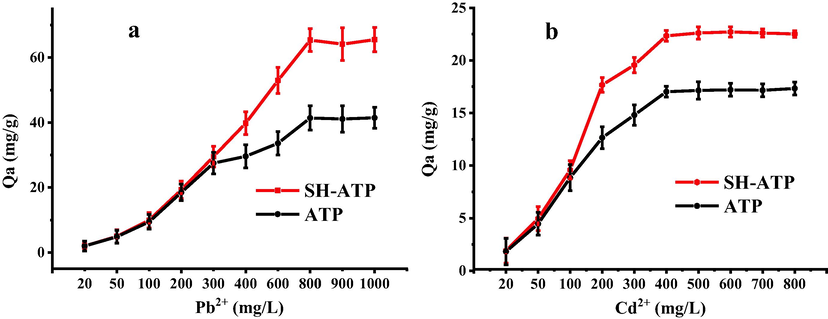
The adsorption of Pb2+ (a) and Cd2+ (b) onto SH-ATP and ATP.
Table 4 showed the results of adsorption of Pb2+ and Cd2+ on sulfhydryl modified clay minerals reported in some literatures. Except in that of Liang (Liang et al. 2011), the adsorption capacities of SH-ATP for Pb2+ and Cd2+ were comparable to the counterpart reported in other literatures, or were better than those. However, in other researches, ATP often require purification, or the modification process was complex and time consuming, and the modification cost was high, most of the literatures did not consider actual interference in studying the adsorption capacities of materials. The ATP used in this study had not been purified, the modification process was simple, fast, and inexpensive. Moreover the measure of adding a certain amount of KNO3 in the adsorption experiment fully considered the possible interference in actual application, so that the obtained results had the practical application value. Where MSEF-NT: 3-mercaptopropyltrimethoxysilane modified sepiolite of nanotexturization, MSEF-GF: 3-mercaptopropyltrimethoxysilane modified sepiolite, XYPAL-SH: 3-mercaptopropyltrimethoxysilane modified palygorskite, MPS-SEP: 3-mercaptopropyltrimethoxysilane modified sepiolite, MEAMONT 50: 2-mercaptoethylammonium modified montmorillonite, MMT-SH: mercaptan modified montmorillonite, TFB: 3-mercaptopropyltrimethoxysilane modified bentonite.
Adsorbents samples
Sorption capacity (mg/g)
References
Thiol-montmorillonite
Pb 72.52 Cd 26.67
Mercier and Detellier, 1995
2-mercaptoethanol montmorillonite
Pb 4.31 Cd 4.54
Krikorian and Martin, 2005
Mercaptoethanol-modified silica
Pb 10.42 Cd 4.75
Kosak et al., 2015
MSEF-NT
Pb 116.03 Cd 34.85
Liang et al., 2011
MSEF-GF
Pb 64.23 Cd 23.60
Liang et al., 2011
XYPAL-SH
Pb 66.30 Cd 30.35
Liang et al., 2013
MPS-SEP
Pb 10.77
Celis et al., 2000
MEAMONT50
Pb 48.90
Celis et al., 2000
MMT-SH
Cd 22.23
Zhu et al., 2013a
TFB
Pb 67.27
Xiong et al., 2012
SH-ATP
Pb 65.57 Cd 22.71
This work
3.2 Fitting results of adsorption kinetics models
The experiments about adsorption kinetics of Pb2+ and Cd2+ onto SH-ATP were carried out according to the experimental method described in 2.4. The results were shown in Fig. 2. The adsorption of Pb2+ and Cd2+ onto SH-ATP could be divided into different stages. At first, the adsorption rate increased, and eventually tended to balance with the increase of time. When the concentrations of Pb2+ and Cd2+ were larger, the absorption equilibrium time was longer, and there were more and more stages of absorption. When the concentrations of Pb2+ were 400, 600 and 800 mg/L, the experimental equilibrium adsorption capacities of SH-ATP to Pb2+ were 37.2, 57.1 and 72.3 mg/g, respectively. When the concentrations of Cd2+ were 100, 200 and 400 mg/L, the experimental equilibrium adsorption capacities were 10.0, 19.2 and 21.5 mg/g, respectively.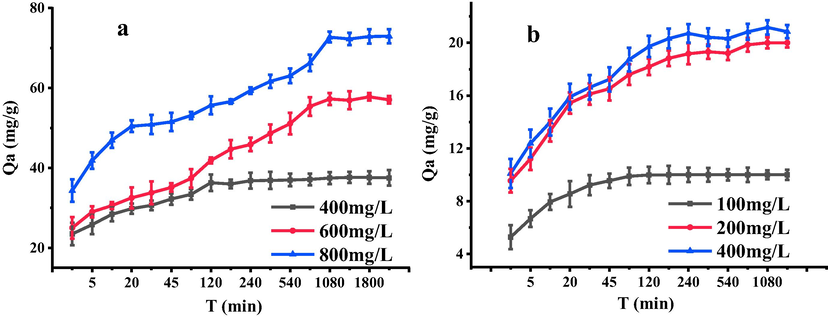
Adsorption kinetics of Pb2+ (a) and Cd2+ (b) onto SH-ATP.
Table 5 showed that the relevant parameters were obtained from the experimental data which were fitted into kinetic model. Based on the fitting correlation coefficient, the Pseudo second-order model described the adsorption of Pb2+ and Cd2+ onto SH-ATP, which was better than Dual constant model, Elovich model and Pseudo first-order model, and the fitting result of Webber-Morris model was worst.
Metals ion
Models
Parameters
400 mg/L
600 mg/L
800 mg/L
qe Exp.(mg/g)
37.2
57.1
72.3
Pb2+
Pseudo first-order model
k1
0.0122
0.0025
0.0026
qe Cal.(mg/g)
37.46
57.24
72.70
R2
0.9169
0.9560
0.9531
Pseudo second-order model
k2(g/mg min)
0.0266
0.0172
0.0136
qe Cal.(mg/g)
37.59
58.14
73.53
R2
1
0.9989
0.9984
Elovich model
α (g/mg min)
2.42E5
2.09E2
2.39E3
τ (mg/g)
0.49
0.20
0.19
R2
0.9147
0.9509
0.9718
Dual constant model
α (mg/g min)
3.1942
3.1470
3.5672
b
0.0649
0.1222
0.0967
R2
0.9845
0.9705
0.9667
Webber-Morris model
α (mg/g min1/2)
29.5766
30.983
45.071
b
0.2372
0.7093
0.7210
R2
0.5916
0.8913
0.8725
Metals ion
Models
Parameters
100 mg/L
200 mg/L
400 mg/L
qe Exp.(mg/g)
10.0
19.2
21.5
Cd2+
Pseudo first-order model
k1
0.0517
0.2004
0.0067
qe Cal.(mg/g)
10
19.95
20.66
R2
0.9865
0.8684
0.7157
Pseudo second-order model
k2(g/mg min)
6.22E−2
5.66E−3
7.13E−3
qe Cal.(mg/g)
10.02
20.08
21.01
R2
1
0.9998
0.9998
Elovich model
α (g/mg min)
1.58E4
8.40E2
9.35E2
τ (mg/g)
1.60
0.64
0.60
R2
0.752
0.9233
0.9137
Dual constant model
α (mg/g min)
1.8447
2.3398
2.4010
b
0.0787
0.1045
0.1037
R2
0.7094
0.8743
0.8743
Webber-Morris model
α (mg/g min1/2)
8.0513
13.829
14.697
b
0.0774
0.2223
0.2315
R2
0.3847
0.6134
0.5932
When Pb2+ concentration of 400, 600 and 800 mg/L were adsorbed by SH-ATP, the correlation coefficients of the Pseudo second-order model were>0.998, and the adsorption rate constant decreased with increasing of Pb2+ concentration. The calculated adsorption amounts were 37.59, 58.14 and 73.53 mg/L, which were in good agreement with the experimental values (37.2, 57.1 and 72.3 mg/L). When Cd2+ concentration of 100, 200 and 400 mg/L were adsorbed by SH-ATP, the correlation coefficients of the Pseudo second-order model were greater than 0.999. The adsorption rate constant decreased with increasing of Cd2+ concentration, compared with Pb2+, the rate constant was decreased more evidently. The calculated adsorption amounts were 10.02, 20.08 and 21.01 mg/L, which were well accord with the experimental values (10.0, 19.2 and 21.5 mg/L). The fitting results of the Pseudo second-order model showed that the adsorption of Pb2+ and Cd2+ might have taken place via surface exchange reactions until the surface functional sites were completely occupied, subsequently Pb2+ and Cd2+ diffuse into the SH-ATP layers for further interactions such as ion-exchange and complexation. Similar result was reported by Fan (Fan et al., 2008; Zheng et al., 2018).
3.3 Fitting results of adsorption thermodynamics model
The adsorption results of Pb2+ and Cd2+ onto SH-ATP at different temperatures were shown in Fig. 3. With the increase of Pb2+ and Cd2+ concentrations, the adsorption capacities gradually increased, and finally reached saturation, and the saturated adsorption capacities increased with increasing temperature. When the concentrations of Pb2+ and Cd2+ were less than 400 and 100 mg/L, respectively, the adsorption capacities were not much distinct at different temperatures, but with the increase of concentration, the effect of temperature was more and more obvious. In general, physical adsorption was an exothermic reaction, while chemisorption was an endothermic reaction. When the concentrations of Pb2+ and Cd2+ were low, primary adsorption forces of SH-ATP were physical adsorption such as electrostatic attraction and ion exchange. When the concentrations of Pb2+ and Cd2+ were high, the hydroxyl groups and the grafted sulfhydryl groups of SH-ATP could form complexation with Pb2+ and Cd2+. At temperature of 288.15, 298.15, 308.15 and 318.15 K, the saturated adsorption capacities of SH-ATP onto Pb2+ and Cd2+ in the experiment were 63.40, 65.62, 69.53, 78.45 mg/L and 18.71, 19.83, 21.25, 22.89 mg/L, respectively.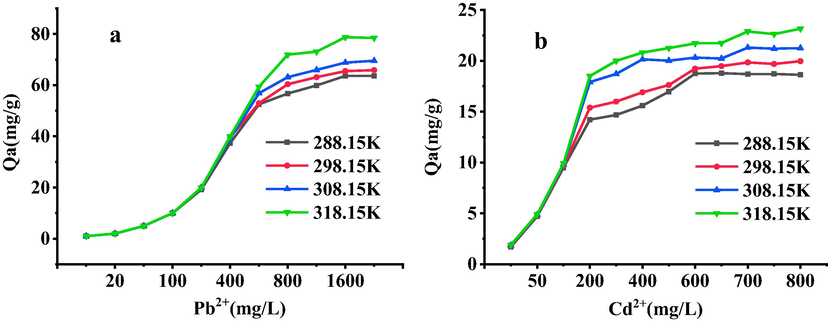
Adsorption isotherm of Pb2+(a) or Cd2+(b) onto SH-ATP.
The Tempkin model assumed a linear decrease in heat of adsorption with surface coverage. The D–R model can be used to estimate the characteristic porosity of adsorbents and their apparent energy of adsorption. Table 6 showed that the Tempkin and the D-R models agreed well with the experimental data, as the temperature increased, the adsorption capacity also increased (consistent with the experimental results), indicated that there was an interaction between SH-ATP and Pb2+(or Cd2+), and the micropore distribution of the SH-ATP was relatively uniform.
Metals ion
Models
Parameters
288.15 K
298.15 K
308.15 K
318.15 K
Pb2+
Langmuir
Qm (mg/g)
63.29
65.79
68.03
78.13
KL (L/mg)
0.0667
0.3071
0.0985
0.1860
R2
0.9973
0.9999
0.9967
0.9994
Freundlich
Kf
8.279
16.333
19.397
32.233
1/nf
0.3279
0.2455
0.1985
0.1496
R2
0.8555
0.7791
0.7612
0.8056
Tempkin
AT
7.443
33.780
130.73
1300.3
BT
7.0942
6.6963
5.8297
5.7834
R2
0.9582
0.9344
0.9232
0.9440
D-R
QDR (mg/g)
46.115
60.29
58.82
71.42
E (kJ/mol)
1.581
2.236
5.000
5.000
R2
0.9070
0.9767
0.9284
0.9641
Florry-Huggins
λ
−0.8756
−0.6022
−0.4673
−0.3571
KHF
2.15E−4
2.40E−4
3.11 E−4
2.83 E−4
R2
0.8467
0.8425
0.7753
0.8872
Metals ion
Models
Parameters
288.15 K
298.15 K
308.15 K
318.15 K
Cd2+
Langmuir
Qm (mg/g)
19.38
20.24
21.32
22.94
KL (L/mg)
0.0378
0.0480
0.0968
0.0986
R2
0.9946
0.9957
0.9987
0.998
Freundlich
Kf
7.568
8.575
10.257
11.131
1/nf
0.1426
0.1318
0.1191
0.1173
R2
0.9672
0.9733
0.8718
0.9026
Tempkin
AT
5.155
51.865
270.837
418.287
BT
2.3408
1.8967
1.7938
1.8525
R2
0.9486
0.9624
0.9114
0.941
D-R
QDR (mg/g)
17.070
18.198
20.223
21.383
E (kJ/mol)
0.408
0.707
0.791
1.581
R2
0.9396
0.9571
0.9779
0.9319
Florry-Huggins
λ
−1.5025
−1.2765
−1.1287
−0.9523
KHF
3.48E−4
3.80 E−4
3.92 E−4
4.40 E−4
R2
0.7908
0.8011
0.8095
0.7986
When the Freundlich model was used to fit the Pb2+ and Cd2+adsorptive datum, the correlation coefficient (R2) for Pb2+ adsorption were in 0.7612–0.8555, and for the Cd2+, the range were 0.8718–0.9733. The 1/nF values yielded from Freundlich model were less than 1, and as temperature rose, 1/nF were getting smaller and smaller (It was consistent with the conclusion of the thermodynamic experiment, the adsorption was the easier, as the temperature increased), indicating that Pb2+ and Cd2+ were favourably adsorbed by SH-ATP. This type of behavior had also been reported by Tahir and Rauf (2003).
The Florry-Huggins isotherm was not fitted into the adsorption of Pb2+ and Cd2+ onto SH-ATP, and it had also a bad linearity for SH-ATP equilibrium data.
Adsorption thermodynamic parameters were observed from Table 6, the equilibrium data for adsorption were best represented by Langmuir model. Compared with the other models, the R2 value were the highest. The calculated saturated adsorption capacities of Pb2+ and Cd2+ onto SH-ATP at the temperature of 288.15, 298.15, 308.15 and 318.15 K were 63.29, 65.79, 68.03, 78.13 mg/g and 19.38, 20.24, 21.32, 22.94 mg/g, respectively, which were basically the same as the saturated adsorption capacities in the experiment. Langmuir model had a favorable linearity for adsorption equilibrium data, and confirmed the monolayer coverage of Pb2+ and Cd2+ onto particles and the homogeneous distribution of active sites on SH-ATP, as Langmuir equation assumed that adsorbent surface was homogeneous. The Langmuir isotherm was found to be linear for SH-ATP over the entire concentration range studied.
The adsorption equilibrium constants (RL) in the Langmuir model were calculated and plotted with the corresponding initial concentrations of Pb2+ and Cd2+, the results were shown in Fig. 4. RL (Huang et al., 2011) were all in the range of 0–1. And the larger initial concentrations of Pb2+ and Cd2+ were, the closer the RL were to 0, it showed that the adsorption processes of Pb2+ and Cd2+ onto SH-ATP were inclined to occur. When the concentrations of Pb2+ and Cd2+ gradually increased, the adsorption processes presented more obvious irrelevance.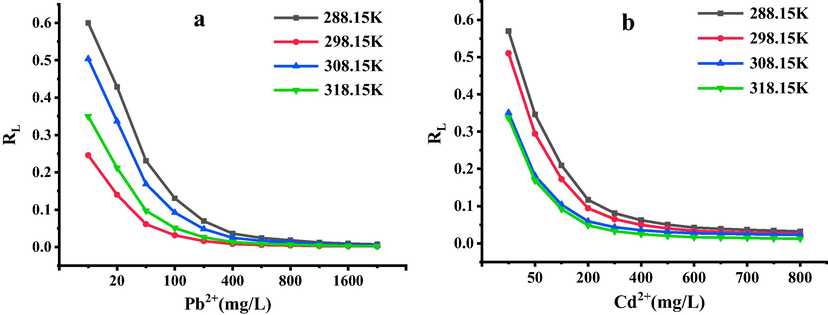
Relationship between the RL of Langmuir equation and the concentrations of Pb2+(a) and Cd2+(b).
3.4 Calculation results of thermodynamic parameters
In order to understand the type of adsorption of SH-ATP to Pb2+ and Cd2+, the thermodynamic parameters were calculated with the following equations (Zheng et al., 2018; Wang et al., 2019):
When ce infinitely approached 0, the conclusion (lnqe/ce = lnKd) was obtained, and when the ordinate was the lnKd and the abscissa was 1/T, the linear relationship were shown in Fig. 5. There was a good correlation between lnKd and 1/T. The thermodynamic parameters ΔG, ΔH and ΔS of the adsorption processes were further calculated with equations (3-1), (3-2) and (3-3), as were shown in Table 7. The enthalpy change (ΔHPb2+ and ΔHCd2+) were 107.03 kJ/mol and 40.801 kJ/mol, indicating that the adsorption reactions were endothermic, and the increase of temperature was beneficial to the reaction, which was consistent with the experimental results. The entropy change (ΔSPb2+ and ΔSCd2+) were 389.22 J/mol·K and 146.62 J/mol·K, which was favourable to the spontaneous reaction. The free energy (ΔG < 0) at different temperatures explained that the adsorption process was spontaneous, ΔG gradually increased with increasing temperature, the driving force of adsorption was also increased, it illustrated that the higher the temperature, the easier the reaction was.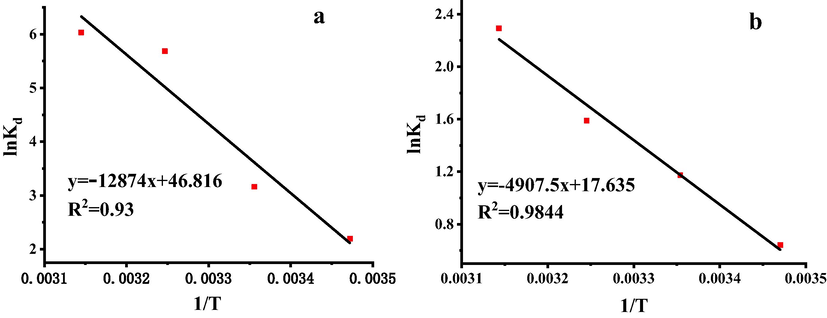
Van’t Hoff plot for Pb2+(a) and Cd2+(b)adsorption on SH-ATP.
Metals ion
T (K)
ΔH (kJ/mol)
ΔG (kJ/mol)
ΔS (J/mol·K)
Pb2+
288.15
107.034
−5.261
389.22
298.15
−7.841
308.15
−14.551
318.15
−15.955
Cd2+
288.15
40.801
−1.538
146.62
298.15
−2.909
308.15
−4.072
318.15
−6.063
3.5 Adsorption mechanism
There may were many forces for SH-ATP to adsorb Pb2+ and Cd2+, such as electrostatic attraction, ion exchange, surface and interlayer hydroxyl complexation, and grafted sulfhydryl complexation. When the concentrations of Pb2+ and Cd2+ were low, the adsorption processes were mainly physical adsorption. While the concentrations of Pb2+ and Cd2+ increased, the chemisorption adsorption became domination. Grafting sulfhydryl groups enhanced the complexing ability and the chemical adsorption capacity of SH-ATP to Pb2+ and Cd2+. The process of adsorbing Pb2+ and Cd2+ onto SH-ATP was monolayer adsorption, the adsorbent surface was homogeneous, and the micropore distribution was relatively uniform. The adsorption process (ΔH > 0, ΔG < 0, ΔS > 0) of Pb2+ and Cd2+ onto SH-ATP was endothermic and spontaneous, and the temperature rise was favorable for adsorption.
4 Conclusion
SH-ATP is a very good adsorbent. Its modification process is simple, the cost is low, and it has a well and applicable prospect. This work which study the adsorption amount, kinetics and thermodynamics of Pb2+ and Cd2+ onto SH-ATP, enable to lay the foundation for the practical application of SH-ATP.
-
(1)
The saturated adsorption capacities of ATP and SH-ATP to Pb2+ and Cd2+ (25 °C) are 41.57 and 65.57 mg/g, 17.21 and 22.71 mg/g, respectively. Compared with the ATP, the saturated adsorption capacities of Pb2+ and Cd2+ have a significant enhancement, and increased by 57.74% and 31.96%, respectively.
-
(2)
Adsorption kinetics indicates that the adsorption reactions of Pb2+ and Cd2+ may take place via surface exchange reactions until the surface functional sites are completely occupied, subsequently, the adsorption of Pb2+ and Cd2+ onto the SH-ATP will further interact such as ion-exchange and complexation.
-
(3)
Adsorption thermodynamics shows that the surface of SH-ATP is homogeneous, the micropore distribution is also relatively uniform, and the adsorption of Pb2+ and Cd2+ are a monolayer adsorption.
-
(4)
The adsorption enthalpy change (ΔH > 0), entropy change (ΔS > 0), adsorption reaction free energy (ΔG < 0) illustrate that the adsorption processes are spontaneous, endothermic, and involve in entropic increase. So temperature rise is conducive to the reaction.
Acknowledgement
We gratefully acknowledge the financial support from the Science & Technology Department of Guizhou Province ([2019]2833 and [2019]1424). We also gratefully acknowledge the financial support from the Science & Technology Department of Sichuan Province (2019YFN0148).
References
- Design and evaluation of chitosan/hydroxyapatite composite nanofiber membrane for the removal of heavy metal ions from aqueous solution. J. Taiwan Inst. Chem.. 2014;45:518-526.
- [Google Scholar]
- Nanoscale zero valent supported by Zeolite and Montmorillonite: Template effect of the removal of lead ion from an aqueous solution. J. Hazard. Mater.. 2016;301:371-380.
- [Google Scholar]
- Acid activation of a palygorskite with HCl: Development of physico-chemical, textural and surface properties. Appl. Clay Sci.. 1995;10:247-258.
- [Google Scholar]
- Removal of nickel(II) and lead(II) ions from aqueous solution using peat as a low-cost adsorbent: A kinetic and equilibrium study. Arabian J. Chem.. 2018;11:1209-1222.
- [Google Scholar]
- Adsorption of a few heavy metals on natural and modified kaolinite and montmorillonite: A review. Adv. Colloid Interface Sci.. 2008;140:114-131.
- [Google Scholar]
- Heavy metal adsorption by functionalized clays. Environ. Sci. Technol.. 2000;34:4593-4599.
- [Google Scholar]
- Removal of lead ions by Unye (Turkey) bentonite in iron and magnesium oxide-coated forms. J. Hazard. Mater.. 2009;165:63-70.
- [Google Scholar]
- Comparison of Ni2+ sorption to bare and ACT-graft attapulgites: effect of pH, temperature and foreign ions. Surf. Sci.. 2008;602(3):778-785.
- [Google Scholar]
- Combined Near-infrared and X-ray Diffraction Investigation of the Octahedral Sheet Composition of Palygorskite. Clays Clay Miner.. 2007;55:543-553.
- [Google Scholar]
- Equilibrium, kinetic and thermodynamic studies of adsorption of Cd(II) from aqueous solution onto HACC-bentonite. Desalination. 2011;280:297-304.
- [Google Scholar]
- Adsorptive performance of un-calcined sodium exchanged and acid modified montmorillonite for Ni2+ removal: Equilibrium, kinetics, thermodynamics and regeneration studies. J. Hazard. Mater.. 2010;174:746-755.
- [Google Scholar]
- Study of the adsorption of Cd (II) from aqueous solution using zeolite-based geopolymer, synthesized from coal fly ash; kinetic, isotherm and thermodynamic studies. Arabian J. Chem.. 2015;8:837-849.
- [Google Scholar]
- Lead and cadmium remediation using magnetized and nonmagnetized biochar from Douglas fir. Chem. Eng. J.. 2018;331:480-491.
- [Google Scholar]
- Adsorption of Mercury(II), Lead(II), Cadmium(II) and Zinc(II) from Aqueous Solutions Using Mercapto-Modified Silica Particles. Int. J. Appl. Ceram. Technol.. 2015;12:461-472.
- [Google Scholar]
- Extraction of Selected Heavy Metals Using Modified Clays. Environ. Lett.. 2005;40:601-608.
- [Google Scholar]
- The adsorption of gases on plane surfaces of glass, mica and platinum. J. Am. Chem. Soc.. 1918;40:1361-1403.
- [Google Scholar]
- Preparation and characterization of mercapto functionalized sepiolite and their application for sorption of lead and cadmium. Chem. Eng. J.. 2011;174:436-444.
- [Google Scholar]
- Heavy metal adsorbents mercapto and amino functionalized palygorskite: Preparation and characterization. Colloids Surf. A. 2013;426:98-105.
- [Google Scholar]
- Porous lignin based poly (acrylic acid)/organo-montmorillonite nanocomposites: Swelling behaviors and rapid removal of Pb (II) ions. Polymer. 2017;128:12-23.
- [Google Scholar]
- Preparation, characterization, and applications as heavy metals sorbents of covalently grafted thiol functionalities on the interlamellar surface of montmorillonite. Environ. Sci. Technol.. 1995;29:1318-1323.
- [Google Scholar]
- Removal of Pb(II) ions from aqueous solution using activated tea waste: Adsorption on a fixed-bed column. J. Environ. Manage.. 2009;90:3266-3271.
- [Google Scholar]
- Removal of copper (II) ions from synthetic electroplating rinse water using polyethyleneimine modified ion-exchange resin. Desalin. Water Treat.. 2016;57:20350-20367.
- [Google Scholar]
- Orange II adsorption on palygorskites modified with alkyl trimethylammonium and dialkyl dimethylammonium bromide-An isothermal and kinetic study. Appl. Clay Sci.. 2011;51:370-374.
- [Google Scholar]
- Thermodynamic studies of Ni(II) adsorption onto bentonite from aqueous solution. J. Chem. Thermodyn.. 2003;35(12):2003-2009.
- [Google Scholar]
- Exploration of the adsorption performance and mechanism of zeolitic imidazolate framework-8@graphene oxide for Pb(II) and 1-naphthylamine from aqueous solution. J. Colloid Interface Sci.. 2019;542:410-420.
- [Google Scholar]
- Adsorption characteristics of Cd(II) from aqueous solution onto activated palygorskite. Sep. Purif. Technol.. 2007;55:157-164.
- [Google Scholar]
- Study on adsorption thermodynamics and kinetics of thermal-modified attapulgite clay. Journal of Textile Research.. 2012;33:95-100.
- [Google Scholar]
- Kinetics and thermodynamics of adsorption of Pb2+ by mercapto-functionalized bentonite. Ion Exchange and Adsorption.. 2012;28:432-441.
- [Google Scholar]
- Competitive Adsorption of PbII, NiII, and SrII Ions on Graphene Oxides: A Combined Experimental and Theoretical Study. Chempluschem.. 2015;80:480-484.
- [Google Scholar]
- Few introducing comments on the thermal analysis of organoclays. J. Therm. Anal. Calorim.. 2011;105:897-906.
- [Google Scholar]
- Precipitation, adsorption and rhizosphere effect: The mechanisms for Phosphate-induced Pb immobilization in soils-A review. J. Hazard. Mater.. 2017;339:354-367.
- [Google Scholar]
- Removal of Pb(II) from water using synthesized kaolin supported nanoscale zero-valent iron. Chem. Eng. J.. 2010;163:243-248.
- [Google Scholar]
- A comparative study about adsorption of natural palygorskite for methylene blue. Chem. Eng. J.. 2015;262:390-398.
- [Google Scholar]
- Investigation of the adsorption mechanisms of Pb(II) and 1-naphthol by b-cyclodextrin modified graphene oxide nanosheets from aqueous solution. J. Colloid Interface Sci.. 2018;530:154-162.
- [Google Scholar]
- Mechanism study of cadmium(Ⅱ) adsorption on thiol-modified montmorillonite. Rock Min. Anal.. 2013;32:613-620.
- [Google Scholar]
- Kinetics and thermodynamics of Eu(III) and U(VI) adsorption onto palygorskite. J. Mol. Liq.. 2016;219:272-278.
- [Google Scholar]
- Removal of heavy metals from aqueous solution by lipopeptides and lipopeptides modified Na-montmorillonite. Bioresour. Technol.. 2013;147:378-386.
- [Google Scholar]


