

Translate this page into:
Supramolecular fluorescence sensing for quality evaluation of traditional Chinese medicine
⁎Corresponding authors. wangyf0622@tjutcm.edu.cn (Yuefei Wang), huxinyue@nankai.edu.cn (Xin-Yue Hu), dshguo@nankai.edu.cn (Dong-Sheng Guo)
-
Received: ,
Accepted: ,
This article was originally published by Elsevier and was migrated to Scientific Scholar after the change of Publisher.
Peer review under responsibility of King Saud University.
Abstract
To achieve reliable, effective, and rapid quality evaluation of complex traditional Chinese medicine (TCM) products, we proposed a supramolecular fluorescence sensing method based on pattern recognition. An azocalixarene-based sensor array was constructed to evaluate batch-to-batch consistency of Qufeng Zhitong Capsule (QZC). The molecular recognitions between azocalixarenes and the contents of QZC are transduced through the fluorescence signal output of the QZC itself or the applied indicator. Data simulations show that differences in composition and concentration between products can lead to altered fluorescence signals. Based on the constructed eight-element sensor array, a standard fluorescent fingerprint presented in a radar chart, was established by analyzing a large number of qualified samples, enabling the differentiation of qualified and unqualified QZC samples. The supramolecular fluorescence sensing method has the advantages of easy construction and fast response, which may provide a reference method and basis for establishing a new mode of quality evaluation of QZC and even other TCM.
Keywords
Supramolecular chemistry
Calixarenes
Sensor array
Traditional Chinese medicine
Quality evaluation

- TCM
-
traditional Chinese medicine
- QZC
-
Qufeng Zhitong Capsule
- LDA
-
linear discriminant analysis
- CAC4A
-
carboxylated azocalix[4]arene
- SAC4A
-
sulfonated azocalix[4]arene
- SAC5A
-
sulfonated azocalix[5]arene
- SAC8A
-
sulfonated azocalix[8]arene
- QAAC4A
-
quaternary-ammonium modified azocalix[4]arene
- TAAC4A
-
tertiary-ammonium modified azocalix[4]arene
- AlPcS4
-
Al(III) phthalocyanine chloride tetrasulfonic acid
- SHL
-
Shuanghuanglian
- RSD
-
relative standard deviation
- β-CD
-
β-cyclodextrin
- 2,6-TNS
-
2-(p-toluidinyl)naphthalene-6-sulfonic acid
- HP-β-CD
-
2-hydroxypropyl-β-cyclodextrin
- CB7
-
cucurbit[7]uril
- 1,8-ANS
-
8-anilino-1-naphthalenesulfonate
- DAPI
-
4′,6-diamidino-2-phenylindole
- UPLC-PDA
-
ultra-performance liquid chromatography with photodiode array detector
- HPLC-PDA
-
high performance liquid chromatography-photodiode array detector
- UHPLC-PDA-QTOF-MS/MS
-
ultra high performance liquid chromatography-photodiode array detector coupled with quadrupole time-of-flight mass spectrometry
- ATR-IR
-
attenuated total refraction infrared spectroscopy
- NIR
-
near-infrared spectroscopy
Abbreviations
1 Introduction
Controllable quality is the most fundamental attribute of commercially available drugs, and a comprehensive and effective quality evaluation system provides a guarantee for the quality and safety of their clinical application (Lü and Huang, 2008). Traditional Chinese medicine (TCM) products have diverse chemical components. Factors such as differences in the supply of raw and auxiliary materials and processes can also lead to variations in drug batches (Wang et al., 2011). Unlike Western medicine, whose chemical compositions are simple and definite, the quality evaluation of TCM is more challenging (Li et al., 2017). Normally, the quality evaluation of TCM is performed via high performance liquid chromatography, gas chromatography and thin-layer chromatography, which are based on the characteristic component chromatograms. Chromatographic techniques have been widely employed for quality assessment and standardization of TCM, due to the strong specificity, good reproducibility and accurate analytical results. (Cao, 2017, Huang et al., 2017, Bai et al., 2017, Li et al., 2018, Kang et al., 2018, Zhang et al., 2018, Bao et al., 2022, Xu et al., 2022, Yang et al., 2023). However, these methods rely on specific components with known molecular structures and chemical properties. The limited information provided might be not enough to comprehensively reveal the quality characteristics of some extremely complex TCM products (Yan et al., 2005). Besides, these methods suffer from complicated and laborious procedures, as well as time consumption, which limits their use on the production line. With the increasing demand for quality evaluation and control of TCM, it is urgent to develop a simpler and more convenient method to achieve rapid analysis of the quality of TCM.
In recent years, sensor array technology, which imitates mammalian gustatory and olfactory systems, has attracted considerable attention in the field of analytical chemistry. Different from the well-known single sensing, the array-based sensing works on the principle of cross-reactive interactions of one analyte and multiple non-specific receptors to generate distinct responses for each analyte. The responses generated through array-based sensing can be linked back to the analyte through pattern recognition, allowing for the creation of a unique fingerprint (Albert et al., 2000, Geng et al., 2018). Thus, this array-based approach is powerful in recognizing and classifying various analytes, especially for the complex mixtures whose structures and components are unknown (You et al., 2015). For the purposes of disease diagnosis, quality inspection, and environmental monitoring, sensor arrays have been successfully applied to the discrimination of amino acids (Wang et al., 2018), saccharides (Pushina et al., 2021), proteins (Saha et al., 2022), pesticides (Zhu et al., 2020), or complex systems such as cells (Rana et al., 2016), pathogens (Zhou et al., 2019), whiskies (Han et al., 2017) and liquors (Fan et al., 2020). Sensor arrays are also considered ideal for the quality evaluation of TCM, as TCM is a complex system consisting of multiple components (Ye et al., 2011, Wang et al., 2019). For example, the nanoenzyme-based sensor array constructed by Yuan et al. was applied to distinguish active substances in licorice for the first time (Yuan et al., 2023). Jia's group constructed colorimetric sensor arrays that were applied to the analysis of TCM. They were able to achieve the rapid identification of fritillarias and adulterated samples (Jia et al., 2021, Li et al., 2022), commercial American ginseng and Asian ginseng (Pan et al.,2019), as well as teas within different categories, grades and origins (Jia et al., 2021). As far as we know, no fluorescence sensor array has been developed for assessing the batch-to-batch reproducibility of holistic TCM.
To meet the necessary cross-reactivity for sensor arrays, macrocyclic receptors, the important carriers of supramolecular chemistry, are one of robust building materials (Anslyn, 2007, Liu et al., 2017, Geng et al., 2021). This is because macrocyclic receptors possess molecular recognition properties, and the inherent lack of specificity, compared with antibodies or aptamers, confers them the naturally cross-reactive property. In other words, the feature of the less selectivity makes macrocyclic receptors suitable for constructing sensor arrays (Beatty et al., 2019, Tian et al., 2022). To our knowledge, sensor arrays based on supramolecular macrocycles have not yet been applied to quality evaluation of TCM. In this work, we propose a supramolecular fluorescence array-based sensing method for the quality evaluation of TCM (Fig. 1a). The macrocyclic receptors act as recognition units, and the molecular recognition events can be easily converted into a macroscopic signal with the help of the fluorescent properties of the analytes themselves or the introduced fluorescent indicators. The sensor array, composed of multiple macrocyclic receptors, undergoes host−guest complexation with the analytes, thereby providing complementary unique fluorescence response for each TCM sample. The fluorescence fingerprint of each sample is established by a radar chart or linear discriminant analysis (LDA) chart to systematically analyze the batch-to-batch variation or enable semi-quantitative analysis for samples quality. As a proof-of-concept, we selected Qufeng Zhitong Capsule (QZC), a Chinese patent medicine officially listed in the Chinese Pharmacopoeia, to verify the feasibility and reliability of the proposed method (Liao et al., 2022). Based on the noncovalent interactions and fluorescence detection method, the rapid and high-throughput inspection process facilitates large-scale applications on the production line.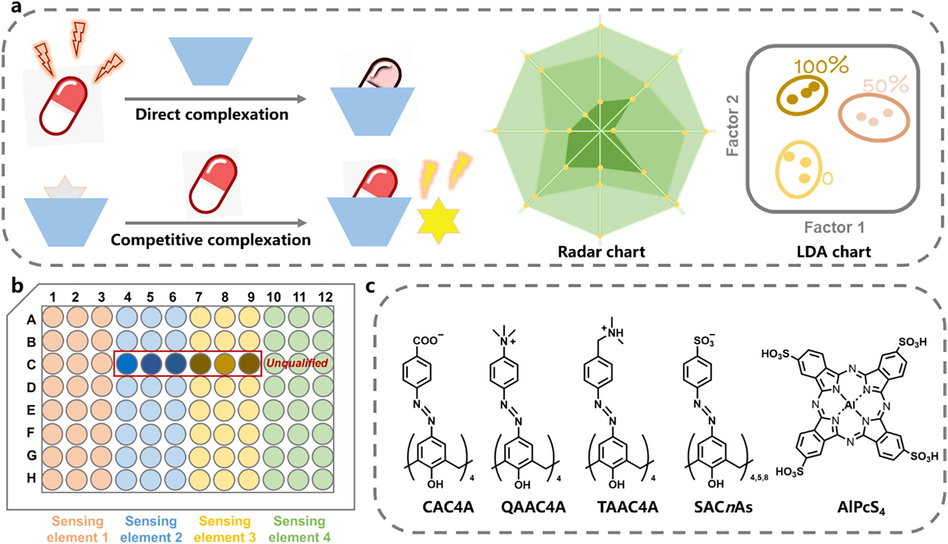
(a) Schematic illustration for direct complexation and competitive complexation supramolecular fluorescence sensing for quality evaluation of TCM. (b) Microplate setup employed for the supramolecular fluorescence sensor array. (c) Chemical structures of the calixarenes and dye used in this work.
2 Materials and methods
2.1 Materials
All the reagents and solvents were commercially available and used as received unless otherwise specified purification. Ten batches of QZC were obtained from Shaanxi Buchang Pharmaceutical Co., Ltd. The batch numbers are 180101, 180102, 180103, 180104, 180105, 180106, 180107, 180108, 180109 and 180110. Ten batches of Shuanghuanglian (SHL) injection were provided by Henan Fusen Pharmaceutical Co., Ltd. The batch numbers are 2002241, 2002251, 2002261, 2002271, 2002281, 2002291, 2002301, 2002311, 2002321 and 2002331. Carboxylated azocalix[4]arene (CAC4A), sulfonated azocalix[4]arene (SAC4A), sulfonated azocalix[5]arene (SAC5A) and sulfonated azocalix[8]arene (SAC8A) were synthesized and purified according to the literature procedures (Zhang et al., 2020, Zhang et al., 2021, Yue et al., 2022). The syntheses and characterizations of quaternary-ammonium modified azocalix[4]arene (QAAC4A) and tertiary-ammonium modified azocalix[4]arene (TAAC4A) are shown in Supplementary Information. Al(III) phthalocyanine chloride tetrasulfonic acid (AlPcS4) was obtained from Frontier Scientific. β-cyclodextrin (β-CD) and 2-hydroxypropyl-β-cyclodextrin (HP-β-CD) were purchased from Heowns Biochemical Technology. Cucurbit[7]uril (CB7) was purchased from Beijing Hwrk Chemicals. 8-anilino-1-naphthalenesulfonate (1,8-ANS) and 2-(p-toluidinyl)naphthalene-6-sulfonic acid (2,6-TNS) were purchased from Tokyo Chemical Industry. 4′,6-diamidino-2-phenylindole (DAPI) was purchased from Sigma-Aldrich. The phosphate buffered saline (PBS, pH = 7.4, 10 mM) was purchased from Macklin. Methanol (HPLC grade) was purchased from Aladdin. Calixarenes and AlPcS4 were dissolved in ultrapure water prepared by Thermo Scientific purification system, except for CAC4A and TAAC4A which were dissolved in PBS.
2.2 Instruments
Steady-state fluorescence spectra were recorded in a conventional quartz cell (light path 10 mm) on a Varian Cary Eclipse spectrometer (Agilent Technologies Inc., USA) equipped with a Varian Cary single-cell peltier accessory to control temperature. The ultrasonic cleaner used to extract the ingredients is SW 6H of SONO SWISS. High speed refrigerated centrifuge was purchased from Sichuan Shuke Instrument Co., Ltd. QUINTIX35-1CN one hundred thousandth electronic balance was purchased from Sartorius Scientific Instruments (Beijing) Co., Ltd.
2.3 Extraction method
The powder in the capsules (500.0 mg) precisely weighed was transferred into a 25.0 mL volumetric flask and then 75% methanol aqueous solution was added to the flask until it reached the scale line. The mixture was ultrasonically extracted at 60 °C for 30 min and then cooled to room temperature. The extracted solution was centrifuged at 12700 rpm for 10 min to obtain the QZC extract supernatant at a concentration of 20.0 mg/mL, which was subsequently diluted for use in the analysis system.
2.4 Fluorescence spectroscopy
For CAC4A, SAC4A, SAC5A, SAC8A, QAAC4A, TAAC4A sensing elements, the QZC extract (2.5 μL) was diluted into water (2.5 mL) in a quartz cuvette firstly. Then, one of the calixarene solutions (0.2 mM CAC4A 10.0 μL, 1.0 mM SAC4A 2.5 μL, 1.0 mM SAC5A 5.0 μL, 1.0 mM SAC8A 5.0 μL, 0.5 mM QAAC4A 20.0 μL, and 0.5 mM TAAC4A 20.0 μL) was added and thoroughly mixed. The equilibrium time is three minutes for CAC4A and SACnAs, and ten minutes for QAAC4A and TAAC4A. I0 and I are the fluorescence intensities of QZC extract before and after addition of calixarene at 403 nm under excitation at 325 nm.
For QAAC4A/AlPcS4 and TAAC4A/AlPcS4 sensing elements, the fluorescence signal of AlPcS4 was used to indicate the concentration of compounds from QZC through the process of competitive complexation. Firstly, the fluorescence intensity of AlPcS4 (1.0 μM, 2.5 mL) as I0 (excitation wavelength at 610 nm and emission wavelength at 680 nm) was recorded. Then the calixarene solution (0.5 mM QAAC4A 5.0 μL or 0.5 mM TAAC4A 5.0 μL) and the QZC extract at 20.0 mg/mL (10.0 μL for QAAC4A/AlPcS4 sensing or 5.0 μL for TAAC4A/AlPcS4 sensing) were added. After incubating for ten minutes, the fluorescence intensity at equilibrium was measured as I. Fluorescence intensity ratios (I/I0) were calculated and recorded.
2.5 Methodological evaluation
2.5.1 Intraday precision experiments
One QZC sample solution was prepared following the steps outlined in section 2.3. Each sensing element was used to test the same solution six times in one day, following the steps described in section 2.4. For the CAC4A, SAC4A, SAC5A, SAC8A, QAAC4A, and TAAC4A sensing elements, the fluorescence intensity of QZC was recorded before and after adding calixarenes, denoted as I0 and I, respectively. For the QAAC4A/AlPcS4 and TAAC4A/AlPcS4 sensing elements, the fluorescence intensity of AlPcS4 was recorded as I0 and I, respectively, before and after adding calixarenes and QZC. The intraday precision was investigated by calculating the relative standard deviation (RSD) value of the six I/I0 data for each sensing element.
2.5.2 Interday precision experiments
One QZC sample solution was prepared following the procedure outlined in section 2.3, and the samples were analyzed using the method described in section 2.4. Each sensing element was tested six times to obtain the average I/I0 value for the day. The experiments were conducted continuously for three days, and the interday precision was investigated by calculating the RSD between the three days.
2.5.3 Repeatability experiments
QZC was used to prepare six testing solutions in parallel following the extraction method outlined in section 2.3. Each sensing element was used to measure six testing solutions, and six I/I0 values were obtained following the steps described in section 2.4. The repeatability was investigated by calculating the RSD value of I/I0.
2.6 Discrimination of different concentrations
AlPcS4 was added to a black 96-well plate to obtained the final concentration at 1.0 μM and fluorescence intensity (I0) was measured on a microplate reader. Then QZC extract and QAAC4A or TAAC4A were introduced to give final concentrations from 22.5 to 90.0 μg/mL for QZC extract and 1.0 μM for the employed calixarenes, which were mixed and incubated for 10 min at 25 °C. The fluorescence intensity of each well was recorded (I). The obtained relative fluorescence intensities (I/I0) were used as the response signals for array sensing analysis. Each set of target experiments was repeated six times. Finally, the raw data matrix was handled using linear discriminant analysis (LDA) in Past 3 program.
2.7 Fluorescence spectroscopy for SHL injection
β-CD and 2,6-TNS were diluted into water (2.5 mL) in a quartz cuvette to obtained the final concentrations at 800.0 μM and 10.0 μM, respectively. I0 and I are the fluorescence intensities before and after 5.0 μL SHL injection addition to the solutions at 470 nm under excitation at 350 nm.
HP-β-CD and 2,6-TNS were diluted into water (2.5 mL) in a quartz cuvette to obtained the final concentrations at 1.0 mM and 10.0 μM, respectively. I0 and I are the fluorescence intensities before and after 5.0 μL SHL injection addition to the solutions at 446 nm under excitation at 350 nm.
CB7 and 1,8-ANS were diluted into water (2.5 mL) in a quartz cuvette to obtained the final concentrations at 1.0 mM and 10.0 μM, respectively. I0 and I are the fluorescence intensities before and after 4.0 μL SHL injection addition to the solutions at 490 nm under excitation at 350 nm.
CB7 and DAPI were diluted into water (2.5 mL) in a quartz cuvette to obtained the final concentrations at 2.0 μM and 1.0 μM, respectively. I0 and I are the fluorescence intensities before and after 5.0 μL SHL injection addition to the solutions at 470 nm under excitation at 361 nm.
3 Results and discussion
3.1 Principle of supramolecular sensor array
The underlying reason that the sensor array can evaluate TCM is that it can give specific fingerprints for qualified samples and unqualified samples. QZC extracts contain compounds that show fluorescence emission under the excitation wavelength of 325 nm (Fig. S6). If part of the fluorescence could be altered after the macrocyclic receptor complexes the fluorescent substance in the extract, this would lead to a changed output signal by constructing direct sensing. For qualified samples, the starting fluorescence signals (only the sample) were consistent, and when the complex system reached the equilibrium, the final output signal should also be consistent. To explain the discrimination principle of sensor arrays more clearly, we propose a theoretical model based on host−guest recognition. As shown in Table S1, we considered that the analyte (guest) formed a 1:1 host−analyte complex with a host at an association constant (Ka), which satisfied the respective law of mass action relating to the equilibrium concentrations of free host, free analyte, and host-analyte complex. The addition of macrocycles caused a change in the concentration of the free analyte, which in turn resulted in a change in the fluorescence signal of the system. The components or concentrations of unqualified products differ from those of qualified products. Therefore, we simulated unqualified products by assigning different Ka (simulating the case of different components) and analyte concentrations (simulating the case of different concentrations). According to the simulated calculations, if two analytes have Ka values of 1 × 10⁵ and 5 × 10⁵ M−1 with the same macrocycle, the fluorescence change ratios they produce at the same concentration are 0.62 and 0.27; if the concentrations of specific analytes are 1.0 and 0.5 μM, then the fluorescence change ratios of the system after complexation are 0.62 and 0.56, respectively (Table S1). The well-defined binding constants between the supramolecular host and guest imply that the specific macrocycles can produce reliable output signals for the qualified samples under the same conditions. In addition, the inconsistent components or concentrations of qualified and unqualified products will inevitably result in different output signals.
Another regularly used method is indicator displacement assay (IDA). The competitive binding of the indicator and the analyte to a receptor results in the fluorescence change of the indicator, thereby enabling the translation of the microcosmic behavior of molecular recognition into the macroscopic signal (You et al., 2015). Compared with direct sensing, the fluorescence changes relying on the IDA strategy can better reflect the content information of analytes lacking chromophores in QZC, which is complementary and even more applicable to other TCM that do not emit fluorescence. Data simulations are presented in Table S2. Assuming that the dye concentration stays within the linear range of fluorescence intensity versus concentration, then the ratio of fluorescence intensity before and after adding the analyte can be predicted. Simulations show that if the binding constants of the two competitive guests (Kc) to the macrocycle are 1 × 10⁷ and 5 × 10⁶ M−1, the IDA-based fluorescence response ratios are 2.54 and 2.07; if the concentrations of a specific analyte are 1.0 and 0.5 μM, the fluorescence response ratios are 2.54 and 1.91, respectively (Table S2). Both the host−dye and host−analyte have fixed binding constants, so that different concentrations of analytes result in varying degrees of dye displacement, leading to characteristic fluorescence response ratios. Although our data simulations focus on a single analyte, every guest in the complex system, QZC, follows the same binding pattern. There is a specific apparent binding constant between qualified QZC mixture and the host, and composition and concentration anomalies in unqualified products can lead to signal differences.
Due to the difference of binding abilities between the receptors and compounds from QZC, the degrees of complexation of the same sample by different receptors are different, which are reflected in the difference of fluorescence signal. Combining all sensing elements to form an array provides multi-dimensional information, which gives a composite response to the components of the TCM product. Overall, the sensor array could produce a fingerprint for each batch of QZC. If the qualified products have good batch-to-batch reproducibility, their compositions and contents are varied in an acceptable range, which leads to the consistent complexation equilibrium between the sensor array and compounds, and the reflected fluorescence signals must be consistent. Conversely, unqualified products will have abnormal fluorescence patterns (Fig. 1b).
As a kind of macrocyclic host, the molecular recognition of calixarenes in aqueous medium has attracted widespread attention (Pan et al., 2021, Wu et al., 2022) and has been widely used in the field of sensing (Zheng et al., 2018, Zheng et al., 2019, Yu et al., 2019). Calixarenes are macrocycles consisting of phenolic units connected by methylene groups at the 2- and 6-positions (as shown in Fig. S1). By modifying the 4-position of the phenol unit (i.e., the upper rim of calixarenes), it is possible to provide additional recognition sites to the calixarenes. In our previous research, azobenzene modification allowed calixarenes to be extended longitudinally, and the deep cavities endowed azocalixarenes good recognition ability for many guests and even neutral molecules (Geng et al., 2019, Li et al., 2022, Yue et al., 2022, Zhang et al., 2020). Considering the complex chemical compositions and rich compound structures in QZC extracts, we selected azocalixarenes with different upper rim modifications and skeleton sizes for constructing sensor array. Four negatively-charged (CAC4A, SAC4A, SAC5A, and SAC8A) and two positively-charged azocalixarenes (QAAC4A and TAAC4A) were used in this work (Fig. 1c). These calixarenes with different recognition properties can provide complementary and cross-reactive interactions for multiple target analytes. Fig. 2a−f showed that the fluorescence of QZC extracts were partly quenched by CAC4A, SAC4A, SAC5A, SAC8A, QAAC4A and TAAC4A, but in different extent. Besides, more sensing units were introduced based on IDA strategy to provide more available information. A fluorescent molecule, AlPcS4 can be complexed by QAAC4A and TAAC4A, and its fluorescence can be significantly quenched at 680 nm. After adding the QZC extracts, the replace of dye from calixarene cavities resulted in the recovery of fluorescence. Essentially, the QAAC4A/AlPcS4 and TAAC4A/AlPcS4 reporter pairs allowed for a fluorescence “switch-on” sensing of compounds from QZC (Fig. 2g and h). The ratio of fluorescence intensity, I/I0 (the black line represents I0 and the red line represents I in Fig. 2), was used as the response signal of supramolecular fluorescence sensing. Therefore, an eight-element sensing system consisting of CAC4A, SAC4A, SAC5A, SAC8A, TAAC4A, QAAC4A, QAAC4A/AlPcS4 and TAAC4A/AlPcS4 was carefully constructed.![(a−f) Fluorescence quenching of QZC extracts by the host−guest complexation of CAC4A, SAC4A, SAC5A, SAC8A, QAAC4A and TAAC4A (λex = 325 nm). [QZC] = 20.0 μg/mL, [CAC4A] = 0.8 μM, [SAC4A] = 1.0 μM, [SAC5A] = [SAC8A] = 2.0 μM, [QAAC4A] = [TAAC4A] = 4.0 μM. (g−h) Fluorescence quenching of AlPcS4 (λex = 610 nm) by the host−guest complexation of QAAC4A and TAAC4A, and reactivation by QZC extracts displacement. [QAAC4A] = [AlPcS4] = 1.0 μM and [QZC] = 80.0 μg/mL, [TAAC4A] = [AlPcS4] = 1.0 μM and [QZC] = 40.0 μg/mL.](/content/184/2023/16/8/img/10.1016_j.arabjc.2023.104974-fig2.png)
(a−f) Fluorescence quenching of QZC extracts by the host−guest complexation of CAC4A, SAC4A, SAC5A, SAC8A, QAAC4A and TAAC4A (λex = 325 nm). [QZC] = 20.0 μg/mL, [CAC4A] = 0.8 μM, [SAC4A] = 1.0 μM, [SAC5A] = [SAC8A] = 2.0 μM, [QAAC4A] = [TAAC4A] = 4.0 μM. (g−h) Fluorescence quenching of AlPcS4 (λex = 610 nm) by the host−guest complexation of QAAC4A and TAAC4A, and reactivation by QZC extracts displacement. [QAAC4A] = [AlPcS4] = 1.0 μM and [QZC] = 80.0 μg/mL, [TAAC4A] = [AlPcS4] = 1.0 μM and [QZC] = 40.0 μg/mL.
3.2 Method validation of supramolecular fluorescence sensing for QZC
The precision and repeatability of the established supramolecular fluorescence sensor array were further evaluated. As shown in Fig. 3a and Table S3, the repeated tests of the sensing method on the same day showed good stability, and the RSD of each sensing element for six repetitions was less than 3.0%, which indicated the good intraday precision of the method. Next, we used these sensing elements to perform repeated measurements on consecutive three days to investigate the variation of the measurement results. Each dot on Fig. 3b represented the average of six repetitions in one day, and the three dots for each sensing element represented tested values on consecutive three days. Table S4 showed that the RSD values of eight sensing elements were less than 2.5% which proved good interday precision. Subsequently, the repeatability of the supramolecular fluorescence sensing method was tested by preparing six extracted solutions in parallel according to the extraction method. Table S5 showed the detailed data. The RSD of each sensing element did not exceed 3.0%, which proved the good repeatability (Fig. 3c). In the methodological study, good precision of the instrument and good repeatability of the experimental method indicated that the established supramolecular fluorescence sensing method was reasonable and feasible for quality analysis of QZC.![(a) The fluorescence response (I/I0) for evaluating intraday precision (n = 6), (b) interday precision (n = 3, each dot represents the average of six repeats on the same day), and (c) repeatability (n = 6) of the established method (For direct complexation, [QZC] = 20.0 μg/mL, [CAC4A] = 0.8 μM, [SAC4A] = 1.0 μM, [SAC5A] = [SAC8A] = 2.0 μM, [QAAC4A] = [TAAC4A] = 4.0 μM. For competitive complexation, [QAAC4A] = [AlPcS4] = 1.0 μM and [QZC] = 80.0 μg/mL, [TAAC4A] = [AlPcS4] = 1.0 μM and [QZC] = 40.0 μg/mL).](/content/184/2023/16/8/img/10.1016_j.arabjc.2023.104974-fig3.png)
(a) The fluorescence response (I/I0) for evaluating intraday precision (n = 6), (b) interday precision (n = 3, each dot represents the average of six repeats on the same day), and (c) repeatability (n = 6) of the established method (For direct complexation, [QZC] = 20.0 μg/mL, [CAC4A] = 0.8 μM, [SAC4A] = 1.0 μM, [SAC5A] = [SAC8A] = 2.0 μM, [QAAC4A] = [TAAC4A] = 4.0 μM. For competitive complexation, [QAAC4A] = [AlPcS4] = 1.0 μM and [QZC] = 80.0 μg/mL, [TAAC4A] = [AlPcS4] = 1.0 μM and [QZC] = 40.0 μg/mL).
3.3 Visual modes of the quality analysis and semi-quantitative analysis results for QZC
Ten batches of qualified samples provided by the manufacturer were used to establish the fingerprint. For each batch of QZC, two testing solutions were prepared according to the extraction method, and each sensing element was used to measure each testing solution for three times. The average of six test results was plotted on the radar chart and each axis represented one sensing element (Fig. S7). The fluorescence response values of CAC4A, SAC4A, SAC5A, SAC8A, QAAC4A, TAAC4A, QAAC4A/AlPcS4 and TAAC4A/AlPcS4 sensing elements, namely I/I0, were around 0.66, 0.57, 0.66, 0.64, 0.65, 0.68, 0.52 and 0.58, respectively. The fluorescence intensity ratio caused by QZC extracts of ten batches were closely arranged on each axis, showing consistency and good batch-to-batch reproducibility on the radar chart. As shown in Table S6, RSD among ten batches of samples is less than 3.5% for each sensing element. The evaluation results of the supramolecular fluorescence sensing method are consistent with the fact that these ten batches of QZC are all qualified products. This radar chart could be used as a standard fingerprint for qualified samples of QZC. The selected eight supramolecular sensing elements detect and judge the samples from eight dimensions, showing more comprehensive and accurate characteristics. In order to intuitively display the trend of content distribution, we adopted a heat map, which was shown in Fig. 4a. The heat map reflected the signal fluctuation in different batches through the gradient color. The results showed that these products had essentially good batch consistency, but the color fluctuations in the TAAC4A/AlPcS4 and QAAC4A/AlPcS4 groups meant the detected differences in the content of some components among these ten batches of products. This is basically consistent with the quality evaluation results of QZC using ultra-performance liquid chromatography technology reported in the literature (Xue et al., 2022). In several batches of qualified samples provided by the manufacturer, the RSD values of different detected components were ranged from 4.2% to 19.1%. Compared with HPLC method, which takes tens of minutes to analyse sample, supramolecular fluorescence sensing is almost real-time response, and high-throughput screening can be achieved with the help of 96-well plates.![(a) The heat map of I/I0 results (n = 6) for the quality evaluation of ten batches of QZC through the constructed eight sensing elements (For direct complexation, [QZC] = 20.0 μg/mL, [CAC4A] = 0.8 μM, [SAC4A] = 1.0 μM, [SAC5A] = [SAC8A] = 2.0 μM, [QAAC4A] = [TAAC4A] = 4.0 μM. For competitive complexation, [QAAC4A] = [AlPcS4] = 1.0 μM and [QZC] = 80.0 μg/mL, [TAAC4A] = [AlPcS4] = 1.0 μM and [QZC] = 40.0 μg/mL). (b) The scope of the standard QZC products on radar chart and the analysis results for three batches of unqualified products.](/content/184/2023/16/8/img/10.1016_j.arabjc.2023.104974-fig4.png)
(a) The heat map of I/I0 results (n = 6) for the quality evaluation of ten batches of QZC through the constructed eight sensing elements (For direct complexation, [QZC] = 20.0 μg/mL, [CAC4A] = 0.8 μM, [SAC4A] = 1.0 μM, [SAC5A] = [SAC8A] = 2.0 μM, [QAAC4A] = [TAAC4A] = 4.0 μM. For competitive complexation, [QAAC4A] = [AlPcS4] = 1.0 μM and [QZC] = 80.0 μg/mL, [TAAC4A] = [AlPcS4] = 1.0 μM and [QZC] = 40.0 μg/mL). (b) The scope of the standard QZC products on radar chart and the analysis results for three batches of unqualified products.
Based on our analysis of ten batches of qualified samples, each with six replicates of the test performed for each sensing element, we assumed that the data followed a normal distribution. To obtain a 95% confidence interval, we defined the range of qualified products as “μ ± 2σ,” where μ represents the average and σ represents the standard deviation. The threshold of standard products area has been shown in Table S6 and Fig. 4b. For a quick analysis on the production line, if the unknown sample point falls within the range of the standard chart, it is considered a qualified product with good batch-to-batch reproducibility. However, if the unknown sample falls outside the green area of the radar plot (Fig. 4b), it is recommended for further rigorous inspection. That is, the quality of the QZC extract with unknown quality can be preliminarily judged by rapid fluorescence measurement. In order to demonstrate the applicability of the standard fingerprint in differentiating qualified and unqualified products, we used three batches of QZC samples that had expired or even severely agglomerated to simulate unqualified products. The test results of these three batches (Table S7 and Fig. 4b) show that almost all of the I/I0 values are outside the green region, indicating significant deviation from the qualified product. This may be due to the moisture absorption and deterioration of the long-stored products, which leads to inconsistencies in composition and concentration compared to the qualified products. Such products inevitably lead to changes in the supramolecular complexation equilibria and differential fluorescence signals.
Next, we verified the ability of the supramolecular fluorescence sensing method to perform semi-quantitative analysis. We used QAAC4A/AlPcS4 and TAAC4A/AlPcS4 to construct a binary sensor array to distinguish four different concentrations of QZC extracts. Through pattern recognition method such as LDA, a versatile system to identify differences among the tested samples could be obtained. LDA is a statistical method, which minimizes intraclass variance and maximizes interclass variance to differentiate the response patterns from the samples. The experiment was carried out with a black 96-well plate. QZC sample solution obtained according to the extraction method was diluted to give final concentrations from 22.5 to 90.0 μg/mL, and two sensing elements were used to test them for six times (Table S8). As shown in Fig. 5a and b, the intensity fold change was calculated using I/I0 and then further analyzed by LDA. The two most significant LDA factors have been used to generate the two-dimensional differentiation plot with 95% confidence ellipses, which clearly showed that all the four concentrations of QZC were distinct from each other. The jackknifed classification matrix with cross-validation revealed 100% accuracy which proved the reliability of this chemical sensor array. On the LDA plot, the first dominant factor accounted for 99.29% of total variance, and the distribution of factor 1 varied with the concentration of QZC. By converting the result into a scatter plot of factor 1 and concentration, a quantitative identification of samples could be achieved. The linearity indicated that the interactions between the sensing elements and analytes were homogeneous and stable (Fig. 5c). Therefore, valuable arrays can be constructed by combining appropriate supramolecular sensing elements, which can not only quantitatively analyze QZC, but also meet the needs of distinguishing different samples, such as unqualified products with abnormal concentrations of ingredients. Compared to other methods and techniques, our proposed method is well-suited for quality evaluation of commercial TCM products due to its advantages of simplicity and less time consumption (Table 1).![(a) Fluorescence response patterns of QAAC4A/AlPcS4 and TAAC4A/AlPcS4 sensing reporter pairs against various concentrations of QZC extracts ([QAAC4A] = [TAAC4A] = [AlPcS4] = 1.0 μM). (b) Canonical score plot for the two factors of simplified fluorescence response patterns obtained from LDA with 95% confidence ellipses (n = 6). (c) Plot of the first discriminant factor vs. the concentrations of QZC extracts.](/content/184/2023/16/8/img/10.1016_j.arabjc.2023.104974-fig5.png)
(a) Fluorescence response patterns of QAAC4A/AlPcS4 and TAAC4A/AlPcS4 sensing reporter pairs against various concentrations of QZC extracts ([QAAC4A] = [TAAC4A] = [AlPcS4] = 1.0 μM). (b) Canonical score plot for the two factors of simplified fluorescence response patterns obtained from LDA with 95% confidence ellipses (n = 6). (c) Plot of the first discriminant factor vs. the concentrations of QZC extracts.
Analyte
Method
Material
Number of samples
Testing time
Advantages
Conclusion
Ref.
Qufeng Zhitong Capsule
UPLC-PDA a
–
28 batches
35 min per sample
Simple sample preparation, good chromatographic peak shape, and high repeatability
16 compounds extracted from Qufeng Zhitong Capsule were identified and traced to their herbal sources.
Xue et al., 2022
Chuanxiong Rhizoma
HPLC-PDA b and UHPLC-PDA-QTOF-MS/MS c
–
22 batches
60 min per sample
Cost-effective
Ferulic acid, senkyunolide I and senkyunolide H were determined as the major characteristic components of Chuanxiong Rhizoma dispensing granules.
Zhang et al.,2014
Shuang-Huang-Lian injection
ATR-IR d and NIR e
–
140 samples from seven manufacturers
–
Accurate and rapid
The contents of baicalin, phillyrin and chlorogenic acid in Shuang-Huang-Lian injection were predicted.
Ju et al., 2023
Fritillaria
Odor sensor array (electronic nose)
Metal oxide semiconductors
4 species
120 s per sample
Simple operation with less time and labor consumption
The powders of different bulbus of Fritillaria, as well as adulterations can be discriminated.
Yang et al., 2015
Moxa floss
Odor sensor array (electronic nose)
Metal oxide semiconductors
15 samples
200 s per sample
Rapid and nondestructive
Samples of different quality grades had similar odor profiles but different concentrations of volatile compounds.
Lim et al., 2020
Licorice
Colorimetric sensor array
Iron oxide nanozymes
4 licorice active substances
40 min per sample(high throughput)
Easy-to-use, effective and sensitive
Glycyrrhizic acid, liquiritin, licochalcone A and isolicoflavonol were determined and discriminated.
Yuan et al., 2023
Qufeng Zhitong Capsule
Fluorescence sensor array
Calixarenes
10 batches
10 min per sample(high throughput)
Facile, rapid, and less technically demanding
Standard fingerprint of qualified samples was constructed for the analysis of unknown samples.
Present work
3.4 Quality analysis for Shuanghuanglian (SHL) injection
To demonstrate the generalizability of the supramolecular fluorescence sensing method for quality evaluation of TCM, we further created a standard fingerprint for SHL injection. SHL injection, composed of the extract of Lonicerae Japonicae Flos, Forsythiae Fructus, and Scutellariae Radix, has the function of heat-clearing and detoxifying, as well as dispelling wind and relieving exterior symptoms (Wang et al., 2022). Here, other supramolecular macrocycles, cyclodextrins and cucurbit[7]uril were selected as recognition receptors, and four sensing elements, β-CD/2,6-TNS, HP-β-CD/2,6-TNS, CB7/1,8-ANS and CB7/DAPI were constructed (Fig. S8). The complexation of the used dyes with these three macrocycles sensitizes their fluorescence (Liu and You, 2001, Wagner et al., 2003, Miskolczy et al., 2009). Based on the IDA strategy, the addition of SHL injection breaks the original complexation equilibria and the displaced dyes regain their inherent weak fluorescence (Fig. S9). Table S9 was obtained by testing 4 sensing units × 10 batches of samples × 6 replicates and calculating the ratio of fluorescence intensity before and after the addition of SHL injection. The RSD values among the ten batches of samples were less than 4.0%. The fluorescence fingerprint was constructed by outputting the average fluorescence response data (I/I0) on a radar plot (Fig. S10). These samples were all qualified products from the manufacturer, and their fluorescence responses were closely aligned on each axis. They did not show large deviations, except for fluctuations in a certain small range. The results demonstrate that the application of supramolecular fluorescence sensing method can be extended to other TCM.
4 Conclusions
In summary, we have developed a supramolecular fluorescence sensing method for quality evaluation of QZC. The azocalixarenes present in the sensor array can form complexes with the components in QZC extract, and then modulate fluorescence signals in response to their concentrations. This method has been proven to be rapid, simple, and exhibits good precision and repeatability. Ten batches of qualified QZC samples were analyzed, which basically showed batch-to-batch consistency, with slight fluctuations in component content possibly due to different sources of raw materials. The established standard fingerprint was successfully applied to differentiate between qualified and unqualified products. With the supramolecular fluorescence sensing method, it only takes a few minutes to obtain a fluorescence response to QZC extracts without need for separation and purification. Combined with a high-throughput microplate reader, this method is highly suitable for large-scale quality evaluation and real-time monitoring of QZC, providing a new strategy for evaluating the quality of TCM. The approach presented in this study, based on the rich chemical properties of macrocyclic receptors, can be widely applied to the quality evaluation of other TCM products, as demonstrated by the analysis of SHL.
Acknowledgement
This work was supported by NSFC (22101142 and U20A20259), Foundation of State Key Laboratory of Component-based Chinese Medicine (Grant No. CBCM2022106), the Fundamental Research Funds for the Central Universities, Collaborative Innovation Center of Chemical Science and Engineering, Shaanxi Buchang Pharmaceutical Co., Ltd., and Henan Fusen Pharmaceutical Co., Ltd., which are gratefully acknowledged.
Declaration of Competing Interest
The authors declare that they have no known competing financial interests or personal relationships that could have appeared to influence the work reported in this paper.
References
- Fingerprint and multi-component quantification analysis of Xiaoyan tablets by HPLC. Chin. J. Mod. Appl. Pharm.. 2017;34(2):258-261.
- [Google Scholar]
- Establishment and development of a quality evaluation method for Sangbaipi decoction. J. Aoac Int.. 2022;105(2):558-566.
- [Google Scholar]
- Parallel synthesis and screening of supramolecular chemosensors that achieve fluorescent turn-on detection of drugs in saliva. J. Am. Chem. Soc.. 2019;141(42):16763-16771.
- [Google Scholar]
- Fingerprint and multi-components determination of Muxiang Shunqi pills by HPLC. Chin. J. Pharm. Anal.. 2017;37(6):1127-1134.
- [Google Scholar]
- Development of a triple channel colorimetric paper sensor array based on quantum dots: a robust tool for process monitoring and quality control of basic liquors of Baijiu. Sensor. Actuat. B-Chem.. 2020;319:128260
- [Google Scholar]
- A noncovalent fluorescence turn-on strategy for hypoxia imaging. Angew. Chem. Int. Ed.. 2019;58:2377-2381.
- [Google Scholar]
- Array-based “chemical nose” sensing in diagnostics and drug discovery. Angew. Chem. Int. Ed.. 2018;58:5190-5200.
- [Google Scholar]
- Supramolecular design based activatable magnetic resonance imaging. VIEW. 2021;2:20200059.
- [Google Scholar]
- A hypothesis-free sensor array discriminates whiskies for brand, age, and taste. Chem. 2017;2(6):817-824.
- [Google Scholar]
- HPLC fingerprint and chemical pattern recognition analysis of Paishi Granules. Chin. J. Tradit. Chin. Med. Pharm.. 2017;32(6):2768-2772.
- [Google Scholar]
- Identification of Chinese teas by a colorimetric sensor array based on tea polyphenol induced indicator displacement assay. Food Chem.. 2021;335:127566
- [Google Scholar]
- Rapid discrimination of fritillary herbs by a photochemical colorimetric sensor array. Chinese J. Anal. Chem.. 2021;49(3):424-431.
- [Google Scholar]
- Rapid detection and quality evaluation of Shuang-Huang-Lian injection by ATR-IR and NIR spectroscopy combined with chemometrics. Spectrochim. Acta A Mol. Biomol. Spectrosc.. 2023;286:122008
- [Google Scholar]
- Investigation of fingerprint and assay of flavonoid glycosides in Epmedii Folium. Drug Standards China. 2018;19(5):359-375.
- [Google Scholar]
- Drug in drug: a host–guest formulation of azocalixarene with hydroxychloroquine for synergistic anti-inflammation. Adv. Mater.. 2022;34:2203765.
- [Google Scholar]
- Toward a scientific understanding of the effectiveness, material basis and prescription compatibility of a Chinese herbal formula Dan-hong injection. Sci. Rep.. 2017;7:46266.
- [Google Scholar]
- Establishment of UPLC fingerprint and determination of six components of Shengqi Xiaoke Capsules. Chin. J. New Drugs. 2018;27(18):2196-2202.
- [Google Scholar]
- Inkjet-printed colorimetric sensor array for the rapid identification of adulterated Fritillariae cirrhosae bulbus. Sensor. Actuat. B-Chem.. 2022;368:132210
- [Google Scholar]
- Component-target network and mechanism of Qufeng Zhitong capsule in the treatment of neuropathic pain. J. Ethnopharmacol.. 2022;283:114532
- [Google Scholar]
- Quality grade classification of China commercial moxa floss using electronic nose: a supervised learning approach. Medicine. 2020;99(33):e21556.
- [Google Scholar]
- Surveying macrocyclic chemistry: from flexible crown ethers to rigid cyclophanes. Chem. Soc. Rev.. 2017;46:2459-2478.
- [Google Scholar]
- Inclusion complexation of β-cyclodextrin and 6-O-α-maltosyl- and 2-O-(2-hydroxypropyl)- β-cyclodextrins with some fluorescent dyes. J. Phys. Org. Chem.. 2001;14:11-16.
- [Google Scholar]
- Evolution of quality control models for drug products in China. Chin. J. Pharm.. 2008;39(7):551-553.
- [Google Scholar]
- Inclusion complex formation of ionic liquids and other cationic organic compounds with cucurbit[7]uril studied by 4′,6-diamidino-2-phenylindole fluorescent probe. J. Phys. Chem. B. 2009;113:1645-1651.
- [Google Scholar]
- Biomedical Applications of Calixarenes: State of the Art and Perspectives. Angew. Chem. Int. Ed.. 2021;60:2768-2794.
- [Google Scholar]
- Rapid discrimination of commercial American ginseng and Asian ginseng according to diols composition using a colorimetric sensor array. Sensor. Actuat. B-Chem.. 2019;294:48-54.
- [Google Scholar]
- Fluorescent sensor array for quantitative determination of saccharides. ACS Sens.. 2021;6(11):4001-4008.
- [Google Scholar]
- Ratiometric array of conjugated polymers–fluorescent protein provides a robust mammalian cell sensor. J. Am. Chem. Soc.. 2016;138(13):4522-4529.
- [Google Scholar]
- Cucurbit[7]uril macrocyclic sensors for optical fingerprinting: predicting protein structural changes to identifying disease-specific amyloid assemblies. J. Am. Chem. Soc.. 2022;144(31):14363-14379.
- [Google Scholar]
- A facile way to construct sensor array library via supramolecular chemistry for discriminating complex systems. Nat. Commun.. 2022;13:4293.
- [Google Scholar]
- Host properties of cucurbit[7]uril: fluorescence enhancement of anilinonaphthalene sulfonates. J. Phys. Chem. B. 2003;107:10741-10746.
- [Google Scholar]
- An optimized sensor array identifies all natural amino acids. ACS Sens.. 2018;3:1562-1568.
- [Google Scholar]
- Design and construction of novel assemblies for monosaccharides and glycosides detection. Sensor. Actuat. B-Chem.. 2019;285:625-630.
- [Google Scholar]
- Qualitative and quantitative evaluation of chemical constituents from Shuanghuanglian injection using nuclear magnetic resonance spectroscopy. J. Anal. Methods Chem.. 2022;2022:7763207.
- [Google Scholar]
- Causes and control measures of the quality risk in pharmaceutical manufacturing process. J. Chin. Pharm. Sci.. 2011;46(13):969-972.
- [Google Scholar]
- CASTING: a potent supramolecular strategy to cytosolically deliver STING agonist for cancer immunotherapy and SARS-CoV-2 vaccination. CCS Chem 2022
- [CrossRef] [Google Scholar]
- Quality evaluation of traditional Chinese medicine prescription in Naolingsu capsule based on combinative method of fingerprint, quantitative determination, and chemometrics. J. Anal. Methods Chem.. 2022;2022:1429074.
- [Google Scholar]
- Quantitative analysis of multicomponents in Qufeng Zhitong Capsule and application of network pharmacology to explore the anti-inflammatory activity of focused compounds. J. Anal. Methods Chem.. 2022;2022:4229945.
- [Google Scholar]
- An approach to develop two-dimensional fingerprint for the quality control of Qingkailing injection by high-performance liquid chromatography with diode array detection. J. Chromatogr. A. 2005;1090(1–2):90-97.
- [Google Scholar]
- Quality monitoring of Shenmai injection by HPLC pharmacodynamic fingerprinting. BMC Chem.. 2023;17:28.
- [Google Scholar]
- A novel method for rapid discrimination of bulbus of Fritillaria by using electronic nose and electronic tongue technology. Anal. Methods. 2015;7:943-952.
- [Google Scholar]
- Can odors of TCM be captured by electronic nose? The novel quality control method for musk by electronic nose coupled with chemometrics. J. Pharm. Biomed. Anal.. 2011;55(5):1239-1244.
- [Google Scholar]
- Recent advances in supramolecular analytical chemistry using optical sensing. Chem. Rev.. 2015;115:7840-7892.
- [Google Scholar]
- Facile fluorescence monitoring of gut microbial metabolite trimethylamine N-oxide via molecular recognition of guanidinium-modified calixarene. Theranostics. 2019;9(16):4624-4632.
- [Google Scholar]
- Iron oxides based nanozyme sensor arrays for the detection of active substances in licorice. Talanta. 2023;258:124407.
- [Google Scholar]
- Promoting tumor accumulation of anticancer drugs by hierarchical carrying of exogenous and endogenous vehicles. Small Struct. 2022
- [CrossRef] [Google Scholar]
- Application of fingerprint technology in quality evaluation and process control of traditional Chinese medicine formula granules. China J. Chin. Mater. Med.. 2018;43(19):3822-3827.
- [Google Scholar]
- A high performance liquid chromatography fingerprinting and ultra high performance liquid chromatography coupled with quadrupole time-of-flight mass spectrometry chemical profiling approach to rapidly find characteristic chemical markers for quality evaluation of dispensing granules, a case study on Chuanxiong Rhizoma. J. Pharm. Biomed. Anal.. 2014;88:391-400.
- [Google Scholar]
- A general hypoxia-responsive molecular container for tumor-targeted therapy. Adv. Mater.. 2020;32:1908435.
- [Google Scholar]
- A hypoxia-responsive supramolecular formulation for imaging-guided photothermal therapy. Theranostics. 2021;12:396-409.
- [Google Scholar]
- Ultrasensitive and specific fluorescence detection of a cancer biomarker via nanomolar binding to a guanidinium-modified calixarene. Chem. Sci.. 2018;9:2087-2091.
- [Google Scholar]
- Guanidinocalix[5]arene for sensitive fluorescence detection and magnetic removal of perfluorinated pollutants. Nat. Commun.. 2019;10:5762.
- [Google Scholar]
- Engineering sensor arrays using aggregation-induced emission luminogens for pathogen identification. Adv. Funct. Mater.. 2019;29(4):1805986.
- [Google Scholar]
- Nanozyme sensor arrays based on heteroatom-doped graphene for detecting pesticides. Anal. Chem.. 2020;92(11):7444-7452.
- [Google Scholar]
Appendix A
Supplementary material
Supplementary data to this article can be found online at https://doi.org/10.1016/j.arabjc.2023.104974.
Appendix A
Supplementary material
The following are the Supplementary data to this article:Supplementary data 1
Supplementary data 1


