

Translate this page into:
Surface reaction strategy for Raman probing trace cadmium ion
⁎Corresponding authors at: The Education Ministry Key Lab of Resource Chemistry, Shanghai Key Laboratory of Rare Earth Functional Materials, Shanghai Municipal Education Committee Key Laboratory of Molecular Imaging Probes and Sensors and Department of Chemistry, Shanghai Normal University, Shanghai 200234, China (Q. Ke). hfyang@shnu.edu.cn (Haifeng Yang), kqf@sit.edu.cn (Qinfei Ke)
-
Received: ,
Accepted: ,
This article was originally published by Elsevier and was migrated to Scientific Scholar after the change of Publisher.
Peer review under responsibility of King Saud University.
Abstract
Prevalent contamination of water by cadmium ion (Cd2+) brings environmental risk, which threatening to human health including renal dysfunction, reduced lung capacity, and some cancers. It calls for rapid, sensitive and selective protocol to analyze Cd2+ on field. In this work, specific Raman probe is rationally designed by gold nanoparticles (AuNPs) functionalized with tripeptide glutathione (GSH) and Rhodamine 6G (R6G) (denoted as R6G/GSH/AuNPs), which is explored for indirectly determining trace Cd2+ in river water. Based on chelating interaction between GSH and Cd2+ to form tetrahedral Cd(SG)4, which trends easy detachment from R6G/GSH/AuNPs. With increasing Cd2+ concentration, the Raman probe without protection of GSH happens due aggregation and Raman signal of R6G increases correspondingly. The R6G/GSH/AuNPs-based Raman detection of Cd2+ in river water shows rapidness, excellent sensitivity, selectivity and good repeatability. Limit of detection of 10 ppb with a widely linear range of 0.5–20 ppm could be achieved. It could be perspective that such Raman probe could be extended to be used for on-site monitoring trace Cd2+ in river water system.
Keywords
Glutathione
Gold nanoparticle
Cadmium ion
Raman probe

1 Introduction
Heavy metal pollution, as a worldwide environmental issue, has aroused global attention for it’s potentially threat to human health. Cadmium-based materials widely used in industry and agriculture (Mendes et al., 2006), are hardly degradable, resulting in prevalent contamination of water around the world (Chen et al., 2014). Chronic exposure of Cd2+, even at trace amount, has caused many serious health problems, including renal dysfunction, reduced lung capacity, and some cancers (Daher, 1995; Goyer et al., 2004; Satarug et al., 2003). Cd2+ has been classified by Environmental Protection Agency (EPA) as seventh ranking on the Top 20 Hazardous Substances Priority List (Liu et al., 2010).
Numerous methods have been developed to monitor Cd2+, such as atomic absorption spectroscopy (Martínez et al., 2018), inductively coupled plasma mass spectrometry (Yu et al., 2018), inductively coupled plasma atomic emission spectroscopy (Boevski et al., 2000), fluorescence (Chen et al., 2019), and electrochemical methods (Priya et al., 2018). However, these techniques have inherent limitations in that they rely on expensive instruments, and professional technical personnel as well as time-consuming and high-cost of solvents. Therefore, it is of highly desirable to develop the facile, rapid and cost-effective method for detection of Cd2+.
Surface-enhanced Raman scattering (SERS) spectroscopy is fingerprint information technique regarding physical properties of gold or silver nanoparticles. The particle size, shape and especially the degree of aggregation of substrates directly affect the SERS signal level and appropriate aggregation could produce lots of “hot spots” to bring great enhancement of Raman scattering. In literature, SERS method has been explored to sensitively and selectively analyze arsenate (Han et al., 2011), chromium (VI) (Ji et al., 2015), mercury ions (Liu et al., 2018), ferrous ions (Guo et al., 2016) and Cd2+ (Chen et al., 2014; Thatai et al., 2015; Cheng et al., 2014; Yin et al., 2011; Dasary et al., 2016) in aqueous solution. Core–shell nanocomposite of silica-gold (SiO2@Au) was used for Raman detection of Cd2+ with the limit of detection of 0.1 ppm (Thatai et al., 2015). Chen et al. (Chen et al., 2014) proposed by a generalized ratiometric indicator with aid of chemometric treatment, the SERS detectable lowest concentration for Cd2+ at 0.32 ppb could be reached. Fan and colleagues (Cheng et al., 2014) reported semi-quantitative SERS analysis of Cd2+ by using 4-(4-phenyl methanethiol) -2,2′: 6′,2″-terpyridine as chelating reagent. Duan’s group (Yin et al., 2011) presented specific preparation of reporter dye and Cd2+-chelating polymer as a platform for SERS sensing Cd2+. Singh et al. (Dasary et al., 2016) adopted 3-mercaptopropionic acid and 2, 6-pyridinedicarboxylic acid as Cd2+ trapping agents for realizing the SERS limit of detection down to 10 ppt. Taking advantage of the complicated fabrication, the Raman analytical sensitivity and selectivity have been improved but quantitative analysis still needs to be further worked on.
To address this issue, herein, we firstly constructed a sensitive and specific Cd2+ Raman probe by modifying gold nanoparticles (AuNPs) with naturally occurring tripeptide glutathione (GSH) as ion capturer and Rhodamine 6G (R6G) as a Raman reporter, designated as R6G/GSH/AuNPs. AuNPs are prone to aggregate in high-salt condition due to suppressing the electrostatic repulsion (Wei et al., 2007; Lee et al., 2008; Albanese and Chan, 2011), and modification of GSH can prevent AuNPs from salt-induced aggregation(Pei et al., 2011; Guo et al., 2014). R6G/GSH/AuNPs in dispersive state show the relatively weak Raman scattering of R6G. Normally, GSH is used an efficient detoxification agent of Cd2+ since the SH group can strongly interact with Cd2+ (Jalilehvand, 2010). And also, adding Cd2+ with GSH could form a tetrahedral Cd(SG)4 complex with more negative charge, which has weak electrostatic interaction with AuNPs. Therefore, the detection strategy is that the negatively charged Cd(SG)4 trends to detach from the Raman probe, resulting the controllable aggregation of Raman probes in high salt condition and Raman signal-on, while in the case of other metallic ions, the facile formation of linear GS-M-SG is preferred (Pei et al., 2011), which keeps the protection of AuNPs from aggregation. Consequently, Raman probe of R6G/GSH/AuNPs for determination of trace Cd2+ in water environment exhibited high selectivity and sensitivity.
2 Experimental
2.1 Chemicals and materials
Hydrogen tetrachloroaurate hydrate (HAuCl4·4H2O), reduced glutathione, trisodium citrate, and Rhodamine 6G were obtained from Sigma–Aldrich (USA). The metal salts including Na2HPO4·12H2O and KH2PO4 that were used to prepare different pH phosphate buffer (PB), NaCl, MgSO4, CuSO4·5H2O, BaCl2·2H2O, CaCl2·2H2O, Pb(NO3)2, CoCl2·6H2O, Zn(NO3)2·6H2O, Hg(NO3)2·H2O, FeCl3·6H2O, MnCl2, AlCl3, AgNO3, CrCl3·6H2O and CdSO4 were purchased from Sinopharm Chemical Reagent Co., Ltd. (Shanghai, China). All chemicals were of analytical grade or the highest purity commercially available and used as received. Ultrapure water (18.2 MΩ cm) was obtained by using a ShuiTian ultrapure water system (STU4100D, Shanghai, China). The glassware was embathed in aqua regia and then thoroughly washed with ultrapure water.
2.2 Preparation of R6G/GSH/AuNPs
Gold nanoparticles with average diameter about 40 nm were synthesized by previously reported method (Frens, 1973). In detail, 1 mL HAuCl4·4H2O (w/w, 1%) was added to 100 mL ultrapure water in the 250 mL flask. After the solution was heated to boiling, 1 mL of 1% tri–sodium citrate solution was added quickly under vigorously stirring. The reaction of the mixture solution lasted 30 min under keeping temperature at 100 °C to obtain the colloid AuNPs.
250 μL AuNPs solution was taken out and then 50 μL GSH (4 μM) was added into the colloid solution. After the mixture solution was incubated for 1 min at 25 °C, 50 μL R6G (10−6 M) was added to synthesize the final probe of R6G/GSH/AuNPs.
2.3 Detection of Cd2+ with SERS
100 ppm Cd2+ stock solution was prepared by using ultrapure water and various concentrations of Cd2+ from 0.01 to 20 ppm were prepared from the stock solution of Cd2+. The Cd2+-concentration-dependent SERS experiments were performed at ambient temperature. Briefly, 50 μL of the PB solution (pH = 6.0, 0.1 M) was added into the R6G/GSH/AuNPs solution. Then 50 μL Cd2+ standard solutions with different concentrations were added into the above mixture solution and incubated for 1 min, respectively. Finally, 50 μL 0.8 M NaCl solution was added into the system. After sufficiently shaking and incubating for about 1 min, approximately 3 μL sample solution was taken into a capillary tube and then Raman signals were collected by focusing laser spot from Raman system onto the tube. The whole detection process could be finished in 5 min. SERS measurement of Cd 2+in river water was conducted with the same process.
2.4 Instrumentation
Ultraviolet–visible (UV–vis) spectra were recorded on a UV1800 (Shimadzu, Japan) spectrophotometer at room temperature. The dynamic light scattering (DLS) measurements were carried on a Nano-ZS90 (Malvern, United Kingdom). The morphology of the R6G/GSH/AuNPs without and with Cd2+ were taken on a JEM-2100EXII transmission electron microscope (TEM) (JEOL Co., Ltd. Japan), operating at 200 kV. Fourier transform infrared (FTIR) experiment was carried out on an IS5 (Nicolet, US) infrared spectrometer. SERS spectra were acquired using a Jobin Yvon confocal laser Raman system (Super LabRam II), which was equipped with a He–Ne laser at 632.8 nm with a power of ca. 5 mW. Each spectrum was obtained using three accumulations and the acquisition time was set at 10 s. Concentration of Cd2+ in river water (Caohejing River near the campus) was also determined with inductively coupled plasma atomic emission spectroscopy (ICP–AES) (Varian, Vista MPX, USA) for comparison.
3 Results and discussion
3.1 Sensing mechanism
According to the literature (Wang et al., 2006; Wei et al., 2007; Lee et al., 2008; Albanese and Chan, 2011), colloid of unmodified AuNPs appears red color due to the specific and size-dependent surface plasmon resonance (SPR) absorption of the AuNPs, and the as prepared Au nanoparticles by citrate as reductant is dispersive in solution due to electrostatic repulsion between negatively charged on the surface of AuNPs capped by citrate. The electrostatic repulsion between negatively charged AuNPs is screened in the presence of salt, and resulting in aggregation of AuNPs that lead to red-to-blue color change due to the shift of SPR absorption to a longer wavelength. Scheme 1 is a cartoon for constructing R6G/GSH/AuNPs and its Raman application for testing Cd2+. GSH is modified on AuNPs via Au-S and R6G acts as the Raman reporter. AuNPs protected by GSH could stop the salt-induced aggregation and keep the steadily disperse of R6G/GSH/AuNPs in solution. R6G/GSH/AuNPs contributes the weak Raman signals. In presence of Cd2+, Cd(SG)4 complex produced and competitive displacement reaction of GSH with Cd2+ and AuNPs, leads to GSH detachment and then a certain aggregation of AuNPs under high-salt condition happens. The due aggregation of AuNPs without sufficient protection of GSH would dramatically elevate the Raman signal level of R6G and Cd2+ ions could be indirectly detectable.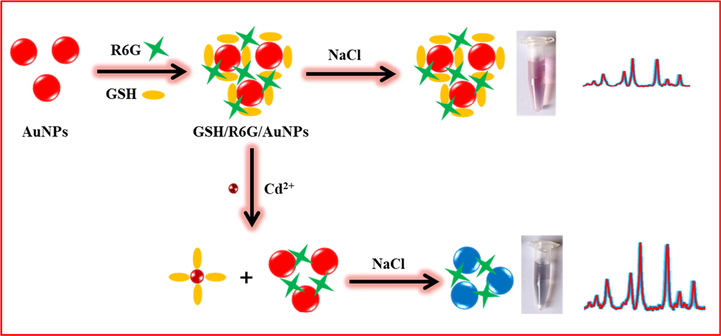
The cartoon of construction of R6G/GSH/AuNPs and detection of Cd2+ by using the Raman probe.
For further indicating the protection of GSH, the UV–vis spectra of AuNPs and GSH/AuNPs was carried out. As shown in Fig. S1 (supporting information), the SPR band of AuNPs decreases obviously, hinting the AuNPs are aggregated after storage for 3 weeks while the SPR band of GSH/AuNPs seemly shows no change in 3 weeks.
Herein, in Fig. 1, as-synthesized AuNPs by citrate are dispersive and the size is about 40 nm, which might be the most effectual SERS activity (Bell and McCourt, 2009). In the another hand, based on easily aggregating of AuNPs with citrate ions in high-salt condition, some SERS methods have been reported for detection of small organic molecules, proteins, and DNA(Wei et al., 2008; Chang et al., 2016; Jazayeri et al., 2018; Baetsen-Young et al., 2018; Ganareal et al., 2018; Torres-Chavolla and Alocilja, 2011). However, the poor stability and reproducibility of such citrate-AuNPs-based substrate suffered from not robustness of detection. As above stated, GSH containing sulfhydryl, free carboxyl, and amino groups, can protect the AuNPs from serious agglomeration by salt-inducing (Chai et al., 2010). As clearly seen in TEM images of Fig. 1c, the dispersive R6G/GSH/AuNPs show the reasonably stability in solution. As a result, on the R6G/GSH/AuNPs, the Raman scattering is weak (Fig. 2d). When pH at 6.0, Cd2+ as a thiophilic metal ion, strongly interacts with GSH to form Cd(SG)4 complex, which has larger binding energy (208.5 ± 20.9 kJ/mol) than that of Au-S (120 kJ/mol) (Skulason and Frisbie, 2000). The tetrahedrally shaped and negatively charged Cd(SG)4 complexes have weak electrostatic interaction with AuNPs. As a result, adding Cd2+ would leave off GSH from R6G/GSH/AuNPs via competitive displacement reaction. Certain aggregation AuNPs without sufficient stabilization of GSH in the high-salt condition produces more “hot spots”, elevating the Raman intensity of R6G (Fig. 2e). Fig. 1d and 1f visually demonstrate the average gap between AuNPs less than 2 nm after addition of Cd2+ to remove GSH. In Fig. 1g and h, the electromagnetic field distributions of R6G/GSH/AuNPs without and with Cd2+ are given by Finite-Difference Time-Domain (FDTD) calculation. The FDTD simulation results also demonstrate that the presence of Cd2+ enhances electromagnetic field of such system. Consequrently, SERS detection of Cd2+ ions by using R6G/GSH/AuNPs could be achieved.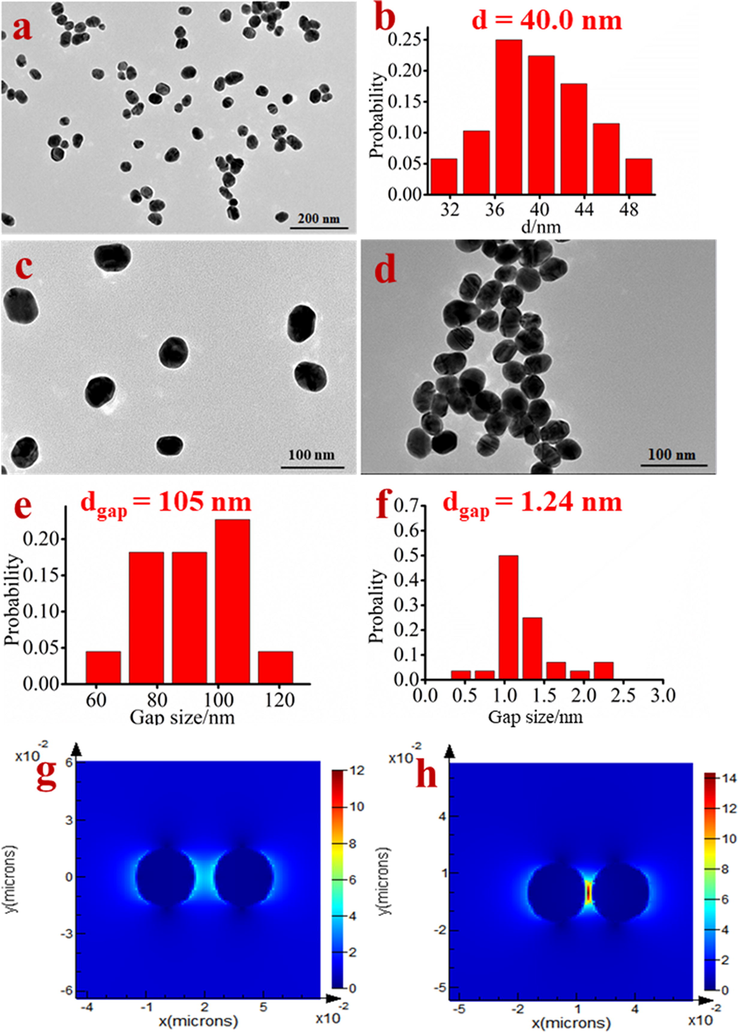
TEM image (a) and the size distribution (b) of AuNPs; TEM images of Cd2+ probe R6G/GSH/AuNPs at absence (c) and presence of Cd2+ (d); the distance distribution between nanoparticles of R6G/GSH/AuNPs in the absence (e) and presence of Cd2+ (f); (g) and (h) is the electromagnetic field distribution of R6G/GSH/AuNPs in the absence and presence of Cd2+ respectively by FDTD calculation.
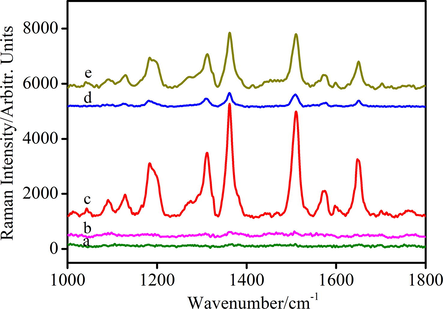
SERS spectra of R6G/AuNPs (a), R6G/AuNPs in PB solution (b) NaCl with R6G/AuNPs in PB solution (c), NaCl with R6G/GSH/AuNPs in PB solution (d), In the presence of Cd2+ (10 ppm) and NaCl with R6G/GSH/AuNPs in PB solution (e).
In Fig. 2a, the Raman spectrum of 10−6 M R6G recorded on AuNPs made by using citrate reduction, has no visible signal. As shown in Fig. 2b, in the phosphate buffer (PB) solution, there is also no Raman signal of R6G, suggesting that the PB solution has no interference with the whole detection system. Fig. 2c depicts the NaCl greatly affects the Raman scattering of R6G/AuNPs. AuNPs without GSH protection, easily aggregate under high salt condition, which enhancing the Raman activity. Whilst, GSH protected AuNPs have the week Raman signal even in the presence of high salt (Fig. 2d). The low background of R6G/GSH/AuNPs is beneficial to detection of trace Cd2+ ions. Consistently as the design strategy, Fig. 2e demonstrates that the Raman signal of R6G/GSH/AuNPs increases with adding Cd2+ ions.
As illustrated in Fig. 3, UV–vis spectra shows that AuNPs, synthesized by citrate reduction, presents a band at 530 nm and the final concentration of this AuNPs is 0.1 nM according to Beer’s law using an extinction coefficient of 6.06 × 10⁹ M−1 cm−1(Liu et al., 2007). Correspondingly, similar Raman results manifest that R6G and PB have no effect on the dispersive state of AuNPs. When adding NaCl, the band of AuNPs at 530 nm decreases and a new peak at longer wavelength (900 nm) appears. With the addition of GSH, the SPR band of AuNPs cantered at 900 nm gradually disappears and the band at 530 nm increases. By adding Cd2+, a new SPR band of AuNPs occurs at 770 nm while the intensity at 530 nm suppresses, hinting formation of Cd(SG)4 at pH 6.0 and then Cd(SG)4 detaches from AuNPs surface, which happens aggregation under high-salt condition. Dynamic light scattering (DLS) measurements were also performed to check the size distribution change of R6G/GSH/AuNPs before and after adding Cd2+ (see Fig. S2 in the Supporting Information). DLS results show that the average diameter of R6G/GSH/AuNPs in presence of Cd2+ is much larger than that without Cd2+. In all, both of UV–vis and DLS data validate the formation of Cd(SG)4 and then detachment from the Raman probe system.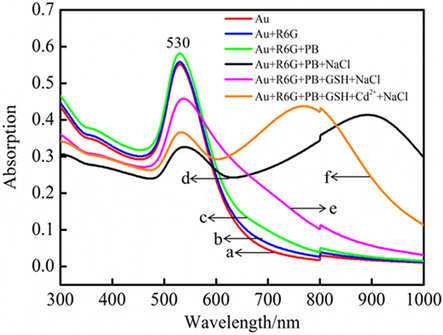
UV–vis absorption spectra of AuNPs (a), R6G/AuNPs (b), R6G/AuNPs in PB solution (c), NaCl with R6G/AuNPs in PB solution (d), NaCl with R6G/GSH/AuNPs in PB solution (e), in the presence of Cd2+ and NaCl with R6G/GSH/AuNPs in PB solution (f).
In FT-IR spectrum of GSH (see Fig. S3a in the Supporting Information), the IR bands at 1400 and 1590 cm−1 correspond to the symmetric and asymmetric stretching of C=O (COOH), respectively. A band at 1535 cm−1 belongs to N–H bending. The broad bands of N–H and OH− stretching are observed in the range of 3000–3500 cm−1. A band at 2625 cm−1 virtually confirms the presence of S–H group in the GSH molecule (Zamarion et al., 2008). In Fig. S3b (Supporting Information), no observation of IR band at 2625 cm−1 from SH group and visualization of two bands at 1590 and 1400 cm−1 remark that the GSH modified on AuNPs surface by Au–S bond.
3.2 Optimization of the Cd2+ Raman probe
For optimizing performance of as-constructed Raman probe, the salt effect on the aggregation of R6G/AuNPs was observed. As shown in Fig. S4A (Supporting Information), the Raman intensity of R6G at 1510 cm−1 is enhanced gradually with the increase of NaCl concentration as presented in Fig. S4B (Supporting Information). Clearly, when the AuNPs with concentration of 0.1 nM and usage of NaCl is 80 mM, the highest Raman intensity of R6G could be reached. Therefore, 80 mM NaCl was selected to detect the Cd2+ ions.
We also investigated the effect of GSH usage on the Raman probe. From Fig. S5A (Supporting Information), it could be seen that the Raman intensity decreases gradually with increasing concentration of GSH and reaches plateau as the concentration of GSH at 0.4 μM. The corresponding statistic results on the basis of Raman intensity at 1510 cm−1 are given in Fig. S5B (Supporting Information), suggesting that 0.4 μM GSH is an adequate amount to stabilize AuNPs.
3.3 Performance of the Raman probe
The good reproducibility is very important for SERS application of quantitative analysis. The 30 SERS spectra of R6G/GSH/AuNPs with 15 ppm Cd2+ ions are collected as shown in Fig. 4A. Fig. 4B is the Raman intensity statistic based on the Raman peak at 1510 cm−1 and RSD is 6.3%, indicating the Cd2+ Raman probe has good robustness. It is helpful to the quantitative analysis of Cd2+ in real sample.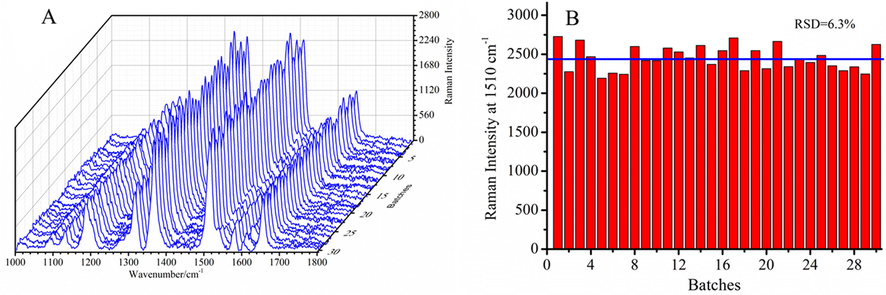
(A) SERS spectra of R6G/GSH/AuNPs with 15 ppm Cd2+ ions collected from 30 batches test, (B) Raman intensity of R6G/GSH/AuNPs after addition of 15 ppm Cd2+ ions at 1510 cm−1 versus different test batch (RSD = 6.3%).
In Fig. 5A, the Cd2+-dependent SERS intensity could be clearly visualized by using R6G/GSH/AuNPs probe. Obviously, the Raman intensity of R6G increases with the enhancement of the concentration of Cd2+. The limit of detection (LOD) (S/N = 3) for probing Cd2+ is 10 ppb. An instructive band at 1510 cm−1 with much sensitive response to amount change of Cd2+ is used for the quantitative analysis. As shown in the inset of Fig. 5B, a good linear relationship is expounded for Cd2+ concentrations ranging from 0.5 to 20 ppm (R2 = 0.9929). As stated in Table S1 (supporting information), this R6G/GSH/AuNPs-based Raman probe exhibited good performance for detection Cd2+, compared to other detection strategies in literature.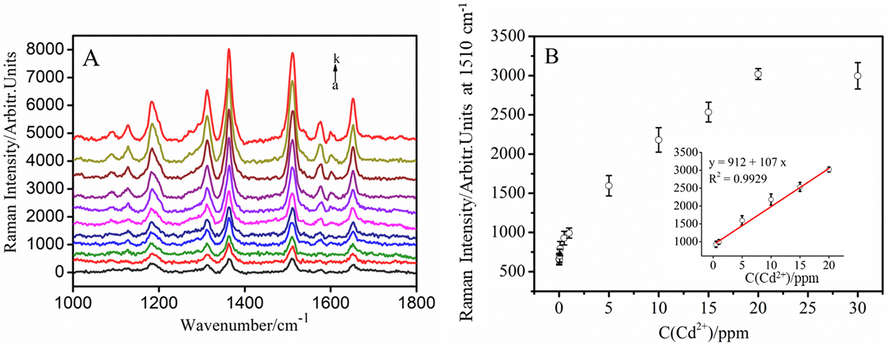
(A) SERS spectra of R6G/GSH/AuNPs with different concentrations of Cd2+ ions (from a to k: 0, 0.01, 0.05, 0.1, 0.5, 1, 5, 10, 15, 20, and 30 ppm). (B) Plot of corresponding intensity of the Raman band at 1510 cm−1 as a function of Cd2+ concentration. Inset: a linear relationship in the concentration range from 0.5 to 20 ppm (R2 = 0.9929).
For further illustrating the aggregation of the AuNPs with increasing of the concentration of Cd2+, the extinction spectra of R6G/GSH/AuNPs-based Raman probe in the presence of different concentration of Cd2+ are investigated. As shown in Fig. S6, with the increase of the concentration of Cd2+, the UV–vis band shows red-shift and broadens gradually, and a peak emerges slowly at longer wavelength, which increases gradually with the increase of the concentration of Cd2+. The color change from red to blue with increasing Cd2+ concentration can be observed (inset in Fig. S6). The lowest detection concentration with the naked eye is 100 ppb, which is much higher than that of the R6G/GSH/AuNPs-based Raman probe.
The measurement selectivity of such Cd2+ by using Raman probe was also evaluated. From the Raman spectra in Fig. 6A and corresponding histogram in Fig. 6B, we find that the Raman intensity is change slightly in the presence of Ag+, Cu2+, Ba2+, Hg2+, Fe3+, Co2+, Cr3+, Mn2+, Mg2+, Zn2+, Al3+, Pb2+, and Ca2+, but change obviously after addition of Cd2+, indicating that other interfering metal ions have no effects on R6G/GSH/AuNPs-based Raman detection of Cd2+. The possible reason is that only Cd2+ could interact with GSH forming tetrahedral Cd(SG)4 complex and other metal ions form linear complex GS-M-SG (Pei et al., 2011; Guo et al., 2014) under pH 6.0. The negatively charged Cd(SG)4 has weaker interaction with AuNPs than that of linear GS-M-SG. In other words, linear GS-M-SG is strongly bound to AuNPs to keep the protection layer, preventing AuNPs from the salt-inducing aggregation.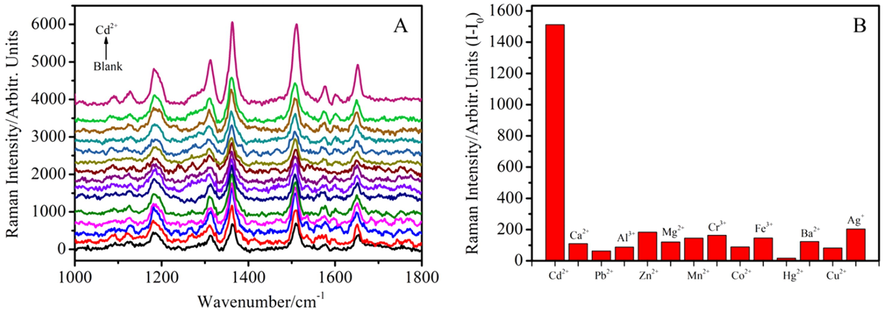
(A) SERS spectra of R6G/GSH/AuNPs with Cd2+ and different metal ions at 10 ppm (from bottom to top: blank, Ag+, Cu2+, Ba2+, Hg2+, Fe3+, Co2+, Cr3+, Mn2+, Mg2+, Zn2+, Al3+, Pb2+, Ca2+ and Cd2+), (B) The plot of Raman intensity difference between after (I) and before (I0) addition of metal ions at 1510 cm−1 versus different metal ions.
In different pH values (4.5, 5.0, 7.0, and 8.0), R6G/GSH/AuNPs-based Raman detection of Cd2+ were investigated (see Fig. S7 in the Supporting Information). At pH 4.5, the serious agglomeration of AuNPs would be failed to detect Cd2+. At pH 8.0, As3+ would interfere with the detection of Cd2+. Under pH 6.0, clearly, due to addition of Cd2+ for removal of GSH, the controllable aggregation of AuNPs contributes the largest level of Raman signal. In this work, pH 6.0 was picked out as optimal pH value to detect Cd2+ for pursuing high sensitivity and selectivity.
R6G/GSH/AuNPs-based Raman assay was employed for probing Cd2+ in the river water. Firstly, river water was filtered by using double-layer filter paper and then 0.45 μm membrane was conducted to remove the possible solid stuffs. Afterwards, the concentrated HNO3 was used to remove organic compositions in short time of 10 min. The several samples of Cd2+ spiked river water were simultaneously measured by using such Raman probe and ICP–AES. The Raman spectra of different concentration Cd2+ in river water are shown in Fig. S8 (Supporting Information). The Raman detection recovery for Cd2+ is from 85.0% to 107.1%, which is comparable with ICP–AES results tabulated in Table 1, demonstrating acceptable robustness in practical analysis application. NFa means No Found.
Samples
CCd2+/ppm
Recovery (%) (n = 3)
Found
Spiked
Raman ± SD
ICP-AES
1#
NFa
1
85.0 ± 2.5
115.5
2#
5
107.1 ± 9.8
88.2
3#
10
91.3 ± 6.2
97.5
With the development of portable Raman system, such Cd2+ Raman probe could be applied for in-field detection. As an application case, in Fig. S9, the R6G/GSH/AuNPs-based Raman probe response to 0.1 ppm Cd2+ could be detectable by using small Raman systems in our lab (Zolix, 785 nm laser with power at 20 mW, 2 s acquisition time). Obviously, after addition of Cd2+, the Raman signals of R6G are enhanced, indicating it is feasible to realize on-field analysis of contaminated water .
4 Conclusion
In this work, R6G/GSH/AuNP was rationally constructed as Cd2+ Raman probe. The Raman probe for Cd2+ exhibited the high sensitivity (LOD = 10 ppb) and the wide linear range (0.5–20 ppm). Due to formation of Cd(SG)4 complex, R6G/GSH/AuNP had a high selectivity of Raman detection. The R6G/GSH/AuNP-based Raman protocol with good reproducibility could be utilized to detect Cd2+ ions in river water showing good recovery. As a perspective, the simple, rapid, cost-effective, sensitive and selective Raman probe with aid of portable Raman system could be used to monitor Cd2+ contamination in water supplement system.
Acknowledgements
This work is supported by the National Natural Science Foundation of China (grant no. 21475088), International Joint Laboratory on Resource Chemistry (IJLRC), Shanghai Key Laboratory of Rare Earth Functional Materials, and Shanghai Municipal Education Committee Key Laboratory of Molecular Imaging Probes and Sensors.
Declaration of Competing Interest
The authors declare that they have no known competing financial interests or personal relationships that could have appeared to influence the work reported in this paper.
References
- Effect of gold nanoparticle aggregation on cell uptake and toxicity. ACS Nano. 2011;5:5478-5489.
- [Google Scholar]
- Direct colorimetric detection of unamplified pathogen DNA by dextrincapped gold nanoparticles. Biosens. Bioelectron.. 2018;101:29-36.
- [Google Scholar]
- SERS enhancement by aggregated Au colloids: effect of particle size. Phys. Chem. Chem. Phys.. 2009;11:7455-7462.
- [Google Scholar]
- Determination of barium, chromium, cadmium, manganese, lead and zinc in atmospheric particulate matter by inductively coupled plasma atomic emission spectrometry (ICP-AES) Spectrochim. Acta, Part B. 2000;55:1643-1657.
- [Google Scholar]
- Colorimetric detection of Pb2+ using glutathione functionalized gold nanoparticles. ACS Appl. Mater. Inter.. 2010;2:1466-1470.
- [Google Scholar]
- Aptamer-based colorimetric detection of proteins using a branched DNA cascade amplification strategy and unmodified gold nanoparticles. Biosens. Bioelectron.. 2016;78:200-205.
- [Google Scholar]
- Surface enhanced Raman scattering fiber optic sensor as an ion selective optrode: the example of Cd2+ detection. RSC Adv.. 2014;4:64683-64687.
- [Google Scholar]
- Ratiometric fluorescence detection of Cd2+ and Pb2+ by inner flter-based upconversion nanoparticle-dithizone nanosystem. Microchem. J.. 2019;144:296-302.
- [Google Scholar]
- Generalized Ratiometric Indicator based surface-enhanced Raman spectroscopy for the detection of Cd2+ in environmental water samples. Anal. Chem.. 2014;86:12236-12242.
- [Google Scholar]
- Alizarin dye based ultrasensitive plasmonic SERS probe for trace level cadmium detection in drinking water. Sens. Actuators B: Chem.. 2016;224:65-72.
- [Google Scholar]
- Controlled nucleation for the regulation of the particle size in monodisperse gold suspensions. Nat. Phys. Sci.. 1973;241:20-22.
- [Google Scholar]
- Gold nanoparticle-based probes for the colorimetric detection of mycobacterium avium subspecies paratuberculosis DNA. Biochem. Biophys. Res. Commun.. 2018;496:988-997.
- [Google Scholar]
- A novel and stable Raman probe for sensing Fe (III) Sens. Actuators B: Chem.. 2016;224:16-21.
- [Google Scholar]
- Label-Free Colorimetric Detection of cadmium ions in rice samples using gold nanoparticles. Anal. Chem.. 2014;86:8530-8534.
- [Google Scholar]
- Surface-enhanced Raman scattering for arsenate detection on multilayer silver nanofilms. Anal. Chim. Acta. 2011;692:96-102.
- [Google Scholar]
- Cadmium (II) complex formation with glutathione. J. Biol. Inorg. Chem.. 2010;15:441-458.
- [Google Scholar]
- Colorimetric detection based on gold nanoparticles (GNPs): an easy, fast, inexpensive, low-cost and short time method in detection of analytes (protein, DNA, and ion) Sens. Bio-Sens. Res.. 2018;20:1-8.
- [Google Scholar]
- Semiconductor-driven “turn-off” surface enhanced Raman scattering spectroscopy: application in selective determination of chromium (VI) in water. Chem. Sci.. 2015;6:342-348.
- [Google Scholar]
- Highly Sensitive and Selective Colorimetric Sensors for Uranyl (UO22+): development and comparison of labeled and label-free DNAzyme-gold nanoparticle systems. J. Am. Chem. Soc.. 2008;130:14217-14226.
- [Google Scholar]
- Extinction coefficient of gold nanoparticles with different sizes and different capping ligands. Colloids Surf. B, Biointerfaces. 2007;58:3-7.
- [Google Scholar]
- Facile Ag-film based surface enhanced Raman spectroscopy using DNA molecular switch for ultra-sensitive mercury ions detection. Nanomaterial. 2018;8:596-607.
- [Google Scholar]
- A highly sensitive ratiometric fluorescent probe for Cd2+ detection in aqueous solution and living cells. Chem. Commun.. 2010;46:6138-6140.
- [Google Scholar]
- Determination of cadmium and lead in wine samples by means of dispersive liquid–liquid microextraction coupled to electrothermal atomic absorption spectrometry. J. Food Compos. Anal.. 2018;67:178-183.
- [Google Scholar]
- Bioavailability of cadmium and lead in a soil amended with phosphorus fertilizers. Sci. Agricola.. 2006;63:328-332.
- [Google Scholar]
- Probing the coordination behavior of Hg2+, CH3Hg+, and Cd2+ towards mixtures of two biological thiols by HPLC-ICP-AES. J. Inorg. Biochem.. 2011;105:375-381.
- [Google Scholar]
- A novel voltammetric sensor for the simultaneous detection of Cd2+ and Pb2+ using graphene oxide/κ-carrageenan/L-cysteine nanocomposite. Carbohydr. Polym.. 2018;182:199-206.
- [Google Scholar]
- A global perspective on cadmium pollution and toxicity in non-occupationally exposed population. Toxicol. Lett.. 2003;137:65-83.
- [Google Scholar]
- Detection of discrete interactions upon rupture of Au microcontacts to self-assembled monolayers terminated with -S(CO)CH3 or –SH. J. Am. Chem. Soc.. 2000;122:9750-9760.
- [Google Scholar]
- Plasmonic detection of Cd2þ ions using surface-enhanced Raman scattering active core–shell nanocomposite. Talanta. 2015;134:568-575.
- [Google Scholar]
- Nanoparticle based DNA biosensor for tuberculosis detection using thermophilic helicase-dependent isothermal amplification. Biosens. Bioelectron.. 2011;26:4614-4618.
- [Google Scholar]
- Unmodified gold nanoparticles as a colorimetric probe for potassium DNA aptamers. Chem. Commun.. 2006;36:3780-3782.
- [Google Scholar]
- Simple and sensitive aptamer-based colorimetric sensing of protein using unmodified gold nanoparticle probes. Chem. Commun. 2007:3735-3737.
- [Google Scholar]
- DNAzyme-based colorimetric sensing of lead (Pb2+) using unmodified gold nanoparticle probes. Nanotechnology. 2008;19:095501.
- [Google Scholar]
- Chip-based magnetic solid phase microextraction coupled with ICP-MS for the determination of Cd and Se in HepG2 cells incubated with CdSe quantum dots. Talanta. 2018;179:279-284.
- [Google Scholar]
- SERS-active nanoparticles for sensitive and selective detection of cadmium Ion (Cd2+) Chem. Mater.. 2011;23:4756-4764.
- [Google Scholar]
- Ultrasensitive SERS nanoprobes for hazardous metal ions based on trimercaptotriazine-modified gold nanoparticles. Inorg. Chem.. 2008;47:2934-2936.
- [Google Scholar]
Appendix A
Supplementary data
Supplementary data to this article can be found online at https://doi.org/10.1016/j.arabjc.2020.06.010.
Appendix A
Supplementary data
The following are the Supplementary data to this article:Supplementary data 1
Supplementary data 1


