

Translate this page into:
Synergistic improvement of Cr(VI) reduction and RhB degradation using RP/g-C3N4 photocatalyst under visible light irradiation
⁎Corresponding authors. liuenzhou@nwu.edu.cn (Enzhou Liu), fanjun@nwu.edu.cn (Jun Fan)
-
Received: ,
Accepted: ,
This article was originally published by Elsevier and was migrated to Scientific Scholar after the change of Publisher.
Peer review under responsibility of King Saud University.
Abstract
The RP/g-C3N4 heterojunction photocatalyst was fabricated by a facile heat treatment strategy. The obtained composite has excellent light harvesting ability and charge separation performance. Compared to single RP and g-C3N4, the 50%-RP/g-C3N4 exhibited enhanced photocatalytic activity for simultaneously removing Cr(VI) and RhB, and the removal rates can reach 92% and 99% in 25 min, respectively. The enhanced mechanism was revealed by active species capturing experiments, showing that electrons can reduce Cr(VI) and produce •O2– in air and that holes can directly oxidize the dyes. The coexistence of Cr(VI) and RhB will lead to a synergistic improvement of Cr(VI) reduction and RhB degradation due to rapid surface reactions. This further improves the charge separation except for the heterojunction effect. In addition, the COD analysis demonstrates that organic dyes are mainly degraded into CO2, H2O and some intermediates.
Keywords
Photocatalysis
Cr(VI) reduction
Organic pollutant degradation
Synergistic effect
COD

1 Introduction
Population explosion, the resource crisis and environmental pollution are the three major challenges that human beings must face since the beginning of the 21st century. Water pollution caused by industrial waste discharge cannot be ignored as an environmental pollution issue. Generally, industrial wastewater usually contains heavy metals (e.g., Cr(VI), Cd(II), Pb(II), Hg(II)) and organic pollutants (e.g., Rhodamine B (RhB), Methylene blue (MB), Methyl orange (MO)). Cr(VI) is greatly harmful to human health due to its solubility, carcinogenicity and teratogenicity (Tang et al., 2015, Wang et al., 2018a,b,c, Yu et al., 2014, Xu et al., 2015). So far, many methods have been applied to remove Cr(VI) and organic dyestuff in industrial sewage, including photocatalysis (Nezar et al., 2018, Zhang et al., 2015a,b), chemical precipitation (Wang et al., 2018a,b,c), adsorption (Chen et al., 2017), and membrane separation (Choudhury et al., 2018). Among them, photocatalytic technology is considered as an effective strategy to reduce Cr(VI) to less toxic Cr(III) (Xing et al., 2018, Meng et al., 2017) and decompose organic dyes to CO2 and H2O (Bai et al., 2018a,b, Zeng et al., 2018). The photocatalysts can directly harvest solar energy and generate active electrons and holes (Li et al., 2018a,b), which can induce oxidation-reduction reactions to reduce Cr(VI) or destroy dyes, achieving environmental remediation by an economic energy-saving and environment-friendly way (Zhang et al., 2018a,b,c, Li et al., 2015a,b, Low et al., 2017a,b).
At present, many investigations have focused on development of highly stable and active photocatalysts under visible light with the aim of fully utilizing the solar energy spectrum. Li et al. (2018a,b) reported that Cr(VI) with a concentration of 20 mg L−1 was completely reduced by nanostructured RP within 36 min under visible light. Qu et al. (2017) presented a porous SnS2 that can reduce 100% 50 mg L−1 Cr(VI) under visible light illumination within 15 min at low pH. Chai et al. (2017) determined that 1% P-doped g-C3N4 showed the optimal degradation ability for RhB, the degradation rate can reach 95% within 30 min. Lu et al. (2017) assembled TiO2 nanorods on g-C3N4 nanosheets to remove 94.75% RhB and 89.25% Cr(VI) under visible light in 70 min. However, most of the photocatalysts were used to remove organic pollutants. However, for photocatalysts related to the Cr(VI) reduction, the efficiency is still very low. To deal with practical environmental issue, there is an urgent need to explore effective photocatalysts for the removal of multiple pollutants simultaneously.
Since Wang et al. first reported that red phosphorus (RP) possesses the capacity of splitting water to produce hydrogen under visible light irradiation in 2012, RP, as an earth-abundant elemental photocatalyst, has attracted increasing attention for its economy, nontoxicity, and excellent visible light capturing ability (Wang et al., 2012a,b). At present, RP has been widely employed for photocatalytic water splitting, CO2 reduction, sterilization and degradation of organic pollutants (Yuan et al., 2013, Xia et al., 2015, Zong et al., 2015, Shen et al., 2015, Dang et al., 2014, Shen et al., 2014, Chan et al., 2017, Ansari et al., 2016a,b, Wang et al., 2018a,b,c). Ansari and Cho (2016) reported that RP in ball milling for 36 h exhibited maximum rate constants (0.1523 h−1) for the photocatalytic degradation of RhB. Li et al. (2016a,b) found that nanosized RP modified by graphene can completely remove 100 mL of 10 mg L−1 RhB in 3 min under visible light, indicating that RP has great potential in the field of wastewater treatment. However, the large-scale application of RP is severely limited by the quick recombination of charges and its low specific surface area (Zing et al., 2017). To work out these problems, surface roughening (Li et al., 2015a,b), metal surface deposition (Qi et al., 2018), and heterojunction construction (Shi et al., 2016) have been used to improve the photocatalytic efficiency of RP (see Table S2 for the RP-related photocatalysts reported in the literature).
Heterojunctions formed by RP and other semiconductors usually have higher activity than pure RP. g-C3N4 is a nontoxic stable nonmetal photocatalyst. It is a promising material for H2 generation from water reduction due to its appropriate band structures (Eg = 2.9 eV). Nonetheless, g-C3N4 suffers from the quick recombination of charge carriers. Therefore, coupling RP and g-C3N4 is a feasible option to overcome their shortcomings and improve the photocatalytic activity. Ansari and Cho (2016) group reported that the RP/g-C3N4 heterojunction for the degradation of MO and RhB with rate constants of 0.01462 and 0.007, respectively. Zhao et al. (2017) fabricated a ternary g-C3N4/RP/MoS2 heterojunction photocatalyst for H2 evolution (515.8 μmol g−1) from H2O with λ > 420 nm. Zing et al. (2017) prepared a novel fibrous RP-doped g-C3N4 photocatalyst for generating H2 by splitting water with a significantly improved hydrogen production rate of 2565 µmol h−1 g−1, which is about six-fold that of pure g-C3N4 (413 µmol h−1 g−1). Muhmood et al. (2018) synthesized a type-I heterojunction between RP and g-C3N4 for completely degrading the acutely toxic category-III compound and RhB after 90 min and 120 min, respectively under sun light. Above all, significant effort has been devoted to photocatalytic water splitting to produce H2 with RP/g-C3N4. The investigation related to RP is still in the preliminary stage. To the best of our knowledge, the reduction of heavy metal Cr(VI) and the degradation of organic dyestuff together has been reported rarely. Photocatalysis simultaneously removes multiple pollutants to meet the actual needs due to the complicated types of pollutants in real industrial wastewater treatment. Therefore, photocatalysis simultaneous reduction of Cr(VI) and oxidative degradation of organic pollutant is an efficient method for treating industrial wastewater. Photocatalytic reduction and oxidation are simultaneously utilized as a subtle strategy. Because Cr(VI) is reduced to Cr(III) (Lu et al., 2018a,b, Dong et al., 2018a,b), organic pollutants are oxidatively degraded into CO2, H2O and some intermediates in photocatalysis reaction process (Han et al., 2016, Lu et al., 2018a,b). In addition, coinstantaneous and rapid removal of multiple contaminants is a feature of highly efficient photocatalyst. What our concern is the synthesis of simple and efficient catalysts.
In our work, RP/g-C3N4 composites were coupled together by heat treatment method in Ar atmosphere. They were first employed for the reduction of Cr(VI) and the degradation of organic pollutant under visible light irradiation. We found a synergistic improvement of Cr(VI) reduction and RhB degradation. Finally, the enhanced mechanism is investigated and proposed based on active species capture experiments.
2 The experiment part
2.1 Materials and preparation
The detailed preparation processes of the samples are shown Scheme 1.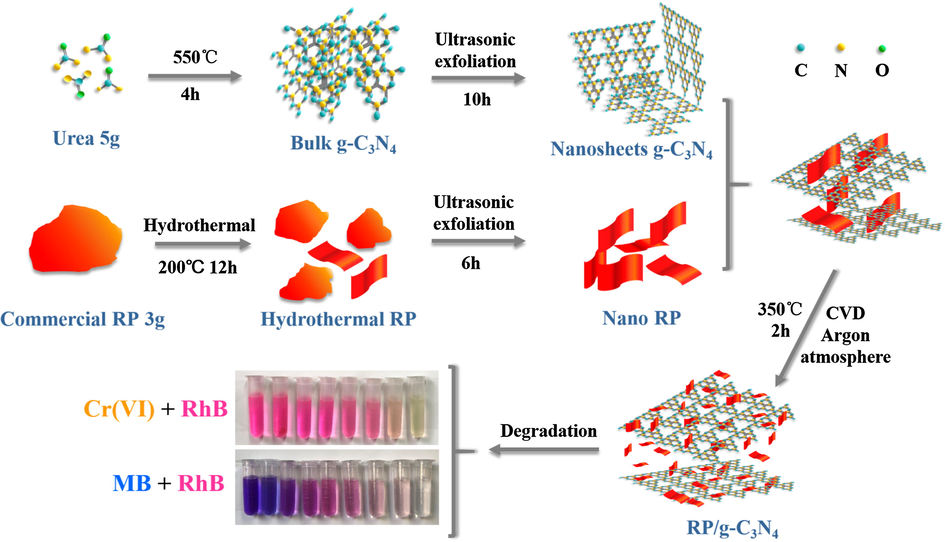
Schematic illustration of the preparation of RP/g-C3N4 composite.
2.1.1 Preparation of g-C3N4 nanosheets and RP nanostructure
Traditional thermal polymerization was applied to prepare g-C3N4 using urea as a precursor (Shen et al., 2018). First, 5.0 g urea was heated at 550 °C for 4 h (at a heating rate of 5 °C min−1). Then, the cooled-product was obtained and ground into powder. Subsequently, the powder was dispersed in a beaker containing 1000 mL deionized water, and the suspension was stirred and treated by ultrasonic exfoliation for approximately 10 h. Finally, the exfoliated powder was dried to obtain the nanosheets of g-C3N4.
Commercial red phosphorus was refined by a hydrothermal method. In brief, 3 g of ground and sifted red phosphorus with 100 mesh size was dispersed in 60 mL deionized water. The suspension was sealed in a Teflon-lined autoclave after stirring for 30 min and maintained at 200 °C for 12 h in an oven. The red product was collected and treated by ultrasonic exfoliation for 6 h. Subsequently, the exfoliated sample was dried to obtain the nanostructured RP.
2.1.2 Synthesis of RP/g-C3N4 composites
Heat treatment was used to fabricate RP/g-C3N4 heterojunctions in Ar atmosphere.100 mg g-C3N4 was ground with 25 mg, 50 mg, 100 mg, 150 mg RP (labeled 20%-RP/g-C3N4, 33%-RP/g-C3N4, 50%-RP/g-C3N4 60%-RP/g-C3N4, respectively). The mixture was calcined in a vacuum tube furnace in an Ar atmosphere at 350 °C for 2 h. The RP/g-C3N4 composite was obtained after cooling to room temperature.
2.2 Characterization
Characterization methods are shown in Supplementary Material.
2.3 Photoelectrochemical detection
An electrochemical workstation (CHI660E) with a standard three electrode cell was carried out to measure the photoelectrochemical performance of samples under a 300 W xenon lamp, such as photocurrent responses and electrochemical impedance spectroscopy (EIS). As-prepared photocatalysts, platinum wire, and Ag/AgCl electrode (saturated KCl) were used as the working electrode, counter electrode and reference electrode, respectively. The concentration of the Na2SO4 electrolyte is 0.5 M. In addition, for preparation of the working electrode, 5 mg of photocatalyst was dispersed in 3 mL of deionized water, and the suspension was ultrasonically treated for 2 h. The dispersion was dripped onto the conductive glass and dried spontaneously.
2.4 Photocatalytic performance evaluation
A mixed solution of K2Cr2O7 (the source of the heavy metal Cr(VI)) and RhB was used to simulate industrial wastewater, and a mixture of MB and RhB was used for imitating model dye wastewater. The photocatalytic performance was evaluated for the removal of 100 mL of the mixture of Cr(VI) (40 mg L−1) and RhB (20 mg L−1), 100 mL of a mixture of MB (20 mg L−1) and RhB (20 mg/L), 100 mL mixture of Cr(VI) (40 mg L−1) and phenol (20 mg L−1) in beakers, respectively. A 300 W xenon lamp with a filter (λ > 420 nm) was used as the light source. 40 mg of catalyst was added into the beakers. The suspension was stirred in the dark for 30 min to achieve an adsorption desorption equilibrium. 3 mL of solution was gathered at certain intervals until the waste water was purified and then centrifuged at 10,000 rpm for 15 min, the supernatant was collected. The concentration change of Cr(VI) ions and organic dyes was measured by an ultraviolet visible spectrophotometer at the absorption wavelengths of Cr(VI), RhB, MB and phenol 354 mn, 554 nm, 664 nm and 270 nm, respectively. Subsequently, the Cr(VI) and RhB coexistence system was representative of performing capture experiments and cycle tests. For stability tests, after each of photocatalytic reaction, photocatalysts were collected from the suspension by centrifugation and washed 3 times with distilled water and dried at 60 °C for approximately 6 h for subsequent use.
To further prove that organic dyes were degraded into small molecules, the chemical oxygen demand (COD) of the supernatant was measured by a QCOD-3F detector.
2.5 Active species trapping experiments
The radical trapping experiments were carried out to determine the active species during the reaction. The •OH, •O2– and h+ were scavenged by isopropanol (IPA), p-benzoquinone (PBQ) and ethylenediamine tetraacetic acid disodium salt (EDTA-Na2), respectively.
3 Results and discussion
3.1 XRD analysis
The XRD patterns of the samples are shown in Fig. 1a. The peak at 15.19° belongs to the amorphous structure of pure RP The signals at 12.96° and 27.75° from bare g-C3N4 are attributed to the (1 0 0) and (0 0 2) crystal faces for the interplanar stacking of aromatic units and the crystal plane of a graphitic material, respectively (He et al., 2018). The characteristic diffraction peaks of g-C3N4 and RP are all observed in the composites, suggesting that the introduction of RP didn’t change the graphitic structure of g-C3N4, but the peaks intensities of g-C3N4 become weak with the addition of RP.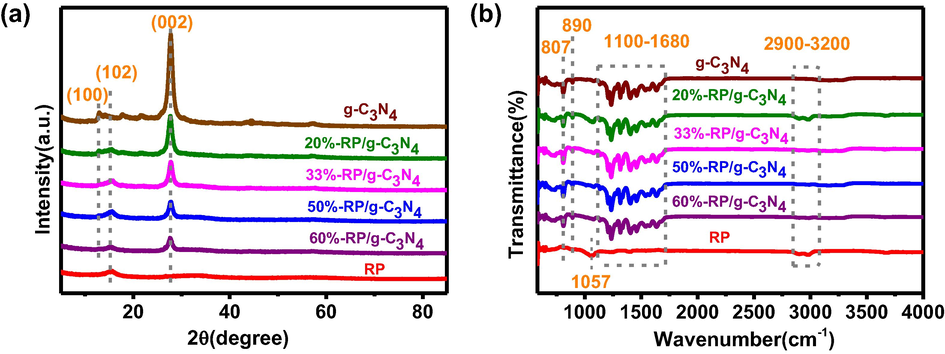
(a) XRD and (b) FT-IR spectra of samples.
3.2 FT-IR analysis
Fig. 1b shows the FT-IR spectra of the samples. The peaks at 1057 cm−1 are attributed to the P—O bond stretching vibration in RP, which can easily formed in the air. The broad peaks located at 2900–3200 cm−1 are related to bending modes of the —NH group and —OH from absorbed water, and the prominent fingerprints of g-C3N4 approximately 1100–1680 cm−1 are allocated to the typical stretching vibration modes of C—N and C⚌N (Hu et al., 2019). The peaks at 890 and 807 cm−1 are assigned to the deformation mode of N—H and the typical bending vibration of the tri-s-triazine ring system, respectively (Ma et al., 2017, Zeng et al., 2019). Nevertheless, the absorption features of RP could hardly be observed in a binary material, which is likely to due to its vibration overlapping with those of the strong C—N and C⚌N vibrations (Zhang et al., 2013). With the introduction of RP, the hybrid samples show similar FT-IR absorption features those of g-C3N4. The XRD and FT-IR results prove that RP was successfully loaded onto the surface of g-C3N4.
3.3 XPS analysis
XPS was used to further explore the chemical composition and elemental chemical states between RP and g-C3N4. The signals of O, C, N, and P can be clearly observed in the survey spectrum (Fig. 2a). In the spectrum of C1s in Fig. 2b, three peaks at 284.8 eV, 286.8 eV, 288.4 eV correspond with C—C, C—H, N—C⚌N bonds respectively. The spectrum of N1s in Fig. 2c is fitted into three peaks located at 398.9 eV, 399.7 eV, 401.0 eV, which can be assigned to the C—N⚌C, N—(C)3, C—NH groups (Liu et al., 2018, Wang et al., 2016a,b). The obvious peak at 129.4 eV in the high resolution of P2p spectrum (Fig. 2d) is due to P2p3/2 of phosphorus. The two weak peaks at 130.4 eV and 133.3 eV are attributable to P2p1/2 and the P—O bond (Bai et al., 2018).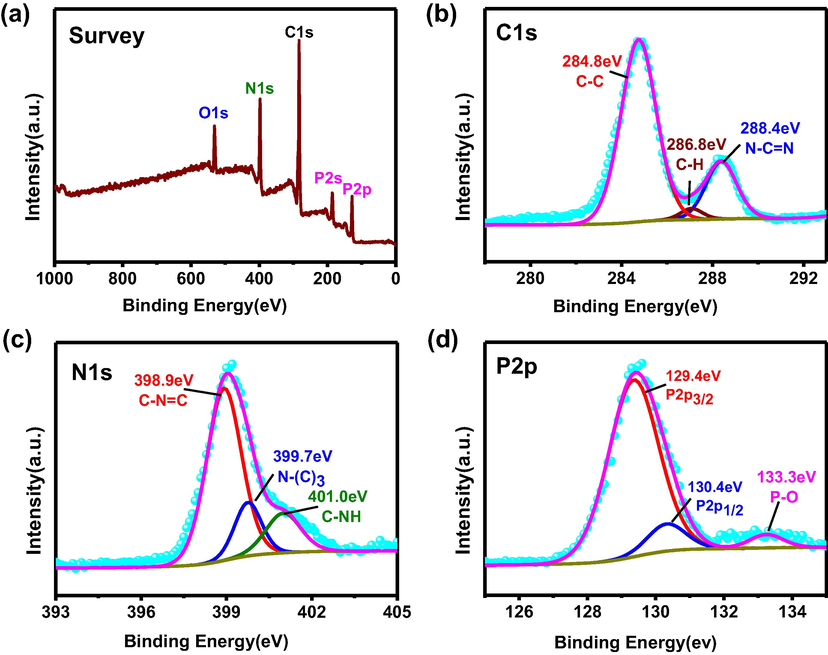
(a) Survey spectrum, (b) C1s, (c) N1s and (d) P2p XPS of 50%-RP/g-C3N4.
3.4 TEM and SEM analysis
Nanoparticles of RP and nanosheets of g-C3N4 can be obtained by this method (Fig. 3(a, b)). The two-dimensional structure of g-C3N4 can provide large specific surface area, which is favorable for the reaction. After introducing of RP, the nanosheets of g-C3N4 and nanoparticles of RP can be clearly observed in Fig. 3c. 50%-RP/g-C3N4 sample was chosen for further examination by TEM. Fig. 3(d–f) shows a partial enlargement at the same location. g-C3N4 nanosheets and RP particles can be all clearly observed, suggesting that the heterojunction between g-C3N4 and RP was successfully constructed. SEM-elemental mapping (Fig. 3g) discloses a uniform distribution of O, C, N and P throughout the 50%-RP/g-C3N4 sample, which is in accordance with the XPS survey spectrum. In addition, the energy-dispersive X-ray spectroscopy (EDS) spectrum reflects that the content of each element and the presence of RP and g-C3N4 in this sample. The content of RP is lower than the theoretical value, it may be lost in the calcining process.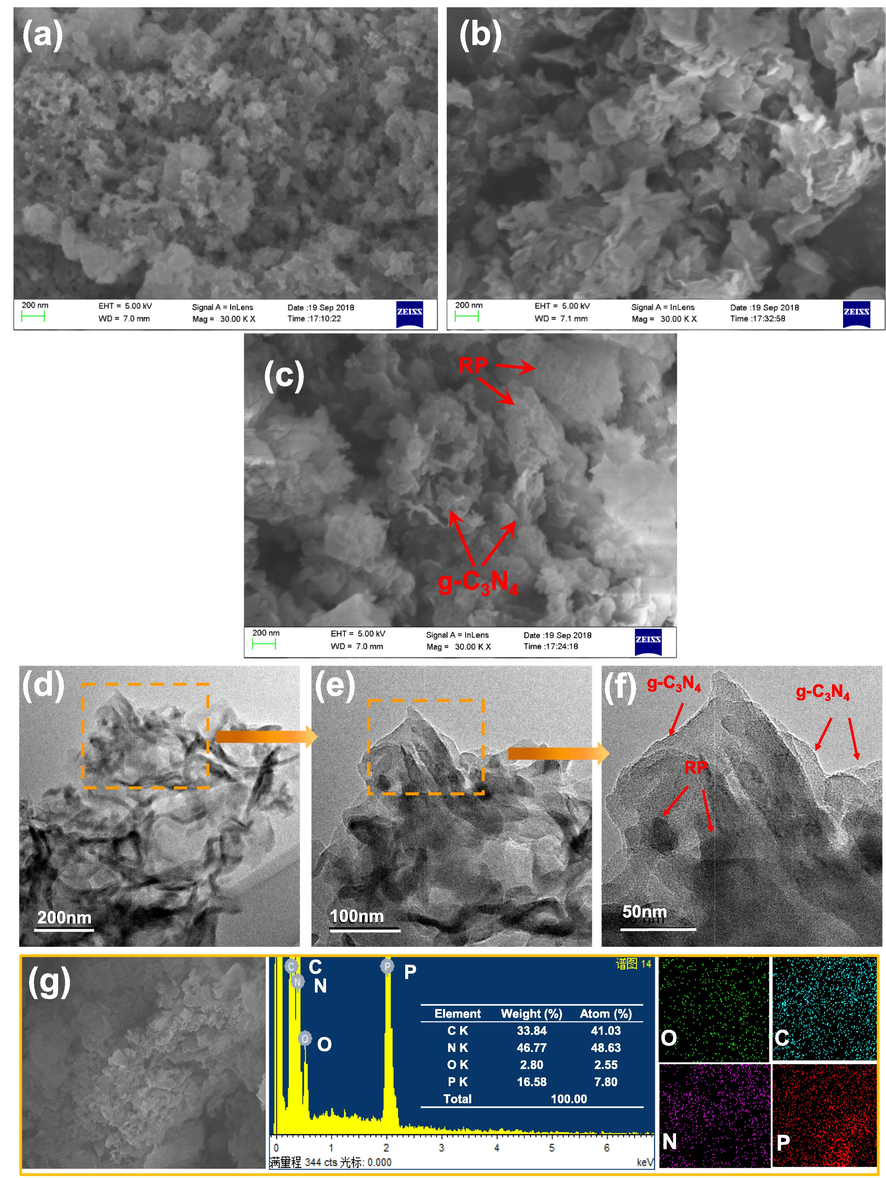
(a–c) SEM images of RP, g-C3N4, 50%-RP/g-C3N4. (d–f) TEM images of 50%-RP/g-C3N4 in different amplifications. (g) EDS spectrum of 50%-RP/g-C3N4 and Elemental mapping images of O, C, N and P.
3.5 Simultaneous photocatalytic degradation performance evaluation
Based on the photocatalytic performance evaluation experimental results of all composites with different ratios of RP (Fig. S1, S2), we found that 50%-RP/g-C3N4 exhibited superior photocatalytic activity. 50%-RP/g-C3N4 and other samples were chosen for the purification of waste water containing 40 mg/L Cr(VI) and 20 mg/L RhB under visible light irradiation. The reaction solution was stirred in the dark for approximately 30 min to explore the adsorption capacity of the photocatalyst. Fig. 4a shows that 42% of Cr(VI) and 17% of RhB can be adsorbed before illumination. The removal rate (η) was calculated by a formula: η = 1 − C/C0 × 100%, where C0 and C are the initial concentration and the concentration at time t (0–25 min), respectively. Fig. 4(a, c, e) exhibits the UV–Vis absorption curves of Cr(VI) (354 nm) and RhB (554 nm) over 50%-RP/g-C3N4, pure g-C3N4 and single RP, respectively. The reduction rate of Cr(VI) and the degradation rate of RhB by 50%-RP/g-C3N4 are 92% and 99%, respectively, within 25 min (Fig. 4b). However, only 28% and 73% Cr(VI) were reduced, 92% and 61% RhB were degraded when used alone under the same conditions (Fig. 4(d, f)). It is clear that the 50%-RP/g-C3N4 sample has excellent activity for the simultaneous reduction of Cr(VI) and degradation of RhB. This is attributed to the effective separation and rapid transfer of e−/h+ pairs between RP and g-C3N4 (Zhang et al., 2018a,b,c). The photocatalytic performance of physical mixing of two materials was evaluated in Fig. S3. The experimental results show that 36.5% of Cr(VI) and 86.3% of RhB are removed within 25 min. So 50%-RP/g-C3N4, heterojunction photocatalyst was fabricated by a facile heat treatment strategy, exhibited an enhanced photocatalytic activity for simultaneously remove Cr(VI) and RhB.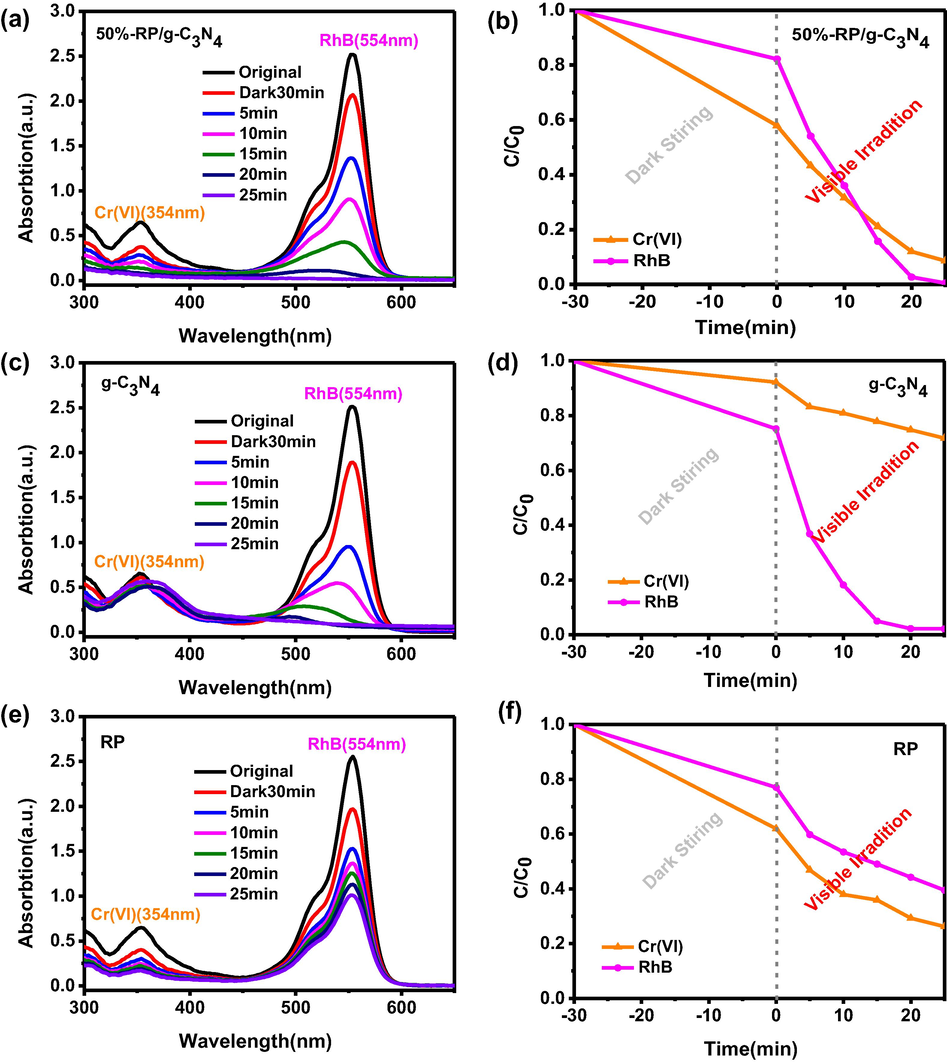
The change in UV–vis absorption spectra and removal efficiencies of Cr(VI) and RhB by (a, b) 50%-RP/g-C3N4, (c, d) g-C3N4, (e, f) RP.
The removal Cr(VI) or RhB was conducted using 50%-RP/g-C3N4. As shown in Fig. 5(a, b), 22% of Cr(VI) and 86% of RhB can be removed by 50%-RP/g-C3N4 within 25 min, which is lower than the values of 92% and 99% when they are removed together (Fig. 5c). This suggests that there is a synergistic effect in the photocatalytic processes of the simultaneous reduction of Cr(VI) and oxidation of organic dyes (Dong et al., 2018a,b) (the reason for the synergistic effect was investigated in detail below). In addition, the stability of the composite was evaluated by long duration stability tests. 50%-RP/g-C3N4 clearly has good stability for removing 85% Cr(VI) and 90% RhB after four times in Fig. 5d, the slightly deceased activity may also be related to the loss of the samples during the recovery process. We collected the catalyst after photocatalysis reaction and performed XRD and XPS tests to verify the stability of the catalyst (Fig. S4). The results showed that the structure of the catalyst did not change before and after the reaction, indicating that the catalyst has good stability.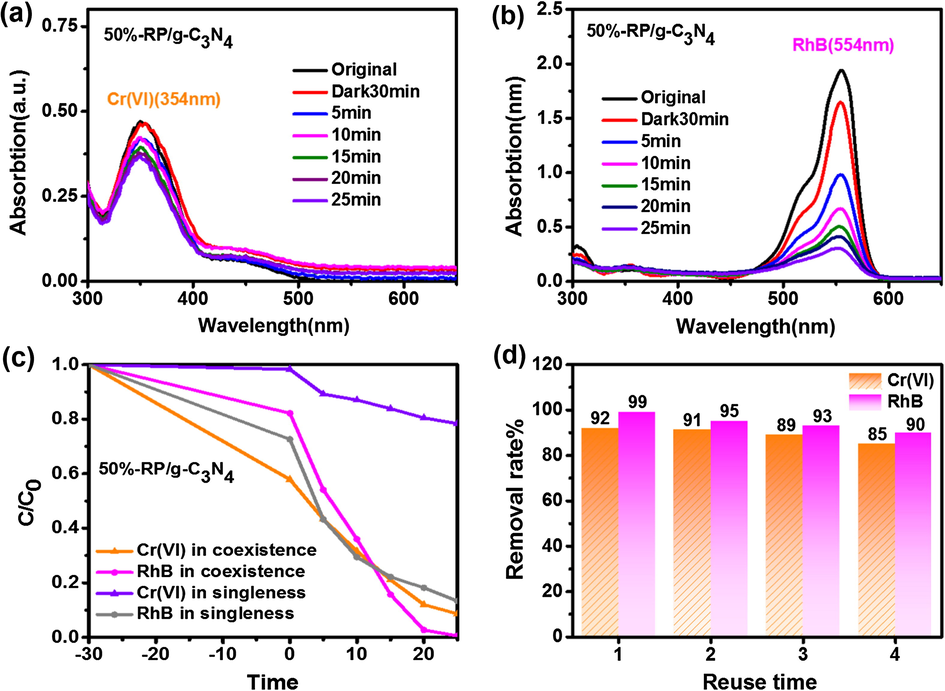
The change in UV–vis absorption spectra of (a) Cr(VI) and (b) RhB in non-coexistence systems by 50%-RP/g-C3N4. (c) The removal efficiencies of Cr(VI) and RhB in coexistence and non-coexistence systems. (d) Stability tests.
The prepared composite was also employed to simultaneously remove MB (20 mg L−1) and RhB (20 mg L−1). First of all, the adsorption capacity of the catalyst for RhB and MB was tested before irradiation. Fig. S5 showed that 32.1% of RhB and 60.2% of MB were adsorbed within 120 min. RhB and MB reached adsorption equilibrium after 30 min and 40 min, respectively. It’s observed that 99% of MB and 98% of RhB was removed within 70 min over 50%-RP/g-C3N4 under visible light irradiation (Fig. 6). The simultaneous removal rate of RhB in Cr(VI) and RhB system is 2.8 times than that of RhB in MB and RhB system, indicating that Cr(VI) plays an important role for RhB degradation, this may be related to the synergistic effect of photocatalytic redox reactions during the simultaneous removal of Cr(VI) and organic pollutants. Subsequently, the COD values of water containing MB and RhB were detected to reveal the degradation level of the organic dyes. At the beginning, the COD of the mixture containing MB (20 mg L−1) and RhB (20 mg L−1) was 44.8 mg L−1. The COD was reduced to 21.7 mg L−1 after 70 min irradiation (Table 1). This means that 52% of the organic dyes are completely degraded to CO2 and H2O. The above results demonstrate that the 50%-RP/g-C3N4 photocatalyst possesses favorable activity for the synchronous removal of heavy metals such as Cr(VI) and dyes, as well as the degradation of different organic dyes. In addition, this catalyst can also simultaneously photocatalytic remove Cr(VI) and colorless organic pollutant phenol as show in Fig. S6. 94.1% of Cr(VI) and 78.7% of phenol can be removed synchronously with 120 min.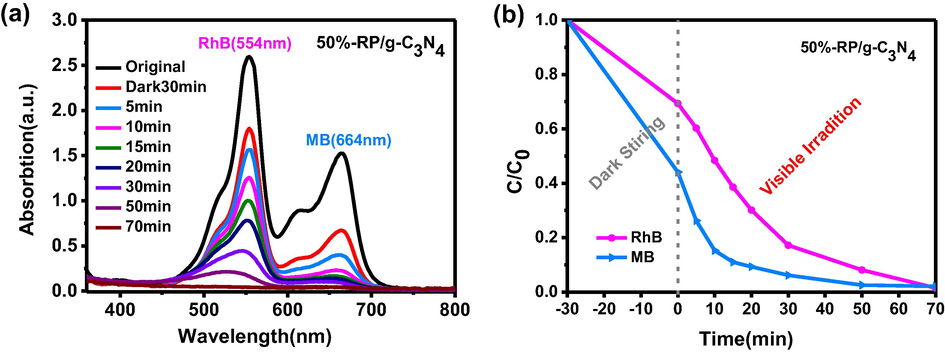
(a) The change in UV–vis absorption spectra. (b) Removal efficiencies of MB and RhB by 50%-RP/g-C3N4.
Time (min)
Original
Dark 30 min
5
10
15
20
30
50
70
Deionized water
Concentration (mg/L)
44.8
30.9
30.1
29.7
27.3
24.9
24.6
22.1
21.7
0.038
In order to prove that Cr(VI) is reduced to Cr(III) during photocatalytic reaction, we investigated Cr2p XPS spectrum for the catalyst after photocatalytic reaction. Three peaks can be observed in Fig. 7, and the peaks at binding energy of 577.6 eV and 587.3 eV correspond to Cr2p3/2 and Cr2p1/2 of Cr(III), respectively. Lower intensity peak at 579.8 eV is attributed to Cr(VI), indicating that most of the Cr(VI) has been reduced to Cr(III) in photocatalytic process. (Fida et al., 2015).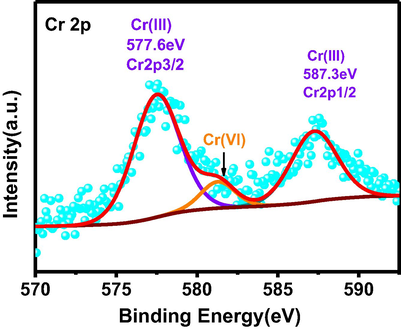
High resolution XPS spectra of Cr2p over the catalyst surface after photocatalytic reaction.
3.6 BET and PL analysis
For catalysts with high photocatalytic activity, specific surface area (BET) is nonnegligible, which provides more adsorption sites and active sites for the reaction. (N2 adsorption isotherms and BET of samples are shown in Fig. 8a. The relevant pore size distribution and pore size data are shown in Fig.S7 and Table S1.) The surface of g-C3N4, 50%-RP/g-C3N4 and RP are 83.987, 79.253 and 53.111 m2/g, respectively. The PL spectrum can be used to reveal the free electrons and holes recombination efficiency of the photocatalysts. As shown in Fig. 8b, the PL spectra of g-C3N4 and RP/g-C3N4 composites display a wide emission at approximately 450 nm with the excitation wavelength of 320 nm. In addition, the recombination of charge carriers in the composites was suppressed, leading to a longer lifetime in theory (Zhu et al., 2015, Qiao et al., 2018).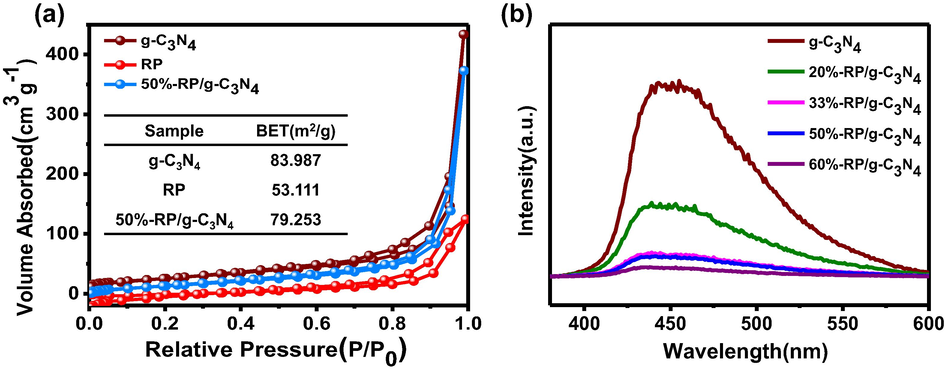
(a) N2 adsorption isotherms and BET and (b) the PL spectra of the samples.
3.7 Photoelectrochemical characterization
Fig. 9a shows the photocurrent response of the samples exposed to light (a 300 W Xe lamp). The photocurrent intensity for 50%-RP/g-C3N4 (11 μA cm−2) was about 4 times as high as that of g-C3N4 (2.7 μA cm−2) and 1.5 times as high as that of RP (7.4 μA cm−2). It is understood that photocurrent is formed by the transfer of photogenerated electrons. This means that the migration of electron hole pairs was strengthened, indicating that the heterojunction interface was successfully formed between RP and g-C3N4 (Bai et al., 2015, Cui et al., 2018). The electrochemical impedance spectra (EIS) Nyquist plot was also investigated to reveal the charge transfer resistance at the composite interface (Tian et al., 2017a,b). The radius of the arc usually represents the resistance of electron transport at the interface; a smaller radius means lower charge carrier transfer resistance (Tian et al., 2017a,b, Zhang et al., 2018a,b,c). As shown in Fig. 9b, the arc radius of the composites are significantly decreased, indicating that the interfacial resistance between g-C3N4 and RP is very low (Low et al., 2017a,b).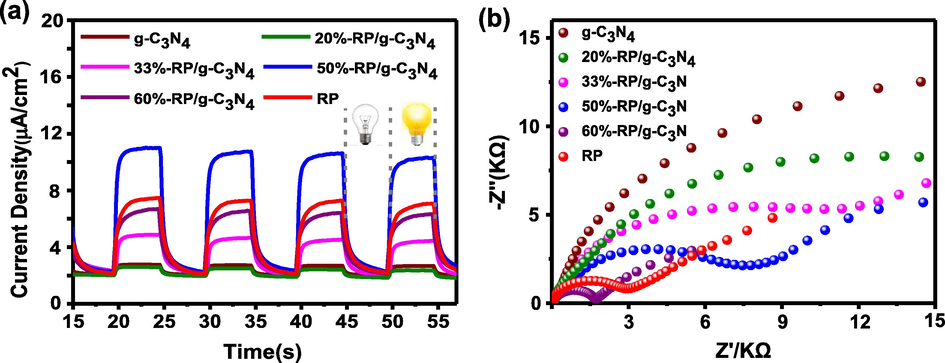
(a) Photocurrent responses and (b) EIS of samples.
3.8 UV–vis analysis
Fig. 10a shows the light absorption spectra of the samples. The absorption edge of g-C3N4 appears at approximately 450 nm, which is due to the inherent band gap absorption. Compared with g-C3N4, RP has wider range and stronger absorption with an absorption edge of 710 nm. It is obvious that the absorption intensity of the composites increases with the increase of the concentration of RP. There is also a redshift of the absorption with the increase of the concentration of RP, indicating that the coupling of RP and g-C3N4 can harvest the light energy effectively. Furthermore, the band gap energies (Eg) of RP and g-C3N4 are calculated according to the Kubelka-Munk formula. As shown in Fig. 10b, the Eg values of RP and g-C3N4 are 1.92 eV and 2.94 eV, respectively. The valence band energies (EVB) of RP and g-C3N4 are 1.53 eV and 1.72 eV, respectively, by the valence band spectrum in Fig. 10(c, d). In addition, the conduction band energies (ECB) of RP and g-C3N4 are −0.39 eV and −1.22 eV, respectively, based on the formula below (Ong et al., 2015, Hatamie et al., 2018, Yang et al., 2017).
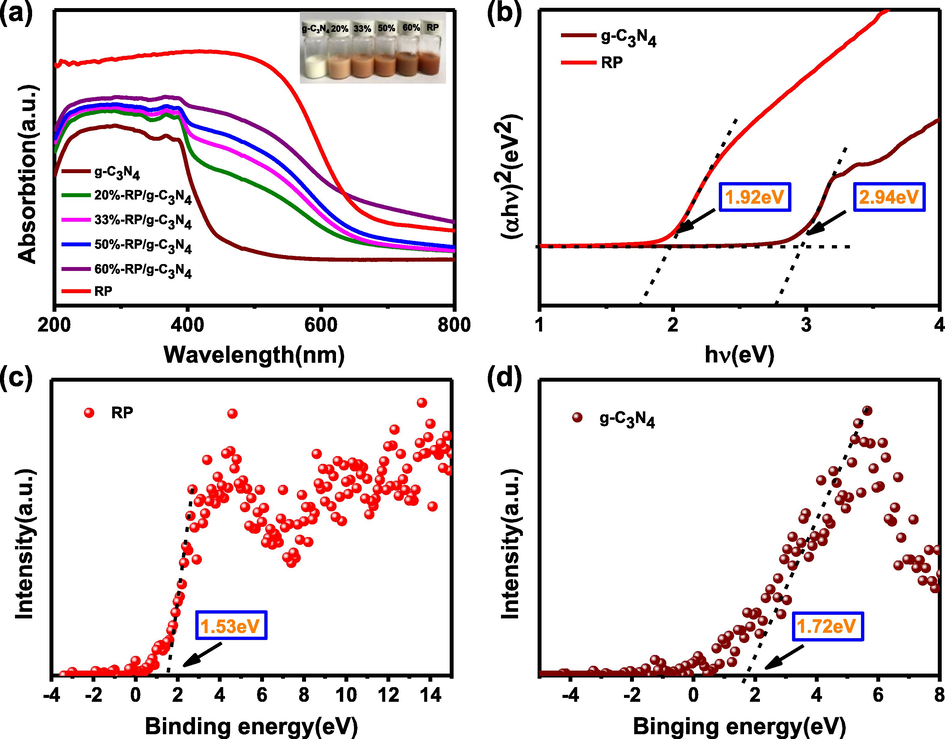
(a) Ultraviolet diffuse reflection of samples, insert: photo of samples with different RP content. (b) Band gap of RP and g-C3N4. (c) and (d) Valence band spectrum of RP and g-C3N4.
3.9 The mechanism of photocatalytic processes
It is well-known that photoexcited electrons (e−) can reduce Cr(VI) into Cr(III) (Abdullah et al., 2016, Wang et al., 2016a,b). The active species involved in dye degradation mainly include ·OH, •O2– and h+, which are detected by capturing experiments (Suwanboon et al., 2016, Shao et al., 2015). As displayed in Fig. 11, IPA had little effect on the activities of the composite after addition to the reaction system, indicating the lack of •OH. However, when BQ and EDTA-Na2 were introduced, there was an obvious decrease of activity for degradation of RhB. Therefore, •O2– and h+ are active species in the degradation process of dyes. Surprisingly, the removal rate of Cr(VI) decreases distinctly with the decrease of RhB removal rate in the presence of BQ too (Fig. 11c). When •O2– is captured by BQ, the original chemical equilibrium is broken. According to the Le Chatelier principle, more electrons joined in the reduction of O2 to •O2–, so the reduction of Cr(VI) is limited. For Fig. 11d, when h+ is captured by EDTA-Na2, only •O2– plays a role in the degradation of RhB, so the degradation rate of RhB slows down.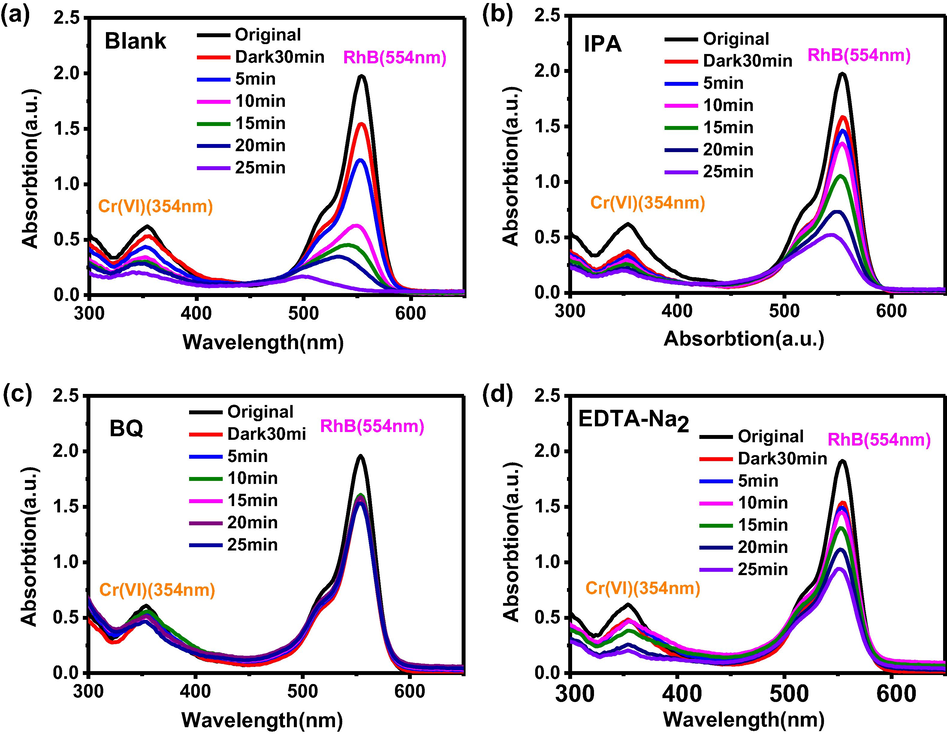
The capture experiments: (a) no scavenger, (b) isopropanol, (c) p-benzoquinone, (d) triethanolamine.
As displayed in Scheme 2, Eθ (O2/•O2–) = −0.33 eV, Eθ (OH–/•OH) = 2.38 eV and Eθ (Cr6+/Cr3+) = 1.35 eV (Zhang et al., 2015a,b, Jungwon et al., 2010), suggesting that •O2– can be generated in this system for the lower CB position of RP. However, the production of ·OH is limited for the lower VB position of g-C3N4. After irradiation, the e− in the VB can jump to the CB in the semiconductor (Wei et al., 2018). The e− in the CB of g-C3N4 will transfer to the less negative CB of RP, then reducing Cr(VI) to Cr(III) (Li et al., 2016a,b, Wang et al., 2017)and reducing O2 to •O2–, which can react with the dye to form achromatous small molecules, even CO2, H2O and some intermediates according to the COD analysis. At the same time, the h+ in the VB of the catalysts can also oxidize the dyes to CO2, H2O and some intermediates. When e− and h+ participate in the redox reactions simultaneously, the separation of carriers will be greatly improved, leading to a synergistic improvement of Cr(VI) reduction and RhB degradation.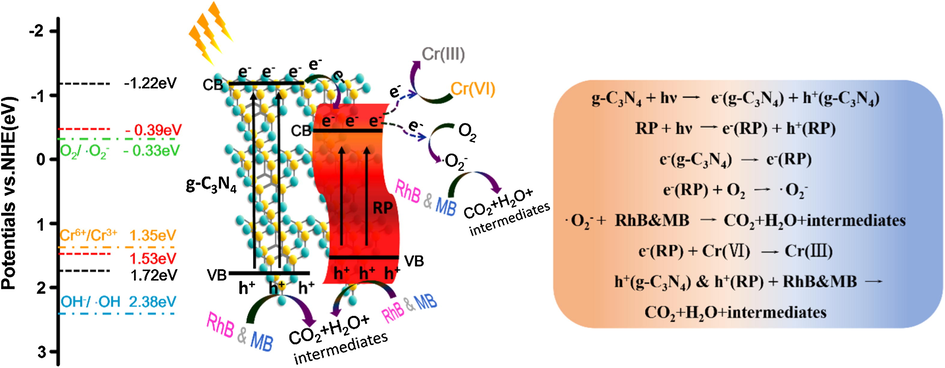
Schematic illustration of photocatalytic simultaneous removal mechanism of Cr(VI) and organic pollutant.
4 Conclusion
The photocatalytic heterojunction between RP and g-C3N4 was successfully fabricated by heat treatment. 50%-RP/g-C3N4 exhibits excellent activities for the simultaneous removal of Cr(VI) and RhB, and the removal rates can reach 92% and 99% in 25 min, respectively. The coupling of RP and g-C3N4 not only improves the light harvesting efficiency but also the charge carrier separation. Furthermore, when Cr(VI) and organic pollutants coexist in the system, the photocatalytic redox processes will be greatly enhanced due to the quick utilization of electrons and holes by the surface reactions, including the reduction of Cr(VI) and degradation of organic pollutants, leading to a synergistic effect. The simultaneous removal of Cr(VI) and organic dyes with the RP/g-C3N4-based photocatalyst has potential applications for its high efficiency.
Acknowledgments
This work was supported by the National Natural Science Foundation of China (Nos. 21476183, 21676213 and 51372201), the China Postdoctoral Science Foundation (No. 2016M600809), the Natural Science Basic Research Plan in Shaanxi Province of China (No. 2017JM2026) and the Scientific Research Foundation of the Education Department of Shaanxi Provincial Government, China (No. 18JK0873).
References
- J. Mater. Sci.. 2016;51:8209-8223.
- Sci. Rep-UK. 2016;6:25405-25415.
- Phys. Chem. Chem. Phys.. 2016;18:3921-3928.
- Sci. Rep-UK. 2016;6:27713-27725.
- Mater. Lett.. 2018;222:187-191.
- Appl. Catal. B. 2018;239:204-213.
- Chem. Soc. Rev.. 2015;44:2893-2939.
- Appl. Surf. Sci.. 2017;391:376-383.
- J. Environ. Sci. (China). 2017;60:91-97.
- Environ. Safe.. 2017;164:440-447.
- Chem. Eng. J.. 2018;336:570-578.
- Appl. Catal. B: Environ.. 2018;232:232-245.
- RSC Adv.. 2014;4:44823-44826.
- Appl. Catal. B: Environ.. 2018;222:146-156.
- Environ. Sci. Technol.. 2018;52:11297-11308.
- J. Colloid Interf. Sci.. 2015;442 30 128
- Nano Today. 2016;11:351-372.
- Talanta. 2018;176:518-525.
- J. Mater. Chem. A. 2018;6:13110-13122.
- Appl. Catal. B: Environ.. 2019;245:130-142.
- Environ. Sci. Technol.. 2010;44:6849-6854.
- Appl. Catal. B: Environ.. 2016;199:412-423.
- J. Colloid. Interface Sci.. 2018;537:256-261033.
- J. Mater. Chem. A. 2015;3:2485-2534.
- Mater. Res. Bull.. 2015;70:13-19.
- J. Mol. Catal. A Chem.. 2016;423:356-364.
- Angew. Chem. Int. Ed.. 2018;57:13082-13085.
- Int. J. Hydrogen Energy. 2018;43:21355-21364.
- Adv. Mater.. 2017;1601694:1-20.
- Adv. Mater.. 2017;29:1601694-1601714.
- Nanoscale. 2017;9:3231-3245.
- J. Mater. Chem. A.. 2018;6:4590-4604.
- Appl. Catal. B Environ.. 2018;226:16-22.
- Appl. Catal. B. 2017;219:467-478.
- Chem. Eng. J.. 2017;314:249-256.
- Appl. Catal. B Environ.. 2018;238:568-575.
- Arab. J. Chem.. 2018;01:1-10.
- NANO Energy. 2015;13:757-770.
- Catal. Today. 2018;314:42-51.
- Phys. D: Appl. Phys.. 2018;51:275302
- Appl. Catal. B. 2017;207:404-411.
- Appl. Surf. Sci.. 2015;324:35-43.
- Nanoscale. 2014;6:14163-14167.
- J. Mater. Chem. A. 2015;3:3285-3288.
- ACS Sustain. Chem. Eng.. 2018;6:4026-4036.
- Int. J. Hydrogen Energy. 2016;41:5908-5915.
- Chin. J. Catal.. 2016;37:711-719.
- Nanoscale. 2015;7:7030-7034.
- Chin. J. Catal. 2017:1999-2008.
- Chin. J. Catal.. 2017;38:1899-1908.
- Appl. Catal. B. 2016;193:198-216.
- ACS Sustain. Chem. Eng.. 2016;4:4055-4063.
- Appl. Catal. B. 2012;119–120:267-272.
- Appl. Catal. B. 2018;238:126-135.
- Appl. Catal. B: Environ.. 2017;219:53-62.
- Appl. Catal. B. 2012;111–112:409-414.
- J. Mater. Sci.. 2018;53:12065-12078.
- Appl. Surf. Sci.. 2018;453:394-404.
- J. Mater. Chem. A.. 2018;6:22411-22436.
- Environ. Sci. Technol.. 2015;49:6264-6273.
- Chem.. 2018;4:1359-1372.
- J. Hazard. Mater.. 2015;283:7-13.
- Langmuir. 2017;33:3161-3169.
- Chem. Eng. J.. 2014;258:203-209.
- Appl. Catal. B. 2013;140–141:164-168.
- Zeng, D., Yang, K., Chang, Y., Chen, F., Li, X., Wu, Z., Liu, H., 2018. 237, pp. 449–463.
- J. Phys. D Appl. Phys.. 2019;52:025501
- Mater. Res. Bull.. 2013;48:3485-3491.
- ACS Appl. Mater. Interfaces. 2018;10:23048-23054.
- Appl. Catal. B: Environ.. 2018;221:36-46.
- Appl. Catal. B. 2015;163:298-305.
- Appl. Catal. B. 2018;226:213-219.
- Chem. Rev.. 2015;115:10307-10377.
- Carbon. 2017;119:56-61.
- ACS Appl. Mater. Interfaces. 2015;7:16850-16856.
- Adv. Funct. Mater.. 2017;1703484:1-9.
- Mater. Res. Innov.. 2015;19:361-367.
Appendix A
Supplementary material
Supplementary data to this article can be found online at https://doi.org/10.1016/j.arabjc.2019.02.001.
Appendix A
Supplementary material
The following are the Supplementary data to this article:Supplementary data 1
Supplementary data 1


