

Translate this page into:
Syntheses, crystal structures, DFT calculation and solid-state spectroscopic properties of new zincate(II) complexes with N-(4-substituted phenyl)-N'-(4-nitrophenyl)-oxamate
⁎Corresponding authors. zak1777@bau.edu.jo (Zakariyya Ishtaiwi), d.taher@ju.edu.jo (Deeb Taher)
-
Received: ,
Accepted: ,
This article was originally published by Elsevier and was migrated to Scientific Scholar after the change of Publisher.
Peer review under responsibility of King Saud University.
Abstract
Straightforward synthetic methodologies for the preparation of N-(4-R-phenyl)-N'-(4-nitrophenyl)-oxamate Zincate(II)complexes are discussed. The molecular solid state structures of three compounds are reported. Photoluminescence properties of the Zn(II) complexes in solid state were studied by varying electron-donating substituents at the 4′-position of the phenyl ring.
Abstract
Synthesis of N-(4-nitrophenyl)-N'-(4- substituted phenyl)- oxamate Zincate(II) complexes. Compounds 3a − e were crystallographically characterized. The optical analyses of zinc complexes (3a–e) show strong emission band in the visible region.
Abstract
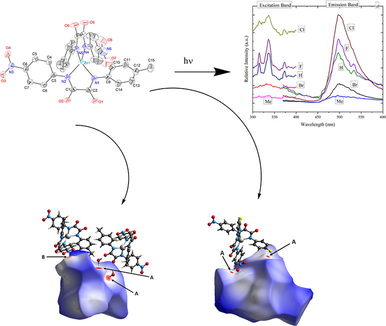
The electronic effects electron donating and withdrawing groups R on the properties of N-(4-R-phenyl)-N'-(4-nitrophenyl)oxamito zincate(II) complexes was investigated featuring R = Me (a), H (b), F (c), Cl (d) and Br (e). The N-(4-R-phenyl)-N'-(4-nitrophenyl)oxamide ligands 2 were synthesized by reacting ethyl 4-nitrooxanilate with the respective 4-substituted anilines. Subsequent treatment with [nBu4N]OH and [Zn(OAc)2(H2O)2] gave the respective zincate complexes [nBu4N]2[Zn(N-(4-nitrophenyl)-N'-(4-substituted phenyl)oxamides)2] (3). Spectroscopic methods were used to describe compounds 2a–e and 3a–e. Single crystal X-ray diffraction analysis confirmed the formation of 3a–c in the solid state. The tetrahedral coordination sphere of the zinc (II) ion features four amide nitrogen donor atoms based on two ethanediamide ligands. The UV–Vis spectra of Complexes 3a–e display a characteristic LLCT (π → π *) band, which was confirmed by TD-DFT calculations. DFT calculations show that the Zn(II) orbitals do not contribute to the HOMO or LUMO, with the latter being primarily found on the two 4-nitrophenyl rings for compounds 3a − e, while the HOMO-1 and HOMO are located on the 4-substituted phenyl rings. Notably, HOMO and LUMO energies and gabs do not differ significantly. Transitions from HOMO to LUMO + 1 are the most important for all ligands. The luminescence properties of solid compounds 3a − e were also investigated at 298 K. Solid state photoluminescence studies reveal that these complexes emit strong yellow-orange luminescence at 450–600 nm with a maximum at about ∼ 500 nm in the cyan region. Furthermore, the thermal stabilities of compounds 3a − e have been investigated.
Keywords
Zinc
Oxamide
Solid State Structure
Electrochemistry
Optical Analyses
DFT calculations

1 Introduction
Organic materials have recently been widely used in the manufacturing of organic light emitting diodes as hole transport layers, electron injection-transport layers, dopants, and hosts (OLEDs). (Jurow, 2016) They have a lot of potential uses in solid state lighting, flexible displays, and flat panel displays because of their features including ultra-thin thickness, rapid switching, low driving voltage, high viewing angle, and ability to generate light without any external backlight sources. (Reineke, 2009) Extensive research is being carried out in order to improve the production of new materials which can produce of new materials which can produce white emissions. New materials are also being studied for their ability to emit light without the usage of external backlight sources, due to their enticing custom-tailored geometries and synthesis flexibility. (Koch, 2007).
In the literature, bright blue luminous metal complexes with ligands containing nitrogen donor atoms have been reported. (Che et al., 2001; Wu et al., 2000; AlDamen et al., 2016; Rufino-Felipe et al., 2016; Zhang et al., 2013; Wang, 2001; Abu-Yamin et al., 2022) Zn(II) complexes containing Schiff bases have recently attracted attention due to their significant photoluminescence emissions (PL). 8-Hydroxyquinolinate or 7-azaindolate zinc(II) complexes, for example, play an important role in blue OLED displays. (Che et al., 2001; Sapochak et al., 2002; Lacroix et al., 1996) The intra-ligand emission excited state produces a very bright blue photoluminescence in 1,2,4-triazole zinc(II) complexes. (Liu, 2008; Gusev et al., 2011) Furthermore, only a few Zn(II) complexes have been used in organic electroluminescent devices with a high brightness of 1000 cd/m2 and photostability. (Tanaka et al., 1998).
When Zn(II) ions are linked to rigid ligands, thermal vibrations are decreased, resulting in improved fluorescence effectiveness. (Yi et al., 2003) Complexes in which metal ions are bridged by rigid bidentate ligands such as bis(oxamate) or bis(N,N-substituted oxamide) have been widely explored for the goal of creating polynuclear species. (Stumpf et al., 1993) These molecules can be incorporated with both homogeneous (Fortea-Pérez et al., 2015) and heterogeneous (Garrido-Barros et al., 2017) catalysts. Some oxamato metal compounds have strong magnetic characteristics (Santana et al., 2008; Rüffer et al., 2007; Juwhari and White (2012)) and can be utilized to study magnetic exchange and magnetic super-exchange processes. (Santana et al., 2004; Abdulmalic et al., 2015; Pardo et al., 2008; Gritzner and Kuta, 1984) Due to the strong basicity of these ligands, complexes of first-row and second-row transition metals with high oxidation states may also be obtained and studied. (Estrada et al., 1998; Li et al., 2004; Ruiz et al., 1997) Biological functions, DNA binding, and other fascinating features have been discovered in transition metal complexes with oxamate ligands. (Li et al., 2004; Ramakrishna et al., 2015; Ramakrishna et al., 2015) The synthesis and characterization of the seven new zinc(II) complexes based on oxamide ligand in combination with an aromatic electron donating and withdrawing discussed herein are part of our ongoing research in the field of coordination chemistry (Taher et al., 2019) (See Scheme 2). The photoluminescence characteristics, molecular orbital electronic structures and the solid state structure of two compounds are reported.![Synthesis of (nBu4N)2[Zn(N-(4-R-phenyloxamide)N‘-(4-nitrophenyloxamide))2] (3). (i) 2 (2 equiv), [nBu4N]OH (4 equiv), diethyl ether, 50 °C, 1 h. (ii) [Zn(OAc)2(H2O)2] (1 equiv), diethyl ether, 50 °C, 1 h. Yields are based on 2.](/content/184/2022/15/12/img/10.1016_j.arabjc.2022.104349-fig2.png)
Synthesis of (nBu4N)2[Zn(N-(4-R-phenyloxamide)N‘-(4-nitrophenyloxamide))2] (3). (i) 2 (2 equiv), [nBu4N]OH (4 equiv), diethyl ether, 50 °C, 1 h. (ii) [Zn(OAc)2(H2O)2] (1 equiv), diethyl ether, 50 °C, 1 h. Yields are based on 2.
2 Experimental
2.1 Materials
Diethyl oxalate, [nBu4N]OH, substituted aniline, and solvents were purchased from commercial suppliers and were used as received.
2.2 Ethyl 4-Nitrooxanilate (1)
4-Nitroaniline (13.80 g, 100 mmol) was added in one portion to 22 mL of diethyl oxalate (23.7 g, 162 mmol,) at room temperature in a variation of the published process. (Chakraborty et al., 2003) The resultant reaction mixture was refluxed overnight, then cooled to room temperature before adding 50 mL of n-hexane. Recrystallization the solid obtained from ethyl acetate/hexane (1:3 v/v) yields compound 1 as a yellow solid precipitated.
Yield 10.5 g (44.1 mmol, 44 % based on 4-nitroaniline). Mp.: 174.0 °C. IR (KBr, cm−1): 3344 (s, νNH), 3127 (w), 3079 (w), 2967 (w), 1731 (s, νCO), 1711 (vs νCO), 1600 (s), 1563 (s), 1510 (vs νNO2), 1373 (s, νNO2), 1301 (s), 1174 (s), 859 (w). 1H NMR (CDCl3, ppm): δ = 9.25 (s, 1H, NH), 8.22 (d, JHH = 9.0 Hz, 2H, CH), 7.83 (d, JHH = 9.0 Hz, 2H, CH), 4.39 (q, JHH = 7.13 Hz, 2H, CH2), 1.38 (t, JHH = 7.13 Hz, 3H, CH3). 13C{1H} NMR (CDCl3, ppm): δ = 160.3 (CO), 154.3 (CO), 144.5 (Ci-CNO2), 142.0 (Ci-CN), 125.2 (CH), 119.7 (CH), 64.2 (CH2), 14.0 (CH3). UV λmax (CH3CN) = 312 nm, ε = 1.4 × 10⁴ Lmol–1cm−1.
2.3 General procedure for synthesis of ligands 2a-e
The suitable aniline (10.5 mmol) was added at room temperature in a single portion to 4-nitro-oxanilate (1) (10.0 mmol, 2.38 g) dissolved in 7 mL of nitrobenzene. The resultant reaction solution was stirred for 7 h at 200 °C, then cooled to room temperature before adding 35 mL of n-hexane, then the supernatant layer was decanted. The residue was washed with n-hexane (35 mL) and cold ethanol (30) mL after. Slow diffusion of ethanol (50 mL) into ethyl acetate solution at 25 °C yielding yellow solids of the title compounds 2a − e. The resultant particles were then washed in n-hexane and dried in vacuum.
2.3.1 N-(4-methylphenyl)-N'-(4-nitrophenyl)-oxamide (2a)
Yield: 1.65 g (5.52 mmol, 55 % based on 1). Mp.: 274.8 °C. IR (KBr, cm−1): 3274 (s, νNH), 3112 (w), 3085 (w), 3042 (w), 2928 (w), 2858 (w), 1672 (vs νCO), 1610 (s), 1593 (s), 1515 (vs νNO2), 1404 (s), 1343 (s, νNO2), 1304 (s), 744 (s). 1H NMR (DMSO‑d6, ppm): δ = 11.33 (s, 1H, NH), 10.78 (s, 1H, NH), 8.24 (d, JHH = 9.00 Hz, 2H, CH), 8.09 (d, JHH = 8.95 Hz, 2H, CH), 7.69 (d, JHH = 8.00 Hz, 2H, CH), 7.15 (d, JHH = 8.15 Hz, 2H, CH), 2.24 (s, 3H, CH3). 13C NMR (DMSO‑d6, ppm): δ = 160.0 (CO), 158.3 (CO), 144.3 (Ci-CN), 143.7 (Ci-CNO2), 135.5 (Ci-CCH3), 134.4 (Ci-CN), 129.7 (CH), 125.2 (CH), 121.0 (CH), 120.9 (CH), 21.0 (CH3). UVλmax (CH3CN) = 314 nm, ε = 2.2 × 10⁴ Lmol-1cm−1. HR-ESI-MS (negative ion mode) m/z: Calcd. for C15H12N3O4 (M − H) 298.08333 found 298.07540.
2.3.2 N- (phenyl)-N'-(4-nitrophenyl)-oxamide (2b)
Yield: 2.01 g (7.05 mmol, 70 % based on 1). Mp.: 255.1 °C. IR (KBr, cm−1): 3314 (vs νNH), 3059 (w), 2933 (w), 1693 (s, νCO), 1668 (vs νCO), 1610 (s), 1596 (s), 1524 (vs νNO2), 1446 (s), 1410 (s), 1343 (s, νNO2), 850 (s), 756 (s). 1H NMR (DMSO‑d6, ppm): δ = 11.36 (s, 1H, NH), 10.86 (s, 1H, NH), 8.23 (d, JHH = 9,05 Hz, 2H, CH), 8.10 (d, JHH = 9.05 Hz, 2H, CH), 7.82 (d, JHH = 8.00 Hz, 2H, CH), 7.34 (t, JHH = 7.70 Hz, 2H, CH), 7.12 (t, JHH = 7.25 Hz, 1H, CH). 13C NMR (DMSO‑d6, ppm): δ = 159.9 (CO), 158.4 (CO), 144.3 (Ci-CN), 143.7 (Ci-CNO2), 138.0 (Ci-CN), 129.2 (CH), 125.2 (two CH), 121.0 (CH), 120.9 (CH). UVλmax (CH3CN) = 311 nm, ε = 1.9 × 10⁴ Lmol-1cm−1. HR-ESI-MS (negative ion mode) m/z: Calcd. for C14H10N3O4 (M − H) 284.06768 found 284.06126.
2.3.3 N-(4-flourophenyl)-N'-(4-nitrophenyl)-oxamide (2c)
Yield: 2.13 g (7.03 mmol, 70 % based on 1). Mp.: 277.3 °C (dec). IR (KBr, cm−1): 3300 (s, νNH), 3120 (w), 3096 (w), 3054 (w), 1699 (s, νCO), 1674 (vs νCO), 1611 (s), 1598 (s), 1526 (vs νNO2), 1407 (s), 1347 (s, νNO2), 1212 (s), 843 (s), 810 (s), 703 (s). 1H NMR (DMSO‑d6, ppm): δ = 11.34 (s, 1H, NH), 10.95 (s, 1H, NH), 8.22 (d, JHH = 9.00 Hz, 2H, CH), 8.09 (d, JHH = 9.00 Hz, 2H, CH), 7.84 (m, 2H, CH), 7.18 (t, JHH,HF = 8.68 Hz, 2H, CH). 13C NMR (DMSO‑d6, ppm): δ = 159.7 (CO), 159.3 (d, JCF = 249.13 Hz, Ci-CF), 158.3 (CO), 144.3 (Ci-CN), 143.7 (Ci-CNO2), 134.4 (Ci-CN), 125.2 (CH), 122.9 (d, JCF = 7.94 Hz, CH), 120.9 (CH), 115.9 (d, JCF = 22.31 Hz, CH). UVλmax (CH3CN) = 311 nm, ε = 1.9 × 10⁴ Lmol-1cm−1. HR-ESI-MS (negative ion mode) m/z: Calcd. for C14H9FN3O4 (M − H) 302.05826 found 302.05127.
2.3.4 N-(4-chlorophenyl)-N'-(4-nitrophenyl)-oxamide (2d)
Yield: 1.05 g (3.28 mmol, 33 % based on 1). Mp.: 292.5 °C. IR (KBr, cm−1): 3317 (vs νNH), 3109 (w), 3080 (w), 1695 (vs νCO), 1677 (vs νCO), 1610 (s), 1577 (s), 1527 (s), 1507 (vs νNO2), 1489 (s), 1410 (s), 1346 (s, νNO2), 826 (s), 784 (s), 750 (s). 1H NMR (DMSO‑d6, ppm): δ = 11.37 (s, 1H, NH), 11.03 (s, 1H, NH), 8.22 (d, JHH = 8.75 Hz, 2H, CH), 8.09 (d, JHH = 8.75 Hz, 2H, CH), 7.85 (d, JHH = 8.45 Hz, 2H, CH), 7.39 (d, JHH = 8.45 Hz, 2H, CH). 13C NMR (DMSO‑d6, ppm): δ = 159.6 (CO), 158.6 (CO), 144.2 (Ci-CN), 143.7 (Ci-CNO2), 137.0 (Ci-CN), 129.2 (Ci-CCl), 129.0 (CH), 125.2 (CH), 122.6 (CH), 120.9 (CH). UVλmax (CH3CN) = 312 nm, ε = 2.4 × 10⁴ Lmol-1cm−1. HR-ESI-MS (negative ion mode) m/z: Calcd. for C14H9ClN3O4 (M − H) 318.02871 found 318.02060.
2.3.5 N-(4-bromophenyl)-N'-(4-nitrophenyl)-oxamide (2e)
Yield: 1.14 g (3.13 mmol, 31 % based on 1). Mp.: 309.7 °C. IR (KBr, cm−1): 3305 (vs νNH), 1669 (vs νCO), 1610 (s), 1592 (s), 1506 (vs νNO2), 1341 (s, νNO2), 823 (s), 778 (s). 1H NMR (DMSO‑d6, ppm): δ = 11.35 (s, 1H, NH), 11.02 (s, 1H, NH), 8.23 (d, JHH = 8.75 Hz, 2H, CH), 8.09 (d, JHH = 8.65 Hz, 2H, CH), 7.80 (d, JHH = 8.40 Hz, 2H, CH), 7.53 (d, JHH = 8.30 Hz, 2H, CH). 13C NMR (DMSO‑d6, ppm): δ = 159.7 (CO), 158.6 (CO), 144.2 (Ci-CN), 143.8 (Ci-CNO2), 137.4 (Ci-CN), 132.1 (CH), 125.2 (CH), 123.0 (CH), 121.0 (CH), 117.2 (Ci-CBr). UVλmax (CH3CN) = 312 nm, ε = 2.3 × 10⁴ Lmol−1cm−1. HR-ESI-MS (negative ion mode) m/z: Calcd. for C14H9BrN3O4 (M − H) 361.97819 found 361.96776.
2.4 General procedure for the preparation of (nBu4N)2[Zn(N-(4-nitrophenyl)-N'-(4-substituted phenyl)oxamate)2] (3a − e)
Solution of [nBu4N]OH (0.65 mL, 1 M in MeOH) was added to suspension of the respective ligands 2a − e (0.300 mmol) in 50 mL diethyl ether. The formed reaction mixture was stirred at reflux temperature for 1 h and then a hot solution (∼50 °C) of [Zn(OAc)2(H2O)2] (0.033 g, 0.15 mmol) in THF (20 mL) was added dropwise with stirring at room temperature. The resulting reaction mixture was stirred at reflux temperature and after 1 h, 80 mL of diethyl ether was added dropwise over 0.5 to 1 h. The mixture was further heated at reflux temperature for 1 h and then was stored at room temperature for at least 24 h. The yellow solid product 3a − e was filtered through glass frit and washed with Et2O (4 × 25 mL) to remove [nBu4N]OAc. The obtained solids were dried in vacuum.
2.4.1 (nBu4N)2[Zn(N-(4-methylphenyl)-N'-(4-nitrophenyl)-oxamate)2] (3a)
Yield: 0.127 g (0.111 mmol, 74 % based on 2a). Mp.: 177.0 °C. Anal. calcd. for C62H94N8O8Zn (1144.85): C, 65.04; H, 8.28; N, 9.79. Found; C, 65.02; H, 8.31; N, 9.71. IR (KBr, cm−1): 2962 (s), 2934 (s), 2874 (s), 1615 (vs νCO), 1601 (s), 1575 (s), 1491 (s, νNO2), 1288 (vs νNO2), 1107 (s), 921 (s). 1H NMR (DMSO‑d6, ppm): δ = 7.90 (d, JHH = 8.00 Hz, 4H, CH), 7.80 (d, JHH = 8.55 Hz, 4H, CH), 7.51 (d, JHH = 7.10 Hz, 4H, CH), 6.81 (d, JHH = 6.75 Hz, 4H, CH), 3.11 (m, 16H, NCH2), 2.08 (s, 6H, CH3), 1.52 (m, 16H, CH2), 1.25 (m, 16H, CH2), 0.87 (t, JHH = 7.30 Hz, 24H, CH3). 13C NMR (DMSO‑d6, ppm): δ = 168.2 (CO), 165.0 (CO), 156.6 (Ci-CN), 146.2 (Ci-CN), 140.4 (Ci-CNO2), 130.0 (Ci-CH3), 129.0 (CH), 124.9 (CH), 122.9 (CH), 122.1 (CH), 58.0 (NCH2), 23.5 (CH2), 19.7 (CH2), 13.9 (CH3). UVλmax (CH3CN) = 391 nm, ε = 4.1 × 10⁴ Lmol−1cm−1.
2.4.2 (nBu4N)2[Zn(N-phenyl-N'-(4-nitrophenyl)-oxamate)2] (3b)
Yield: 0.160 g (0.150 mmol, 95 % based on 2b). Mp.: 168.0 °C. Anal. calcd. for C60H90N8O8Zn (1116.80): C, 64.53; H, 8.12; N, 10.03. Found; C, 64.39; H, 8.04; N, 9.91. IR (KBr, cm−1): 2962 (s), 2933 (s), 2874 (s), 1613 (vs νCO), 1587 (s), 1574 (s), 1487 (s, νNO2), 1376 (s), 1288 (vs νNO2), 1108 (s), 923 (s). 1H NMR (DMSO‑d6, ppm): δ = 7.91 (d, JHH = 9.05 Hz, 4H, CH), 7.81 (d, JHH = 9.05 Hz, 4H, CH), 7.62 (d, JHH = 7.95 Hz, 4H, CH), 7.02 (t, JHH = 7.63 Hz, 4H, CH), 6.71 (t, JHH = 7.10 Hz, 2H, CH), 3.12 (m, 16H, NCH2), 1.52 (m, 16H,CH2), 1.25 (m, 16H, CH2) 0.87 (t, JHH = 7.30 Hz, 24H, CH3). 13C NMR (DMSO‑d6, ppm): δ = 168.1 (CO), 165.5 (CO), 156.6 (Ci-CN), 148.7 (Ci-CN), 140.1 (Ci-CNO2), 128.5 (CH), 124.9 (CH), 123.1 (CH), 122.1 (CH), 121.4 (CH), 58.0 (NCH2), 23.5 (CH2), 19.7 (CH2), 13.9 (CH3). UVλmax (CH3CN) = 386 nm, ε = 3.3 × 10⁴ Lmol-1cm−1.
2.4.3 (nBu4N)2[Zn(N-(4-flourophenyl)-N'-(4-nitrophenyl)-oxamate)2] (3c)
Yield: 0.150 g (0.130 mmol, 87 % based on 2c). Mp: 202.0 °C. Anal. calcd. for C60H88F2N8O8Zn (1152.78): C, 62.51; H, 7.69; N, 9.72. Found; C, 62.42; H, 7.69; N, 9.88. IR (KBr, cm−1): 2963 (s), 2934 (s), 2874 (s), 1607 (vs νCO), 1585 (s, νCO), 1574 (vs), 1501 (s, νNO2), 1490 (s, νNO2), 1285 (vs νNO2), 1108 (s), 920 (s). 1H NMR (DMSO‑d6, ppm): δ = 7.92 (d, JHH = 8.80 Hz, 4H, CH), 7.80 (d, JHH = 8.85 Hz, 4H, CH), 7.61 (br. t, JHH,HF = 6.65 Hz, 4H, CH), 6.85 (t, JHH,HF = 8.60 Hz, 4H, CH), 3.12 (m, 16H, NCH2), 1.52 (m, 16H, CH2), 1.25 (m, 16H, CH2), 0.87 (t, JHH = 7.23 Hz, 24H, CH3). 13C NMR (DMSO‑d6, ppm): δ = 167.9 (CO), 165.2 (CO), 157.3 (d, JCF = 235.11 Hz, Ci-CF), 156.2 (Ci-CN), 145.1 (Ci-CN), 140.2 (Ci-CNO2), 124.9 (CH), 124.0 (d, JCF = 7.24 Hz, CH), 122.1 (CH), 114.9 (d, JCF = 27.14 Hz, CH), 58.0 (NCH2), 23.5 (CH2), 19.7 (CH2), 13.9 (CH3). UVλmax (CH3CN) = 387 nm, ε = 4.6 × 10⁴ Lmol-1cm−1.
2.4.4 (nBu4N)2[Zn(N-(4-chlorophenyl)-N'-(4-nitrophenyl)-oxamate)2] (3d)
Yield: 0.116 g (0.0978 mmol, 65 % based on 2d). Mp.: 251.0 °C. Anal. calcd. for C60H88Cl2N8O8Zn (1185.69): C, 60.78; H, 7.48; N, 9.45. Found; 60.63; H, 7.42; N, 9.62. IR (KBr, cm−1): 2963 (s), 2934 (s), 2873 (s), 1608 (vs νCO), 1574 (vs νCO), 1485 (s, νNO2), 1379 (s), 1320 (s), 1282 (vs νNO2), 1177 (s), 1090 (s), 921 (s). 1H NMR (DMSO‑d6): δ = 7.93 (d, JHH = 7.85 Hz, 4H, CH), 7.78 (d, JHH = 7.75 Hz, 4H, CH), 7.62 (d, JHH = 7.15 Hz, 4H, CH), 7.07 (d, JHH = 7.20 Hz, 4H, CH), 3.12 (br. s, 16H, NCH2), 1.52 (br. s, 16H, CH2), 1.25 (br. d, JHH = 6.80 Hz, 16H, CH2), 0.87 (t, JHH = 6.80 Hz, 24H, CH3). 13C NMR (DMSO‑d6, ppm): δ = 167.5 (CO), 165.5 (CO), 156.2 (Ci-CN), 147.6 (Ci-CN), 140.4 (Ci-CNO2), 128.4 (CH), 124.9 (CH), 124.6 (Ci-CCl), 124.3 (CH), 122.2 (CH), 58.0 (NCH2), 23.5 (CH2), 19.7 (CH2), 13.9 (CH3). UVλmax (CH3CN) = 386 nm, ε = 4.5 × 10⁴ Lmol-1cm−1.
2.4.5 (nBu4N)2[Zn(N-(4-bromophenyl)-N'-(4-nitrophenyl)-oxamate)2] (3e)
Yield: 0.142 g (0.111 mmol, 74 % based on 2e). Mp.: 176.0 °C. Anal. calcd. for C60H88Br2N8O8Zn (1274.59): C, 56.54; H, 6.96; N, 8.79. Found; C, 56.39; H, 6.95; N, 9.01. IR (KBr, cm−1): 2962 (s), 2933 (s), 2872 (s), 1606 (vs νCO), 1574 (s, νCO), 1482 (s, νNO2), 1377 (s), 1320 (s), 1282 (vs νNO2), 1176 (s), 1107 (s), 920 (s). 1H NMR (DMSO‑d6, ppm): δ = 7.92 (d, JHH = 9.05 Hz, 4H, CH), 7.78 (d, JHH = 9.10 Hz, 4H, CH), 7.57 (d, JHH = 8.65 Hz, 4H, CH), 7.19 (d, JHH = 8.65 Hz, 4H, CH), 3.12 (m, 16H, NCH2), 1.52 (m, 16H, CH2), 1.25 (m, 16H, CH2), 0.87 (t, JHH = 7.25 Hz, 24H, CH3). 13C NMR (DMSO‑d6, ppm): δ = 167.5 (CO), 165.5 (CO), 156.2 (Ci-CN), 148.0 (Ci-CN), 140.4 (Ci-CNO2), 131.3 (CH), 125.0 (CH), 124.8 (CH), 122.1 (CH), 112.8 (Ci-CBr), 58.0 (NCH2), 24.5 (CH2), 19.7 (CH2), 13.9 (CH3). UVλmax (CH3CN) = 388 nm, ε = 5.4 × 10⁴ Lmol-1cm−1.
2.5 Instruments
Infrared spectra were collected with a Thermo Nicolet NEXUS 670 FT-IR spectrometer. NMR spectra were recorded using a BrukerAvance III 500 FT NMR spectrometer (1H NMR at 500.303 MHz, 13C{1H} NMR at 125.813 MHz) at ambient temperature. Chemical shifts (δ) are reported in parts per million (ppm) relative to tetramethylsilane using the solvent as internal reference (DMSO: 1H NMR, δ = 2.50 ppm (quintet, JHD = 1.9 Hz); 13C{1H} NMR, δ = 59.52 ppm). Coupling constants (J) are reported in Hertz (Hz) and integrations are reported in number of protons. The following abbreviations are used to describe peak patterns: s = singlet, pt = pseudotriplet, dd = doublet of doublets, m = multiplet. The melting points were determined using a FISHER-JOHNS melting point apparatus. Microanalysis was performed by using a Thermo FLASHEA 1112 Series instrument. Thermogravimetric analyses were performed on a NETZSCH STA 409 PG/PC. A Cary 100 UV–vis spectrophotometer was used to carry out absorption spectra in the 200–900 nm wavelength range. High resolution mass spectra were recorded with a BrukermicrOTOF-QII spectrometer with an Apollo II ESI source. Differential scanning calorimetry were measured on DSC 204 F1 Phoenix from NETZSCH.
2.6 Computational methods
All calculations were performed using ORCA code version 4.2.0. (Neese, 2012; Neese, 2017) Full geometry optimizations of the ligands 2a-e and complexes 3a-e were carried out using the hybrid GGA Perdew, Burke and Ernzerhof (PBE0) functional (Perdew et al., 1996; Adamo and Barone, 1999) and the Ahlrichs triple-zeta def2-TZVP (Weigend and Ahlrichs, 2005) basis set. The effect of the acetonitrile solvent was considered in all geometry optimizations and excited state calculations using the conductor-like polarizable continuum model (CPCM). (Barone and Cossi, 1995) The lowest 20 singlet–singlet vertical electronic excitations based on PBE0 optimized geometries were computed using the Time-Dependent Density Functional Theory (TD-DFT) formalism (Bauernschmitt and Ahlrichs, 1996) in acetonitrile using the CAM-B3LYP functional (Yanai et al., 2004) and the def2-TZVP basis sets. Gabedit program (Allouche, 2011) was used to compute and draw the isosurface densities of the molecular orbitals.
2.7 Crystallography
Single crystals suitable for X-ray structure determination of 3a − 3c were obtained by slow evaporation of an acetonitrile solution containing 3a − 3c at ambient temperature. Crystallographic data for 3a − 3c are summarized in Table S1. Data of 3a − 3c were collected with graphite-monochromated Mo Kα radiation (λ = 0.71073 Å) at 100.01 K with an Oxford Rigaku diffractometer. Data were acquired and processed to give hkl files using CrysAlisPro software. The molecular structures were solved by direct methods and refined by full-matrix least-squares procedures on F2 using SHELXL. All non-hydrogen atoms were refined anisotropically and a riding model was employed in the treatment of the hydrogen atom positions.
3 Result and discussion
3.1 Synthesis
N-(4-R-phenyl)-N'-(4-nitrophenyl)-oxamide (2) (a, R = 4-Me; b, R = H; c, R = 4-F; d, R = 4-Cl; e, R = 4-Br) could be obtained by the reaction of 4-nitrooxanilate (1) with respective 4-substituted aniline in a 1:1 M ratio in nitrobenzene at 190 °C. The desired product N-(4-R-phenyl)-N'-(4-nitrophenyl)-oxamide (2) can be obtained as a yellow solid in moderate yields after appropriate work-up. (Scheme 1, Experimental Part).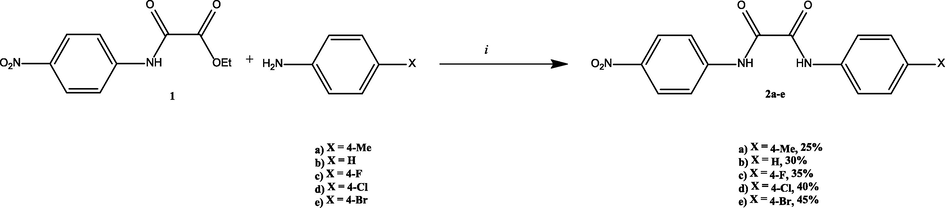
Synthesis of N-(4-R-phenyl)-N'-(4-nitrophenyl)oxamide (2). (i) 1 (1 equiv), 4-substituted aniline (1 equiv), nitrobenzene, 190 °C, 7 h. Yields are based on 1.
The reaction of N-(4-substituted phenyl)-N'-(4-nitrophenyl)-oxamide 2a − e with the [Zn(OAc)2(H2O)2] in a 2:1 M ratio in the presence of 4 equiv. of [nBu4N]OH as methanol solution in diethyl ether at 50 °C yielded coordination complexes (nBu4N)2[Zn((Scheme 1). (Abdulmalic et al., 2015; Taher et al., 2019) After bringing the reaction mixture to room temperature, precipitates were formed. The solid precipitate was then separated using Büchner filtration and washed with diethyl ether to remove [nBu4N][AcO] before being dried in a vacuum to achieve analytically clean samples (Experimental Part).
Compounds 2a–e and complexes 3a–e are soluble in polar solvents including acetonitrile, dichloromethane, chloroform, DMSO and DMF but not in apolar solvents like n-hexane. Furthermore, compounds 2a–e and complexes 3a–g are stable against air and moisture in the solid form as well as in solution.
Compounds 2a–e and complexes 3a–e were characterized by NMR (1H, 13C{1H}) spectroscopies, elemental analysis, and FT-IR (Experimental Section, see the ESI)). The UV–vis was measured and interpreted by DFT and TD-DFT calculations. Single crystal X‐ray diffraction analysis was used to determine the solid state structures of 3a − c. In addition, thermal analyses were performed.
The presence of C⚌O stretching vibrations in the region of 1585–1620 cm−1 is characteristic of complexes 3 in the FT-IR spectra (Fig. S9-15; Supporting information is available online). The vibrations in N-(4-substituted phenyl)-N'-(4-nitrophenyl)-oxamito complexes are shifted to higher wavenumbers as compared to 2 (Fig. S2-8), confirming the coordination of to Zn(II). (Santana et al., 2008; Taher et al., 2004; Taher et al. (2016); Taher et al. (2016), Taher et al. (2017), Taher et al. (2017); Wen et al., 2006; Xia et al., 2016; Piotrkowska et al., 2007; Black David and Neil, 1983; Cotton et al., 2003) FT-IR spectroscopy can be used to monitor the formation of 3 from 2. The deprotonation of the ligand and the production of N-(4-substituted phenyl)-N'-(4-nitrophenyl)-oxamito complexes are supported by the absence of N—H stretching vibrations in the FT-IR of the isolated complexes 3a − e.
The 1H and 13C{1H} NMR spectra of 2a − e and 3a − e are characterized by sets of signals for the various organic groups present in the complex molecule. Very characteristic is the absent of the proton resonance signal of the NH unit appearing at ca. 11 ppm for 2a − e. (Rufino-Felipe et al., 2016; Santana et al., 2008; Wen et al., 2006; Xia et al., 2016; Piotrkowska et al., 2007; Black David and Neil, 1983).
The protons of tetrabutylammonium cation [nBu4N]+ appear as two multiplets at 1.31 and 1.57 ppm for the CH2 protons and as triplet at 0.94 ppm for the CH3 protons. The aromatic protons appear as multiplets between δ 6.69 and 7.92 ppm. The carbonyl carbon (CO) for 3a–e appears at 166 ppm in 13C{1H} NMR.
3.2 Crystal structures
Single crystal X-ray structure analysis was used to determine the structures of 3a − c in the solid state. Slow evaporation of an acetonitrile solution containing 3a − c at room temperature yielded pale yellow plates of 3a − c. Table S1 summarizes the collection and refinement data for 3a − c. Selected bond distances, angles and torsion angles are given in Table 1 and the molecular structures of 3a − c are shown in Fig. 1 Fig. 2 Fig. 3.
3a
3b
3c
R
Me
H
F
bond distances
Zn–N
1.9899(16)– 2.0028(17)
2.029(5) − 1.978(4)
1.978(4) − 2.005(4)
C⚌O
1.227(2)–1.235(2)
1.226(5) − 1.241(6)
1.218(6) − 1.244(6)
bond angles
N–Zn–Nchelate
84.37(7) − 85.31(7)
85.61(14) − 85.39(13)
85.49(19) − 85.78(19)
N–Zn–N
119.49(7)–129.64(7)
129.58(14) − 115.02(14)
119.91(19) − 125.20(18)
plane intersections
NCO···NCO
7.69(15)
2.8(2)2.9(6)
12.7(5)
13.1(5)
24.6(3)3.4(6)
4.5(4)
PNO2···NCO
29.23(13)
13.82(19)1.0(4)
15.5(4)
18.3(3)
17.6(2)18.4(5)
4.6(5)
PR···NCO
32.18(15)
23.28(18)36.5(4)
11.4(4)
21.4(4)
20.4(3)21.5(5)
34.1(4)
PNO2···PR
64.59(10)
31.46(14)35.1(3)
16.8(4)
50.22(18)
62.3(3)5.46(17)
37.3(3)
N2Zn···N2Zn
84.28(6)
84.86(15)
89.67(17)87.4(2)
![ORTEP diagram (50 % probability level) of the molecular structure of 3a with selected atom-numbering scheme. Hydrogen atoms and two [nBu4N]+ counter ions, one molecule of water and CH3/NO2 occupancy disorders of 0.74/0.26 and 0.87/0.13 are omitted for clarity.](/content/184/2022/15/12/img/10.1016_j.arabjc.2022.104349-fig4.png)
ORTEP diagram (50 % probability level) of the molecular structure of 3a with selected atom-numbering scheme. Hydrogen atoms and two [nBu4N]+ counter ions, one molecule of water and CH3/NO2 occupancy disorders of 0.74/0.26 and 0.87/0.13 are omitted for clarity.
![ORTEP diagram (30 % probability level) of the molecular structure of 3b with selected atom-numbering scheme. Hydrogen atoms, two [nBu4N]+ counter ions and a second molecule in the asymmetric unit are omitted for clarity.](/content/184/2022/15/12/img/10.1016_j.arabjc.2022.104349-fig5.png)
ORTEP diagram (30 % probability level) of the molecular structure of 3b with selected atom-numbering scheme. Hydrogen atoms, two [nBu4N]+ counter ions and a second molecule in the asymmetric unit are omitted for clarity.
![ORTEP diagram (20 % probability level) of the molecular structure of 3c with the atom-numbering scheme. Hydrogen atoms and two [nBu4N]+ counter ions are omitted for clarity.](/content/184/2022/15/12/img/10.1016_j.arabjc.2022.104349-fig6.png)
ORTEP diagram (20 % probability level) of the molecular structure of 3c with the atom-numbering scheme. Hydrogen atoms and two [nBu4N]+ counter ions are omitted for clarity.
Compounds 3a − c crystallize in the triclinic space group P–1, containing two crystallographically independent [nBu4N]+ cations and one zincate anion [Zn{X-C6H5-C6H4-NC(O)C(O)N-4-NO2}2]2−.
We could summarize values for 3b by replacing individual values by “from…to” values.
In all complexes, the metal centers have a distorted tetrahedral coordination geometry. Within the chelating ligand entity, N–Zn–N angles are reduced to 84–86°, while angles towards N atoms of other ligands are raised to > 129°. Both ligands, however, are precisely perpendicular to one other, with plane crossings of 84.86(15) to 89.67(17) ° in the N2Zn N2Zn plane. All complexes are near to C2 symmetry due to the asymmetric substitution pattern on both sides of the oxamato ligand.
The different electronic characteristics of the phenyl(ene) groups have little effect on the Zn–N bond lengths in compound 3a − c, which range from 1.978(4) to 2.029(5) Å. The lengths of the Zn–N bonds [Table S2] are comparable to those discovered in oxamato-containing zinc(II) complexes (Rufino-Felipe et al., 2016). The oxamato entities along their C—C bond are slightly twist by up to 7.69(15) ° (3a), 24.6(3) ° (3b), and 4.5(4)° (3c). The N-bonded phenylene groups are also rotated somewhat out of the N—C(O) planarity, with torsion angles ranging between 1.0(4) and 36.5(4) °, resulting in phenylene···phenylene plane intersections of up to 62.3(3).
The organic tetra-n-butylammonium cations in 3a − c have the predicted tetrahedral geometry around the nitrogen atom, as well as the expected bond lengths and angles. (Abdulmalic et al., 2015).
The additional molecules of water in the asymmetric unit of 3a connects to oxamato oxygens of two molecules, resulting in a dimeric species that involves 14 atoms (Fig. 4).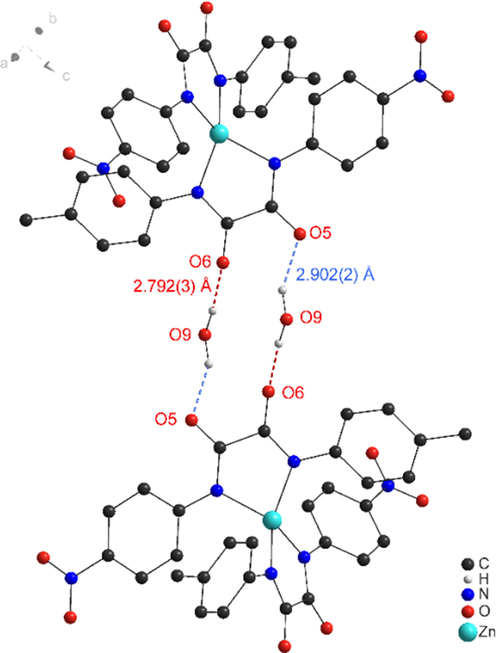
Hydrogen bond pattern in the packing of 3c (Ball-and-Stick representation). Bond properties (Å): O9···O5 2.902(2) (blue), O9···O6 2.792(3) (red), O9–H···O5 157(3), O9–H···O6 173(3), Symmetry operation –x, 1–y, 1–z.
3.3 Hirshfeld surfaces
The Hirshfeld surfaces for compounds 2a and 2c and their associated 2D fingerprint plots were generated using CrystalExplorer17.5 (Turner et al., 2017; Taher et al., 2018) program and were analyzed to verify the important intermolecular interactions. The percentage values of Hirshfeld surface contacts for all types of atoms (>1 %) in the structures of complexes 2a and 2c are summarized in Table 2.
Contacts
% of total Hirshfeld surface
2a
2c
O⋯H
36.0
20.4
F⋯H
–
15.1
O⋯O
8.6
21.6
H⋯H
42.9
15.9
O⋯C
4.2
–
F⋯O
–
7.9
F⋯C
–
2.1
C⋯H
4.9
11.8
N⋯H
1.4
1.6
The Hirshfeld surfaces were mapped over the normalized contact distance (dnorm), which is defined in terms of de, di, and the vdW radii of the atoms, where de and di are the distances from a point on the surface to the nearest atom outside (external) and inside (internal), respectively. The Hirshfeld surface colors are used to visualize the inter-atomic contacts as: longer than vdW contacts (blue), equal to vdW (white), and shorter than vdW (red). The colors of the points on the 2-D fingerprint plots correspond to the frequency of the de and di combinations on the Hirshfeld surface, where red represents larger fraction or contribution and green to blue represent moderate to small contributions, respectively. (Taher et al. (2018); Tan et al., 2019).
The Hirshfeld surfaces of 2a mapped over dnorm are shown in Fig. 5. The red spots denoted A are associated with O⋯H (carbonyl O and coordinated H2O H) interactions, while the faint red spots (denoted B) are associated with O⋯O (nitro-nitro) interactions. The two types of interactions are also observed in the corresponding 2-D fingerprint plots. Fig. 6 (b) shows a pair of peaks representing the O⋯H/H⋯O interactions (36.0 % of total Hirshfeld surface) at (de + di) ≈ 2.4 Å, which is less than the sum of the corresponding vdW radii (Bondi, 1964) (O = 1.52 Å, H = 1.20 Å, ƩO,H = 2.72 Å) and Fig. 6 (d) shows a tip representing O⋯O interactions (8.6 % of total Hirshfeld surface), where the tip occurs at (de + di) ≈ 2.7 Å, which is less than the sum of the corresponding vdW radii (O = 1.52 Å). The full 2-D fingerprint for 2a and the decomposed contacts representing: (b) O⋯H/H⋯O (36.0 %), (c) H⋯H (42.9 %), (d) O⋯O (8.6 %), (e) O⋯C/C⋯O (4.2 %), (f) C⋯H/H⋯C (4.9 %), and (g) N⋯H/H⋯N (1.4 %), intermolecular interactions are shown in Fig. 6. The 2-D plots confirm the contribution of O⋯H interactions in the formation of dimeric species, vide supra.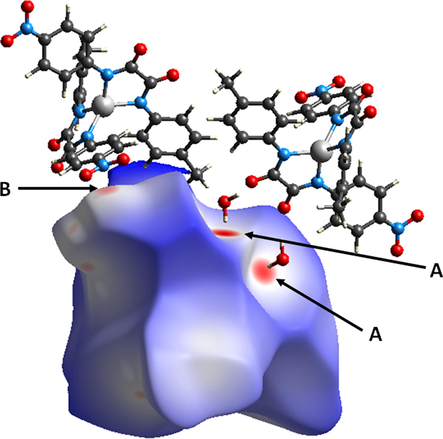
Hirshfeld surface of 2a mapped with dnorm over the default range showing neighboring molecules associated with close contacts where red spots denoted A are associated with O⋯H (carbonyl O and coordinated H2O H) interactions, and B faint red spots are associated with O⋯O (nitro-nitro) interactions.
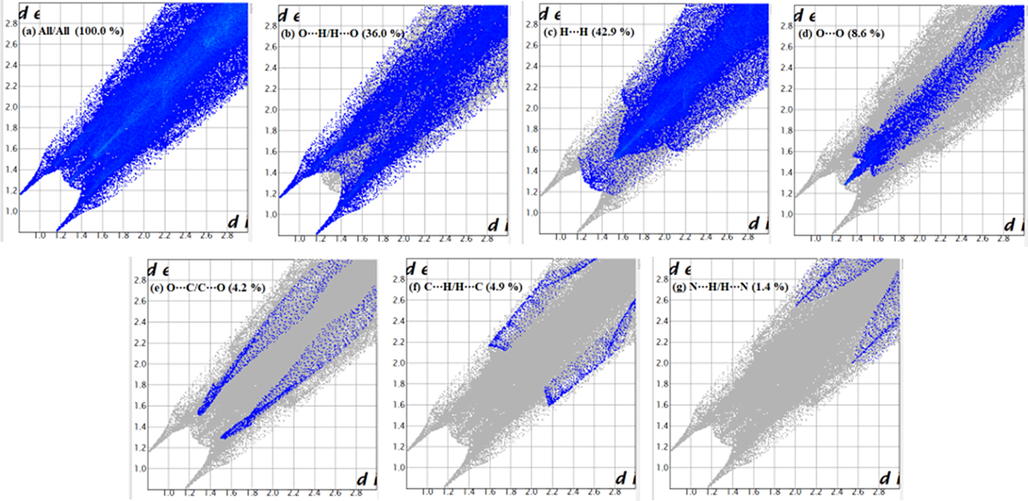
Full 2-D fingerprint plot for 2a (a) and the decomposed contacts representing (b) O⋯H/H⋯O (36.0 %), (c) H⋯H (42.9 %), (d) O⋯O (8.6 %), (e) O⋯C/C⋯O (4.2 %), (f) C⋯H/H⋯C (4.9 %), and (g) N⋯H/H⋯N (1.4 %), intermolecular interactions.
Similarly, the Hirshfeld surfaces of 2c mapped over dnorm are shown in Fig. 7, where the red spots denoted A are associated with F⋯H (H ortho to NO2) interactions. The interactions are also observed in the corresponding 2-D fingerprint plots; Fig. 8 (b) shows a pair of peaks representing the F⋯H/H⋯F interactions (15.1 % of total Hirshfeld surface) at (de + di) ≈ 2.3 Å, which is less than the sum of the corresponding vdW radii (F = 1.47 Å, H = 1.20 Å, ƩF,H = 2.67 Å). The full 2-D fingerprint for 2c and the decomposed contacts representing: (b) F⋯H/H⋯F (15.1 %), (c) F⋯C/C⋯F (2.1 %), (d) H⋯H (15.9 %), (e) C⋯H/H⋯C (11.8 %), (f) O⋯H/H⋯O (20.4 %), (g) O⋯O (21.6 %), and (h) F⋯O/O⋯F (7.9 %), intermolecular interactions are shown in Fig. 8.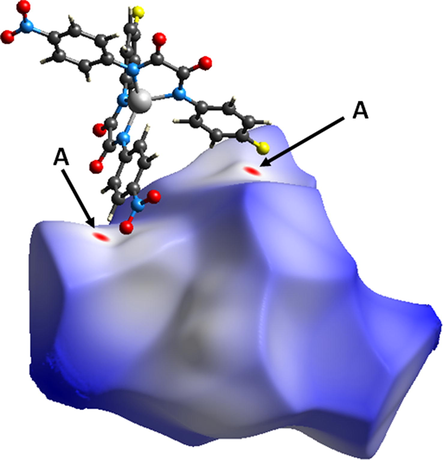
Hirshfeld surface of 2c mapped with dnorm over the default range showing neighboring molecules associated with close contacts where red spots denoted A are associated with F⋯H interactions.
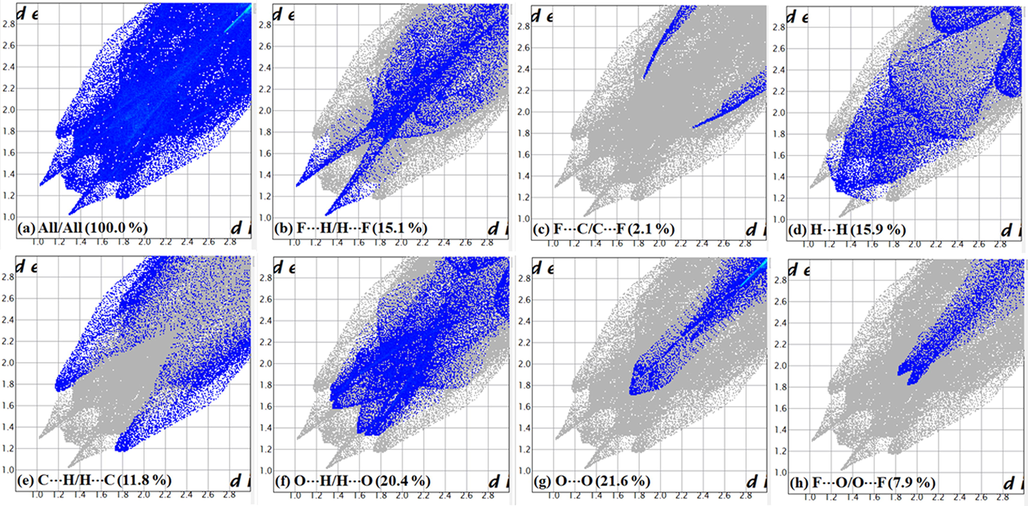
Full 2-D fingerprint plot for 2c (a) and the decomposed contacts representing (b) F⋯H/H⋯F (15.1 %), (c) F⋯C/C⋯F (2.1 %), (d) H⋯H (15.9 %), (e) C⋯H/H⋯C (11.8 %), (f) O⋯H/H⋯O (20.4 %), (g) O⋯O (21.6 %), and (h) F⋯O/O⋯F (7.9 %), intermolecular interactions.
3.4 DFT calculations and electronic structures
The vertical excitation energies of oxamate-based compounds 3a − e and oxamide ligands 2a − e were computed using time-dependent (TD)-DFT to better understand their electronic characteristics. Table S6 in the SI contain the electronic transitions that were obtained.
The calculated geometry of three complexes, namely 3a, 3b and 3c, are compared with that obtained experimentally using X-ray in Tables S2, S3 and S4, respectively in the SI. It is found that the calculated geometry parameters, i.e., bond lengths an angles, reproduce very well the X-ray crystal structure data.
The calculated absolute energies of the frontier orbitals of the ligands 2a-e and complexes 3a-e together with the HOMO-LUMO energy gap values are summarized in Table S5 and depicted in Fig. 9. It is noted that there is no significant change in the HOMO and LUMO orbital energies. Consequently, the HOMO-LUMO gap values are not significantly affected as function of the substituent. It is also worth to notice that the orbital energies of the HOMO-1 orbitals are very close in energy to that of HOMO. The same is also true for LUMO and LUMO + 1 orbital energies (Table S5).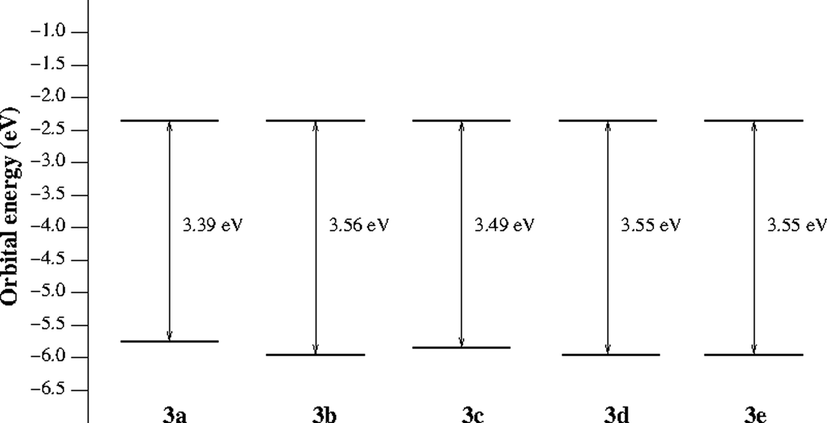
Calculated HOMO and LUMO energies (eV) of complexes 3a − e, and HOMO-LUMO gap.
The frontier molecular orbitals (HOMO-1, HOMO, LUMO and LUMO + 1) for complexes 3a − e are shown in Figures S34-38 in SI. In general, for compounds 3a − e, HOMO-1 and HOMO orbitals are mainly present on the two phenyl rings bearing the 4-substituent and the lone pair of the nitrogen atoms connected to the zinc atom, while LUMO and LUMO + 1 orbitals are mainly present on the two nitro groups. (Taher et al., 2019) However, it worth to mention that the Zn orbitals are not contributing to the frontier orbitals of all complexes.
The solution UV–vis spectra of the ligands 2a − e and complexes 3a − e were measured in acetonitrile. All the ligands and complexes display-one intense absorption band in the UV–Vis region between 296 and 368 nm (Table S6). To assign this band, TD-DFT calculations on the optimized geometries of the complexes were performed. The calculate and experimental spectra (λmax) of ligands 2a − e and complexes 3a − e are in very good agreement (Table S6). The most significant transitions for all ligands are HOMO to LUMO + 1 transitions. While the most significant transitions for most complexes are from HOMO-1 to LUMO, except for complex 3b were the transition is found to be HOMO to LUMO. It is useful to recall, however, that the orbital energies of HOMO and HOMO-1 are very close in energy. In fact, the unaffected values of the orbital energies and consequently in the electronic gap (HOMO-LUMO gap) explains perfectly the unaffected values of the λmax of absorption and fluorescence in all complexes investigated in this study. (Duvenhage et al., 2014) Finally, the main absorption bands in complexes 3a − e are assigned to assigned as ligand to ligand charge transfer (LLCT) of π → π* character which is, in fact, expected since all zinc 3d orbitals are fully occupied and cannot therefore participate in any low-laying electronic transition. (Chen et al., 2007).
3.5 Optical analysis (Luminescence)
Zn(II) complexes' photoluminescent capabilities have drawn a lot of attention because of the possibility of using them in photochemistry, chemical sensors, and electroluminescent displays. (Wu et al., 2017) Excitation and photoluminescence characteristic spectra of 3a–e were recorded at room temperature with Cary Eclipse (Varian) Spectrofluorometer using solid state powder samples. All emission bands were stimulated at 337 nm while all excitation and emission bandpass-slits were kept open at 2.5 nm and 5.0 nm, respectively for comparison reasons. Measurements were carried out with the intension to acquire more insight on the effect of different electron withdrawing and/or donating groups in tuning the optoelectronic properties. Complexes 3a − e exhibited characteristic luminescence as broad emission peaks extending from the blue region to the orange region (450–600 nm) with a maximum at about ∼ 500 nm in the cyan region.
Fig. 10 reveals a rather interesting results when considering complex 3a as the none halide matrix with low emission intensity, it seems that the relative emissions of complexes 3b-e increased as a function of substituent atomic number from H to F to Cl before it suddenly quenches back at Br in a phenomenon similar to that of the dopants concentration quenching of luminescent materials. It seems that as if the size of the attached ions influencing the local environment surrounding the attached H or halides anions and hence the intensity of the emission bands but not their broad nature or wavelength location nor their overall color even though some shoulders became more pronounced in the excitations and emissions spectra especially of those of 3b and 3c complexes in addition to the presence of somehow measureable emission tail in the blue region. Furthermore, Fig. 10b shows the details of the excitation and emission spectra of 3a compound. Overall, the tendency of the emission enhancement as a function of the atomic number may consolidate a structural argument, an effective energy transfers probabilities, and/or variable decay rates. More detailed studies on this particular issue would be necessary to clearly explain the emission dynamics. Nevertheless, the broad emission peaks usually result from several mechanisms controlled by the distribution of the Zn cations relative to their oxygen neighbors as influenced by their complex local environment. (Juwhari et al., 2017).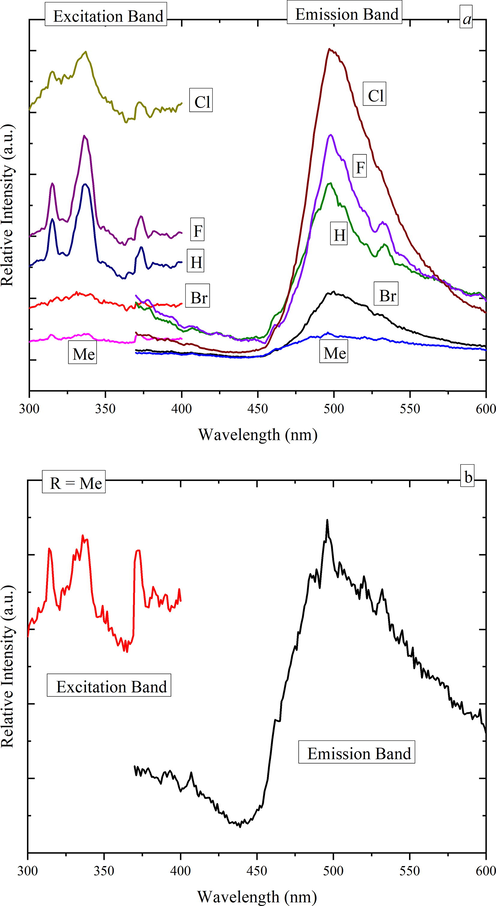
In Fig. 10a, Excitation and photoluminescence spectra of 3a − e solid samples registered at room temperature. Excitation and emission bandpass slits were kept open at 2.5 nm, and 5.0 nm, respectively for all samples for comparison reasons. Fig. 10b shows exploded details of excitation and photoluminescence of 3a Compound.
The chromaticity coordinates of the complexes were calculated based on the emission spectra and placed as points on the diagram of the CIE 1931 as shown in Fig. 11. It is worth mentioning here that the coordinates of the white-point are (0.333, 0.333). Based on this procedure, it is found that the color of these complexes lie in the green region with xy-chromaticity coordinates given in Table 3. It is obvious that the more intense the luminescence the more the complex coordinates are shifting towards the green region of the diagram with complexes 3a and 3b being almost having the same coordinates dictated either by its low intense emission as in 3a or by its noticeable emission tail in the blue as in 3b.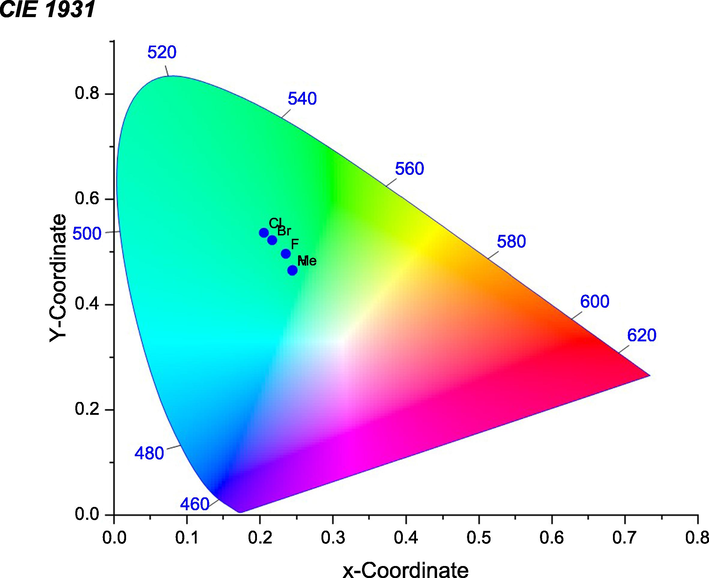
CIE chromaticity diagrams of complexes 3a − e.
Complex
x-coordinate
y-coordinate
3a (R = Me)
0.244436
0.464558
3b (R = H)
0.244985
0.465230
3c (R = F)
0.235478
0.496129
3d (R = Cl)
0.205536
0.536174
3e (R = Br)
0.216918
0.521973
3.6 Thermal analyses (TGA and DSC)
The thermal stability of complexes 3a − e under nitrogen flow was determined using thermogravimetric analysis (TGA) and differential scanning calorimetric (DSC) analysis. Figs. 12 and 13 show the TGA and DSC curves for complex 3a − e, respectively. Figure S41-S50 shows TGA and DTGA thermograms.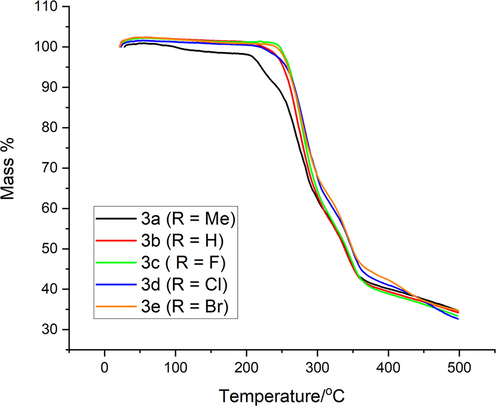
TGA results for compounds 3a − e.
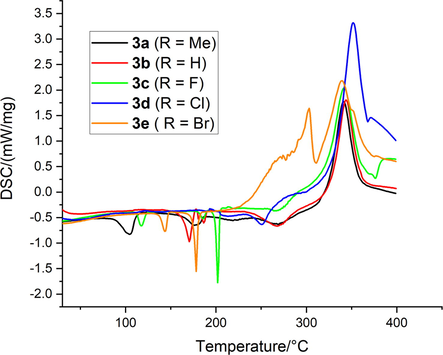
DSC results for compounds 3a − e.
Within the temperature range of 25–500 °C, the TGA data for all Zn(II) complexes (Fig. 11) revealed three decomposition steps, as reported in Table 4. All complexes had similar TGA profiles, with just minor changes in weight loss for each decomposition event. The first modest disintegration occurred in the temperature range of 25–240 °C, accompanied by a loss of water (lattice or coordinate), presumably due to water absorption from the environment (all complexes 1 wt% except 3a less than 2.54 wt%). The second big decomposition steps, which account for the volatilization and decomposition of the organic moiety in the complexes, take place in the temperature ranges of 240–360 and 360–500 °C. Sharp decomposition results in 60–73 percent weight loss for all complexes in this temperature range, with 3d being the greatest and 3a being the lowest. The creation of zinc oxide complexes is responsible for the ash left behind after the breakdown process and the organic loss of complexes.
Compound
25–240 °C
240–360 °C
360–500 °C
%Ash
3a
2.54
53.82
9.03
34.79
3b
0.44
57.42
8.22
34.13
3c
0.21
57.91
8.64
33.26
3d
0.00
53.60
11.72
34.77
3e
0.00
54.17
11.06
34.77
The results of the DSC measurements for the 3a − e complexes are given in Fig. 13. These curves showed endothermic and exothermic peaks divided into four (3a, 3e) and five (3b, 3c, 3d) stages. The peaks appear in the temperatures less than 375 °C were endothermic in nature (DSC curve decrease), whereas the peak appear above 290 °C were exothermic (DSC curve increase). The first two and three thermal decomposition endothermic peaks were mainly due to loss of lattice water and volatilization of the organic matter part due to solid–solid and solid–liquid phase transitions in the complexes. This is in a good agreement with the decomposition stages identified in the TGA results. The first small endothermic peak was observed at around 100–155 °C for complexes 3a, 3c, 3d and 3e which might be due to the loss of lattice water. The second endothermic peak was very sharp and intense between 160 and 205 °C noticed for all complexes which were mainly due to the decomposition of the organic part of the anhydrous compounds and/or the melting point of the complexes. The order of the thermal stability of these compounds were mainly depends on the strength of the coordination bond between the metal and ligands. It was observed that the order of the thermal stability of the anhydrous complexes were in the following order: 3c > 3d > 3e > 3a ∼ 3b. The third small-broad endothermic peak was observed at around 240–280 °C for all complexes. An exothermic peak in the DSc curve centered at around 330 °C for compounds 3a-3c, moreover, two exothermic peaks in the DSc curve centered at around 330 °C and 361 °C are appeared for compound 3d, while compound 3e shows two exothermic peaks in the DSc curve centered at around 292 °C and 327 °C. This is probably due to the pyrolysis reaction of the complex and the formation of gaseous compounds or due to carbonization material formed during the decomposition reactions.
Finally, due to dehydration, decomposition of organic matter, and melting of the complexes, the decomposition phases of the complexes are endothermic, followed by a high intensity exothermic stage due to the release of gaseous compounds in the pyrolysis processes. It should be noted that the strong solid state interactions between the ligands and the metal were responsible for the complexes' good thermal stability behavior, as seen by the TGA and DSC curves.
4 Conclusion
Five complexes of the general type (nBu4N)2[Zn(N-(4-R-phenyl)-N'-(4-nitrophenyl)oxamate)2] (a, R = 4-Me; b, R = H; c, R = 4-F; d, R = 4-Cl; e, R = 4-Br) have been prepared by the reaction of 4 equivalents of [nBu4N]OH in methanol with one equivalent of [Zn(OAc)2(H2O)2] in THF and two equivalents of the corresponding substituted N-(4-R-phenyl)-N'-(4-nitrophenyl)oxamide (1) (a, R = 4-Me; b, R = H; c, R = 4-F; d, R = 4-Cl; e, R = 4-Br). Compounds 3a − e were characterized by spectroscopic methods and X-ray structure analysis (3a − c) with DFT calculations. Solid state structure analysis for 3a − c show the zinc (II) ion is four-coordinate with two ethanediamide-nitrogen atoms from two bidentate N,N-disubstituted oxamate ligands at each metal center. The DFT calculations show that the HOMO and LUMO are mainly located on the ligands and the Zn orbitals are neither contributing to the HOMO nor to the LUMO. The electronic spectra of the complexes 3a − e showed a single band and was assigned to LLCT, π → π* transitions based on TD-DFT calculation. The Optical analyses for ligands 2a − e show or very weak emission band in the visible region, while for their Zn(II) complexes the emission is blue shifted compared to ligands with enhanced emission intensity. Moreover, thermogravimetric analysis (TGA) indicates five complexes have excellent thermal stability.
Acknowledgement
The authors greatly appreciate and acknowledge all sorts of financial support received from The University of Jordan. We are grateful to the alexander von humboldt foundation for a visiting fellowship of Sultan T Abu-Orabi.
Declaration of Competing Interest
The authors declare that they have no known competing financial interests or personal relationships that could have appeared to influence the work reported in this paper.
References
- Dalton Trans.. 2015;44:8062.
- J. Coord. Chem.. 2022;75:781-795.
- J. Chem. Phys.. 1999;110:6158-6170.
- J. Chem. Cryst.. 2016;46:411.
- J. Comput. Chem.. 2011;32:174.
- J. Phys. Chem. A. 1995;1998:102.
- Chem. Phys. Lett.. 1996;256:454.
- S. C. Black David E. Neil, Aust. J. Chem. 36 (1983) 1141.
- J. Phys. Chem.. 1964;68:441-451.
- Agric. Food Chem.. 2003;51(4):992.
- New J. Chem.. 2001;25:63.
- J. Lumines.. 2007;126:81.
- J. Am. Chem. Soc.. 2003;125:13564.
- Phys. B: Condens. Matter. 2014;439:46.
- Tetrahedron Lett.. 1998;39:2869.
- Inorg. Chem. Front.. 2015;2:1029.
- J. Am. Chem. Soc.. 2017;139:12907.
- Pure Appl. Chem.. 1984;56:461.
- A. N. Gusev, V. F. Shul’gin, O. V. Konnic, S. B. Meshkova, G. G. Aleksandrov, M. A. Kiskin, I. L. Eremenko, W. Linert, Inorg. Chim. Acta 376 (2011) 509.
- (a) M.J. Jurow, C. Mayr, T.D. Schmidt, T. Lampe, P.I. Djurovich, W. Brutting, M.E. Thompson, Nat. Mater. 15 (2016) 85–91. (b) Y. Liu, X. Chen, Y. Lv, S. Chen, J.-W.Y. Lam, F. Mahtab, H.S. Kwok, X. Tao, B.Z. Tang, Chem. Eur. J. 18 (2012) 9929–9938. (c) J. Yang, J. Huang, Q. Li, Z. Li, J. Mater. Chem. C. 4 (2016) 2663–2684. (d) G. Zhou, X. Yang, W.-Y. Wong, Q. Wang, S. Suo, D. Ma, J. Feng, L. Wang, ChemPhysChem 12 (2011) 2836–2843. (e) A. A. Abu-Yamin, D. Taher, M. Korb, K. Al Khalyfeh, Z. Ishtaiwi, H. K. Juwhari, H. Amarne, S. Mahmood, R. Loloee, Y. A. YouSef, A. Ghazzy, H. Lang, Polyhedron, (2022) 222, 115906.
- Mater. Lett.. 2012;88:16-18.
- Int J. Hydrogen Energy. 2017;42:17741.
- (a) N. Koch, Chem. Phys. Chem. 8 (2007) 1438–1455. (b) G. Cheng, G.K.-M. So, W.-P. To, Y. Chen, C.-C. Kwok, C. Ma, X. Guan, X. Chang, W.- M. Kwok, C.-M. Che, Chem. Sci. 6 (2015) 4623–4635. (c) G.M. Farinola, R. Ragni, Chem. Soc. Rev. 40 (2011) 3467–3482.
- Chem. Mater.. 1996;8:541.
- Z. Naturforsch. B. 2004;59:757.
- Z-Y, Liu, X-G, Wang, E-C, Yang, X-J, Zhao, Z. Anorg. Allg. Chem. 634 (2008) 1807.
- Software update: the ORCA program system, version 4.0. WIREs Comput. Mol. Sci.. 2017;8:e1327.
- [Google Scholar]
- Dalton Trans. 2008:2780.
- Generalized gradient approximation made simple. Phys. Rev. Lett.. 1996;77:3865-3868.
- [Google Scholar]
- B. Piotrkowska, M. Gdaniec, , M. J. Milewskaa, T., Połoński, Cryst. Eng. Comm., 9 (2007) 868.
- J. Organomet. Chem.. 2015;791:322.
- Dalton Trans.. 2015;44:17629.
- (a) S. Reineke, F. Lindner, G. Schwartz, N. Seidler, K. Walzer, B. Lussem, K. Leo, Nature 459 (2009) 234–238. (b) Y. Lin, H. Fan, Y. Li, X. Zhan, Adv. Mater. 24 (2012) 3087–3106. (c) T.-H. Han, Y. Lee, M.-R. Choi, S.-H. Woo, S.-H. Bae, B.H. Hong, J.-H. Ahn, T.-W. Lee, Nat. Photonics 6 (2012) 105–110. (d) A.P. Kulkarni, X. Kong, S.A. Jenekhe, Adv. Funct. Mater. 16 (2006) 1057–1066.
- Inorg. Chim. Acta. 2007;360:3777.
- E. Rufino-Felipe, J. Caballero-Jiménez, L-G Guerrero-Ramírez, M. Flores-Álamo, M-Á Muñoz- Hernández, Inorg. Chem. Comm., 63 (2016) 107.
- Chem. Mater.. 1997;9:201.
- D. M. Santana, G. Garcia, C. Vicente-Hernandez, L. Garcia, J. Perez, T. Teofilo Rojo, L. Lezama, J. Organomet. Chem. 693 (2008) 2009.
- Inorg. Chem.. 2004;43:2132.
- J. Organomet. Chem.. 2008;693:2009.
- J. Am. Chem. Soc.. 2002;124:6119.
- J. Am. Chem. Soc.. 1993;115:6738.
- Inorg. Chem. Commun.. 2004;7(9):1006-1009.
- Inorg. Chem. Commun.. 2016;821:136-141.
- J. Organomet. Chem.. 2016;821:136-141.
- J. Organomet. Chem.. 2017;847:59-67.
- J. Organomet. Chem.. 2017;845:55-62.
- a) D. Taher, S. Klaib, T. Stein, M. Korb, G. Rheinwald, A. Ghazzy, H. Lang, Polyhedron, 148 (2018) 70–75. (b) A. Ghazzy, D. Taher, W. Helal, M. Korb, K. Khalyfeh, F. F Awwadi, R. K Al-Shewiki, S. Weheabby, N. Al-Said, S. T Abu-Orabi, H. Lang, Arabian Journal of Chemistry, 13 (2020), 3546-3557. (c) D. Taher, S. Klaib, F. F Awwadi, W. Helal, M. Gharaibeh, G. Rheinwald, T. Rüffer, H. Lang, Inorganica Chimica Acta, 477 (2018), 270-276. (d) A. Ghazzy, D. Taher, M. Korb, K. Al Khalyfeh, W. Helal, H. Amarne, T. Rüffer, Z. Ishtaiwi, Heinrich Lang. Inorganics, (2022) 10, 96. (e) K. Al Khalyfeh, D. Taher, W. Helal, M. Korb, I. Hamadneh, A. Al-Dujaili, A. Imraish, H. M Hammad, R. M. Al-As’ad, S. T Abu-Orabi, A. Hildebrandt, H. Lang. Journal of Chemical Sciences. (2020) 131, 1-16. (f) H. Lang, K. Roessler, D. Taher, R. Holze, B. Walfort. Inorganica Chimica Acta. (2008) 361(6), 1659-1667.
- Inorg. Chim. Acta. 2019;487:409-418.
- Acta Cryst.. 2019;E75:308-318.
- (a) Tanaka, H.; Tokito, S.; Taga, Y.; Okada, J. Mater. Chem. 1998, 8, 1999−2003. (b) Wang, S. Coord. Chem. Rev. 2001, 215, 79−98. (c) Evans, R. C.; Douglas, P.; Winscom, C. J. Coord. Chem. Rev. 2006, 250, 2093−2126. (d) Xu, H.; Chen, R.; Sun, Q.; Lai, W.; Su, Q.; Huang, W.; Liu, X. Chem. Soc. Rev. 2014, 43, 3259−3302.
- Turner, M. J., McKinnon, J. J., Wolff, S. K., Grimwood, D. J., Spackman, P. R., Jayatilaka, D. & Spackman, M. A. (2017). CrystalExplorer17. University of Western Australia. http://hirshfeldsurface.net.
- Coord. Chem. Rev.. 2001;215:79.
- Phys. Chem. Chem. Phys.. 2005;7:3297.
- Acta Cryst. E. 2006;62:3780.
- (a) Y. Wu, J. Wu, Z.D. Luo, J. Wang, Y.L. Li, Y.Y. Han, J.Q. Liu, RSC Adv. 7 (2017) 10415e10423. (b) X.X. Zhao, S.L. Wang, L.Y. Zhang, S.Y. Liu, G.Z. Yuan, Inorg. Chem. 58 (2019) 2444e2453. (c) S.G. Roh, Y.H. Kim, K.D. Seo, D.H. Lee, H.K. Kim, Y.I. Park, J.W. Park, J.H. Lee, Adv. Funct. Mater. 19 (2009) 1663e1671.
- Inorg. Chem.. 2000;39:5248.
- J. Am. Chem. Soc.. 2016;138:13493.
- Chem. Phys. Lett.. 2004;393:51.
- J. Inorg. Organomet. Polym.. 2013;23:1492.
Appendix A
Supplementary material
Crystallographic data (excluding structure factors) have been deposited with the Cambridge Crystallographic Data Centre as supplementary publication CCDC- 2,098,745 for 3a, CCDC- 2,098,745 for 3b and CCDC- 2,098,746 for 3c. Copies of the data can be obtained free of charge on application to CCDC, 12 Union Road, Cambridge CB2 1EZ, UK [E- mail: deposit@ccdc.cam.ac.uk]. Supplementary data to this article can be found online at https://doi.org/10.1016/j.arabjc.2022.104349.
Appendix A
Supplementary material
The following are the Supplementary data to this article:Supplementary data 1
Supplementary data 1
Supplementary data 2
Supplementary data 2
Supplementary data 3
Supplementary data 3
Supplementary data 4
Supplementary data 4
Supplementary data 5
Supplementary data 5
Supplementary data 6
Supplementary data 6
Supplementary data 7
Supplementary data 7


