

Translate this page into:
Synthesis and application of Au NPs-chitosan nanocomposite in the treatment of acute myeloid leukemia in vitro and in vivo
⁎Corresponding author. wenlizuoyy@sina.com (Wenli Zuo)
-
Received: ,
Accepted: ,
This article was originally published by Elsevier and was migrated to Scientific Scholar after the change of Publisher.
Abstract
Abstract
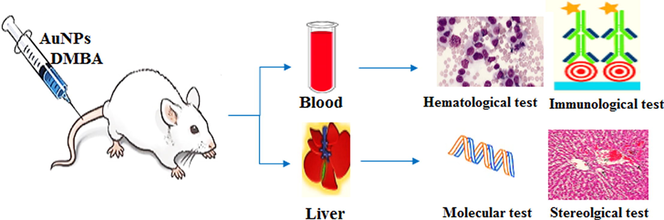
In recent days, novel biomolecule stabilized nanocomposites have come into prominence as featured next generation materials. In this article we have green synthesized Au nanoparticles being deposited and stabilized over chitosan (CS) molecules. The electron rich polar functional groups of chitosan have been exploited to cap the Au NPs. The structural and physical features of Au NPs-CS nanocomposite was analyzed with different techniques like Ultraviolet–Visible Spectroscopy, Fourier Transform Infrared Spectroscopy, Field Emission Scanning Electron Microscope, Transmission Electron Microscopy, and Energy-Dispersive X-Ray Spectroscopy techniques. Recently, noble metal nanoparticles have been used in the treatment of different cancers. This has prompted us to use our nanocomposite in the treatment of acute myeloid leukemia (AML) both in vitro and in vivo. Initially, 2,2-diphenyl-1-picrylhydrazyl (DPPH) radical scavenging assay was performed to study the excellent antioxidant properties of Au NPs-CS nanocomposite. For in vitro cytotoxicity studies, HUVEC normal cell line, 32D-FLT3-ITD and Murine C1498 cancer cell lines were used and the nanocomposite was found of comparable potential as the standard AML drug Daunorubicin. For in vivo studies, 7,12-Dimethylbenz[a]anthracene (DMBA) was injected for inducing AML over 50 mice and then the drug as well as the nanocomposite was administered. Subsequently, comparison of different immunological, hematological, biochemical, stereological parameters and S1PR1 and S1PR5 mRNA expressions were ascertained. By quantitative real-time polymerase chain reaction, S1PR1 and S1PR5 mRNA expression in lymphocytes were significantly (p ≤ 0.05) raised by treating the leukemic mice with the nanocomposite. Also, nanocomposite significantly (p ≤ 0.05) decreased the weight and volume of liver and spleen, the pro-inflammatory cytokines, and the total white blood cells, blast, neutrophil, monocyte, eosinophil, and basophil counts, increased the anti-inflammatory cytokines and the lymphocyte, platelet and red blood cells parameters, and regulated the biochemical parameters as compared to the untreated mice. An extensive study was done on these biological experiments using the Au NPs-CS nanocomposite and we achieved fascinating results such that it could be used as an alternative prospective chemotherapeutic drug for the treatment of acute myeloid leukemia.
Keywords
Gold nanoparticles
Chitosan
Acute myeloid leukemia
Chemotherapeutic drug
Daunorubicin
Leukemic mouse model

1 Introduction
Since the last few decades, the population explosion and concomitted industrial development has caused significant negative impact on the cleanliness of our environment. In particular, water pollution has reached such a threshold position which is a serious threat to humanity (Ilin et al., 2016; Wang and Wu, 2012). Several industries like pharmaceuticals and textiles and are throwing their wastes and garbage, especially the unquenched dyes, pigments and drugs, directly into the river streams (Hitam and Jalil, 2020; Deblonde et al., 2011; Wang and Wang, 2018; Gupta, 2009; Jalil et al., 2013). Even at a very low concentration, these dyes are highly diffusible into water which obstructs the penetration of sunlight. This causes oxygen scarcity in water resulting in the disruption of marine ecosystem. In addition, the organic dyes enhance the photocatalytic oxidation of water and makes water rancid (Lai et al., 2019; Najafinejad et al., 2018; Naseem et al., 2018). This is a serious reason towards the decrease in potable water worldwide as well. Thus, wastewater treatment has been a global agenda and as a part of this issue different physical and chemical approaches like adsorption, membrane filtration, photo-degradation, coagulation, chemical and electro-oxidation and catalytic reduction techniques have been followed towards the removal of toxic organic dyes from water (Kurtan et al., 2016; Awais et al., 2018; Veerakumar et al., 2018; Hao et al., 2019; Zhu et al., 2018). Amongst them, catalytic reduction involving nanomaterials has been one of the potential methods. This procedure converts the organic contaminants to soft chemicals being safe and tender to waters (Atarod et al., 2016; Nasrollahzadeh et al., 2018; Adyani and Soleimani, 2019; Ganapuram et al., 2015; Veisi et al., 2017; Sadjadi and Mohammadi, 2020; Hemmati et al., 2020; Vos et al., 2016; Wolach and Stone, 2015; Hemmati et al., 2020; Demain and Vaishnav, 2011).
In the last few years nanobiotechnology has come out as unique coalescence of nanotechnology, chemistry, physics, medicine and biotechnology (Becquemont, 2009). The bulk materials on miniaturization leads to enhance its active surfaces area or surface to volume ratio and this induces the material to adopt fabulous physicochemical properties (Feldbaum, 2002). The nanomaterials have been persistently enriched by architectural designing and surface functionalizations with organic linkers and biomolecules. These textured materials exhibit unique applications in pharmaceuticals, electronics, optics, chemosensing, cosmetics, catalysis and drug development (Luque et al., 2010; Veisi et al., 2017; Shi et al., 2009).
Based on applicative engineered nanomaterials (Veisi et al., 2018; Veisi et al., 2019; Veisi et al., 2019; Nodehi et al., 2020; Mirfakhraei et al., 2018; Taheri et al., 2017; Veisi et al., 2019; Lotfi and Veisi, 2019), we are prompted to synthesize an Au NPs-CS nanocomposite by adorning Au NPs over the chitosan polysaccharide. Chitosan is a naturally occurring polymer with several electron rich polar functional groups like amino (NH2) and hydroxyl (OH). These moieties initiate the green reduction of anchored Au (III) ions to Au (0) NPs and concurrently promotes the stabilization of tiny Au NPs from agglomeration and also from oxidation by suitable chelation. The biogenic synthesis followed by the chemical and biological catalytic applications of noble nanoparticles like Cu, Au, Ag and Pd has been well reported and different research groups around the world are engaged in its further exploration (Singh et al., 2016a, 2016b; Hamelian et al., 2018, 2019; Zangeneh, 2019; Zangeneh et al., 2019; Zhaleh et al., 2019; Sharma et al., 2019; Zhang et al., 2020). Among them gold catalysis is have a special place due to its fascinating characteristics. There are several reports on the Au NPs catalyzed reduction of organopollutants (Yao et al., 2014; Ganapuram et al., 2015). However, the change in electronic and functional environment and thereby the change in the nature of Au site makes an amendment in its catalytic potential. This is an important fact behind our investigation using chitosan as nano-support.
In material science it has been a recent trend to investigate the pharmacological effects of different biofunctional nanoparticles, particularly the Au NPs. Some latest publications have documented their outstanding antioxidant potentials over DPPH free radical, antifungal activities over Candida species and antibacterial properties against Gram-positive and Gram-negative bacteria (Zhaleh et al., 2019). In addition, Au NPs are found to exhibit suitable chemotherapeutic activities in both in vitro and in vivo experimental studies (Oueslati et al., 2020; Sun et al., 2019; Wu et al., 2018). They were successfully employed against different cancer cell lines such as Lewis lung carcinoma (LL2), MCF-7/ADR cancer, A549 lung epithelial cancer, H460 and H520 human lung cancer, HT29, HCT15, HCT116, and RKO colon cancer, U87 and LN229 human glioma cancer, A549, HeLa, HDF, C0045C, HepG2-R, Vero and 4T1 mouse mammary carcinoma cell lines (Singh et al., 1979). Functionalized Au NPs have also showed its expertise in the laser responsive thermal ablation of solid tumors of lung, head and neck up to clinical trial stage (Singh et al., 1979).
Acute myeloid leukaemia (AML) is a type of cancer which affects the blood and bone marrow with overproduction of immature white blood cells, called as myeloblasts (Hemmati et al., 2020; Vos et al., 2016). AML treatment include chemotherapy, drug therapy, radiotherapy and stem cell or bone marrow transplantations (Wolach and Stone, 2015; Hemmati et al., 2020). However, most of them involve several side-effects. In search of alternate treatment protocols, nanomedicines have been evolved as a boon in the recent days of advanced technology. It's a unique combination of nanomaterials and drugs which have been proved to be expeditious and greatly effective over the conventional drugs with lesser drawbacks in the treatment of AML (Demain and Vaishnav, 2011).
Hence, it is our earnest effort to introduce a green synthesized bionanohybrid material (Au NPs-CS nanocomposite) as novel bio-composite (Scheme 1). It demonstrated excellent potential in biological applications. Also we achieved suitable results in the bioapplications towards in-vitro anticancer study against acute myeloid leukemia in comparison to Daunorubicin as a standard chemotherapeutic drug in a leukemic mouse model.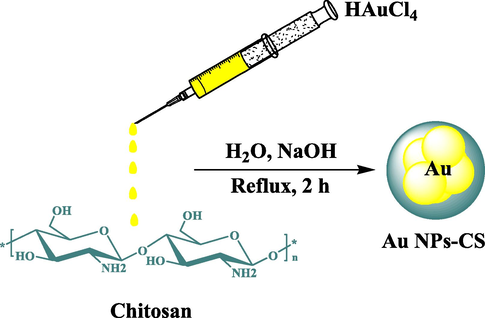
Synthesis of Au NPs-CS nanocomposite.
2 Experimental
2.1 Materials
Antimycotic antibiotic solution, dimethyl sulfoxide (DMSO), hydrolyzate, Ehrlich solution, decamplmaneh foetal bovineserum, borax-sulfuric acid mixture, Dulbazolic mixtureModified Eagle Medium (DMED), 4-(Dimethylamino) benzal-dehyde, 2,2-diphenyl-1-pikrilhydrazil (DPPH), and phosphatebuffer solution (PBS) were supplied from the US Sigma-Aldrich company (St. Louis, MO, USA).
2.2 Synthesis of Au NPs-CS nanocomposite
In the typical synthetic procedure, 0.1 g of chitosan (98% deacetylated) was dissolved in 1% acetic acid (50 mL) by stirring for 20 min. 5 mL freshly prepared HAuCl4 (0.1 M) solution was then added to the previous solution. The mixture was made alkaline by adding 5 mL NaOH solution (1 M) to it and refluxed at 100 °C for 2 h. The progress of the reaction could be monitored by change in color from light yellow (Au3+ ion) to reddish-brown (Au0 NP).
2.3 Determination of antioxidant property of Au NPs-CS nanocomposite
DPPH radical (2,2-diphenyl-1-picrylhydrazyl) was used to study the antioxidant potential of Au NPs-chitosan nanocomposite by its scavenging capacity. A DPPH solution was prepared in 1:1 aqueous EtOH (0.004%). At the same time, different samples of Daunorubicin drug, HAuCl4, chitosan, and Au NPs-CS nanocomposite were also prepared in variable concentrations. Each of the sample was mixed to 2 mL DPPH solution. The control solution contained 2 mL DPPH solution in 2 mL EtOH. All of them were kept in dark at RT for 30 min. Finally, UV absorption (A) of the solutions were measured at 517 nm along with the control. The antioxidant property of catalyst (%) was determined as =(Control A − Test A/Control A) × 100.
2.4 Cytotoxicity assay of Au NPs-CS nanocomposite (in vitro)
In this study, the standard cancer cell lines HUVEC, 32D-FLT3-ITD and Murine C1498 are being used to investigate the anticancer potential of Daunorubicin, HAuCl4, chitosan and Au NPs-CS nanocomposite following MTT assay. For culturing these cells, 10% decamplmaneh fetal bovine serum (FBS), 1% penicillin–streptomycin solution and Dulbecco’s modified Eagle’s medium (DMEM) were used in T25 flasks. All samples were incubated at 37 °C in 5% CO2 for 24 h. The dense cells (∼80%) were exposed to 1% of EDTA-trypsin solution and incubated again for 3 min under the same conditions followed by centrifugation for 5 min at 5000 pm. The cell deposition was trypsinized by adding the culture medium, stained with trypan blue and 5 mg/mL of MTT was added to all wells. They were incubated again to have single layer density and 80% of cell growth. The surface of the cells was washed with FBS and then 100 µL double concentrated culture medium was added. 100 µL of each of the Daunorubicin, HAuCl4, chitosan, and Au NPs-CS nanocomposite solution in FBS were added to the first well (1000µg/mL). After mixing in the medium, 100 µL of it was taken out and added to the second well. Then, 100 µL of the mixture from second well was added to well 3. This process was continued up to well 11. Well 12 contained the cell and single concentration culture medium only and used as control. The plate was put once again in an incubator for 24 h under the same conditions. Subsequently, all the cells including the control were stained with 10 µL of tetrazolium stain (5 mg/mL) and incubated again followed by addition of 100 µL of DMSO. The plate was wrapped in an aluminum foil and shaken for 20 min. Finally, cell viability was determined by an ELISA (Enzyme-Linked Immunosorbent Assay) recorder at 570 nm.
Percentage of cell viability (%) = (Sample Absorbance/Control absorbance) × 100.
2.5 In vivo designing of the study
2.5.1 Treatment of mice and sample collection
This study maintained the ethical considerations of the International Committee on Laboratory Animals. A total of 60 healthy male mice with a weight range of 38–40 g were brought from animal house and kept in stress-free environment and same nutritional conditions (temperature, humidity, light, diet, and frequency of meals) for one week. The mice were fed special pellet for laboratory animals. Initially, AML was induced over 50 mice by intravenously injecting 7,12-Dimethylbenz[a]anthracene (DMBA) (0.04 g/kg body weight) biweekly for 6 weeks. Simultaneously, one group of mice were injected with normal saline and measured as a control. After 6 weeks, the 50 DMBA-treated mice were randomly divided into five subgroups, four of which were intravenously injected (0.001 g/kg body weight) with Daunorubicin, HAuCl4, chitosan and Au NPs-CS nanocomposite separately and one group only given distilled water while the healthy control group received normal saline. The dose was repeated in 6 cycles and this whole injection treatment process was continued for 24 days. After end of this treatment, they were anesthetized and blood samples were collected immediately from their heart.
2.5.2 Biochemical and stereological sample analysis
The mice livers and spleens were harvested to analyze the biochemical and stereological factors.
Biochemical (Alkaline Phosphatase (ALP), Aspartate Aminotransferase (AST), Alanine Aminotransferase (ALT), Gamma-Glutamyl Transferase (GGT), cholesterol, Low-Density Lipoprotein (LDL), High-Density Lipoprotein (HDL), triglyceride, total protein, albumin, total and conjugated bilirubin, glucose, urea, creatinine, ferrous, ferritin, and erythropoietin) parameters were assessed in the serum by ELISA method and determined using kits (ZiestChem Diagnostics).
Pro-inflammatory (Interleukin-1 (IL1), IL6, IL12, IL18, Interferon Gamma (IFN-γ), and Tumor Necrosis Factor Alpha (TNFα)) cytokines were measured with an immunoradiometricassay (Medgenix two-step immunoradiometric IRMA; Bio-Source, Nivelles, Belgium) with a detection limit of 6 pg/mL and within- and between-run coefficients of variation of 4.3–6.7% and 2.3–8.3%, respectively. A tenuous cross-re-action was shown with Granulocyte Colony Stimulating Factor (G-CSF).
Anti-inflammatory (IL4, IL5, IL10, IL13, and IFNα) cytokines were measured with an immunoradiometricassay (Medgenix two-step immunoradiometric IRMA) with a detection limit of 104 pg/mL and within- and between-run coefficients of variation of 4.71–8.33% and 6.7–10.0%, respectively.
The number of total white blood cells (WBC), blast, lymphocyte, monocyte, neutrophil, eosinophil, basophil, platelet, red blood cells (RBC), and nRBC, and the level of Hemoglobin (HB), Packed Cell Volume (PCV), Mean Corpuscular Volume (MCV), Mean Corpuscular Hemoglobin (MCH), and Mean Corpuscular Hemoglobin Concentration (MCHC) were analyzed in the plasma by automatic hematology analyzer (Sysmex XS 800i). All immunological, biochemical, and hematological analyses were duplicated.
For investigation the stereological parameters in the liver and spleen, the extracted tissues were weighed by a digital scale with an accuracy of 0.001 g. Then, the primary volume of the organs was determined by the immersion method. Since tissue deformities like shrinkage, which are caused by fixation, passage, and staining, has negative effects on soteriological computations, the amount of shrinkage was calculated. The uniform and random isotropic sections were used to estimate the shrinkage. These sections were prepared by orientator method. In this method, each organ was placed on a circle half of which was divided into 10 equal parts. Then, a random number between 0 and 10 was selected, and the given organ was cut into half in the direction of the chosen number. The first half section was placed on another circle each half of which was divided into 10 unequal parts and was sectioned in the direction of a random number chosen between 0 and 10. The second half section was also placed vertically on a circle each half of which was divided into 10 unequal parts and was sectioned in the direction of a random number chosen between 0 and 10. Next, the tissue was cut into 0.5 mm sections in the direction of the second section. Using a trocar, a circular sample was taken from one of the prepared sections, and the area of the circle was calculated by measuring its diameter. All isotropic sections and the circular sample were put together in none block after passage, 5 µm sections were prepared from it, and the given organs were stained by hematoxylin-eosin staining. After staining, the area of the circular sample was calculated again, and the amount of shrinkage was computed using the following formula (Adyani and Soleimani, 2019): where AA and AB represent the area of the circular sample before and after passage and staining, respectively. The final volume or reference volume was also computed by the following formula (Adyani and Soleimani, 2019):
To calculate the volume, structures were selected from each sample of a section and 10–14 field of views (FOVs) were randomly chosen and studied.
To calculate the relative volume of the structures, a point (probe) grid was used. To prepare the grid point, 40 + symbols with fixed longitudinal and transverse distances (5 × 8) were printed on a transparent plate, and the grid was installed on the monitor. To study the FOVs, the points meeting the given structures in the probe as well as the top and right sides of the probe were counted. The relative volume of the structures was determined by the following formula (Adyani and Soleimani, 2019): where P reference and P structure are the sums of the points meeting the given structure and sum of the points of the probe in n FOV, respectively.
The total volume of the given structures was calculated by multiplying their relative volume by the reference volume via the following formula (Adyani and Soleimani, 2019):
2.6 Quantification of gene expressions
Lymphocyte Separation Medium (#17-829E, Lonza) was used for determining the molecular parameters of lymphocytes. The GeneJET RNA Purification Kit (#K0731, Thermo Scientific) was used for isolation of total RNA from the collected cells. Pure RNA was converted into cDNA by RevertAid H Minus cDNA Synthesis Kit (#K1631, Thermo Scientific) following the given instructions. SYBR Green PCR Mix (#K0251, Thermo Scientific) was used to perform quantitative Real-Time PCR for Sphingosine-1-Phosphate Receptor 1 (S1PR1) and S1PR5 in 20 μL scale reactions. cDNAs of S1PR1 and S1PR5 were quantitated using the primers: S1PR1 sense: 5′-CCGCTTGAGCGAGGCTGCTG-3′, S1PR1 antisense: 5′-CTATGATATCATAGTTGCCATAGTC-3′,S1PR5sense:5′-TCTAGAGCGCCACCTTACCATG-3′, and the antisense primer: 5′- AAATCCTTGCATAGAGCGCACAG-3′. β-actin was detected as the reference gene using the sense primer: 5′-CCTTCTACAAATGAGCTGCGT-3′ and the antisense primer: 5′-CCTGGATAGCAACGTACATG-3′. Reactions were cycled in Mx3000P QPCR Systems (Stratagene) at 95 °C for 10 min, followed by cycling 40 times at 95 °C for 15 s, 60 °C for 15 s and 72 °C for 30 s. Data analysis was performed by the ΔΔCt method (Zhu et al., 2018).
2.7 Statistical analysis
The data obtained were fed into SPSS-22 software in a one-way ANOVA analyzer, followed by Duncan post-hoc test (P ≤ 0.05).
3 Results and discussion
3.1 Structural characterization of Au NPs-CS nanocomposite
The as synthesized Au NPs-CS nanocomposite was characterized using UV–Vis and FT-IR spectroscopy, FESEM, TEM and EDX study. The successful biogenic synthesis of Au(0) NPs was primarily assured by visual color change from yellow to dark red. The formation of Au NPs was further justified from UV–Vis spectroscopy. Fig. 1 displays the typical plasmon resonance band of Au NPs, being observed at 556 nm (λmax).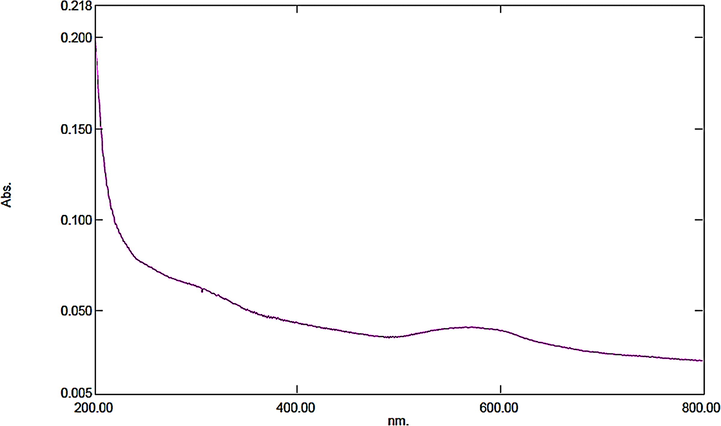
UV–Vis spectroscopic study of Au NPs-CS nanocomposite.
Fig. 2 displays the FT-IR spectra of chitosan and Au NPs-CS nanocomposite. In the FT-IR spectra of chitosan (Fig. 2a) the broad peak appeared at 3429 cm−1 corresponds to the overlapped stretching vibrations of NH2 and OH groups. The alcoholic C—O stretching, C—N stretching and N—H bending peaks are observed at 1091 cm−1, 1388 cm−1 and 1620 cm−1 respectively. Fig. 2b represents the corresponding peaks of Au NPs-CS nanocomposite. It resembles very much to Fig. 2a, which justifies the unmodified core structure even after Au deposition over chitosan. However, all the characteristic peaks of Au NPs-CS nanocomposite are somewhat shifted to higher or lower wavelength regions compared to chitosan peaks. This is attributed to the strong complexation of Au NPs with the chitosan NH2 and OH functions. These groups in turn act as stabilizing caps for the Au NPs.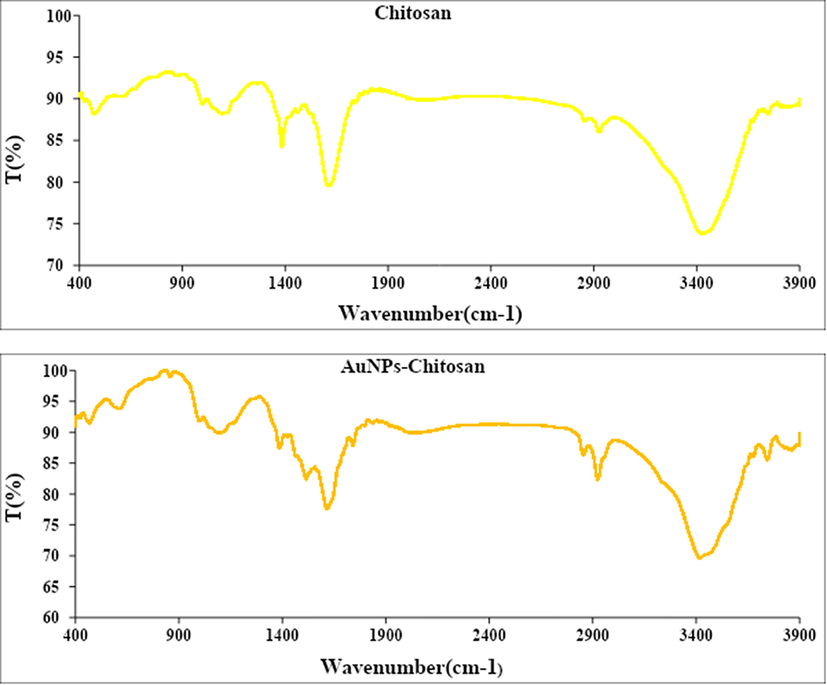
FT-IR analysis of chitosan (a) and Au NPs-CS nanocomposite (b).
The particle size, shape, texture and surface morphology of the Au NPs-CS nanocomposite was ascertained by FE-SEM study, as shown in Fig. 3a. It displays the quasi-spherical shaped nanoparticles of mean diameter 30–40 nm. All the particles are of uniform shape and texture. However, Au NPs are not quietly visible in the image. For further structural inherence of the nanocomposite, TEM analysis was carried out (Fig. 3b). Most of the particles are almost round shaped with some triangles. The particle sizes are in close agreement to SEM data.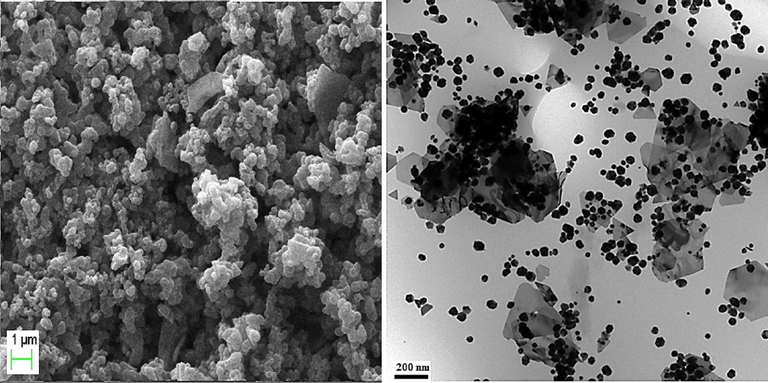
FE-SEM and TEM analysis of the Au NPs-CS nanocomposite.
The elemental composition of Au NPs-CS nanocomposite was determined by EDX analysis. As depicted in Fig. 4, the profile displays and confirms the presence of Au in the composite. Again, the signals corresponding to C, N and O atoms can be ascribed to chitosan molecule thereby assuring the proposed nanostructure.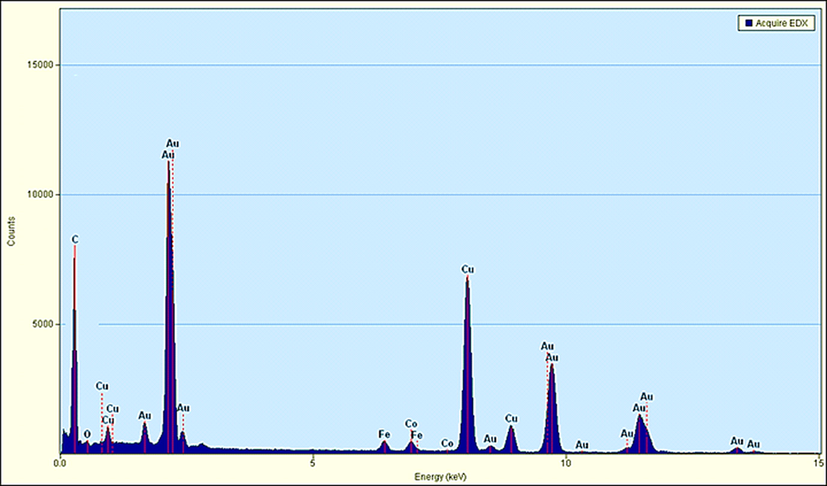
EDX spectrum of the Au NPs-CS nanocomposite.
3.2 Antioxidant activity of Au NPs-chitosan nanocomposite
In earlier reports it has been shown that Au NPs exhibit excellent antioxidant properties in DPPH radical scavenging assay as compared to BHT, being used as positive control (Zhaleh et al., 2019). We also carried out this study using Daunorubicin; chitosan, and Au NPs-chitosan nanocomposite against DPPH by plotting inhibition (%) vs concentrations, which revealed suitable results in favor of our catalyst. The IC50 of the BHT, Daunorubicin, chitosan, and Au NPs-chitosan nanocomposite were less than 1000 µg/mL (Fig. 5).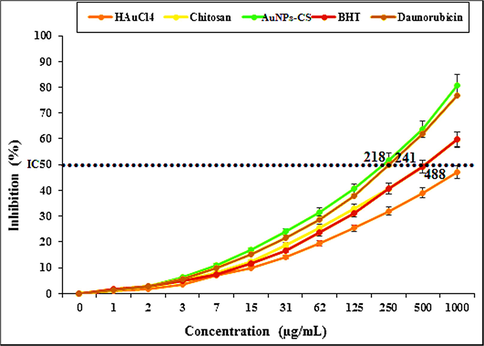
The DPPH radical scavenging assay.
3.3 Cytotoxicity effect of Au NPs-CS nanocomposite
Cytotoxicity is the quality of being toxic to cells. Examples of toxic agents are an immune cell or some types of venom, e.g. from the puff adder (Bitis arietans) or brown recluse spider. Treating cells with the cytotoxic compound can result in a variety of cell fates. The cells may undergo necrosis, in which they lose membrane integrity and die rapidly as a result of cell lysis. The cells can stop actively growing and dividing (a decrease in cell viability), or the cells can activate a genetic program of controlled cell death (apoptosis). Cells undergoing necrosis typically exhibit rapid swelling, lose membrane integrity, shut down metabolism, and release their contents into the environment (Jurisic et al., 2011). Cells that undergo rapid necrosis in vitro do not have sufficient time or energy to activate apoptotic machinery and will not express apoptotic markers. Apoptosis is characterized by well-defined cytological and molecular events including a change in the refractive index of the cell, cytoplasmic shrinkage, nuclear condensation and cleavage of DNA into regularly sized fragments (Jurisic et al., 2006). Cells in culture that are undergoing apoptosis eventually undergo secondary necrosis. They will shut down metabolism, lose membrane integrity and lyse (Jurisic et al., 2011, 2006, 2015).
In this study, the concerned cells lines were treated with variable concentrations of Daunorubicin, HAuCl4, chitosan, and Au NPs-CS nanocomposite following MTT test and the results have been shown in Fig. 6.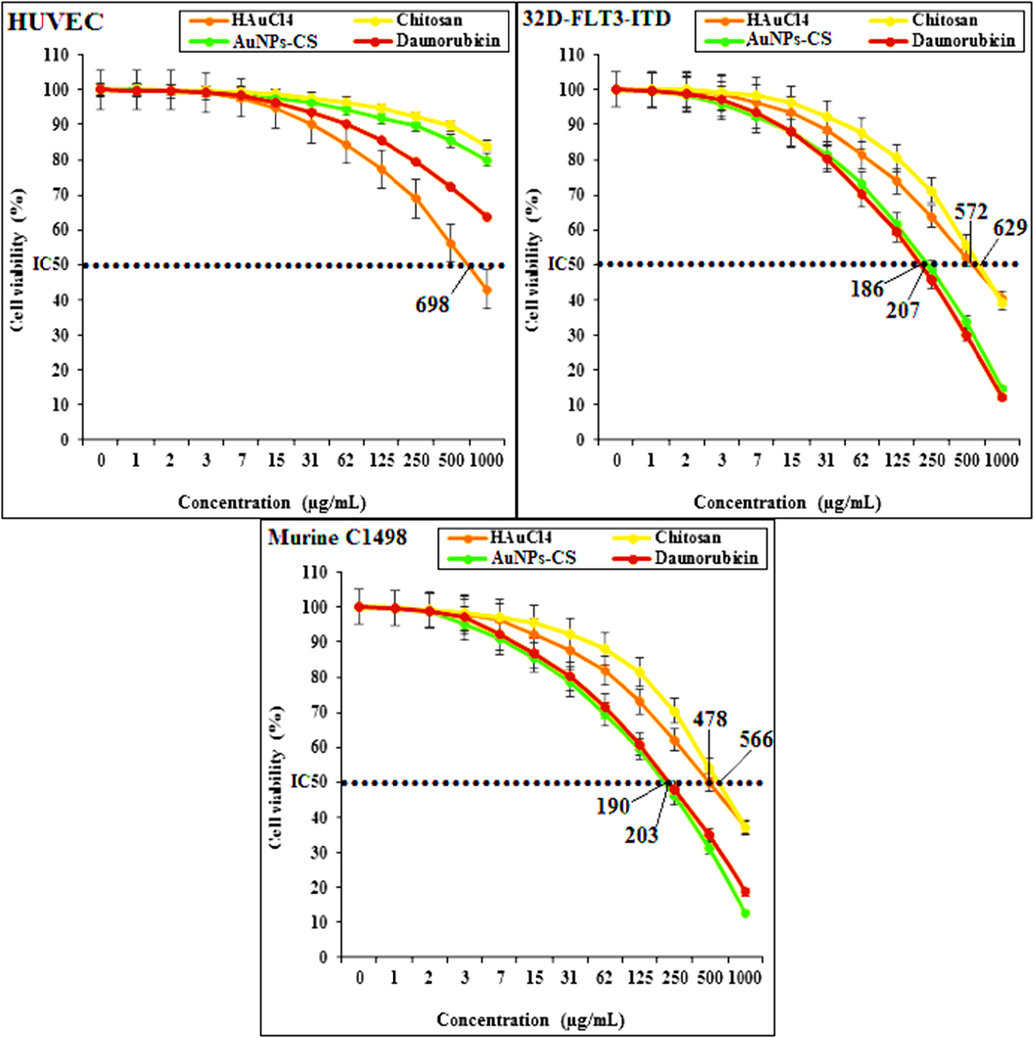
The cytotoxicity assay results over different cell lines.
HUVECs are the human normal cells that are separated from umbilical vein endothelial cells. These cells are used for investigating the cytotoxicity effects of metal nanoparticles. However, 32D-FLT3-ITD and Murine C1498 are the acute myeloid leukemia cell lines in human and mouse, respectively (Zhang et al., 2020).
The absorbances were measured at 570 nm. While using the normal cell line HUVEC, the Daunorubicin, chitosan and Au NPs-CS nanocomposite showed high cell viability up to 1000 μg/mL concentration which indicates that they are not significantly toxic to the cell line (Zhaleh et al., 2019; Singh et al., 1979). Only HAuCl4 exhibited the IC50 value of 698 µg/mL. However, with the AML cell lines (32D-FLT3-ITD and Murine C1498), the cell viability gets lowered in using chitosan, HAuCl4, Daunorubicin and Au NPs-CS nanocomposite. These data reveals significant cytotoxicity effect of our catalyst against the AML cell lines. Agreement with our experiment, in the previous study has been revealed that the cytotoxicity effect of gold nanoparticles is shallow against HUVECs (Zhang et al., 2020).
3.4 Effect of Au NPs-CS nanocomposite on the immunological parameters
We injected DMBA in mice to stimulate AML. DMBA causes several side effects like hemolysis of Central Nervous System, respiratory tract, hepatic, renal and vascular cells, self-immune disorders, malignancies and genetic abnormalities. DMBA oxidation leads to lipid peroxidation, which in turn damages the cells and enhance apoptosis. Particularly, the DMBA induced AML results an increase in the WBC, blast, monocyte, neutrophil, eosinophil and basophil and a decrease in the lymphocyte, platelet and RBC counts (Yusuf et al., 2009). It also changes the biochemical parameters in blood-serum. The corresponding results have been documented in Table 1. It shows that the anti-inflammatory cytokines (IL4, IL5, IL10, and IFNα) have reduced (p ≤ 0.05) and the pro-inflammatory cytokines (IL1, IL6, IL12, IL18, IFNY and TNFα) have enhanced significantly (p ≤ 0.05) in the DMBA-treated mice (Jurisic et al., 2015; Yusuf et al., 2009). Both Daunorubicin and Au NPs-chitosan nanocomposite have improved the levels of pro-inflammatory and anti-inflammatory cytokines considerably (p ≤ 0.05) near to normal but the latter one resulted the best in the group. There were no major changes (p ≤ 0.05) between Au NPs-chitosan nanocomposite and control groups while studying IL4, IL5, IL13, and IL18. It has been observed that on increasing the consumption of Au NPs-CS nanocomposite (0.25, 0.5, and 1 mg/kg) in mice, the IL-1, IL-6, IFNY, and TNFα level gradually decreases appreciably in comparison to untreated mice (Dkhil et al., 2015). Non-identical letters reveal a notable shift between the experimental groups (p ≤ 0.01).
Parameters
Groups (n = 10)
Control
Untreated
Daunorubicin
HAuCl4
Chitosan
AuNPs-CS
Pro-inflammatory cytokines (pg/mL)
IL1
52.2 ± 6.2a
141.7 ± 12.7e
97.9 ± 10c
120.8 ± 8.3d
117.9 ± 7.1d
79.8 ± 6.8b
IL6
52.7 ± 7.1a
136.2 ± 11.8d
92.3 ± 9.3b
115.2 ± 7.5c
110.6 ± 7.2c
86.4 ± 8.9b
IL12
91.2 ± 8.1a
238.5 ± 15.6d
160 ± 12.1b
192.2 ± 10.5c
195.2 ± 14.7c
154.9 ± 11.8b
IL18
36.1 ± 2.6a
92.6 ± 7.3c
58.7 ± 5.3b
63.7 ± 5.8b
65.8 ± 8.1b
42.7 ± 4.9a
IFNY
68.5 ± 5.8a
132.9 ± 13.2c
98.7 ± 8.5b
107 ± 9.4b
105.2 ± 7.9b
93.7 ± 10b
TNFα
25.3 ± 1.8a
79.1 ± 8.4d
42.8 ± 4.7b
58.9 ± 3.9c
61.2 ± 4.8c
45.1 ± 2.9b
Anti-inflammatory cytokines (pg/mL)
IL4
14.5 ± 0.7a
9.7 ± 0.5b
10.3 ± 0.7b
10 ± 0.5b
9.6 ± 0.8b
12.9 ± 1a
IL5
15.2 ± 1.1a
10 ± 0.7b
10.9 ± 0.9b
10.9 ± 0.7b
10.3 ± 0.8b
13.9 ± 0.9a
IL10
32.7 ± 3.7a
21.7 ± 1.8c
19.9 ± 1.8c
20.5 ± 0.9c
19.3 ± 1.3c
24.8 ± 0.8b
IL13
14.2 ± 0.7a
13 ± 1a
12.9 ± 1a
13.2 ± 0.9a
13.1 ± 0.7a
13.7 ± 0.8a
IFNα
11.6 ± 0.7a
4.1 ± 0.6c
3.4 ± 0.5c
3.2 ± 0.4c
3.5 ± 0.4c
6.4 ± 0.6b
3.5 Effect of Au NPs-CS nanocomposite on the hematological parameters
Table 2 displays the hematological results after the treatment of Daunorubicin, HAuCl4, chitosan and Au NPs-CS nanocomposite in mice. For the DMBA treated group of mice, it is observed that platelet, lymphocyte and RBC counts along with the different RBC parameters like Hb, PCV, MCV, MCH, and MCHC have been reduced (p ≤ 0.05) while the total WBC, blasts, nRBC and other blood component counts have been augmented in substantial amount (p ≤ 0.05). This results also validates the fact that DMBA induces the AML successfully in those mice. However, with respect to the untreated group of mice, the WBC, blasts, neutrophil, monocyte, eosinophil, basophil, and nRBC counts have been reduced whereas the lymphocyte, platelet, RBC and the other RBC parameters like Hb, PCV, MCV, MCH, and MCHC counts have been increased. The anti-hemolytic effect of Daunorubicin, HAuCl4, chitosan, and Au NPs-CS nanocomposite are associated with their antioxidant properties. They destroy the free radicals of hematotoxic substances and prevent the toxic effects (Arulmozhi et al., 2013). Non-identical letters reveal a notable shift between the experimental groups (p ≤ 0.01).
Parameters
Groups (n = 10)
Control
Untreated
Daunorubicin
HAuCl4
Chitosan
AuNPs-CS
WBC (×109/Liter)
8.6 ± 0.8a
58.3 ± 6.2d
16.5 ± 0.9b
27.4 ± 2.6c
30.7 ± 3.7c
18.5 ± 1.6b
Blast (×109/Liter)
0.0 ± 0.0a
10.3 ± 0.7e
1.1 ± 0.0b
2.9 ± 0.1c
4.9 ± 0.2d
1.4 ± 0.1b
Lymphocyte (×109/Liter)
5.2 ± 0.4a
1.5 ± 0.2d
3.8 ± 0.3b
2.9 ± 0.2c
2.5 ± 0.3c
4.1 ± 0.3b
Monocyte (×109/Liter)
0.1 ± 0.0a
9.2 ± 0.8d
0.8 ± 0.1b
2.1 ± 0.1c
2.3 ± 0.2c
1.1 ± 0.2b
Neutrophil (×109/Liter)
3 ± 0.2a
34.8 ± 2.6d
10.3 ± 0.7b
18.6 ± 1.1c
20.1 ± 0.7c
11.4 ± 0.7b
Eosinophil (×109/Liter)
0.2 ± 0.0a
1.4 ± 0.1c
0.3 ± 0.0a
0.6 ± 0.0b
0.6 ± 0.0b
0.3 ± 0.0a
Basophil (×109/Liter)
0.1 ± 0.0a
1.1 ± 0.1b
0.2 ± 0.0a
0.3 ± 0.0a
0.3 ± 0.0a
0.2 ± 0.0a
Platelet (×109/Liter)
284.3 ± 19.4a
101.5 ± 10d
132.9 ± 11.6c
132.1 ± 13.2c
124.6 ± 10.5c
162.7 ± 12.9b
RBC (×1012/Liter)
9.1 ± 0.7a
5.7 ± 0.6c
7 ± 0.7b
6.4 ± 0.6b
6.5 ± 0.7b
7.2 ± 0.8b
nRBC (×1012/Liter)
0.0 ± 0.0a
1.5 ± 0.1d
0.6 ± 0.0b
1.1 ± 0.1c
1.1 ± 0.1c
0.4 ± 0.0b
Hb (Grams/Decilitre)
16.2 ± 0.7a
10.8 ± 0.7c
13.2 ± 0.5b
12.8 ± 0.6b
12.8 ± 0.7b
13.5 ± 0.7b
PCV (Percentage)
49.2 ± 3.7a
32.7 ± 2.1b
44.2 ± 3.5a
42.9 ± 3.7a
42.9 ± 3.4a
46.8 ± 4a
MCV (Femtoliter)
72.6 ± 6.8a
50.1 ± 4.7b
68.8 ± 6.2a
66.8 ± 5.9a
65.3 ± 5.4a
66.1 ± 7.3a
MCH (Pikogram)
27.3 ± 2.8a
17.5 ± 0.9c
23.8 ± 0.9b
22.1 ± 1.1b
22.3 ± 0.9b
24.3 ± 1b
MCHC (Grams/Decilitre)
33.2 ± 2.2a
20.8 ± 0.9c
26.9 ± 1.1b
25.4 ± 1.1b
25.9 ± 0.8b
27.9 ± 1.2b
3.6 Effect of Au NPs-CS nanocomposite on the biochemical parameters
The biochemical test results on the treatment of Daunorubicin, HAuCl4, chitosan and Au NPs-CS nanocomposite in mice have been presented in Table 3. In the blood serum of the DMBA induced group of mice, it is observed that the concentrations of parameters like GGT, ALT, AST, ALP, triglyceride, HDL, LDL, cholesterol, glucose, total and conjugated bilirubin, creatinine, urea, ferritin, erythropoietin and ferrous ions have been enhanced while that of total protein and albumin has been reduced significantly. Here, in our results, Daunorubicin, HAuCl4, chitosan, and Au NPs-CS nanocomposite ameliorates the above parameters significantly (p ≤ 0.05). There were not much changes (p ≤ 0.05) in the triglyceride and glucose levels between Daunorubicin, HAuCl4, chitosan, Au NPs-CS nanocomposite and control groups. Also, Daunorubicin and Au NPs-CS nanocomposite significantly (p ≤ 0.05) regulated the GGT and albumin levels to the control group. The best results were achieved with Au NPs-CS nanocomposite treated group towards the improvement of biochemical parameters (Table 3). Previously Dkhil et al. have shown that Au NPs have a unique protective role against free radicals and improve the levels of biochemical and immunological parameters of serum towards normal (Dkhil et al., 2015). Likewise, it has been observed that the SOD, CAT, and GPx levels of serum, liver and spleen are increased whereas that of GR level are deceased appreciably (p ≤ 0.05) over Daunorubicin, HAuCl4, chitosan, and Au NPs-CS nanocomposite treated mice as compared to the untreated group. Among them, the Au NPs-chitosan nanocomposite exhibited the best results due to its outstanding antioxidant potential. However, there was not much change (p ≤ 0.05) in the GPx levels of serum, spleen and liver as shown by Au NPs-CS nanocomposite and the control groups. It also modifies the CAT levels of serum and spleen and GR of liver (p ≤ 0.05). Non-identical letters reveal a notable shift between the experimental groups (p ≤ 0.01).
Parameters
Groups (n = 10)
Control
Untreated
Daunorubicin
HAuCl4
Chitosan
AuNPs-CS
Serum
ALP (International Unite/Liter)
153.6 ± 8.9a
541.5 ± 16.3d
318.7 ± 12.6b
386.2 ± 15.3c
391.6 ± 13.7c
293.4 ± 12.6b
AST (International Unite/Liter)
97.4 ± 8.5a
461.2 ± 15.7d
223.6 ± 13.7b
273.8 ± 14c
293.1 ± 12.7c
209 ± 11.6b
ALT (International Unite/Liter)
31.5 ± 2.1a
78.7 ± 4.7d
51.2 ± 4.2c
53.7 ± 4.4c
53.6 ± 3.8c
43.1 ± 3.1b
GGT (International Unite/Liter)
7.4 ± 0.8a
16.9 ± 1.4c
8.4 ± 0.7a
12.1 ± 1b
13.2 ± 1.1b
8.2 ± 0.7a
Cholesterol (Milimoles/Liter)
4.3 ± 0.4a
8 ± 0.7c
5.6 ± 0.5b
5.8 ± 0.7b
5.9 ± 0.5b
5.4 ± 0.4b
LDL (Milimoles/Liter)
3.1 ± 0.3a
5.5 ± 0.5c
4 ± 0.3b
4.1 ± 0.3b
4.2 ± 0.4b
3.8 ± 0.3b
HDL (Milimoles/Liter)
5.8 ± 0.6a
3.4 ± 0.4c
4.8 ± 0.5b
4.4 ± 0.4b
4.4 ± 0.3b
4.6 ± 0.5b
Triglyceride (Milimoles/Liter)
0.6 ± 0.0a
1.9 ± 0.1b
0.8 ± 0.0a
0.9 ± 0.0a
1 ± 0.0a
0.7 ± 0.0a
Total protein (Grams/Decilitre)
8.2 ± 0.7a
4.3 ± 0.2d
7.3 ± 0.4b
5.9 ± 0.5c
6.1 ± 0.3c
7.2 ± 0.7b
Albumin (Grams/Decilitre)
3.2 ± 0.2a
1.4 ± 0.1c
2.8 ± 0.2a
2.1 ± 0.1b
2 ± 0.1b
2.8 ± 0.3a
Total bilirubin (Miligrams/Decilitre)
0.43 ± 0.0a
0.87 ± 0.0c
0.62 ± 0.0b
0.63 ± 0.0b
0.6 ± 0.0b
0.55 ± 0.0b
Conjugated bilirubin (Miligrams/Decilitre)
0.09 ± 0.0a
0.24 ± 0.0c
0.15 ± 0.0b
0.15 ± 0.0b
0.15 ± 0.0b
0.13 ± 0.0b
Glucose (Grams/Decilitre)
83.1 ± 8.4a
97 ± 6.8a
87.2 ± 9.3a
89.3 ± 7.4a
85.9 ± 8.6a
80.1 ± 9.5a
Urea (Miligrams/Decilitre)
11.9 ± 1a
36.7 ± 3.7d
19 ± 1.5b
26.2 ± 2.3c
25.8 ± 1.9c
20.3 ± 1b
Creatinine (Miligrams/Decilitre)
0.6 ± 0.0a
1.7 ± 0.0c
0.9 ± 0.0b
1 ± 0.1b
0.9 ± 0.1b
0.9 ± 0.0b
Ferrous (Micrograms/Decilitre)
201.6 ± 13.6a
407.4 ± 18.3d
289.4 ± 15.2b
321.8 ± 16.2c
325.7 ± 17.4c
261.8 ± 15.9b
Ferritin (Micrograms/Gram protein)
167.3 ± 13.1a
452.8 ± 18.6d
275.2 ± 14.7b
317.2 ± 16.3c
327.4 ± 17.1c
266.8 ± 15.2b
Erythropoietin (Miliunit/Mililitre)
18.7 ± 1.3a
39.5 ± 3.2d
24.7 ± 1.1b
30.4 ± 2.5c
31.7 ± 1.7c
25.6 ± 0.9b
SOD (μ/mg protein)
10.6 ± 0.9a
2.9 ± 0.2d
7.5 ± 0.8b
5.9 ± 0.6c
5.6 ± 0.4c
8.1 ± 0.6b
CAT (Micro/Miligram protein)
3.3 ± 0.3a
0.8 ± 0.1c
3.1 ± 0.2a
2.4 ± 0.2b
2.4 ± 0.2b
3 ± 0.3a
GR (Unit/Mililitre protein)
4.9 ± 0.3a
17.9 ± 0.9d
7.3 ± 0.5b
11.2 ± 0.6c
12.1 ± 0.7c
6.9 ± 0.5b
GPx (Unit/Mililitre protein)
2 ± 0.1a
0.6 ± 0.0c
1.9 ± 0.0a
1.6 ± 0.0b
1.6 ± 0.0b
1.9 ± 0.0a
Spleen
SOD (Micro/Miligram protein)
30.5 ± 2.9a
8.5 ± 0.7d
21.4 ± 1.3b
15.9 ± 1.1c
17.4 ± 0.9c
23.2 ± 1.7b
CAT (Micro/Miligram protein)
21.4 ± 1.5a
6.8 ± 0.6c
16.5 ± 0.8b
15.2 ± 0.8b
14.8 ± 1.3b
19.9 ± 1a
GR (Unit/Mililitre protein)
3.2 ± 0.3a
21.7 ± 1.5d
8.9 ± 0.6b
12.9 ± 0.8c
13.5 ± 0.8c
7.3 ± 0.7b
GPx (Unit/Mililitre protein)
1.7 ± 0.1a
0.4 ± 0.0b
1.5 ± 0.1a
1.5 ± 0.1a
1.5 ± 0.1a
1.7 ± 0.1a
Liver
SOD (Micro/Miligram protein)
42.1 ± 3.7a
17.5 ± 1d
33.1 ± 2.1b
25.8 ± 1.9c
24.7 ± 1.2c
36 ± 2.7b
CAT (Micro/Miligram protein)
31.5 ± 2.4a
9.4 ± 0.9d
25.1 ± 1b
18.7 ± 0.8c
19.6 ± 0.9c
26.6 ± 1.3b
GR (Unit/Mililitre protein)
6.1 ± 0.4a
20 ± 1.1e
9.9 ± 0.6b
16.2 ± 1.1d
13.2 ± 0.6c
7.1 ± 0.5a
GPx (Unit/Mililitre protein)
2.5 ± 0.3a
0.9 ± 0.0c
1.9 ± 0.1b
1.7 ± 0.1b
1.7 ± 0.0b
2.3 ± 0.2a
3.7 Effect of Au NPs-CS nanocomposite on the S1PR1 and S1PR5 mRNA expression
S1PR1 and S1PR5 are two important immune receptors which have protective roles in many hematological disorders (Nishimura et al., 2010). They are very crucial in guiding T- and B-lymphocyte to release from the lymph nodes and thymus into blood and immediately the surface expression of S1PR1 and S1PR5 is rapidly down-regulated due to high levels of S1P in the blood and lymph (Cahalan et al., 2011; Lo et al., 2005). These two are expressed in many hematological malignancies including AML (Kluk et al., 2013). The leukemic cells reduce the S1PR1 and S1PR5 expressions and hinders their release into the circulation. Hence, the lymphocyte count in the blood and immune system is diminished (Nishimura et al., 2010). In our study, mRNA expression of S1PR1 and S1PR5 in lymphocytes are found to be augmented by 36.8, 22.6, 21.3, 5.9 and 5.7 folds and 45.2, 29.9, 28.3, 6.4, and 5.9 folds respectively in the control, Au NPs-CS nanocomposite, Daunorubicin, HAuCl4 and chitosan treated groups as compared to the untreated ones (Fig. 7). Daunorubicin and Au NPs-CS nanocomposite treatment were found to be most effective.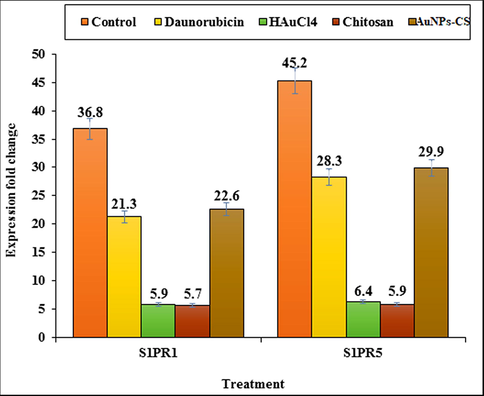
Expression fold change of S1PR1 and S1PR5 in control, Daunorubicin, HAuCl4, chitosan, and Au NPs-CS nanocomposite groups in comparison to the untreated group.
3.8 Effect of Au NPs-CS nanocomposite on the stereological parameters
Cancer cachexia is a wasting syndrome that involves weight loss due to breakdown of muscles and fat in the body (). In our study we observed a significant weight loss (p ≤ 0.05) in the AML induced untreated mice after six weeks as compared to the Daunorubicin, HAuCl4, chitosan and Au NPs-CS nanocomposite treated mice (Fig. 8). Rather, they gained weight when administered with Daunorubicin and Au NPs-CS nanocomposite.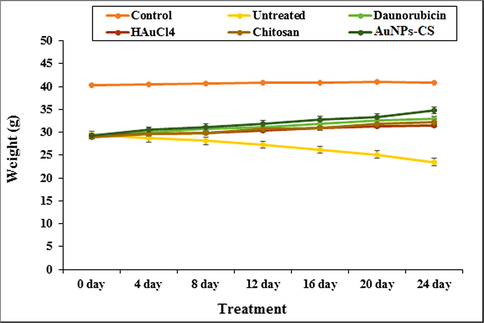
The change in body weight in tested groups.
An investigation on the other stereological parameters showed that DMBA aggravates the leukemic myeloblasts as well as the increases the weight and volume of liver and spleen (p ≤ 0.05). It enhances the volumes of white pulp, follicle, and marginal zone in spleen as well as the volumes of hepatocyte, sinusoid, bile duct, hepatic artery, portal vein, and central vein in liver significantly (p ≤ 0.05). In a previous study it is reported that cancer-inducing substances increase the circulating neutrophils and other leukocytes, which in turn enlarges the spleen and liver, called as Hepatomegaly and splenomegaly (Tao et al., 2008; Johnson et al., 1985). Now, it is observed from our results that Daunorubicin, HAuCl4, chitosan and Au NPs-CS nanocomposite have reduced those parameters significantly (p ≤ 0.05) by permeating into liver and spleen. Au NPs-CS nanocomposite exhibited the best result where there were no significant changes (p ≤ 0.05) in the volume of vessel in spleen as well as the hepatocyte and sinusoid in liver as compared to control groups (Table 4, Fig. 9). Non-identical letters reveal a notable shift between the experimental groups (p ≤ 0.01).
Parameters
Groups (n = 10)
Control
Untreated
Daunorubicin
HAuCl4
Chitosan
AuNPs-CS
Spleen
Total spleen (mg)
122.4 ± 8.4a
211.7 ± 13.9d
150.4 ± 8.5b
169.9 ± 7.8c
172.6 ± 11.3c
146.3 ± 9.4b
Total spleen (mm3)
116.3 ± 8.2a
195.7 ± 13.6d
143.8 ± 8.1b
163.7 ± 7.5c
166.8 ± 11.3c
140.6 ± 9b
Red pulp (mm3)
70.9 ± 5.4a
40.1 ± 4.2c
58.7 ± 6.2b
55.2 ± 5.2b
56.1 ± 6.1b
59.2 ± 4.8b
White pulp (mm3)
45.4 ± 4.1a
155.6 ± 11.7d
85.1 ± 6.6b
108.5 ± 9.3c
110.7 ± 8.5c
81.4 ± 7.1b
Marginal zone (mm3)
30.1 ± 1.9a
88.4 ± 8.1d
59.4 ± 4.2b
73.1 ± 5.3c
73.3 ± 5.9c
59.3 ± 4.4b
Vessel (mm3)
26.5 ± 2a
22.9 ± 1.2a
24.4 ± 1.5a
23.7 ± 1.1a
24.1 ± 1.3a
25.2 ± 1.3a
Follicle (mm3)
15.3 ± 0.7a
67.2 ± 5.3d
25.7 ± 1.1b
35.4 ± 2.6c
37.4 ± 2.9c
22.1 ± 0.9b
Liver
Total liver (mg)
975.3 ± 29.9a
1504.8 ± 32d
1106.8 ± 27.8b
1225.7 ± 30.5c
1264.2 ± 33.8c
1087.5 ± 27.5b
Total liver (mm3)
953 ± 29.2a
1481.7 ± 31d
1076.4 ± 27b
1203.7 ± 29.9c
1242.7 ± 32.7c
1059.2 ± 26.3b
Hepatocyte (mm3)
804.5 ± 19.6a
1109.8 ± 29.6c
836.3 ± 22.7a
914.3 ± 25.3b
954.6 ± 29.1b
817.9 ± 26.5a
Central vein (mm3)
68.4 ± 5.6a
129.4 ± 11.7d
85.7 ± 7.2b
107.1 ± 8.4c
104 ± 7.2c
87.3 ± 6.8b
Sinusoid (mm3)
57.8 ± 4.8a
97.3 ± 7.9c
71.6 ± 4b
76.8 ± 6.3b
79.8 ± 6.9b
62.1 ± 3.9a
Portal vein (mm3)
39.7 ± 3.4a
68.3 ± 5.8c
52.1 ± 5.2b
56.4 ± 4.6b
54.9 ± 4.3b
51.7 ± 6b
Bile duct (mm3)
11 ± 0.9a
43.8 ± 2.8d
22.9 ± 1.7b
29.9 ± 2.3c
27.6 ± 1.3c
21.5 ± 0.9b
Hepatic artery (mm3)
6.4 ± 0.7a
33.1 ± 2.6c
7.8 ± 0.8a
19.2 ± 0.9b
21.8 ± 1.3b
18.7 ± 1.1b
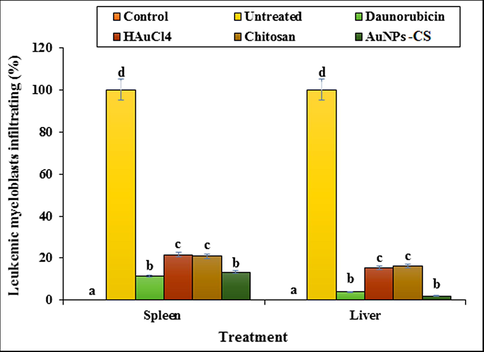
The percentage of leukemic myeloblasts in spleen and liver in tested groups.
4 Conclusion
In summary we report the green synthesis of Au NPs-CS nanocomposite being synthesized by deposion in situ bioreduced Au NPs over chitosan. The material was physicochemically characterized using UV–Vis and FT-IR spectroscopy, FESEM, TEM and EDX analysis. Average diameters of the particles were ∼30–40 nm. The Biological studies of synthesized Au NPs-CS nanocomposite were carried out with the material in exploring its potential in acute myeloid leukemia (AML), in vitro with standard cancer cell lines and in vivo with DMBA injected AML induced mice. The nanocomposite had low cell viability against Murine C1498 and 32D-FLT3-ITD cell lines without any cytotoxicity on HUVEC cell line. Au NPs-CS nanocomposite was found to exhibit outstanding potential in increasing the mRNA expression of S1PR1 and S1PR5 receptors, comparable to standard Daunorubicin drugs. It also regulated the levels of immunological, biochemical, hematological, and stereological parameters as suitable as Daunorubicin.
Declaration of Competing Interest
The authors declare that they have no known competing financial interests or personal relationships that could have appeared to influence the work reported in this paper.
References
- Int. J. Hydrog. Energy. 2019;44:2711.
- Colloids Surf. B Biointerfaces. 2013;110:313-320.
- J. Colloid Interface Sci.. 2016;462:272.
- Int. J. Biol. Macromol.. 2018;111:832.
- Pharmacogen. J.. 2009;10:961-969.
- Nat. Chem. Biol.. 2011;7:254-256.
- Int. J. Hyg. Environ. Health. 2011;214:442.
- Microb Biotechnol.. 2011;4:687-699.
- Biomed. Res.. 2015;27:214-219.
- Science. 2002;295:975.
- Int. Nano Lett.. 2015;5:215.
- Int. Nano Lett.. 2015;5:215-222.
- J. Environ. Manage.. 2009;90:2313.
- Appl. Organomet. Chem.. 2018;32:e4458.
- J. Colloid Interface Sci.. 2019;545:128.
- Polyhedron. 2019;158:8-14.
- Appl. Organometal. Chem.. 2020;34:e5267.
- Appl. Organometal. Chem. 2020;34:e5274.
- J. Environ. Manage.. 2020;258:110050.
- Procedia Eng.. 2016;165:1673.
- J. Electroanal. Chem.. 2013;701:502013.
- Int. J. Cell. Clon.. 1985;3:91-105.
- Ann. Hematol.. 2006;85:86-94.
- J Membr. Biol.. 2011;239:115-122.
- Adv. Exp. Med. Biol.. 2015;867:115-124.
- Lab Invest.. 2013;93:462-471.
- Appl. Surf. Sci.. 2016;363:66.
- J. Hazard Mater.. 2019;371:506.
- J. Exp. Med.. 2005;21:291-301.
- Mater. Sci. Eng. C. 2019;105:110112-110122.
- Green Chem.. 2010;12:1540-1543.
- New J. Chem.. 2018;42:1757.
- J. Mol. Liq.. 2018;262:248.
- J. Clean. Prod.. 2018;187:296.
- J. Mater. Sci.: Mater. Electron.. 2018;29:17054.
- Modern Pathol.. 2010;23:439-449.
- Mater. Chem. Phys.. 2020;244:122687.
- Arab. J. Chem.. 2020;13:3112-3122.
- Sci. Rep.. 2020;10:6535.
- Arab. J. Chem.. 2019;12:3576-3600.
- J. Am. Chem. Soc.. 2009;131:1775-1779.
- Int. J. Mol. Sci.. 1979;19:2018.
- Artif. Cells Nanomed. Biotechnol.. 2016;44:1949-1957.
- Artif. Cells Nanomed. Biotechnol.. 2016;44:811-816.
- Artif. Cell. Nanomed. B. 2019;47:4012-4019.
- New J. Chem.. 2017;41:5075-5081.
- BMC Cancer. 2008;8:228.
- Inorg. Chem. Front.. 2018;5:354.
- J. Clean. Prod.. 2017;70:1536.
- Int. J. Biol. Macromol.. 2017;113:186-194.
- J. Catal.. 2018;365:204-212.
- Mater. Sci. Eng. C. 2019;97:624-631.
- RSC Adv.. 2019;9:41581.
- Mater. Sci. Eng. C. 2019;100:445-452.
- The Lancet. 2016;388:1545-1602.
- Chem. Eng. J.. 2018;334:1502.
- Angew. Chem.. 2012;51:11700.
- Blood. 2015;125:2477-2485.
- Artif. Cell. Nanomed. B. 2018;47:512-523.
- Nanoscale. 2014;6:7666.
- Mol. Carcinog.. 2009;48:713-723.
- Appl. Organomet. Chem. 2019
- [CrossRef]
- Appl. Organomet. Chem. 2019:e4961.
- Appl. Organomet. Chem. 2019
- [CrossRef]
- Int. J. Biol. Macromol.. 2020;160:1252-1262.
- ACS Appl. Mater. Interfaces. 2018;10:30.


