

Translate this page into:
Synthesis and characterization of fluorescent N-CDs/ZnONPs nanocomposite for latent fingerprint detection by using powder brushing method
⁎Corresponding author. kriveshinip@uj.ac.za (Kriveshini Pillay)
-
Received: ,
Accepted: ,
This article was originally published by Elsevier and was migrated to Scientific Scholar after the change of Publisher.
Peer review under responsibility of King Saud University.
Abstract
This study reports the first new approach of using nitrogen functionalized carbon dots coated on zinc oxide nanoparticles (N-CDs/ZnONPs) as a novel nanocomposite for latent fingerprint detection using the powder brushing method. N-CDs/ZnONPs nanocomposite was prepared using melamine, potato peel waste and zinc acetate dehydrate as precursors. This nanocomposite was characterized by Fourier-transform infrared spectroscopy, UV–Visible spectroscopy, Fluorescence spectroscopy, X-ray diffraction, Raman spectroscopy, Zeta nanosizer, Scanning Electron Microscope, Energy-Dispersive X-ray Spectrometry and Transmission Electron Microscopy. The size of N-CDs was around at 50–20 nm and ZnONPs was around at 40–50 nm. The quantum yield of N-CDs increased the fluorescence intensity of the fluorophore by 5.54%. The N-CDs were coated on surface of ZnONPs to increase the quantum yield and increase the blue emission after formation of N-CDs/ZnONPs by 5.12%.
The N-CDs/ZnONPs nanocomposite demonstrated extraordinary sensitivity and selectivity for Latent Fingerprint (LPF) detection on the distinctive non-porous substrates which included aluminum foil, aluminum sheets, an aluminum rod, an iron disc, a compact disc, a black mat, white marble and magazine paper. This nanocomposite acts as a labeling agent and it helped to detect LFP with clear readability ridges and high contrast fingerprint images under UV light irradiation. N-CDs/ZnONPs nanocomposite additionally demonstrated superior ability to reveal readability ridges and clarity and high contrast LFP images with 415 nm and 450 nm light sources and a yellow filter by using a Living Image Microscope. This nanocomposite exhibited advantages such as improved efficiency, a non-toxic nature, good optical properties and good results in the LFP detection of the freshly applied fingerprints. N-CDs/ZnONPs nanocomposite is, therefore, a good alternative material for detection of latent fingerprints in crime investigations.
Keywords
N-CDs/ZnONPs nanocomposite
Latent fingerprint detection
Powder method

1 Introduction
One dimensional nanoparticles have demonstrated excellent optical, electrical, mechanical, magnetical and chemical properties (Kargar et al., 2015; Chadha et al., 2014; Xie et al., 2009; Wang and Zhou, 2014; Edison and Sethuraman, 2013). Carbon Dots (CDs) act as one dimensional nanoparticles with less than 10 nm size range and have been synthesized by a broad range of methods including the laser ablation method, electro-oxidation, vapor deposition, hydrothermal methods and microwave methods (Minati et al., 2012; Lim et al., 2015; Wang and Hu, 2014). Recently, most of the researchers have been using hydrothermal methods for the synthesis of carbon dots (CDs) from vegetable and fruit wastes and other food sources. Such inexpensive wastes contain citric acid and tannic acids which are both sources of carbon. The hydrothermal method of synthesis using these wastes is quite simple, easily controlled and the energy consumption is very low (J. Wang et al., 2014; Y. Wang et al., 2014; Lu et al., 2012; Park et al., 2014; J. Xu et al., 2014; M. Xu et al., 2014; Prasannan and Imae, 2013). Carbon dots prepared by these methods are promising nanomaterials due to their eco-friendly and non-toxic nature biocompatibility, photo-bleaching, photo-catalysis, photovoltaic, bio-imaging, metal ions sensing and better luminescence properties (Chaudhary and Bhowmick, 2015; Atchudan et al., 2016; Shi et al., 2015; Su and Schlogl, 2010; Sun et al., 2006). The fluorescence property of carbon dots depends on size, passivating agents, pH, dopants and solvents (Baker and Baker, 2010; Zhu et al., 2009; Mitra et al., 2011). Amongst them, the dopant could be a very essential parameter to increase the luminescence of the carbon dots. Nitrogen, sulfur and boron are dopants which were used to increase the luminescence intensity and enhance various applications with cell imaging, biology, catalysis, optical and sensors (LeCroy et al., 2014; Pan et al., 2010; Yang et al., 2014).
Potato is a vital food supply for humans that supplies carbohydrates, such as starch, sugar and other polysaccharides. It is also rich in C, O and H and these elements are effortlessly found in functional groups such as hydroxyl and carboxylic groups on the surface of carbon dots. These functional groups help to improve water solubility, enhanced luminescence and allow for easy doping (Bourlinos et al., 2015; Xu et al., 2015). Melamine is one of the organic compounds which is rich in nitrogen as it contains three types of amine groups. These amines are easily bound with carboxyl, hydroxyl and ketone groups and also increase the luminescence and result in high quantum yields.
Nowadays, metal oxide nanoparticles and carbon based metal oxide nanocomposites are becoming increasingly more popular as labeling agents which are used to develop latent fingerprints. Metal oxides such as TiO2 (Wade, 2002), Al2O3 (Sodhi and Kaur, 2006; Sodhi and Kaur, 2007), ZnO (Choi et al., 2008), SiO2 (Moret et al., 2016), CeO2 (Rohini et al., 2017) were used as labeling agents for the development of LFP detection with different substrates. LFP detection has also been developed by using carbon based metal oxide nanoparticles such as C-silica dioxide (Fernandes et al., 2016), carbon dots/SiO2 (Zhao et al., 2017), carbon-based silica nanohybrids (Li et al., 2017), C@titanium dioxide (Amith Yadav et al., 2018) and Fluorescent silica nanoparticles (Kim et al., 2016). Among them, ZnO is a semiconductor material with a band gap energy of 3.37 eV, good photoluminescence properties, low cost, high chemical stability, non-toxicity, easy preparation and chemical abundance (Djurisić and Leung, 2006). It has also exhibited an emission peak in the visible region which is dependent on the defects of materials (Djurišić et al., 2006). ZnO powder was applied for the enhancement of LFP detection by using small particles reagents (SPRs) in water with a detergent solution (Cucè et al., 2004). SPRs methods suffer from some disadvantages such as that suspension particles do not appear in the strong fluorescence fingerprint images in water and detergent solutions under UV light irradiation 365 nm. ZnO powders have provided good LFP images with clear ridge patterns by using the conventional powder method and also enhances the contrast between fingerprint sweat and the background substrate (Champod et al., 2004). This material is, therefore, very efficient for the development of LFP detection with non-porous substrates. Latent Fingerprint detection research is a completely unique area in forensic science because this identifies substances which in turn help to positively identify a criminal. The identification of clear and invisible latent fingerprint images is therefore imperative in solving crimes. Nowadays, the new approach that is extensively applied in LFP detection includes the application of nanotechnology where improved and clear LFP marks have been observed (Wang et al., 2015a, 2015b; Jin et al., 2008). Fluorescence nanoparticles are, therefore, important materials which enhance LFP detection in forensic science. The used luminescence materials include quantum dots, carbon dots (CDs) and polymer beads (Cai et al., 2013). Fluorescence materials have distinct character such as high sensitivity, enhanced contrast and increased selectivity (Wang et al., 2012; Li et al., 2016). Here, CDs act as labeling agents for better visibility and increased contrast for latent fingerprint detection under UV light irradiation. Although these suffer from demerits such as the use of heavy metals which are highly toxic, low cost-effective and require a very complicated preparation method, they were chosen for this study due to their good luminescence intensity in the solid state which has enabled them to be used as fluorescent ink. In this study, the N-CDs/ZnONPs nanocomposite was synthesized using eco-friendly and low cost precursors and it was applied as a labeling agent for the improvement of latent fingerprint detection. The N-CDs/ZnONPs nanocomposite powder was used to develop LFP images on unique non-porous substrates which included aluminum foil, aluminum sheets, an aluminum rod, an iron disc, a compact disc, a black mat, white marble and magazine paper with the powder brushing method. This nanocomposite powder was used to produce the fluorescence LFP images which could be viewed under UV light irradiation and a Live Imaging Microscope. The latent Fingerprint detection images were captured by an iPhone cell camera.
2 Experimental details
2.1 Materials
Potato peel waste was collected from domestic waste. Zinc acetate dehydrate (Zn (CH3COO)2·2H2O), polyvinylpyrrolidone, dialysis cellulose membrane 12,000 MW were purchased from Sigma-Aldrich and were of analytical grade. Sodium hydroxide (NaOH), Ethanol and KBr were purchased from Merck South Africa. Ultrapure de-ionized water (resistivity > 18.5 MΩ cm) was used to prepare the working solutions and was obtained from water purification systems (Milli-Q, Millipore). Solvents and other chemical compounds have been purchased from Sigma-Aldrich and were of reagent grade.
2.2 Synthesis of fluorescence N-CDs
Nitrogen functionalized carbon dots were synthesized from potato peel waste with melamine as a precursor. The potato peel waste was washed with water and dried in an oven at 100 °C for 3 h to obtain light brown or yellow potato peels. Thereafter, the dried potato peel waste was ground into a fine powder using a grinder. 2.0 g of potato peel waste was dispersed in 50 ml distilled water while stirring for 30 min to obtain a homogeneous solution. Thereafter, 2.0 g of melamine was added to the potato peel waste solution again while stirring for 30 min to form another homogeneous solution. This mixture was then transferred into a 100 ml Teflon coated autoclave and kept at 180 °C for 12 h (Liu et al., 2016). Then, the autoclave was cooled to room temperature and a yellowish brown solution formed. Dichloromethane (150 ml) solvent was added to the yellowish brown solution to settle the larger size carbon dots particles and remove unwanted particles. The N-CDs supernatant solution was centrifuged to obtain a brown colloidal solution which was transferred into a dialyzed membrane while stirring for 24 h at room temperature. After dialysis, the purified N-CDs solution was dried at room temperature to obtain a brown solid for characterization purposes. N-CDs synthesized with a reaction time of 12 h in the autoclave were used for further characterization and applications. The schematic diagram of the N-CDs synthesis is shown in Fig. 1.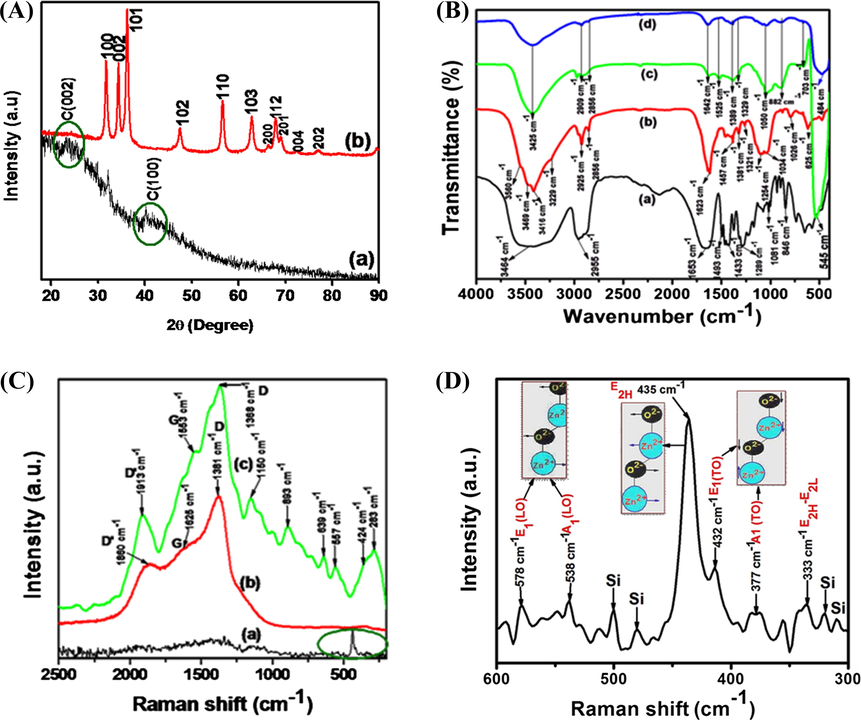
(A) XRD patterns of (a) N-CDs and (b) N-CDs/ZnONPs nanocomposite, (B) FTIR spectra of (a) PVP, (b) N-CDs, (c) ZnONPs and (d) N-CDs/ZnONPs nanocomposite, (C) Raman spectra of the (a) ZnONPs, (b) N-CDs and (c) N-CDs/ZnONPs nanocomposite and (D) Expand of curve C (a) ZnONPs indicated green circle in the range 300–600 cm−1.
2.3 Preparation of ZnONPs
4.0 g (0.1 M) of zinc acetate hydrate Zn (CH3COO)2·2H2O was introduced in 100 ml of de-ionized water with vigorous stirring for 30 min. Thereafter, 2.0 g of PVP was mixed in 100 ml zinc acetate hydrated solution with vigorous stirring again 30 min at room temperature. 0.8 g (0.4 M) of NaOH in 50 ml aqueous solution was slowly (for 15 min) added into the mixture at pH 12 under stirring. The mixture was stirred at 80 °C for 2 h and, when being cooled, a white precipitate was formed. Thereafter, the white precipitate was stored at room temperature to settle the ZnONPs and, then, ZnONPs were washed with de-ionized water and ethanol several times and dried at 80 °C overnight (Debanath and Karmaka, 2013). Finally, the ZnO nanoparticles were calcined at 450 °C in the muffle furnace at the rate of 2 °C/min for 3 h, as shown in Fig. 2.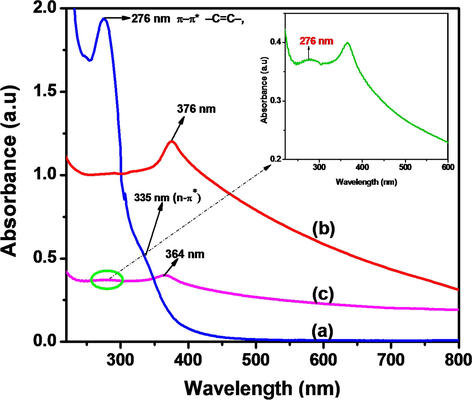
UV–Vis spectra of (a) N-CDs, (b) ZnONPs and (c) N-CDs/ZnONPs nanocomposite; inset N-CDs peak.
2.4 Preparation of N-CDs/ZnONPs nanocomposite
0.5 g of ZnONPs and 0.1 g of N-CDs were added into 25 ml de-ionized water with vigorous stirring conducted overnight at room temperature. The solution was centrifuged to obtain a faint yellow precipitate and washed with water. Finally, a faint yellow solid was obtained after drying at room temperature for 12 h, as shown in Fig. 3.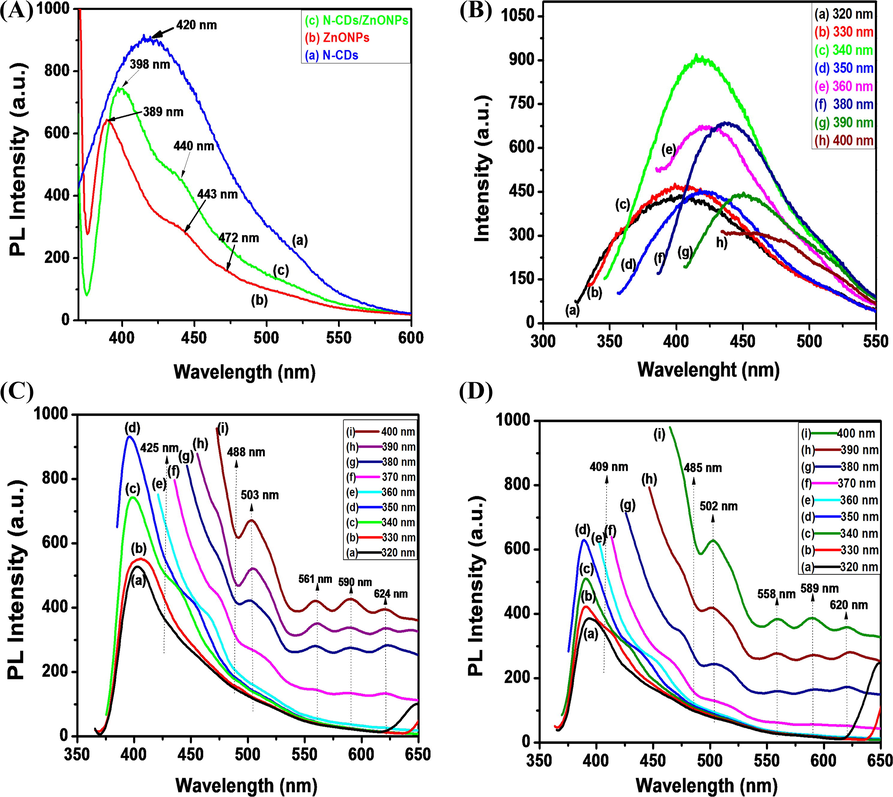
(A) comparisons of fluorescence spectra of (a) N-CDs, (b) ZnONPs and (c) N-CDs/ZnONPs nanocomposite, Fluorescence spectra of (B) N-CDs, (C) ZnONPs and (D) N-CDs/ZnONPs nanocomposite at different excitation wavelength.
2.5 Characterization techniques
The optical properties of N-CDs, ZnONPs and N-CDs/ZnONPs nanocomposite were investigated using a Schimadzu UV-1208 model UV–Vis spectrophotometer (Japan). The fluorescence measurements of the N-CDs, ZnONPs and N-CDs/ZnONPs were conducted using a Perkin Elmer Spectrum spectrometer. The functional groups were identified by a Perkin-Elmer PE 1600 FTIR spectrophotometer (USA) in the range of 4000–400 cm−1 and KBr was used for the pellet fabrication. X-ray diffraction characterizations were conducted by Panalytical XPertPro X-Ray Diffractometer with Philips PW1729 diffractometer with Cu Kα radiation (λ = 1.5406 Å) operating at 45 kV and 40 mA. The Raman spectra were used to identify the stretching vibration modes of nanoparticles with operating system PerkinElmer Spectrum two spectrometers at a laser excitation line of 532 nm. A zetasizer (Malvern) was used to find the stability and charge of the synthesized NPs. Size distribution and zeta potential measurements of the CDs were conducted using a Malvern Zetasizer Nano ZS 90. The morphology and elemental composition of the nanomaterials were investigated using a Scanning Electron Microscope (TESCAN, VEGA SEM) at the electron acceleration voltage 20 kV with carbon coating for image quality. The size of the nanomaterials in N-CDs, ZnONPs and N-CDs/ZnONPs nanocomposite were determined by using Transmission electron microscope (TEM JEOL JEM-2100F) with an electron accelerating voltage of 90 kV. The pH measurements were performed with an OHAUS starter 2100 (USA). The fluorescence images of N-CDs, ZnONPs and N-CDs/ZnONPs nanocomposite were viewed using a UV-lamp with CN-15-LL Model; two UV hand lamps model BVL-6 and white-light source, Tubes 2 × 15 W, wavelength 365 nm and Tubes 2 × 15 W, wavelength 254 nm, power-120 W. The latent Fingerprint images and fluorescence images were captured under UV-light irradiation by using an iPhone camera.
2.6 Fingerprints development
The latent fingerprint detection was conducted by using the powder dusting method with N-CDs/ZnONPs nanocomposite powder as a labeling reagent. The voluntary fingerprint donors washed their hands with soap first and then dried their hands under exposure to air before applying their fingerprints to the various surfaces. The fingerprints were applied by smoothly rubbing the tips of the fingers and thumbs onto the different substrate areas. The latent fingerprint images were captured by using an iPhone camera under 365 nm UV light irradiation.
2.7 Development of LFP detection by using N-CDs/ZnONPs nanocomposite
The powder method was used to identify the latent fingerprints on various surfaces such as aluminum foil, aluminum sheets, an aluminum rod, an iron disc, a compact disc, a black mat, white marble and magazine paper. Then, the N-CDs/ZnONPs nanocomposite powder was spread uniformly on the finger residue using a brush to determine extent of the latent fingerprint detection. The latent fingerprint detection images and fluorescence images were captured using an iPhone camera under UV irradiation 365 nm as shown in Fig. 4.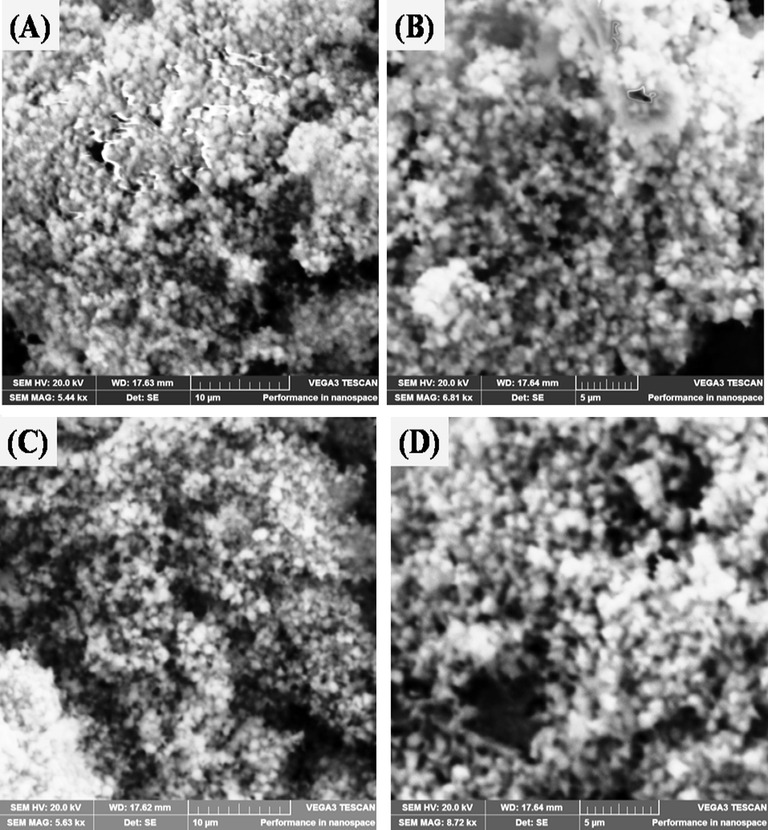
SEM images of (A&B) low magnification at 10 µm and high magnification at 5 µm of ZnONPs. (C&D) low magnification at 10 µm and high magnification at 5 µm of N-CDs/ZnONPs nanocomposite.
2.8 Quantum yield calculation
The fluorescence quantum yield (QY) of N-CDs and N-CDs/ZnONPs nanocomposite has been calculated by comparison of integrated fluorescence intensity at the excited wavelength of 320 nm and it was obtained from a UV–visible spectrophotometer. Quinine sulfate in 0.1 M H2SO4 as standard with QY = 54% as per literature reports (Roy et al., 2015) was dissolved in different concentrations in ultrapure water and also tested samples of N-CDs and N-CDs/ZnO nanocomposite were made up at different concentrations in ultrapure water and also tested samples of N-CDs and N-CDs/ZnO nanocomposite were made up to different concentrations in ultrapure water. The solution absorbance must be much less than 0.1 (reduced the inner-filter effects) at their excitation wavelengths. The emission spectra of the samples excited at 320 nm were recorded by a fluorescence spectrometer. The area under the photoluminescence curve over the range from 320 to 700 nm was integrated for all samples. Then, the quantum yield was calculated by using Eq. (1).
3 Results and discussion
3.1 X-ray characterizations
The crystalline and amphorous state of N-CDs and N-CDs/ZnONPs nanocomposite were showed by X-ray diffraction as shown in Fig. 1A (a & b). For N-CDs, two diffraction peaks at 2θ = 23.87° and 42.82° corresponding to (0 0 2) and (1 0 0) x-ray diffraction plane respectively, as shown in Fig. 1A (a). These two peaks were due to the disordered graphite carbon and hexagonal structure of N-CDs (Atchudan et al., 2015). The disordered graphite carbon of N-CDs d-spacing was calculated by Bragg formula with use the C (0 0 2) and C (1 0 0) diffraction peaks. The Bragg Eq. (2) is
3.2 FTIR characterization
In Fig. 1B (a), the FTIR spectra of PVP which has different functional groups are shown. The broad peak at 3464 cm−1 was due to stretching vibration of O-H group, which confirmed the water molecules. The sharp peak at 1653 cm−1 was assigned to C⚌O stretching vibration. The peaks at 1493 cm−1 and 1433 cm−1 appeared as the CH2 bending vibration, while those at 1289 cm−1 and 1081 cm−1 were due to the C—N stretching vibration of pyrrole of PVP. The small broad peak observed at 2955 cm−1 is due to asymmetric C—H stretching vibration of a CH2 group (Han et al., 2011). Fig. 1B (b) shows that the FTIR spectrum of N-CDs displayed four distinct peaks at 3560 cm−1, 3469 cm−1, 3416 cm−1 and 3229 cm−1 and these corresponded to —OH stretching, —NH2 primary amine stretching vibration, —NH2 another primary amine stretching vibration and —NH2 primary amine bending vibration, respectively (Li et al., 2015). The low-intensity peaks at 2925 and 2856 cm−1 were assigned to C—H bond stretching vibration of N-CDs. The sharp peak at 1623 cm−1 corresponded to the stretching vibration of the —CONH— group and the small intensity peak at 1457 cm−1 was assigned to —C—N (amine III) stretching vibration. The peaks at 1381 cm−1, 1321 cm−1, 1254 cm−1 and 1034 cm−1 were assigned to bending vibration of —C⚌H and ⚌C—H groups, stretching vibration of —C—O and C—O—C groups. The peaks at 1026 cm−1 and 625 cm−1 were the bending vibrations of the triazine ring of melamine on CDs. Therefore, the spectra shown in Fig. 1B (b) confirmed the successful preparation of N-CDs using melamine as a precursor. Fig. 1B (c) shows the FTIR spectrum of PVP capped ZnONPs which showed a large peak at 3425 cm−1 due to the —OH stretching vibration of water. The peaks at 1642 and 1389 cm−1 exhibited the symmetric and asymmetric stretching vibrations of the -C⚌O group. The peak was shifted from 1653 cm−1 (curve (a)) to 1642 cm−1 (curve (c)) and decreased in intensity due to the PVP strong bound with ZnONPs, as shown in Fig. 1B (c). The low intensity peak at 882 cm−1 was due to the C—O of stretching vibration. The sharp intense peak was observed at around 545 cm−1 because of the Zn—O bond vibration. N-CDs/ZnONPs nancomposite also showed peaks at 3425 and 1642 cm−1 corresponding to —NH2 amine and amide —CO—NH2 groups. The Zn—O peak slightly shifted to 484 cm−1 and decreased in intensity due to N-CDs being strongly bound to ZnONPs (Li et al., 2013). This confirmed that N-CDs were coated onto ZnONPs, as shown in Fig. 1B (d).
3.3 Raman characterization
The stretching vibrations of (a) ZnONPs, (b) N-CDs and (c) N-CDs/ZnONPs nanocomposite were investigated by Raman spectroscopy, as shown in Fig. 1C (a–c). It is very difficult to see the symmetry and atom coordination in Fig. 3B (a) because only the Raman spectra are shown. The ZnONPs has optical phonons with the Brillouin zone, which is corresponding to the irreducible representation Γopt = A1 + E1 + 2E2 + 2B1 (Calleja and Cardona, 1977). A1 and B1 vibration modes are called as one-fold degeneracy and E1 and E2 vibration modes are referred to as twofold degeneracy. A1 and E1 vibration modes are Raman and IR active, E2 double degeneracy vibration modes are Raman active only and B1 vibration modes were inactive in Raman and IR (Damen et al., 1966). ZnONPs shows several Raman vibration modes which had been located wherein the maximum in which the most intense peak was noted at 435 cm−1, that is assigned to E2H modes of due to maximum oxygen atoms which are involved this vibration mode. And it was moved in the opposite direction against the Sublattice of Zn2+ ions and becomes zero and this E2 mode is called non-polar modes as shown in Fig. 1C (a). The A1 and E1 modes exhibited the oxygen-rich mode and polar modes and these modes further split the extra two LO and TO components due to a polarity induced electrical field. These modes further were converted into four vibration modes such as A1 (TO) 377 cm−1 and A1 (LO) cm−1, E1 (TO) 432 cm−1 and E1 (LO) 578 cm−1, which together with 432 cm−1, 377 cm−1 and 333 cm−1 were marked by the green line circle in (Fig. 1C (a)) and also expanded the spectrum as shown in Fig. 1D. Raman second-order active modes (E2H-E2L) were observed at 333 cm−1 due to zone-boundary phonons of ZnONPs (Chen et al., 2005).
Fig. 1C (b) shows the Raman spectrum of N-CDs where three peaks were observed at 1381, 1625 and 1860 cm−1 corresponding to D-, G- and D′-bands, respectively. The high D-band intensity confirmed the quantity of disordered sp3 graphite carbon atoms and the high G-band intensity also determined the sp2 ordered of graphite carbon atoms (Wu et al., 2015). The vibration of carbon atoms of dangling bonds at the edges of the plane of the disordered graphite carbon atom (D-band). The G-band was based on E2g mode vibration of graphite sp2 carbon-carbon atoms in a two dimensional hexagonal lattice. The graphite carbon atoms in N-CDs were confirmed with intensity ratio of D-band and G-band (ID/IG). The intensity ratio ID/IG less than 1 indicated the perfect graphite carbon atoms of N-CDs and the ratio (ID/IG) > 1 confirmed some structural defects in graphite (Atchudan et al., 2013). Hence, for the N-CDs the intensity ratio ID/IG = 1.02 was calculated, which confirmed the partial graphitization of carbon atoms (Shen et al., 2012). The low intensity peak at 1860 cm−1 which is based on D'-band of disordered graphite sp3. This peak appeared to depend on the effect of laser light. The D′ band does not related to the graphite hybridization of carbon atoms in the of N-CDs sample. The above results confirmed that N-CDs contained a good distribution of graphitic carbon atoms and less surface defects as shown in Fig. 1C (b).
The Raman spectrum of N-CDs/ZnONPs nanocomposite revealed several active modes, as shown in Fig. 1C (c). ZnONPs Raman active modes of A1 + E1 + 2E2 decreased the intensity, polarity of E1 active mode of E1 (TO) and E1 (LO) phonons were also reduced in intensity, A1 (LO) polar symmetry shifted to a higher value at 557 cm−1 and E2 (high) vibration mode of a Zn-O band shifted to a lower value at 424 cm−1 because of the N-CDs doped on ZnONPs as shown in Fig. 1C (c). The additional vibration modes were recorded at 283, 639 and 839 cm−1 due to some defects of ZnONPs (Friedrich and Nickel, 2007). For N-CDs/ZnONPs nanocomposite three peaks were increased in and shifted at 1365 cm−1, 1553 cm−1 and 1913 cm−1 corresponding to D-band, G-band and D′-band of N-CDs, respectively as shown in Fig. 1C (c). In a result, the N-CDs/ZnONPs nanocomposite G-band and D-band intensity ratio (ID/IG) increased to 1.22. The N-CDs/ZnONPs nanocomposite also showed a graphitization degree of carbon atoms and the ID/IG ratio provided direct evidence a degree of disordered of C-C atoms in N-CDs (Yu et al., 2012), as shown in Fig. 1C (c). The peak at 1913 cm−1 was also increased in intensity, which is assigned to D'-band for disordered graphite sp3 carbon atom against D-band. We confirmed that N-CDs strongly bounded to ZnONPs, as shown in Fig. 1C (c). The glass Si peak was noted at 1150 cm−1.
3.4 UV–visible characterization
The optical characterization of N-CDs, ZnONPs and N-CDs/ZnONPs nanocomposite was carried out by UV–visible spectroscopy, as shown in Fig. 2(a–c). Fig. 1B (a) displays two peaks at 276 nm and 335 nm for the n-π* electronic transition of —C⚌O and —C⚌N groups and π-π* transition of -C⚌C— group, respectively (J. Wang et al., 2014; Y. Wang et al., 2014). The transition peaks confirmed the formation of nitrogen functionalized on carbon dots and these peaks are produced by carbon dots due to Mie scattering (Qu et al., 2012). The UV-spectrum of the ZnONPs revealed the absorption peaks at 376 nm due to semiconductor properties with the calculated band gap energy (3.19 eV), as shown in Fig. 2 (b). The UV-spectrum of the N-CDs/ZnONPs nanocomposite showed two low intensity peaks around at 276 and 364 nm, and the 276 nm peak confirmed the π-π* transition of N-CDs due to its decreased intensity. The ZnONPs peak shifted to around 364 nm. Therefore, the results depicted in Fig. 2 (c) (inset) confirm that the successful formation of the NCDs/ZnONPs nanocomposite.
3.5 Fluorescence characterization
The fluorescence spectra of N-CDs, ZnONPs and N-CDs/ZnONPs nanocomposite, which are essential in comparing the fluorescence properties, were recorded at the same excitation wavelength of 340 nm as the UV spectra. Fig. 3A (b) shows the fluorescence spectrum of ZnONPs where three peaks were observed at 389, 443 and 472 nm, where 389 nm luminescence peak is based on the near-band-edge emission of ZnONPs (Dutta et al., 2010). Other luminescence peaks of ZnONPs at 443 and 472 nm are due to oxygen vacancies and Zn vacancies, respectively. The photoluminescence of the N-CDs/ZnONPs nanocomposite exhibited two emission peaks at 398 and 440 nm because of the strong coating of N-CDs and defects in ZnONPs, as shown in Fig. 2A (c) (Haque et al., 2013). Fig. 3A (a) shows the intense emission peak at 420 nm whilst the excitation wavelength is 340 nm. These emission spectra have corresponded to the control of surface defects on N-CDs and uniform size of N-doped CDs with the synergic effect of the carbon dots (J. Xu et al., 2014; M. Xu et al., 2014). As seen in spectra shown in Fig. 3A (a) and Fig. 3A (c), the fluorescence spectra was not quenched and showed good fluorescence. Fig. 3(B–D) shows the fluorescence spectra of (B) N-CDs, (C) ZnONPs and (D) N-CDs/ZnONPs nanocomposite at different excitation wavelengths. The fluorescence spectra of N-CDs were excited at different wavelengths from 310 to 400 nm, as shown in Fig. 3B (a-h). For N-CDs, the maximum fluorescence intensity was observed under excitation around 340 nm, as shown in Fig. 3B (c). The emission peaks were red-shifted on the change the excitation from 350 to 390 nm and the intensity of fluorescing spectra were reduced by increasing the excitation wavelength (Wu et al., 2013). The N-CDs was exhibited the quantum yield 5.54% as shown in Fig. 3B (c). Fluorescence spectroscopy is an important method for analysis of the emission property of ZnONPs, as shown in Fig. 3C. The several emission peaks of ZnONPs were observed at different excitation because of various defects in ZnONPs, as shown in Fig. 3C (a–i). ZnONPs displayed strong intensity emission at 401, 403, 398 and 396 nm while the excitation wavelength changed from 320 to 350 nm, respectively, as shown Fig. 3C (a–d). The sharp emission peaks appeared due to Near-Band-Edge emission and the emission peaks observed from 425 to 488 nm are due to the transitions from interstitial zinc defect states of the conduction band to zinc vacancy states of valence band, as shown in Fig. 3C (e–i) (Bekeny et al., 2006; Lan et al., 2015). Four emission peaks were obtained at 503 (blue emission), 561 (blue-green emission), 590 (green emission) and 624 nm (orange-red emission) while the excited wavelengths were in the range of 360–400 nm. Fig. 3C (e–i) shows the blue and blue green emission peaks at 503 and 561 nm which were ascribed to electron transitions from the conduction band bottom to Oi energy level (Klason et al., 2008).
The green emission at 590 nm was exhibited for some Vo+ singly ionized oxygen vacancy defects in ZnONPs by recombination of the photo-generated hole with single oxygen charge stated of this defect, as shown in Fig. 3C. The orange-red emission peak is centered at 624 nm and this orange-red emission can be attributed to the transition from zinc interstitial (Zni) to oxygen interstitial (Oi) defect levels in ZnO (Ahn et al., 2009). The promising fluorescence properties of N-CDs/ZnONPs nanocomposites were confirmed by fluorescence spectroscopy, as shown in Fig. 3D (a–i). The N-CDs/ZnONPs nanocomposites exhibited the maximum fluorescence intensity peaks at the excitation wavelengths of 320–350 nm, as shown in Fig. 3D (a–d). The emission peaks were obtained at 409, 485, 502, 558, 589 and 620 nm when excitation wavelength was in the range of 360–400 nm, as shown in Fig. 3D (e–i). The intensity and wavelength of the emission peaks of N-CDs/ZnONPs nanocomposite were slightly shifted because of the N-CDs coating, which improved the crystalline and controlled vacancies in ZnONPs. N-CDs does not reduce their emission intensity and it is not quenched after coating on ZnONPs (Raoufi et al., 2013). The quantum yield of N-CDs/ZnONPs nanocomposite is 5.12%.
3.6 Zeta nanosizer characterization
The zeta nanosizer instrument is a very important tool for determining the stability, surface charge and size distribution of nanomaterials (Selvarajan and Mohanasrinivasan, 2013). Dynamic Light Scattering (DLS) technique was used for determination of the average size of N-CDs, ZnONPs and N-CDs/ZnONPs nanocomposite using Zetasizer, as shown in Fig. S1 (Supporting information). The particle sizes in N-CDs, ZnONPs and N-CDs/ZnONPs nanocomposite were found to be 792.3 nm, 468.3 nm and (198.5 nm and 1.18 µm), respectively, and these spectra are also shown in Fig. S1 (Supporting information).
The N-CDs was given the average particles size distribution from 100 nm to 1000 nm, in which melamine is used as nitrogen contents carbon dots as shown in Fig. S1 (A) (Supporting information). However, ZnONPs exhibited the smaller size due to PVP stabilization on ZnO nanoparticles that works against aggregation. After N-CDs coating, the size of N-CDs/ZnONPs nanocomposite powder became slightly smaller than sum of NCDs and ZnONPs. Zeta potentials were recorded for N-CDs, ZnONPs and N-CDs/ZnONPs nanocomposite and the values were −13.8, −11.0 and −14.4 mV, respectively, as shown in Fig. S2 (Supporting information). From this characterization, the PVP capped ZnONPs became negatively charged due to the repulsion between PVP and ZnONPs, and this reduced the agglomeration and long-time stability of ZnONPs (Hassan et al., 2019; Nagvenkar et al., 2016). The zeta potential of N-CDs/ZnONPs nanocomposite (−13.8 mV) had a higher negative charge compared to that of N-CDs and ZnONPs and this confirmed that N-CDs were coated on ZnONPs, as shown in Fig. S2 (Supporting information).
3.7 Surface morphology characterizations
The surface morphology of the ZnONPs and N-CDs/ZnONPs nanocomposite was investigated by Scanning Electron microscope (SEM), as shown in Fig. 4(A–D). The SEM image of ZnONPs consisted of white spots with very dense particles at the low magnification 10 μm as shown in Fig. 4(A). The SEM image of ZnONPs consisted of bright spots with very dense particles at low magnification 10 μm, as shown in Fig. 4(A). The maximum white dense particles of ZnONPs were observed at higher magnification 5 μm, as shown in Fig. 4(B). The N-CDs/ZnONPs nanocomposite exhibited almost dimmed and blackish images of ZnONPs at low magnification and high magnification of 10 μm and 5 μm, respectively. The blackish images provided evidence that N-CDs were loaded onto ZnONPs, as shown in Fig. 4(C & D).
3.8 TEM characterizations
The vegetable waste of potato peels was used for the synthesis of N-CDs with melamine as a nitrogen-rich precursor. The TEM images show that the hydrothermal synthesized N-CDs were obtained in the form of homogeneous dots and different spherical size particles as shown in Fig. 5(A–D). Fig. 5(A) shows the small dots and good dispersion of N-CDs particles at low magnification with the size 20 ± 10 nm of N-CDs for the hydrothermal reaction up to 12 h. A larger size of dots and spherical shaped N-CDs was obtained by the reaction time increase to 20 h, as shown in Fig. 5(B–D). Fig. 5(C & D) displayed that the large size and spherical shape of N-CDs nanoparticles were obtained at higher magnifications with different size ranges of (50 ± 20 nm) and (45 ± 15 nm). The higher magnification analysis of N-CDs confirmed the spherical shape, as shown in Fig. 6(D). Melamine was chosen as the substrate as it is, currently, the source richest in nitrogen and it easily functionalizes nitrogen on C-Ds with formation of uniform size N-CDs. The size and morphology of PVP-capped ZnONPs were confirmed by investigation on the Transmission Microscope, as shown Fig. 6(E–G). ZnONPs mostly had a spherical structure with dark colored merged particles due to PVP bound with the ZnONPs particles and drying methods, as shown in Fig. 5(E&F). The TEM images showed randomly and uniform spherical shapes of ZnONPs with size range of 40–50 nm which was taken at high magnification, as shown in Fig. 5(G). The SAED pattern clearly showed white dot particles that confirmed good crystalline nature of ZnONPs, as shown in Fig. 5(H).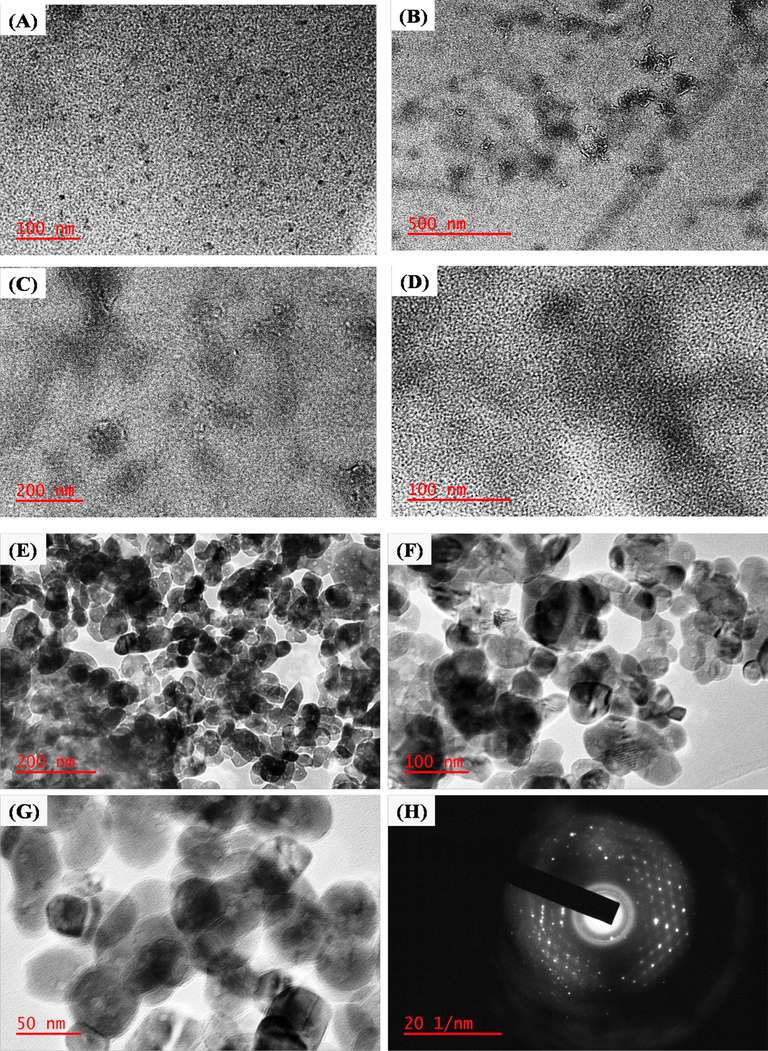
(A) TEM images of N-CDs with magnification 100 nm at reaction time 12 hr, (B) TEM images of N-CDs with magnification (B) 500 nm, (C) 200 nm and (D) 100 nm at reaction time 20 h. TEM images of PVP capped ZnONPs at different magnification of (E) 200 nm, (F) 100 nm and (G) 50 nm, (D) SAED pattern of ZnONPs.
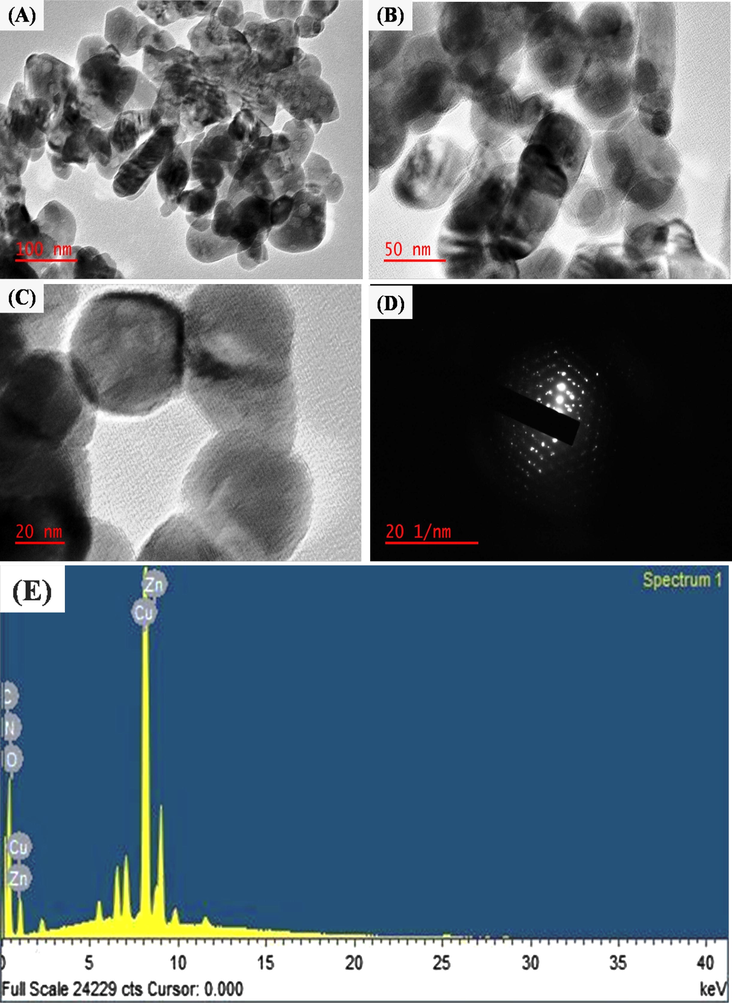
TEM images of N-CDs/ZnONPs nanocomposite with different magnification (A) 100 nm, (B) 50 nm and (C) 20 nm. (D) SAED pattern of N-CDs/ZnONPs nanocomposite, (E) Energy-dispersive X-ray spectra of N-CDs/ZnONPs nanocomposite.
The TEM images of N-CDs/ZnONPs nanocomposite are shown in Fig. 6(A–C). N-CDs are randomly coated on ZnONPs because of low amount N-CDs used to prepare the N-CDs/ZnONPs nanocomposite, as shown in Fig. 6(A). The black color of N-CDs/ZnONPs nanocomposite was clearly explored with transparent images at high magnification, as shown in Fig. 6(B). The black layer around the N-CDs/ZnONPs nanocomposite with the transparent image was observed at high magnification and it, also, confirmed that the N-CDs were coated onto ZnONPs, as seen in Fig. 6(C). The SAED pattern also confirms that the ZnONPs appeared as a hexagonal wurtzite structure with good crystallinity after the formation of N-CDs/ZnONPs nanocomposite, as shown in Fig. 6(D). Additionally, the Energy dispersive X-ray spectroscopy (EDS) spectra provided confirmation of the presence of elements C, Zn, N and O in the N-CDs/ZnONPs nanocomposite. as shown in Fig. 6(E).
3.9 LFP developed on non-porous substrates under the daylight
The LPF images were developed on various non-porous surfaces of aluminum foil, aluminum sheets and aluminum rods with corresponding labeling agents of N-CDs, N-CDs/ZnONPs nanocomposite and ZnONPs, respectively, under daylight, as shown in Fig. 7(a–i). The pristine N-CDs gave good LFP images on the aluminum foil, aluminum sheet and aluminum rod, as shown in Fig. 7(a, d, g). The images in Fig. 7(c, f, i) indicate that ZnONPs had almost clear LFP images on the non-porous surfaces. The N-CDs/ZnONPs nanocomposite proved to be the best labeling agent powder due to well-defined images with better fingerprint ridges patterns which can be seen with the naked eye. This nanocomposite also enhanced special properties including the higher quality images, less contrast and easy visualization of LFP ridge patterns under daylight, as shown in Fig. 7(b, e, h). The labeling agent of N-CDs/ZnONPs nanocomposite powder was additionally tested for sensitivity and selectivity for LFP detection on different non-porous substrates.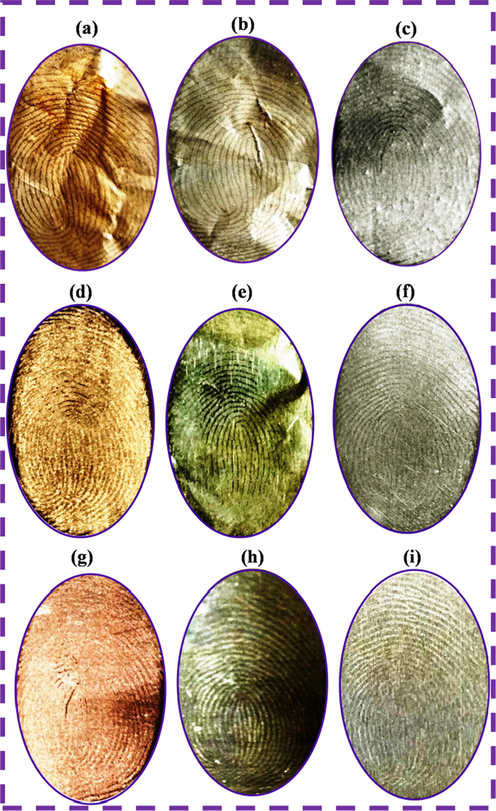
Latent fingerprints images on the different surface materials of aluminum foil (a) N-CDs, (b) N-CDs/ZnONPs nanocomposite and (c) ZnONPs, aluminum sheet (d) N-CDs, (e) N-CDs/ZnONPs nanocomposite and (f) ZnONPs and aluminum rod (g) N-CDs, (h) N-CDs/ZnONPs nanocomposite and (i) ZnONPs.
3.10 LFP developed on non-porous substrates under the UV light irradiation
The fluorescence LFP detection images were evaluated on an aluminum foil substrate with N-CDs and NCDs/ZnONPs nanocomposite powders under the daylight and UV light irradiation at 365 nm, as shown in Fig. 8(A–D). The LFP fingerprint was developed on the aluminum foil with N-CDs powder under daylight and UV light 365 nm irradiation, in which N-CDs powder was bound with sebaceous fingerprint ridges with high contrast under the daylight, as shown in Fig. 8(A). The clearer images, better fingerprint ridge detail and higher contrast background were discovered under UV light irradiation at 365 nm with blue fluorescence, as proven in Fig. 8(B). The fingerprint images were improved on the non-porous surface with N-CDs/ZnONPs nanocomposite powder under daylight and these showed poor background contrast and good fingerprint ridge patterns, as shown in Fig. 8(C). Fig. 8(D) shows less contrast background with proper blue fluorescence images, clear fingerprint patterns which are more detailed, easy visualization of LFP images and the best fingerprint images under UV light irradiation at 365 nm. For this reason, N-CDs/ZnONPs nanocomposite powder can be used to develop the LFP detection in forensic science research.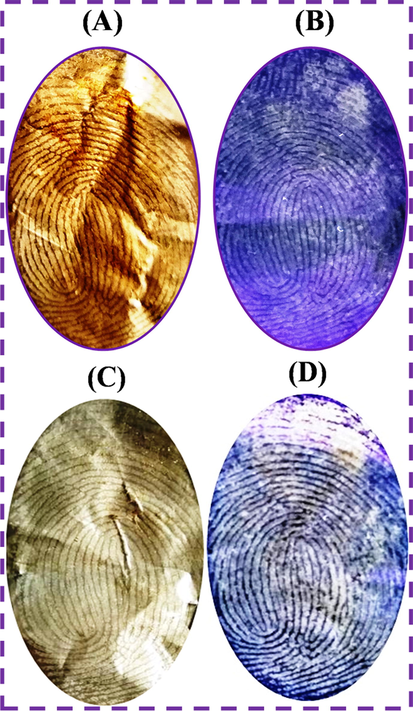
Latent fingerprint images on the aluminum foil substrates (A) N-CDs and (C) N-CDs/ZnONPs nanocomposite with daylight and (B) N-CDs and (D) N-CDs/ZnONPs nanocomposite with 365 nm UV light irradiation.
3.11 Fingerprint ridge characteristics by using N-CDs/ZnONPs nanocomposite
The better images and clearer ridge patterns of LFP has led to the need for investigation of suspects in forensic technology research. The second stages of fingerprint ridge patterns were developed on the aluminum foil surface using NCDs/ZnONPs nanocomposite under the UV light irradiation at 365 nm, as shown in Fig. 9. The second level ridges are displayed around the LFP image and also showed the second stage ridge patterns including whorl, bifurcation, delta, endpoint, fork, island, crossover and bridge, as shown in Fig. 9. Those ridge details can be used to identify the suspect and, also, the N-CDs/ZnONPs nanocomposite powder showed high sensitivity and validity for the development of LFP detection. This characterization of LFP proved that the N-CDs/ZnONPs nanocomposite powder was an effective labeling agent powder because of good luminescence and photostability.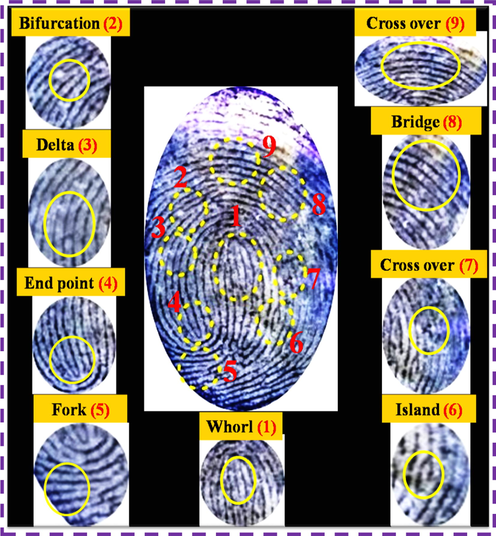
Different ridge patterns of LFP image visualized by using N-CDs/ZnONPs nanocomposite on aluminum foil surface under UV light irradiation at 365 nm.
3.12 Overlapped LFP detection with N-CDs/ZnONPs nanocomposite
Fig. 10(A&B) shows the overlapped LFP detection which was investigated with N-CDs/ZnONPs nanocomposite under visible light and UV light irradiation of 365 nm. The LFP images were developed on an aluminum foil surface with overlapped fingerprint images through the usage of N-CDs/ZnONPs nanocomposite powder as a labeling agent. The overlapped fingerprints images showed almost clear ridges observed under the visible light irradiation, as shown in Fig. 10A. In contrast, the clear ridges of overlapped fingerprint images were obtained under UV light irradiation at 365 nm with N-CDs/ZnONPs nanocomposite powder and it strongly interacted with fingerprint sweat, as shown in Fig. 10B. Fig. 10C indicates the detailed ridge patterns of overlapped LFP images which were investigated on aluminum foil substrates with N-CDs/ZnONPs under UV light irradiation at 365 nm. The fluorescence overlapped LFP images exhibited the ridge patterns consisting whorl, fork, endridge, bridge, island, lake, bifurcation and they have expanded the ridges patterns around it, as shown in Fig. 10C. The overlapped LFP images showed good fluorescence ridge patterns on the aluminum foil substrate with N-CDs/ZnONPs nanocomposite powder under UV light irradiation. This provides further evidence that N-CDs/ZnONPs nanocomposite powder can be considered a good labeling agent with improved blue emission under UV light irradiation at 365 nm.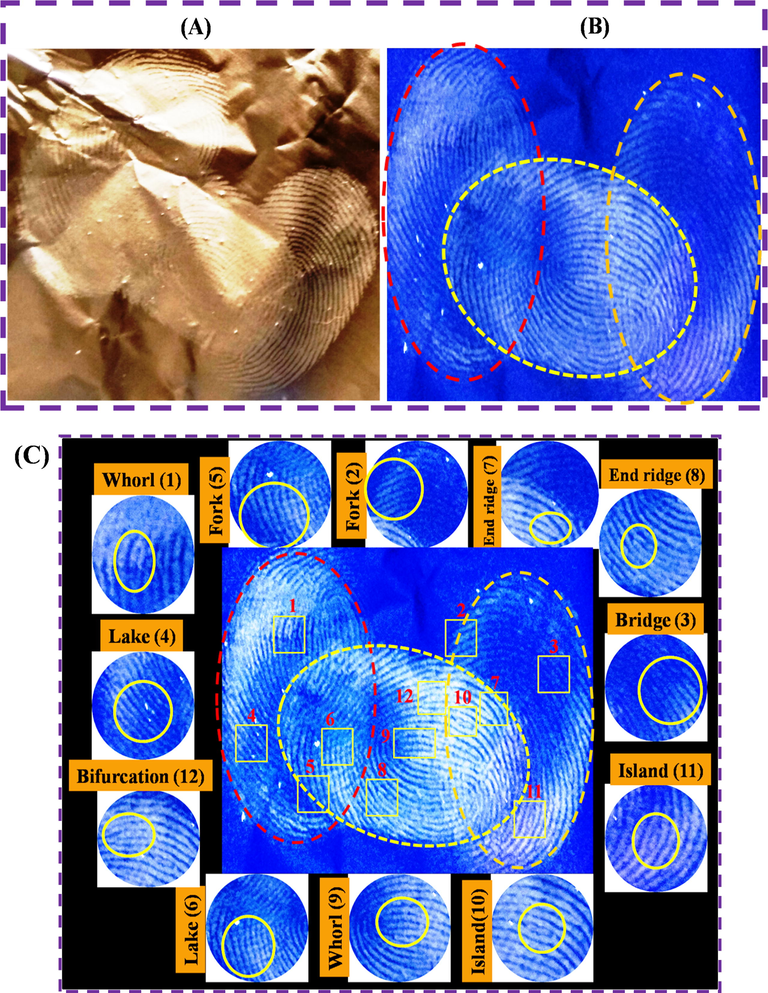
Overlapped LFP detection by using N-CDs/ZnONPs nanocomposite under daylight (A) and UV light irradiation at 365 nm (B) and different ridge patterns of LFP image visualized using N-CDs/ZnONPs nanocomposite on aluminium foil surface under UV light irradiation of 365 nm (C).
3.13 Aged LFP detection by using N-CDs and N-CDs/ZnONPs nanocomposite
Fingerprint sweat contains the sebum which is included in the sebaceous glands, glycerides, esters, squalene and cholesterol. The special aged and various time intervals of LFP detection have almost obtained the images with clear fingerprint ridge patterns because the sebum of fingerprint sweat dried, moisture evaporated and decontaminated the fingerprint ridge (Weyermann et al., 2011). The practical LFPs detection was developed using N-CDs and N-CDs/ZnONPs nanocomposite powders under UV light irradiation at 365 nm, as shown in Fig. 11(A&B). Fig. 11A (a-e) shows the LFP images of ridge details which have been captured at time intervals of 1 day, 1 week, 2 weeks, 3 week and 4 weeks, wherein 4 weeks of LFP image was almost still visible because of pure N-CDs powder with almost good photostability and good luminescent activity. The LFP development of aged fingerprint images at the various time intervals was also identified with NCDs/ZnONPs nanocomposite powder under UV light irradiation at 365 nm, as shown in Fig. 11B (a–e). In this case, the 4 week old LFP images also showed good visibility and clear ridge patterns with suitable photoluminescence activity and high contrast, as shown in Fig. 11B (e), due to N-CDs/ZnONPs nanocomposite powder acting as a good labeling agent.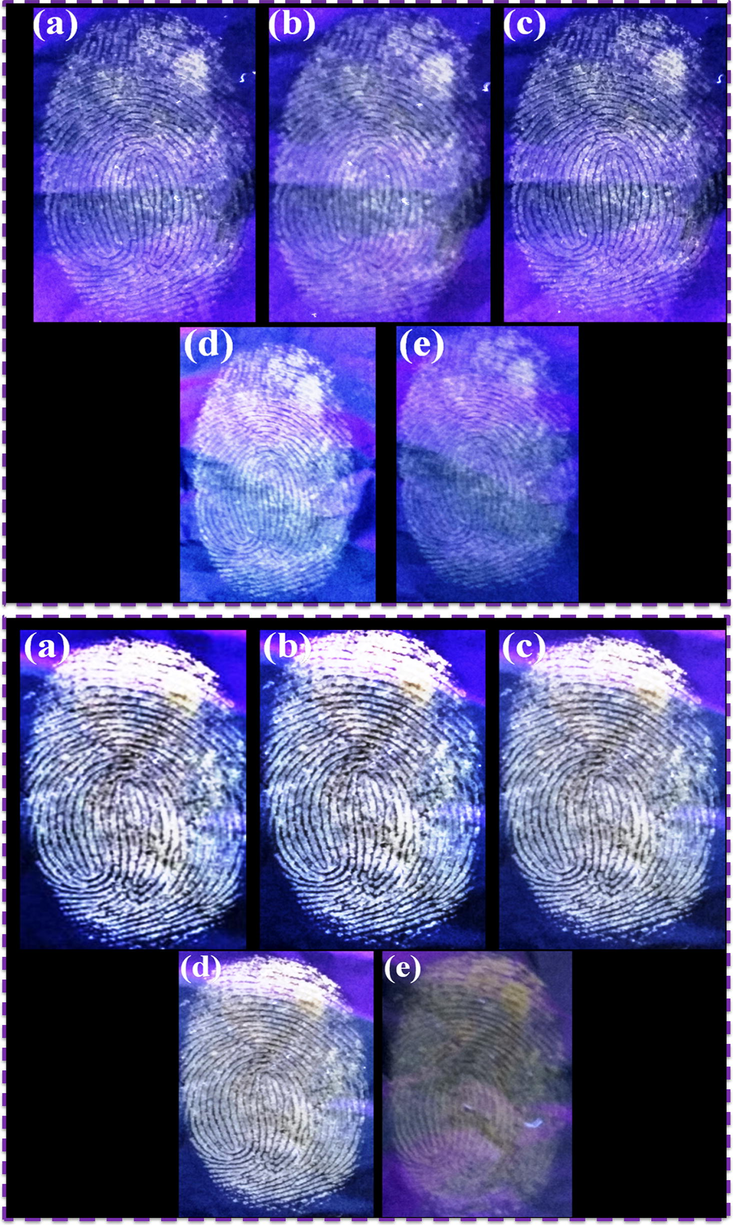
LFPs aged on the surface of aluminum foil surface for different periods of time with N-CDs and N-CDs/ZnONPs nanocomposite under UV light irradiation at 365 nm (a) 1 day, (b) 1 week, (c) 2 weeks, (d) 3 weeks and (e) fourth week.
3.14 Comparison study of LFP detection
The comparative study of LFP images which have been developed on aluminum foil surface with other commercial powders of TiO2, ZnSO4 powder and N-CDs/ZnONPs nanocomposite powder are shown in Fig. 12(A–C). The ZnSO4 and TiO2 commercial powders did not result in clear LFP images and ridges information on aluminum foil substrate due to high contrast background under daylight and on a white background, as shown in Fig. 12(A&B). More clear LFP images and accurate fingerprint ridges were observed using N-CDs/ZnONPs nanocomposite powder with low contrast background and blue luminescence under UV light irradiation at 365 nm, as shown in Fig. 12C. As seen in Fig. 12(C), the N-CDs/ZnONPs nanocomposite powder was a suitable labeling agent for the detection LFP images because of increased blue emission under irradiation at 365 nm. The results of comparative study of LFP images detected onto different substrates with different nanomaterials are summarized in Table 1.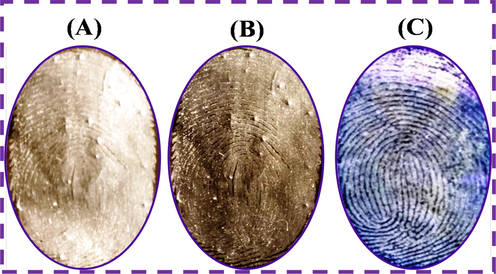
Comparison study of LFP detection with commercial TiO2 and commercial ZnSO4 under daylight and N-CDs/ZnONPs nanocomposite on aluminum foil surface under UV light irradiation at 365 nm.
Material
Method
Different substrates
LFP detection
Reference
Carbogenically coated silica nanoparticles (C-SiO2)
Pyrolysis method
Glass slide
+++a
Klason et al. (2008)
Carbon dot silica microspheres (CDs/SiO2)
Pyrolysis method
Glass slide
+++
Lan et al. (2015)
Carbon-based nanomaterials (CNs)
Hydrothermal method
Aluminum foil
++b
LeCroy et al. (2014)
C-dots@TiO2
Hydrothermal method
Aluminum foil
+++
Li et al. (2017)
Starch based on carbon nanoparticles
Pyrolysis method
Glass slide
++
Nagvenkar et al. (2016)
Fluorescent silica nanoparticles (FSNPs)
Stöber method
Glass slide
+++
Lim et al. (2015)
N-doped CDs
Microwave method
Filter paper
+c
Sun et al. (2006)
N-CDs/ZnONPs
Hydrothermal method
Aluminum foil
+++
This work
3.15 Reproducibility and validation of LFP detection
The reproducibility and validation of LFP images were examined on an aluminum foil substrate with numerous fingerprint tests. The reproducible LFP images were acquired with the same minutiae as shown by the red arrow mark on their fingerprint ridges in Fig. 13(A&B). This characterization confirmed the good reproducibility and better validation of N-CDs/ZnONPs nanocomposite powder as a labeling agent.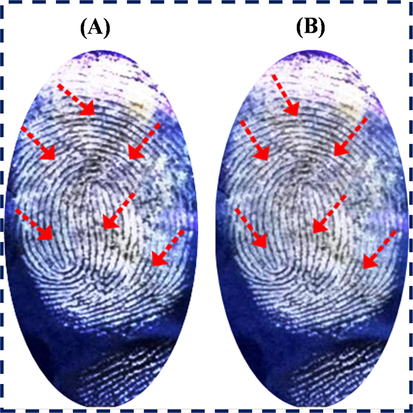
LFPs developed on different non-porous smooth surfaces of CD (A) and magazine paper (B) under daylight and (A′ & B′) under UV light irradiation of 365 nm and rough surface of iron disc (C) and black mat (D) under daylight and under UV light irradiation 365 nm (C′ & D′) by using N-CDs/ZnONPs nanocomposite.
3.16 Interference testing of LFP detection
The interference effects of LFP detection were tested with both smooth and rough surfaces using N-CDs/ZnONPs nanocomposite under daylight and UV light irradiation at 365 nm, as shown in Fig. 14(A–B). The experiment shows that the LFP images on the smooth surfaces of the compact disc and magazine paper displayed less fingerprint ridge details under daylight. In contrast, the LFP images gave better ridge patterns under the UV light at 365 nm, as shown Fig. 14(A′–B′). In this sense, the LFP detection was enhanced by the contrast image under UV light irradiation and also bright blue emission with fingerprint images. The rough substrates of the iron disc and black mat did not exhibit the best images with N-CDs/ZnONPs nanocomposite under the daylight, as shown in Fig. 14(C–D). However, the clear fingerprint images were observed with ridge patterns using N-CDs/ZnONPs nanocomposite under UV irradiation at 365 nm, as shown in Fig. 14(C′–D′). This result confirmed that the N-CDs/ZnONPs nanocomposite is an effective labeling agent for LFP detection on the non-porous substrates, but gave better images under UV irradiation (Wang et al., 2015a, 2015b).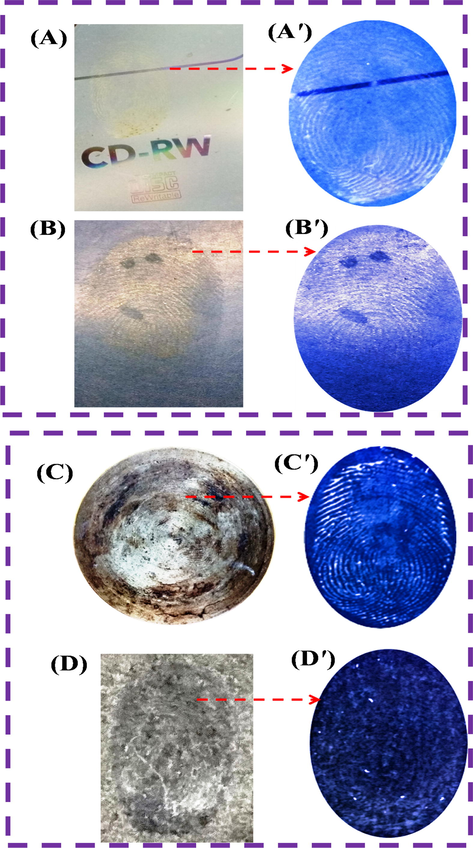
Reproducibility and validation of LFP development on aluminum foil surface by using N-CDs/ZnONPs nanocomposite under UV light irradiation of 365 nm with same images.
3.17 Latent fingerprint detection with Live Imaging Microscope
The nanopowder samples of (A) N-CDs, (B) ZnONPs and (C&D) N-CDs/ZnONPs nanocomposite were explored using the green and blue color fluorescence images of fingerprint ridges obtained under irradiation by in a Live Imaging Microscope under 445 nm laser with 415 nm and 455 nm filters, as shown in Fig. 15(A–D). Almost clear fingerprint ridge details were exhibited with green fluorescence background by using N-CDs powder due to the N-CDs powder being strongly bound on the fingerprint sweat, as shown in Fig. 15(A). Fig. 15(B) shows that the ZnONPs produced much better images with clear ridge patterns in a green fluorescence background. With N-CDs/ZnONPs nanocomposite powder, it was observed that the fingerprint ridge detail image quality improved with blue and green fluorescence background due to N-CDs/ZnONPs nanocomposite powder which strongly interacted with the finger ridges, as shown in Fig. 15(C&D). Furthermore, it was shown that there was high background interference in the fingerprint images of N-CDs and ZnONPs and this result confirmed that N-CDs/ZnONPs nanocomposite powder is the best material for latent fingerprint detection in forensic research.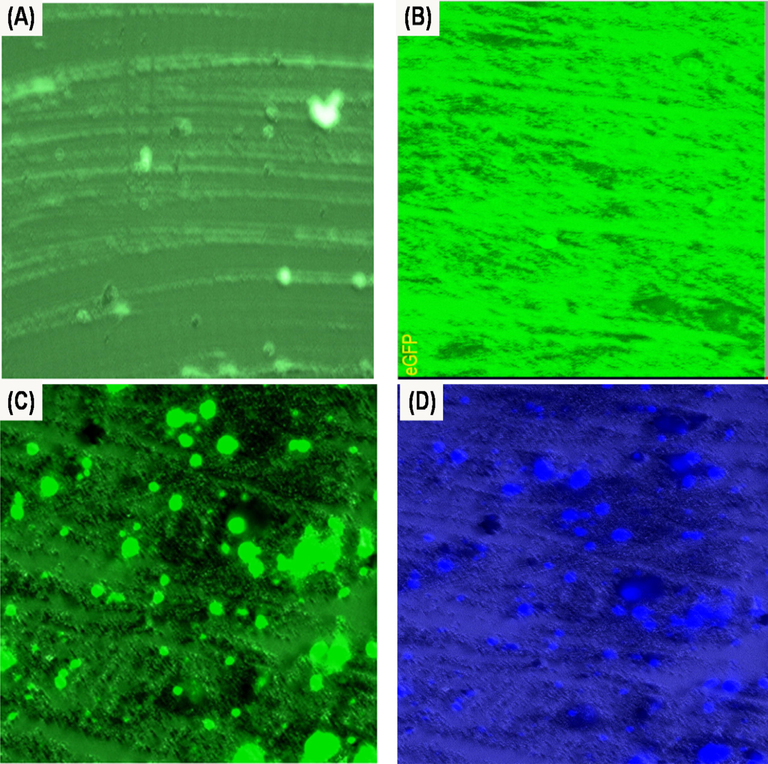
Live Imaging Microscope of fingerprint developed on the glass slide substrate with (A) N-CDs (Green image), (B) ZnONPs (Green image) and (C&D) N-CDs/ZnONPs nanocomposite (Green and Blue images) under 415 nm and 450 nm laser without yellow filter.
4 Conclusion
A new approach of N-CDs/ZnONPs nanocomposite was developed via an adsorption method, wherein N-CDs were prepared by using a hydrothermal method. The successful nanocomposite formation was verified using different characterization techniques. This newly developed nanocomposite was applied to develop latent fingerprints by using the powder method. N-CDs/ZnONPs nanocomposite was used as a forensic labeling powder onto different non-porous materials surface to collect better LFP images under UV irradiation. This nanocomposite powder showed excellent photoluminescence activity, chemical properties and superior latent fingerprint detection on various non-porous substrates of aluminum foil, aluminum sheet and aluminum rods. It gave enhanced the LFP image and ridge patterns under UV light irradiation compared to pure carbon dots and other commercial powders. The N-CDs/ZnONPs nanocomposite showed higher fluorescence character than the base materials ZnONPs and N-CDs for LFP detection on the different non-porous surfaces. This novel nanocomposite also showed the development of clear fingerprint images and clear ridge patterns on aged fingerprints of up to 4 weeks old thereby suggesting that this material could work well in gathering evidence for crimes which have been reported after some time. The N-CDs/ZnONPs nanocomposite additionally showed superior color images of LFP determination using a Living image Microscope with a glass slide. The N-CDs/ZnO nanocomposite powder was also tested for the reproducibility and validation characterization processes for development of LFP detection and it demonstrated good reproducibility. The pure N-CDs powder and N-CDs/ZnONPs nanocomposite powder were also tested for the LFP detection by using living cell microscope and the nanocomposite showed superior LPF images to that of the base materials. Furthermore, the N-CDs/ZnONPs nanocomposite has good advantages, which include non-toxic, cheap substances, fast and user friendly for detection of LFP when compared to other substances. This renders it as useful for LFP detection at real crime scenes. However, most of clear images were observed under UV irradiation and, therefore, more improvements or modifications to this nanocomposite may be needed to obtain better LFP images under visible light.
Conflicts of interest
There are no conflicts to declare.
Acknowledgment
This research was financial supported by PDRFs, University of Johannesburg and Faculty of Science, University of Johannesburg, South Africa. This research is also supported by the Center for Nanomaterials Research, University of Johannesburg, South Africa.
References
- A comparative analysis of deep level emission in ZnO layers deposited by various methods. J. Appl. Phys.. 2009;105:013502.
- [CrossRef] [Google Scholar]
- Rapid synthesis of C-dot@TiO2 core-shell composite labeling agent: probing of complex fingerprints recovery in fresh water. J. Alloy. Compd.. 2018;742:1006-1018.
- [CrossRef] [Google Scholar]
- Luminescent carbon nanodots: emergent nanolights. Angew. Chem., Int. Ed.. 2010;49(38):6726-6744.
- [CrossRef] [Google Scholar]
- Efficient synthesis of highly fluorescent nitrogen-doped carbon dots for cell imaging using unripe fruit extract of Prunus mume. Appl. Surf. Sci.. 2016;384:432-441.
- [CrossRef] [Google Scholar]
- synthesis and characterization of graphitic mesoporous carbon using metal-metal oxide by chemical vapor deposition method. Micropor. Mesopor. Mater.. 2015;215:123-132.
- [CrossRef] [Google Scholar]
- Synthesis of multilayer graphene balls on mesoporous Co-MCM-41 molecular sieves by chemical vapour deposition method. Micropor. Mesopor. Mater.. 2013;175:61-169.
- [CrossRef] [Google Scholar]
- Origin of the near-band-edge photoluminescence emission in aqueous chemically grown ZnO nanorods. J. Appl. Phys.. 2006;100:104317-104320.
- [CrossRef] [Google Scholar]
- Green and simple route toward boron doped carbon dots with significantly enhanced non-linear optical properties. Carbon. 2015;83:173-179.
- [CrossRef] [Google Scholar]
- Super fast detection of latent fingerprints with water soluble CdTe quantum dots. Forensic Sci. Int.. 2013;226(1–3):240-243.
- [CrossRef] [Google Scholar]
- Synthesis of silver nanoparticles: effects of anionic ligands on formation and catalytic activity. Mater. Chem. Phys.. 2014;148(3):1124-1130.
- [CrossRef] [Google Scholar]
- Green synthesis of fluorescent carbon nanoparticles from lychee (Litchi chinensis) plant. Kor. J. Chem. Eng.. 2015;32(8):1707-1711.
- [CrossRef] [Google Scholar]
- Fingerprints and Other Ridge Skin Impressions. CRC Press; 2004.
- Production and recovery of defects in phosphorus-implanted ZnO. J. Appl. Phys.. 2005;97:013528.
- [CrossRef] [Google Scholar]
- An evaluation of nanostructured zinc oxide as a fluorescent powder for fingerprint detection. J. Mater. Sci.. 2008;43(2):732-737.
- [CrossRef] [Google Scholar]
- Small particle reagents technique can help to point out wet latent fingerprints. Forensic Sci. Int.. 2004;146:s7-s8.
- [CrossRef] [Google Scholar]
- Study of blue shift of optical band gap in zinc oxide (ZnO) nanoparticles prepared by low-temperature wet chemical method. Mater. Lett.. 2013;111:116-119.
- [CrossRef] [Google Scholar]
- Green, yellow and orange defect emission from ZnO nanostructures: influence of excitation wavelength. Appl. Phys. Lett.. 2006;88:103107.
- [CrossRef] [Google Scholar]
- Quenching of photoluminescence in ZnO QDs decorating multiwalled carbon nanotubes. Chem Phys Chem.. 2010;11(8):1774-1779.
- [CrossRef] [Google Scholar]
- Electrocatalytic reduction of benzyl chloride by green synthesized silver nanoparticles using pod extract of Acacia nilotica. ACS Sustain. Chem. Eng.. 2013;1(10):1326-1332.
- [CrossRef] [Google Scholar]
- Carbogenically coated silica nanoparticles and their forensic applications. Chem. Commun.. 2016;52(53):8294-8296.
- [CrossRef] [Google Scholar]
- Resonant Raman scattering in hydrogen and nitrogen doped ZnO. Appl. Phys. Lett.. 2007;91:111903.
- [CrossRef] [Google Scholar]
- Synthesis of ZnO coated activated carbon aerogel by simple sol–gel route. J. Mater. Chem.. 2011;21(2):330-333.
- [CrossRef] [Google Scholar]
- Study of zinc oxide nano/micro rods grown on ITO and glass substrates. Optik-Int. J. Light Electron Opt.. 2013;124(20):4167-4171.
- [CrossRef] [Google Scholar]
- Removal of pharmaceutical compounds from urine via chemical coagulation by green synthesized ZnO-nanoparticles followed by microfiltration for safe reuse. Arab. J. Chem.. 2019;12:4074-4083.
- [CrossRef] [Google Scholar]
- Application of photoluminescent CdS/PAMAM nanocomposites in fingerprint detection. Forensic Sci. Intern.. 2008;179(1):34-38.
- [CrossRef] [Google Scholar]
- Bioorganic polymer-based synthesis of cerium oxide nanoparticles and their cell viability assays. Ceram. Int.. 2015;4:1589-1594.
- [CrossRef] [Google Scholar]
- Rapid imaging of latent fingerprints using biocompatible fluorescent silica nanoparticles. Langmuir. 2016;32(32):8077-8083.
- [CrossRef] [Google Scholar]
- Temperature dependence and decay times of zinc and oxygen vacancy related photoluminescence bands in zinc oxide. Solid State Commun.. 2008;145(5):321-326.
- [CrossRef] [Google Scholar]
- Engineering oxygen vacancies towards self-activated BaLuAlxZn4-xO7-(1–x)/2 photoluminescent materials: an experimental and theoretical analysis. Phys. Chem. Chem. Phys.. 2015;17(2015):31188-31194.
- [CrossRef] [Google Scholar]
- Toward structurally defined carbon dots as ultra compact fluorescent probes. ACS Nano. 2014;8(5):4522-4529.
- [CrossRef] [Google Scholar]
- One-step synthesis of solid state luminescent carbon-based silica nanohybrids for imaging of latent fingerprints. Opt. Mater.. 2017;73:459-465.
- [CrossRef] [Google Scholar]
- Carbon quantum dots and their applications. Chem. Soc. Rev.. 2015;44(1):362-381.
- [CrossRef] [Google Scholar]
- Highly photoluminescent nitrogen-rich carbon dots from melamine and citric acid for the selective detection of iron (III) ion. RSC Adv.. 2016;6(38):31884-31888.
- [CrossRef] [Google Scholar]
- A synthesis of fluorescent starch based on carbon nanoparticles for fingerprints detection. Opt. Mater.. 2016;60:404-410.
- [CrossRef] [Google Scholar]
- Highly luminescent nitrogen-doped carbon quantum dots as effective fluorescent probes for mercuric and iodide ions. J. Mater. Chem. C. 2015;3(9):1922-1928.
- [CrossRef] [Google Scholar]
- ZnO/carbon quantum dots heterostructure with enhanced photocatalytic properties. Appl. Surf. Sci.. 2013;279:367-373.
- [CrossRef] [Google Scholar]
- Economical, green synthesis of fluorescent carbon nanoparticles and their use as probes for sensitive and selective detection of mercury(II) ions. Anal. Chem.. 2012;84(12):5351-5357.
- [CrossRef] [Google Scholar]
- Novel fluorescent matrix embedded carbon quantum dots for the production of stable gold and silver hydrosols. J. Mater. Chem.. 2011;21(44):17638-17641.
- [CrossRef] [Google Scholar]
- Luminescent graphene quantum dots from oxidized multi-walled carbon nanotubes. Mater. Chem. Phys.. 2012;137:12-16.
- [CrossRef] [Google Scholar]
- Functionalised silicon oxide nanoparticles for fingermark detection. Forensic Sci. Int.. 2016;259:10-18.
- [CrossRef] [Google Scholar]
- A one-step sonochemical synthesis of stable ZnO–PVA nanocolloid as a potential biocidal agent. J. Mater. Chem. B. 2016;4(12):2124-2132.
- [CrossRef] [Google Scholar]
- Photoluminescent green carbon nanodots from food-waste-derived sources: large-scale synthesis, properties, and biomedical applications. ACS Appl. Mater. Interfaces. 2014;6(5):3365-3370.
- [CrossRef] [Google Scholar]
- One-pot synthesis of fluorescent carbon dots from orange waste peels. Ind. Eng. Chem. Res.. 2013;52(44):15673-15678.
- [CrossRef] [Google Scholar]
- Observation of pH-, solvent-, spin-, and excitation-dependent blue photoluminescence from carbon nanoparticles. Chem. Commun.. 2010;46(21):3681-3683.
- [CrossRef] [Google Scholar]
- A biocompatible fluorescent ink based on water-soluble luminescent carbon nanodots. Angew. Chem. Int. Ed. Engl.. 2012;51(49):12215-12218.
- [CrossRef] [Google Scholar]
- Synthesis and photoluminescence characterization of ZnO nanoparticles. J. Lumin.. 2013;134:213-219.
- [CrossRef] [Google Scholar]
- Fabricated CeO2 nanopowders as a novel sensing platform for advanced forensic, electrochemical and photocatalytic applications. Appl. Nanosci.. 2017;7(8):815-833.
- [CrossRef] [Google Scholar]
- Photoluminescent carbon nanodots: synthesis, physicochemical properties and analytical applications. Mater. Today. 2015;18(8):447-458.
- [CrossRef] [Google Scholar]
- Biosynthesis and characterization of ZnO nanoparticles using Lactobacillus plantarum VITES07. Mater. Lett.. 2013;112:180-182.
- [CrossRef] [Google Scholar]
- Facile and eco-friendly synthesis of green fluorescent carbon nanodots for applications in bioimaging, patterning and staining. NANO. 2015;7(16):7394-7401.
- [CrossRef] [Google Scholar]
- Dramatic fluorescence enhancement of bare carbon dots through facile reduction chemistry. Chem. Phys. Chem.. 2012;13(15):3549-3555.
- [CrossRef] [Google Scholar]
- Nanoparticle size fingerprint dusting composition based on fluorescent eosin Y dye. Fingerprint Whorld. 2006;32:146-147.
- [Google Scholar]
- A novel, nanoparticle size fingerprint detecting composition based on fluorescent lucifer Y stain. Fingerprint Whorld. 2007;34:24-25.
- [Google Scholar]
- Nanostructured carbon and carbon nanocomposites for electrochemical energy storage applications. Chem. Sus. Chem.. 2010;3(2):136-168.
- [CrossRef] [Google Scholar]
- Quantum-sized carbon dots for bright and colorful photoluminescence. J. Am. Chem. Soc.. 2006;128(24):7756-7757.
- [CrossRef] [Google Scholar]
- Synthesis of NIR-Responsive NaYF4:Yb,Er upconversion fluorescent nanoparticles using an optimized solvothermal method and their applications in enhanced development of latent fingerprints on various smooth substrates. Langmuir. 2015;31:7084-7090.
- [CrossRef] [Google Scholar]
- Green synthesis of luminescent nitrogen-doped carbon dots from milk and its imaging application. Anal. Chem.. 2014;86(18):8902-8905.
- [CrossRef] [Google Scholar]
- Carbon quantum dots: synthesis, properties and applications. J. Mater. Chem. C. 2014;2(34):6921-6939.
- [CrossRef] [Google Scholar]
- Vegetable-extracted carbon dots and their nanocomposites for enhanced photocatalytic H2 production. RSC Adv.. 2014;4(83):44117-44123.
- [CrossRef] [Google Scholar]
- Development of latent prints with titanium dioxide (TiO2) J. Forensic Identif.. 2002;52(5):551-559.
- [Google Scholar]
- Rare earth fluorescent nanomaterials for enhanced development of latent fingerprints. ACS Appl. Mater. Interfaces. 2015;7(51):28110-28115.
- [CrossRef] [Google Scholar]
- Amphiphilic egg-derived carbon dots: rapid plasma fabrication, pyrolysis process, and multicolor printing patterns. Angew. Chem. Int. Ed.. 2012;51(37):9297-9301.
- [CrossRef] [Google Scholar]
- Thickness-dependent full-color emission tunability in a flexible carbon dot ionogel. J. Phys. Chem. Lett.. 2014;5(8):1412-1420.
- [CrossRef] [Google Scholar]
- A green synthesis of carbon nanoparticles from honey and their use in real-time photoacoustic imaging. NanoRes.. 2013;6(5):312-325.
- [CrossRef] [Google Scholar]
- Photocatalytic H2 evolution from NADH with carbon quantum dots/Pt and 2-phenyl-4-(1-naphthyl) quinolinium ion. J. Photochem. Photobiol. B Biol. 152. 2015;PtA:63-70.
- [CrossRef] [Google Scholar]
- Initial results on the composition of fingerprints and its evolution as a function of time by GC/MS analysis. J. Forensic Sci.. 2011;56(1):102-108.
- [CrossRef] [Google Scholar]
- Fabrication and properties of hollow poly(Nisopropylacrylamide)- Ag nanocomposite spheres. J. Polym. Sci. A Polym. Chem.. 2009;47(19):4919-4926.
- [CrossRef] [Google Scholar]
- Low-cost synthesis of carbon nanodots from natural products used as a fluorescent probe for the detection of ferrum (III) ions in lake water. Anal. Methods. 2014;6(7):2086-2090.
- [CrossRef] [Google Scholar]
- A green heterogeneous synthesis of N-doped carbon dots and their photoluminescence applications in solid and aqueous states. Nanoscale. 2014;6(17):10307-10315.
- [CrossRef] [Google Scholar]
- Preparation of highly photoluminescent sulfur-doped carbon dots for Fe (III) detection. J. Mater. Chem. A. 2015;3(2):542-546.
- [CrossRef] [Google Scholar]
- Nitrogen-doped, carbon rich, highly photoluminescent carbon dots from ammonium citrate. Nanoscale. 2014;6(3):1890-1895.
- [CrossRef] [Google Scholar]
- ZnO/carbon quantum dots nanocomposites: one-step fabrication and superior photocatalytic ability for toxic gas degradation under visible light at room temperature. New J. Chem.. 2012;36(4):1031-1035.
- [CrossRef] [Google Scholar]
- New luminescent nanoparticles based on carbon dots/SiO2 for the detection of latent fingermarks. Anal. Methods. 2017;9(33):4770-4775.
- [CrossRef] [Google Scholar]
- The visible light catalytic properties of carbon quantum dots/ZnO nanoflowers composites. J. Mater. Sci.: Mater. Electron.. 2015;26(5):2861-2866.
- [CrossRef] [Google Scholar]
- Mass production, enhanced visible light photocatalytic efficiency and application of modified ZnO nanocrystals by carbon dots. Ind. Eng. Chem. Res.. 2015;54(6):1766-1772.
- [CrossRef] [Google Scholar]
- Microwave synthesis of fluorescent carbon nanoparticles with electrochemiluminescence properties. Chem. Commun.. 2009;14(34):5118-5120.
- [CrossRef] [Google Scholar]
Appendix A
Supplementary material
Supplementary data to this article can be found online at https://doi.org/10.1016/j.arabjc.2019.01.004.
Appendix A
Supplementary material
The following are the Supplementary data to this article:Supplementary data 1
Supplementary data 1


