

Translate this page into:
Synthesis, characterization and antimicrobial studies of novel ONO donor hydrazone Schiff base complexes with some divalent metal (II) ions
⁎Corresponding author. aswaranand@gmail.com (A.S. Aswar)
-
Received: ,
Accepted: ,
This article was originally published by Elsevier and was migrated to Scientific Scholar after the change of Publisher.
Peer review under responsibility of King Saud University.
Abstract
Abstract
Synthesis of hydrazone Schiff base (H2L) and its complexes are reported. All complexes are characterized by various physicochemical studies. Antibacterial and Antifungal screening of compounds are studied. Most complexes show higher antimicrobial activity than ligand.
Abstract
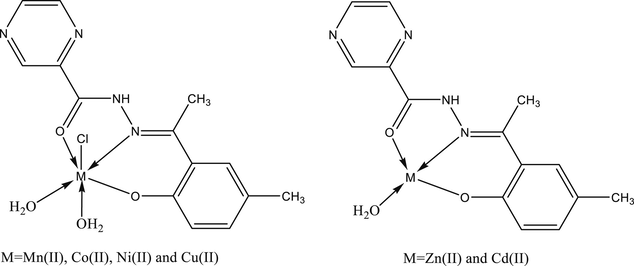
Metal complexes of two general formulae [M(L)(Cl)(H2O)2] [M = Mn(II), Co(II), Ni(II) and Cu(II)] and [M(L)(H2O)] [M = Zn(II) and Cd(II)] with pyrazine-2-carbohydrazone of 2-hydroxy-5-methylacetophenone (H2L) are synthesized and characterized by microanalytical, thermal, magnetic susceptibility measurement, spectroscopic (IR, 1H NMR, 13C NMR), mass, molar conductance, X-ray powder diffraction, ESR and SEM studies. While the molar conductance measurements in DMSO indicated their non-electrolytic nature, the spectroscopic studies confirmed a tridentate ONO donor behaviour of the ligand towards the central metal ion. Based on the physico-chemical studies monomeric octahedral geometry around Mn(II), Co(II), Ni(II) and Cu(II) ions (i.e. for the first series of complexes) whereas tetrahedral to Zn(II) and Cd(II) ions (i.e. for the second series of complexes) are suggested. Based on the thermal behavior of the complexes, various kinetic and thermodynamic parameters were evaluated using Coats-Redfern method. The ligand and its metal complexes were screened for in vitro antibacterial and antifungal activity against Gram +ve S. aureus, B. subtilis and Gram –ve E. coli and S. typhi. and fungal strains, C. albicans and A. niger. The observed data infer promising biological activity of some of these complexes compared the parent ligand against all bacterial and fungal species.
Keywords
Schiff base
Metal (II) complexes
Spectroscopy
Powder XRD
Biological activity

1 Introduction
Schiff bases have played a special role as chelating ligand in main group and transition metal coordination chemistry. Schiff base ligands with N-N linkage which are derived from acid hydrazide and aldehydes or ketones have drawn special attention of researchers due to their potential polynucleating behavior, coordinating through ketonic/enolate oxygen, azomethine nitrogen and phenolate oxygen and offer a variety of bonding possibilities in metal complexes. Hydrazones and hydrazides have also gained considerable interest in recent years owing to their wide variety of biological and pharmacological properties as well (Yang et al., 2016; Tatum et al., 2014; Mohanraj et al., 2016; Goff and Ouazzani, 2014; Ciecwierz et al., 2015). Due to their well-known chelating capability, structural flexibility and diverse range of applications many investigators are embarked to these topics, especially the important roles of the complexes derived from pyrazine-2-carbohydrazide. Hydrazones possess azomethine moiety, which constitute an important class of compounds for new drug development. Therefore, several researchers direct to synthesize these classes of compounds as target structures and evaluate their biological activities (Ribeiro et al., 2019). These observations have facilitated in the development of new Schiff bases that possess varied biological activities (Enders et al., 1994; Bhaskar et al., 2015; Sang and Lin, 2010; Pastorin et al., 2010; Wani et al., 2012; Avupati et al., 2013). The metal complexes of hydrazones including heterocyclic moieties involving nitrogen, oxygen and sulphur as coordinating functionalities have been studied extensively in order to establish a relationship between the chemical structure and biological activity (Padhy and Kauffman, 1985; West et al., 1991; Manikandan et al., 2011; Sharaby, 2007). The antiproliferative, cytotoxic and receptor tyrosine kinase behavior of hydrazone derivatives have been reported (Mahmudov et al., 2014; Martin et al., 2017; Viswanathan et al., 2019). Additionally, Schiff base hydrazones bearing nitrogen containing moiety have attracted considerable attention due to their impressive chemical (Armstrong et al., 2003; Mezzina et al., 2002; Hegab et al., 2003; Hayden et al., 2001) and analytical applications (Nawar et al., 1999). Literature survey reveals a considerable report on hydrazone complexes but little attention has paid to Schiff bases derived from pyrazine-2-carbohydrazide.
In view of the multiple growing importance associated with pyrazine-2-carbohydrazide, we report here the corresponding hydrazone by condensation of it with 2-hydroxy-5-chloroacetophenone (Scheme 1). We have synthesized Mn(II), Co(II), Ni(II), Cu(II), Zn(II) and Cd(II) complexes of this ligand. After characterization, these compounds are evaluated for their antibacterial and antifungal activities.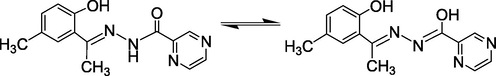
Structure formula of ligand H2L (I) used in this study. Tautomeric forms of ligand are shown.
2 Experimental
2.1 Materials and physical measurements
Methyl-2-pyrazine carboxylate and 5-methyl-2-hydroxy acetophenone were obtained from Aldrich Chemical Company USA and used without further purification. Pyrazine-2-carbohydrazide was prepared by reacting methyl-2-pyrazine carboxylate with hydrazine hydrate in ethanol using usual standard method. All metal chlorides (MnCl2·4H2O, CoCl2·6H2O, NiCl2·6H2O, CuCl2·2H2O, ZnCl2·2H2O, and CdCl2·H2O) and solvents were of analytic reagent grade and obtained from SD’s fine chemicals, Mumbai, India and were used as received. The solvents were dried using standard methods (Furniss et al., 1976) as and when required.
The IR spectra were recorded as KBr pellets using a Shimadzu 8201 spectrophotometer in the range 400–4000 cm−1. Elemental analyses (C, H and N) were obtained using a Carlo Erba 1108 elemental analyzer. Metal contents of the complexes were analyzed gravimetrically after decomposing the organic matter with a mixture of HClO4, H2SO4 and HNO3 (1:1.5:2.5) and then igniting to the corresponding metal oxides. Chlorine in complexes was determined by gravimetrically as silver chloride. 1H and 13C NMR spectra were recorded on Bruker Advance II 400 MHz NMR spectrometer in DMSO-d6 using TMS as an internal standard. Magnetic measurements were carried out by the Sherwood magnetic susceptibility balance MK-1 at room temperature. The solid-state reflectance spectra of the complexes were recorded in the 200–1200 nm range using MgO as diluent on a Cary 60 UV–Vis spectrophotometer. The X–band ESR spectrum of Cu(II) complex was recorded on Varian E–112 spectrophotometer using TCNE (tetracyanoethylene) as the g-marker. Thermogravimetric analyses were performed on a Perkin Elmer, Diamond TG thermal analyzer in the temperature range 40–750 °C with a heating rate of 10 °C min−1 under a dynamic air atmosphere. X-ray diffraction patterns were obtained with a Bruker AXS, D8 advance equipped with Si(Li) PDS. Mass spectra were recorded on a Waters, Q-TOF micro mass (LC-MS) spectrometer. The surface morphology was observed using a JEOL Model JSM − 6390LV scanning electron microscope. The molar conductance was measured using 10–3 molar solutions in DMSO with an Elico conductivity bridge and dip type cell calibrated with KCl solution.
2.2 Synthesis of the ligand H2L (I)
A solution of pyrazine-2-carbohydrazide (1.0 g, 7.244 mmol) in 10 mL of ethanol was added dropwise to a magnetically stirred solution of 5-methyl-2-hydroxy acetophenone (1.09 g, 7.244 mmol) in 10 mL of ethanol and resulting reaction mixture was refluxed on a water bath for 3 h. The progress of reaction was monitored by TLC. After completion of the reaction, the resultant mixture was cooled to room temperature. After reducing the solvent volume to nearly half and cooling to room temperature resulted in the precipitation of a yellow solid. It was filtered, washed with ethanol and recrystallized from DMF. Yield: 78%. m.p.: 235 °C. Anal Calc. for C14H17N4O2: C, 61.53; H, 6.22; N, 20.51. Found: C, 61.12; H, 6.70; N, 20.83%. IR (KBr disc, cm−1): 3338 (OH), 3178 (NH), 1688 m(C = O), 1626 m(C⚌N), 1278 (C-O). 1H NMR (DMSO-d6, 100 MHz, δ in ppm): 12.61 (s, 1H, OH), 11.29 (s, 1H, NH), 9.32 (s, 1H, C3-H), 8.89 (d, 1H, C5-H), 8.73 (s, 1H, C6-H), 7.36 (s, 1H, C8-H), 7.09 (d, 1H, C10-H), 6.79 (m, 1H, C11-H), 2.50 (s, 3H, CH3), 2.27 (s, 3H, CH3). 13C NMR (DMSO-d6, 100 MHz, δ in ppm): 161.76 (C⚌N), 159.27(C12), 156.55(C⚌O), 147.75(C6), 143.99(C2), 143.66(C3), 142.89(C5), 132.09(C10), 128.19(C9), 126.97(C8), 118.41(C7), 117.10(C11), 20.20(CH3), 13.37(CH3). Mass spectrum (ESI): [M + 1] = 271.2, [M + 2] = 272.2.
2.3 Synthesis of [M(HL)(Cl)(H2O)2] [M = Mn(II), Co(II), Ni(II) and Cu(II)]
Ligand H2L (2.71 g, 0.01 mol) was dissolved in DMF (25 mL) and a filtered solution of respective metal salt (0.01 mol) dissolved ethanol–water (50:50) added to the above solution in warm conditions under continuous stirring. The resulting reaction mixture was heated at ca. 100 °C for 6 h on an oil bath with stirring. On cooling to room temperature, the colored solid separated out which was filtered, washed with DMF, ethanol followed by petroleum ether and finally dried in desiccator over silica gel.
Data for [Mn(HL)(Cl)(H2O)2] (1): Yield:65%. Anal Calc. for C14H17ClN4O4Mn (395): C, 41.94; H, 3.96; N, 14.10; Cl, 8.86 Mn, 13.48. Found: C, 42.50; H, 4.33; N, 14.16; Cl, 8.20; Mn, 13.88%. Molar conductance (DMSO, Ω−1 cm2 mol−1): 13.2.
Data for [Co(HL)(Cl)(H2O)2] (2): Yield:67%. Anal Calc. for C14H17ClN4O4Co (399): C, 41.88; H, 4.12; N, 13.86; Cl, 8.75; Co, 14.38. Found: C, 42.07; H, 4.29; N, 14.20; Cl, 8.10; Co, 14.74%. Molar conductance (DMSO, Ω−1 cm2 mol−1): 17.4.
Data for [Ni(HL)(Cl)(H2O)2] (3): Yield:70%. Anal Calc. for C14H17ClN4O4Ni (398): C, 41.98; H, 3.96; N, 13.81; Cl, 8.79; Ni, 13.97. Found: C, 42.10; H, 4.29; N, 14.03; Cl, 8.40; Ni, 14.69%. Molar conductance (DMSO, Ω−1 cm2 mol−1): 15.3.
Data for [Cu(HL)(Cl)(H2O)2] (4): Yield:68%. Anal Calc. for C14H17ClN4O4Cu (404): C, 8.66; 40.94; H, 3.88; N, 13.68; Cl, Cu, 15.40. Found: C, 41.59; H, 4.24; N, 13.86; Cl, 823; Cu, 15.72%. Molar conductance (DMSO, Ω−1 cm2 mol−1): 15.4.
2.4 Synthesis of [M(L)(H2O)] [M = Zn(II) and Cd(II)]
These complexes were prepared similarly as mentioned above using 0.01 mol each of H2L (I) and respective metal salt. The obtained colourled compounds were dried in desiccator over silica gel.
Data for [Zn(L)(H2O)] (5): Yield:70%. Anal Calc. for C14H15N4O3Zn (351): C, 46.88; H, 3.98; N, 16.87; Zn, 17.69. Found: C, 47.68; H, 4.29; N, 15.89; Zn 18.54%. Molar conductance (DMSO, Ω−1 cm2 mol−1): 17.5.
Data for [Cd(L)(H2O)] (6): Yield:68%. Anal Calc. for C14H15N4O3Cd (399): C, 41.83; H, 3.64; N, 13.80; Cd, 27.96. Found: C, 42.07; H, 3.78; N, 14.02; Cd 28.12%. Molar conductance (DMSO, Ω−1 cm2 mol−1): 12.7.
2.5 Antimicrobial activity
The Schiff base ligand (H2L) and its complexes were screened for their anti-bacterial and anti-fungal activity against S. aureus MTCC 96, B. subtilis MTCC 8979 as gram positive bacteria and E. coli MTCC 443, and S. typhi. MTCC 442 as gram Gram-negative and the fungi, C. albicans MTCC 227 and A. niger MTCC 282 by using disc-agar diffusion method. The solutions of Ciprofloxacin (antibacterial drug) and Clotrimazole (antifungal drug) were used as standard. The disc agar diffusion method (Gross and De-Vay, 1977) was employed for the determination of antimicrobial activities. MICs (minimum inhibitory concentration) of the compounds against test organisms were determined by the broth micro dilution method. All these tests were performed twice under identical conditions and DMSO used as control and model values were selected. Activity was determined by measuring the diameter of zone showing complete inhibition and has been expressed in mm.
3 Results and discussion
Condensation of pyrazine-2-carbohydrazide with 2-hydroxy-5-methylacetophenone in ethanol yielded the Schiff base (H2L (I), c.f. Scheme 1). Reaction of this ligand with metal salts in DMF : ethanol : water (50 : 25 : 25) at ca. 100 °C resulted in the formation of two different types of complexes, [M(L)(Cl)(H2O)2] [M = Mn(II), Co(II), Ni(II) and Cu(II)] and [M(L)(H2O)] [M = Zn(II) and Cd(II)] in good yield. The analytical and physico-chemical data of these complexes are provided in the experimental section. These complexes are coloured solids, air stable and insoluble in most common organic solvents viz. ethanol, methanol, chloroform, benzene, cyclohexane, acetone, diethyl ether but are soluble in DMF and DMSO. All efforts to grow single crystals of these complexes suitable for X-ray single crystal study failed due to their solubility constraints. However, other studies (vide supra) made possible to establish their stoichiometry and predict plausible structure. All the complexes are non-electrolytes as indicated by their low molar conductance values (12.7–17.5 Ω−1 cm2 mol−1) in DMSO at room temperature.
3.1 IR spectral studies
The IR spectra of the metal complexes were compared with the free ligand in order to establish the coordination sites involved in chelation. Table 1 presents the spectral data and Fig. S1 reproduces IR spectra of H2L and complexes.
Compound
ν(OH—N)
ν (NH)
ν (C-⚌O)
ν(C⚌N)
ν (C—O) phenolic
ν (C—O) enolic
ν (N—N)
ν (M−O)
ν (M−N)
H2L
3338
3178
1688
1626
1298
–
968
–
–
[Mn(HL)(Cl)(H2O)2]
–
3172
1686
1590
1294
–
1022
574
454
[Co(HL)(Cl)(H2O)2]
–
3170
1639
1598
1286
–
976
522
458
[Ni(HL)(Cl)(H2O)2]
–
3168
1676
1602
1278
–
986
508
482
[Cu(HL)(Cl)(H2O)2]
–
3168
1670
1594
1280
–
978
574
480
[Zn(L)(H2O)]
–
–
–
1592
1312
1230
980
584
448
[Cd(L)(H2O)]
–
–
–
1594
1332
1228
978
574
454
IR spectrum of the ligand shows a medium intensity band at 3338 cm−1 due to intramolecular hydrogen bonded hydroxyl group ν(O–H-N) (Chandra et al., 2004). The absence of this band in the spectra of all the complexes indicates the deprotonation of the phenolic oxygen and subsequent coordination to the metal ions. This is further supported by the upward shifting of ν(C–O) phenolic band by 12–20 cm−1 from 1278 cm−1 (Nishat et al., 2010). The ligand exhibits strong band at 1626 cm−1 due to ν(C⚌N) (azomethine). Shift of this band to lower wave number by 20–36 cm−1, suggests the involvement of azomethine nitrogen in coordination. The ligand’s spectrum exhibits a sharp band at 949 cm−1 due to the ν(N–N) mode and shift of this to higher wave number by 10–40 cm−1 in the spectra of complexes also supports the coordination of the azomethine nitrogen atom (Dash et al., 2008). The high frequency shift of the ν (N–N) band is expected because of diminished repulsion between the lone pairs of adjacent nitrogen atoms as a result of coordination via azomethine nitrogen (Maurya et al.,1993) The IR spectrum of ligand shows a strong bands at 3178 and 1688 cm−1 due to N–H and C⚌O groups, respectively. The IR spectra of Mn(II), Co(II), Ni(II) and Cu(II) complexes display ν(N–H) band almost at the same position whereas ν(C⚌O) shows a decrease in wave number by 10–48 cm−1 suggesting that involvement of the only carbonyl group in the coordination with the metal ion (Ghosh, 2006). However, absence of both the bands in Zn(II) and Cd(II) complexes indicate the destruction of carbonyl moiety as a result of the enolization and subsequent coordination of the enolate oxygen after the dissociation of proton and the formation of the > C⚌N—N⚌C < group. All these complexes also show low intensity broad band in the range 3382–3446 cm−1 assigned to stretching vibrations of ν (OH) group of water molecules (Alhadi et al., 2012). Besides this, complexes also show bands in the range 1547–1554 and 836–867 cm−1 assignable to δγ (H2O) and δw (H2O) respectively for coordinated water molecules (Mondal et al., 2008). The new bands of medium intensity in the region 502–584 and 416–482 cm−1 are assigned to ν(M–O) and ν(M–N) vibrations respectively and band around at 284–330 cm−1 is assigned to ν(M–Cl) mode (Cerchiaro et al., 2004). On the basis of IR spectral studies it is concluded that in case of the Mn(II), Co(II), Ni(II) and Cu(II) complexes the ligand acts as monobasic tridentate with ONO donor sequence while in Zn(II) and Cd(II) complexes it is dibasic tridentate. Complete IR spectral data of ligands and complexes are presented in Table 1 (for spectra see Fig. S1).
3.2 UV–visible reflectance spectral and magnetic moments studies
The magnetic moment and UV–visible reflectance data of paramagnetic complexes and associated ligand field parameters are presented in Table 2. The Mn(II) ion having d5 configuration, generally forms high-spin complex because of the additional stability of the half-filled d shell (Singh and Kumar, 2006). The reflectance spectrum of this complex exhibits three weak bands at 950, 700, and 415 nm which can be assigned to the 6A1g → 4T1g (4G), 6A1g → 4Eg, 4A1g (4G) and 6A1g → 4Eg (4D), transitions, respectively. This suggests an octahedral geometry around the metal ion (Chitrapriya et al., 2010). The magnetic moment value 5.74B.M. is in the expected range of octahedral geometry (Maurya et al., 2006). The Co(II) complex shows bands at 1190,630 and 515 nm corresponding to 4T1g→4T2g (F), 4T1g→4A2g (F) and 4T1g→4T2g (P), transitions, respectively. These bands are characteristics of high spin octahedral Co(II) complexes (El-Sherif, 2009; Taha et al., 2014). The ligand field parameters (Dq, B and β) calculated using Koing equations, are reasonably agree with those available experimentally for octahedral Co(II) complexes (Nakamoto, 1997; Bailar et al., 1975). The room temperature magnetic moment value of 4.64B. M. corresponded to the presence of three unpaired electrons indicating a quartet ground state, which was orbitally triply degenerate and would cause nan angular moment contribution to magnetic moment expected for octahedral geometry of Co(II) complex. The Ni(II) complex displayed three bands in its reflectance spectrum at 918,598 and 411 nm, which may be assigned to the transitions 3A2g→3T2g (F), 3A2g→3T1g (F), and 3A2g (F) →3T1g (P), respectively, of a typical octahedral structure (Abou-Hussen and Emara, 2004; Singh et al., 2007). The observed ν2/ν1 ratio (1.53) is expected for an octahedral Ni(II) complex. The calculated value of B (798 cm−1) for the present Ni(II) complex is lower than the free Ni(II) ion value (1011 cm−1), which indicates orbital overlap and delocalization of d-orbitals (Angelusiu et al., 2010; Cullity, 1977). Lower the value of B, greater will be the orbital overlap. Further, the β value for complex is less than one indicating considerable amount of covalent character in the metal–ligand bond (Aswar et al., 2009; Mishra et al., 2009). The magnetic moment value of 2.87B.M. is also in good agreement with an octahedral geometry (El-Behery and El-Twigry, 2007). The Cu(II) complex shows two bands at 848 and 694 nm, which are assigned to 2B1g → 2A1g and 2B1g → 2Eg, transitions, respectively (Chohan et al., 2003). The additional band appears at 480 nm assigned to ligand to metal charge transfer transition. The magnetic moment of Cu(II) complex was found to be 1.76B.M., which is higher than the spin-only value (1.73B.M.) expected for one unpaired electron and offers possibility of distorted octahedral geometry (Chohan et al., 2004). Zn(II) and Cd(II) complexes are found to be diamagnetic as expected for d10 configurations and do not have any d-d transitions.
Compound
µeff (B.M.)
Band positions (nm)
Assignments
Dq (cm−1)
B0(cm−1)
β
v2/v1
[Mn(HL)(Cl)(H2O)2] (1)
5.74
950
700
415
6A1g → 4T1g (4G)
6A1g→ 4Eg, 4A1g (4G)
6A1g → 4Eg (4D)–
–
–
–
[Co(HL)(Cl)(H2O)2] (2)
4.64
1190
630
515
4T1g → 4T2g (F)
4T1g → 4A2g (F)
4T1g → 4T2g (P)760
722
0.70
1.54
[Ni(HL)(Cl)(H2O)2] (3)
2.87
918
598
411
3A2g → 3T2g (F)
3A2g → 3T1g (F)
3A2g → 3T1g (P)1089
798
0.74
1.53
[Cu(HL)(Cl)(H2O)2] (4)
1.76
848
694
480
2B1g → 2A1g
2B1g → 4Eg
LMCT–
–
–
–
3.3 ESR study of Cu(II) complex
The solid state ESR spectrum of Cu(II) complex at room temperature is given in Fig. 1, which is anisotropic, consisting of two peaks, one of small intensity towards low field region and the other of large intensity towards high field region. The g tensor values calculated from the spectrum are: g‖‖ =2.28, g⊥ = 2.06 and gav = 2.13. Since obtained values follow: g‖‖ > g⊥, suggesting a tetragonal distortion around the Cu(II) ion along the four fold symmetry Z-axis. Further, g‖‖ > g⊥ > 2.0023 suggests that the unpaired electron is localized in the dx2-y2 orbital of the complex. The g‖‖ observed for the present Cu(II) complex is less than 2.3 indicating covalent character of the metal–ligand bond (Abdallah et al., 2010).![ESR spectrum of [Cu(HL)(Cl)(H2O)2] (4).](/content/184/2020/13/8/img/10.1016_j.arabjc.2020.06.012-fig3.png)
ESR spectrum of [Cu(HL)(Cl)(H2O)2] (4).
3.4 1H NMR spectral studies of ligand and Zn(II) complex
The essential features of the 1H NMR spectra of ligand and Zn(II) complex are essentially similar except few signals. The ligand showing a signal at δ = 12.0 ppm due to —OH proton in the 1H NMR spectrum of ligand is absent in the spectrum of Zn(II) complex, indicating the deprotonation of the —OH group followed by coordination of phenolate oxygen to zinc ion. Absence of signal due to NH proton in complex, which appears at δ = 11.0 ppm in ligand, also support the enolization of the ketonic group followed by coordination of enolate oxygen after proton replacement.
3.5 Mass spectral studies
Mass spectra of Cu(II),Ni(II) and Zn(II) complexes as a representative complexes were recorded to determine their molecular mass. Figs. S2–S4 are provided in supporting information. The mass spectra of Cu(II), Ni(II) and Zn(II) complexes show m/z peaks at 404, 398 and 351, respectively, corresponding to their molecular mass. All these peaks support the structure of the complexes and confirm the stoichiometry of metal chelates.
3.6 Powder XRD studies
Ligand and complexes were also analyzed by powder X-ray diffraction analysis (Figs. S5–S7). The presence of sharp reflection in XRD pattern of H2L ligand indicates the crystalline nature of ligand. The 2θ values and indexed X-ray diffraction data corresponding to the prominent peaks are listed in Table S1. The unit cell data and crystal lattice parameters of H2L (Fig. S5) are: a = 5.6400A, b = 7.0400, c = 8.1500, α = 97.060D, β = 103.400, γ = 91.090, V = 312.03 Å3, therefore system is triclinic. Indexed X-ray diffraction data and crystal lattice parameters of [Cu(HL)(Cl)(H2O)2] (Fig. S6) are: a = 16.0200A, b = 12.2400, c = 5.9500, α = 104.240D, β = 91.880, γ = 93.450, V = 1127.44 Å3, therefore system is triclinic (Table S2). Similarly, the data for [Zn(L)(H2O)] are (Fig. S6): a = 6.3300A, b = 13.1000, c = 4.0810, α = 102.390D, β = 97.900, γ = 116.210, V = 285.94 Å3, therefore system is triclinic (Table S3).
The average crystallite particle size of the [Cu(HL)(Cl)(H2O)2] and [Zn(L)(H2O)] complexes were calculated from Scherrer’s formula and using the full width at half maximum (FWHM) intensity of the patterns, the average particle sizes of the complexes are around 36.22 and 26.51 nm, respectively, indicating that the complexes are in nanocrystalline phase.
The average crystallite size of the H2L ligand was calculated from Scherrer’s formula. Using the full width at half maximum intensity of the patterns, the average sizes of the crystals are around 32.31 nm for H2L ligand indicating that the complex is in nano-crystalline phase.
3.7 SEM studies
The SEM micrographs of H2L ligand and complexes are shown in Fig. 2a. From the micrograph, it can be seen that solid ligand has a cubical shape like appearance. The morphology and the distribution of particle sizes of the Ni(II), Cu(II), Zn(II) and Cd (II) complexes are grouped together in [Fig. 2 (b-e)] and exhibit smooth and regular surface morphology. In general, the particle sizes of crystals are greater than 10 μm which are possibly due to agglomeration. However, a visible change on going from ligand to metal complexes can be visualized and most of the complexes are crystalline but tends towards amorphous. The results of energy dispersive x-ray analysis (EDS) plot inserted within each figure show the presence of nickel, copper, zinc and cadmium peak in respective complex and the estimated value matches with the metal content obtained in the experimental section.![Scanning electron microscopic images of (a) H2L, (b) [Ni(H2L)(Cl)(H2O)2], (c) [Cu(II)(H2L)(Cl)(H2O)2], (d) [Zn(L)(H2O)] and (e) [Cd(L)(H2O)]. Inset in all figures show energy dispersive x-ray analysis (EDS) plot of the corresponding complex.](/content/184/2020/13/8/img/10.1016_j.arabjc.2020.06.012-fig4.png)
Scanning electron microscopic images of (a) H2L, (b) [Ni(H2L)(Cl)(H2O)2], (c) [Cu(II)(H2L)(Cl)(H2O)2], (d) [Zn(L)(H2O)] and (e) [Cd(L)(H2O)]. Inset in all figures show energy dispersive x-ray analysis (EDS) plot of the corresponding complex.
3.8 Thermogravimetric analysis
Thermal analysis of ligand as well as complexes was carried out to understand their stability and decomposition pattern. Thermograms (weight % vs temp.) of these are presented in Fig. 3 and detailed analysis of weight losses are presented in Table 3. The ligand decomposes in one step with continuous weight loss on increasing temperature with no residue at the end. A look at the thermogram of the complexes indicates that they are thermally stable up to different temperatures. The complexes of Zn(II), Cd(II) decompose in two stages whereas Mn(II), Co(II), Ni(II), Cu(II), complexes exhibits there stage decomposition on increasing the temperature. The first stage mass loss corresponds to the loss of coordinated water molecules in the temperature range 90–210 °C. The continuous and rapid weight loss was noted above 260 °C corresponding to the decomposition of the coordinated ligand. The percent weight loss as computed from the thermograms of the complexes suggests that the final product of decomposition in all the cases corresponds to stable respective metal oxide.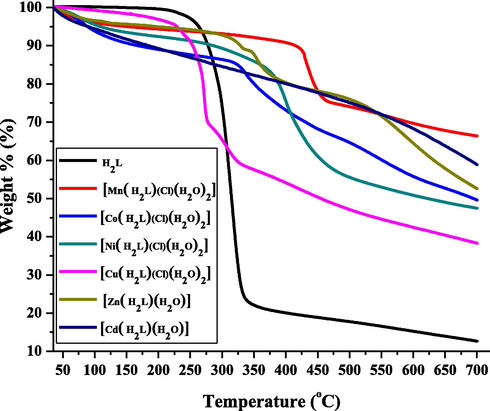
TGA profiles of H2L and its metal complexes.
Compound
Temp. range (°C)
% mass loss
Assignments
Found
Calcd.
[Mn(HL)(Cl)(H2O)2] (1)
90–185
185–210
210–7009.1
8.9
–9.1
8.8
–Loss of two coordinated water molecules
Loss of one coordinated chloride ion
Decomposition process with the formation of metal oxide
[Co(HL)(Cl)(H2O)2] (2)
95–185
185–210
210–7509.0
8.8
–9.0
8.8
–Loss of two coordinated water molecules
Loss of one coordinated chloride ion
Decomposition process with the formation of metal oxide
[Ni(HL)(Cl)(H2O)2] (3)
90–180
180–265
265–7009.0
8.8
–9.0
8.8
–Loss of two coordinated water molecules
Loss of one coordinated chloride ion
Decomposition process with the formation of metal oxide
[Cu(HL)(Cl)(H2O)2] (4)
90–185
185–210
210–7008.9
8.7
–8.9
8.7
–Loss of two coordinated water molecules
Loss of one coordinated chloride ion
Decomposition process with the formation of metal oxide
[Zn(L)(H2O)] (5)
90–180
180–7005.0
–5.0
–Loss of one coordinated water molecule
Decomposition process with the formation of metal oxide
[Cd(L)(H2O)] (6)
105–200
200–6804.5
–4.5
–Loss of one coordinated water molecule
Decomposition process with the formation of metal oxide
From the TG data various kinetic parameters viz energy of activation (Ea), frequency factor (Z), free energy change (ΔF) and entropy of activation (ΔS*) were calculated by employing Coats-Redfern method (Coats and Redfern, 1964) and values are summarized in Table 4. Generally, values of Z increases with decrease in Ea and the higher value of activation energy suggests the higher stability, but there lies some more inherent physical and chemical factors, which may cause a change or deviation in this trend. Higher value of Ea and lower values of z favors the reaction to proceed slower than normal. In the present studies, the numerical values of Ea and frequency factor (z) indicate the smoothness of the feasibility of the reaction and reaction rate of the initial reactants and intermediate stage compounds. The negative value of ΔS* indicates that the activated complex has a highly ordered or more rigid structure than that of either the reactants or intermediate and that the reactions are slower than normal. The similarity in the values of kinetic parameters indicates a common decomposition reaction mode in all the compounds besides showing first order kinetics.
Compound
Dec. Temp. (°C)
Activation Energy Ea (kJ mole–1)
Frequency factor (Z) (Sec–1)
Entropy change (–ΔS) (kJ mole–1)
Free energy change (ΔG) (kJ mole–1)
[Mn(HL)(Cl)(H2O)2]
185–210
46.22
2.89 × 10⁻¹¹
211.63
162.09
[Co(HL)(Cl)(H2O)2]
185–210
57.55
4.39 × 10⁻⁸
218.72
178.66
[Ni(HL)(Cl)(H2O)2]
180–265
58.64
6.32 × 10⁻¹⁰
293.57
108.56
[Cu(HL)(Cl)(H2O)2]
185–210
61.88
2.47 × 10⁻⁹
239.19
108.76
[Zn(L)(H2O)]
180–700
87.98
5.83 × 10⁻¹⁰
240.10
164.75
[Cd(L)(H2O)]
105–200
77.42
2.47 × 10⁻⁷
167.87
148.59
3.9 Antimicrobial activity study
The results of antibacterial and antifungal screening of metal complexes are presented in Table 5. The results on the antibacterial activity of Mn(II), Co(II), Ni(II) , Cu(II), Zn(II) and Cd(II) complexes indicate that they are slightly more effective against Gram +ve strains than the Gram –ve strains, though the level of action of a particular compound within the same type of bacteria is varying. This difference in the activity probably may be attributed to the fact that the cell wall of Gram +ve bacteria have more antigenic properties as the outer lipid membrane is of polysaccharides. Further, the metal complexes are better than the ligand. However, although the complexes showed promising activities against the bacterial strains, however, their activities were found to be less than the standard Ciprofloxacin (antibacterial drug) and Clotrimazole (antifungal drug). Among the active compounds, the Cu(II) complex ranks first as closed to standard drug Ciprofloxacin followed by the Ni(II) complex while others have no definite trend. Thus the results indicate that the ligand and metal complexes exhibit good activity.
Compounda
Minimum inhibitory concentration (μg ml−1)
S. aureus
B. subtilis
E. coli
S. typhi
A. niger
C. albicans
H2L
12
14
12
13
12
12
[Mn(HL)(Cl)(H2O)2]
16
17
15
16
20
19
[Co(HL)(Cl)(H2O)2]
18
16
15
15
19
15
[Ni(HL)(Cl)(H2O)2]
19
18
17
15
15
20
[Cu(HL)(Cl)(H2O)2]
22
20
19
18
20
25
[Zn(L)(H2O)]
14
15
12
14
18
16
[Cd(L)(H2O)]
15
16
14
13
15
15
Ciprofloxacin
23
22
20
22
–
–
Clotrimazole
–
–
–
–
22
24
The mode of action of the complexes may involve the formation of hydrogen bonds by the azomethine > C⚌N group with microbes or ribosomes of microbial cells resulting in interference with normal cell processes. A possible mode of toxicity can be speculated in the light of chelation theory (Tweedy, 1964). Chelation lowers the polarity of the metal ion considerably, owing mainly to the partial sharing of its positive charge with donor groups and possible π-electron delocalization over the whole chelate ring. The reduced polarity of the metal ion, in turn, increases its lipophilic character. This increased interaction most probably leads to the breakdown of permeability barrier of the cell, resulting in interface with the normal cell processes i.e. toxicity. However, chelation is not the only criterion for antimicrobial activity. Factors such as nature of metal ion, geometry of the complex, steric and pharmacokinetic factors, etc. also play an important role in deciding the antimicrobial potency of a compound. Apart from this, other factors such as solubility, conductivity and dipole moment influenced by the presence of metal ions may also be the possible reasons causing enhancement of the antimicrobial activity of the complexes as compared to free ligands.
4 Conclusions
Two series of metal complexes (i) [M(L)(Cl)(H2O)2] [M = Mn(II), Co(II), Ni(II) and Cu(II)] and (ii) [M(L)(H2O)] [M = Zn(II) and Cd(II)] with pyrazine-2-carbohydrazone based ligand have been synthesized and characterized. An octahedral geometry has been inferred for first series of complexes where ligand behaves monobasic tridentate coordinating through phenolate oxygen, azomethine nitrogen and ketonic oxygen atoms. Second series of complexes have tetrahedral geometry where ligand behaves as dibasic tridentate and enolate oxygen coordinate to metal ions in addition to phenolate oxygen, azomethine nitrogen. The TG analysis indicated that the complexes decompose in three or four overlapping steps where organic part of the complexes pass though one or two intermediates; finally they convert into the corresponding metal oxide. Antimicrobial screening of the free ligand and its complexes show good to high activity for Mn(II), Co(II), Ni(II) and Cu(II) complexes while moderate activity for Zn(II) and Cd(II) complexes.
Acknowledgements
The authors are thankful to Sophisticated Test & Instrumentation Centre, Cochin, Kerala for providing Powder XRD, SEM. Authors are also thankful to Sophisticated Analytical Instrument facility, Punjab University, Chandigarh for providing elemental analysis, IR and and facility. Sant Gadge Baba Amravati University, Amravati (Maharashtra) for providing laboratory facilities is also gratefully acknowledged.
References
- Arabian J. Chem.. 2010;3:103.
- J. Coord. Chem.. 2004;57:973.
- Bull. Chem. Soc. Ethiop.. 2012;26(1):95.
- Eur. J. Med. Chem.. 2010;45:2055.
- Eur. J. Inorg. Chem.. 2003;6:1145.
- J. Coord. Chem.. 2009;62(12):2037.
- Bioorg. Med. Chem. Lett.. 2013;23:5968.
- Comprehensive Inorganic Chemistry. New York: Pergamon Press; 1975. p. :389.
- Spectrochim. Acta, Part A. 2015;151:621.
- Trans. Met. Chem.. 2004;29:495.
- Trans. Met. Chem.. 2004;29:925.
- Inorg. Chim. Acta. 2010;363:3685.
- J. Enzyme Inhib. Med. Chem.. 2003;18:259.
- J. Enzyme Inhib. Med. Chem.. 2004;19:417.
- Adv. Cond. Matter Phys.. 2015;619:219.
- Nature. 1964;201:68.
- Elements of X-ray Diffraction. USA: Addison Wesley; 1977.
- J. Korean Chem. Soc.. 2008;52(5):468.
- Spectrochim. Acta, Part A. 2007;66:28.
- Synlett. 1994;10:795.
- Inorg. Chim. Acta. 2009;362:4991.
- Vogel’s Text Book of Practical Organic Chemistry (5th ed.). London: Longmans; 1976.
- Transition Met. Chem.. 2006;31:560.
- Bioorg. Med. Chem.. 2014;22:6529.
- Physiol. Plant Pathol.. 1977;11:13.
- J. Polym. Sci. Part B: Polym. Phys.. 2001;39:895.
- Heteroatom Chem.. 2003;14:223.
- Spectrochim. Acta, Part A. 2011;83:297.
- Polyhedron. 1993;12(2):159.
- J. Mol. Catal. A: Chem.. 2006;250:190.
- J. Organomet. Chem.. 2014;760:67.
- Martins, N.M.R., Anbu, S., Mahmudov, K.T., Ravishankaran, R., da Silva, M.F.C.G., Kopylovich, Martins, L.M.D.R.S., Karande, A.A., Pombeiro, A.J.L., 2017. New J. Chem. 41, 4076.
- Eur. J. Org. Chem.. 2002;1:203.
- J. Serb. Chem. Soc.. 2009;74:523.
- Mat. Sci. Eng. C-Mater.. 2016;69:1297.
- Polyhedron. 2008;27:2193.
- Infrared Spectra of Inorganic and Coordination Compounds (5th ed.). New York: John Willey & Sons; 1997.
- Synth. React. Inorg. Met. Org. Chem.. 1999;29:1365.
- J. Coord. Chem.. 2010;63(21):3859.
- Coord. Chem. Rev.. 1985;63:127.
- New J. Chem. 2019
- [CrossRef]
- J. Coord. Chem.. 2010;63:315.
- Spectrochim. Acta A.. 2007;66:1271.
- Trans. Met. Chem.. 2007;32:1051.
- Spectrochim. Acta, Part A. 2006;64:853.
- Spectrochim. Acta, Part A. 2014;130:429.
- Acc. Chem. Res.. 2014;47:2141.
- Phytophatology. 1964;55:910.
- Eur. J. Med. Chem.. 2019;166:291.
- Eur. J. Med. Chem.. 2012;48:313.
- Struct. Bond.. 1991;76:1.
- Anal. Methods. 2016;8:2863.
Appendix A
Supplementary material
Supplementary data to this article can be found online at https://doi.org/10.1016/j.arabjc.2020.06.012.
Appendix A
Supplementary material
The following are the Supplementary data to this article:Supplementary data 1
Supplementary data 1


