

Translate this page into:
Synthesis, characterization and biological studies of some Co(II), Ni(II) and Cu(II) complexes derived from indole-3-carboxaldehyde and glycylglycine as Schiff base ligand
*Corresponding author. Tel.: +91 462 233387 msnairchem@rediffmail.com (M. Sivasankaran Nair)
-
Received: ,
Accepted: ,
This article was originally published by Elsevier and was migrated to Scientific Scholar after the change of Publisher.
Available online 4 June 2010
Abstract
The Schiff base ligand derived from indole-3-carboxaldehyde(indal) and glycylglycine(glygly) were synthesized and characterized by elemental analysis, IR, electronic spectrum, 1H NMR and mass spectrum. Co(II), Ni(II) and Cu(II)–indal-glygly Schiff base complexes were synthesized and characterized by elemental analysis, molar conductance, IR, electronic spectra, magnetic measurements, ESR, electrochemical studies, TGA, DSC analysis, XRD and SEM. Conductance measurements indicate that the above complexes are 1:1 electrolytes. IR spectral data show that the ligand is tridentate and the binding sites are azomethine nitrogen, peptide nitrogen and carboxylato oxygen atoms. Electronic spectral measurements indicate tetrahedral geometry for Co(II) and Ni(II) complexes and square planar geometry for Cu(II) complex. Magnetic measurements show weak ferromagnetic behaviour for Co(II) and Ni(II) complexes and paramagnetic behaviour for Cu(II) complex. ESR spectral data shows the ionic link between metal and the Schiff base ligand. The metal complexes are found to be stabilized in the unusual oxidation states of the metal ion during electrolysis. Thermal analysis of the complex indicates that the decomposition takes place in three steps. IR and thermal studies indicate that the fourth position would be occupied by a water molecule in complexes. XRD shows that the complexes have the crystallite size of 31, 40 and 67 nm, respectively. The surface morphology of the complexes was studied by SEM. The antimicrobial activity of the ligand and its complexes were screened by Kirby Bayer Disc Diffusion method. DNA cleavage studies were performed for metal–Schiff base complexes in presence of hydrogen peroxide as oxidant.
Keywords
Schiff base
IR
Conductance
XRD
SEM
DNA

1 Introduction
Schiff bases have played a special role as chelating ligands in main group and transition metal coordination chemistry because of their stability under a variety of redox conditions and because imine ligands are borderline Lewis bases (De Souza et al., 2003). The important physical and biological properties of the Schiff bases are directly related to intermolecular hydrogen bonding and proton transfer equilibria (Przybylski et al., 2002). Schiff bases also offer opportunities for inducing substrate chirality, tuning metal-centered electronic factors and enhancing the solubility and stability of homogenous or heterogeneous catalysts (Kannan and Ramesh, 2005). Transition metals are involved in many biological processes which are essential to life process. The metals can coordinate with O- or N-terminals from proteins in a variety of models and play a crucial role in the conformation and function of biological macromolecules (Colacio et al., 2000; Karaliota et al., 2001).
In the area of bioinorganic chemistry, interest in Schiff base complexes has centered on the role of such complexes in providing synthetic models for the metal-containing sites in metallo-proteins and metallo-enzymes (Mascharak, 2002). Indole and its derivatives are widely used in making perfumes, dyes, agrochemicals and medicines. Furthermore, tetradentate and tridentate Schiff base complexes are increasingly important for designing metal complexes related to synthetic and natural oxygen carriers. Copper complexes of tridentate Schiff base type especially with dimeric units are considered as bioinorganic model compounds. During the recent years there have been intense investigations of different classes of indole derivative compounds. Many of these possess interesting biological properties such as antimicrobial and analgesic activities. The important criteria for the development of metallodrugs as chemotherapeutic agents are the ability of the metallo drug to bring about DNA cleavage. A large number of transition metal complexes because of their redox properties, have been found to promote DNA cleavage.
Recently, we have reported some Schiff base metal complex systems (Nair et al., 2007; Joseyphus et al., 2006; Joseyphus and Nair, 2008; Nair and Joseyphus, 2008). In this study, we report the synthesis, characterization and antimicrobial and DNA cleavage studies of some mononuclear Co(II), Ni(II) and Cu(II) complexes of Schiff base ligand derived from indole-3-carboxaldehyde and glycylglycine.
2 Experimental
2.1 Materials and reagents
The commercially available glycylglycine was purchased from Fluka, indole-3-carboxaldehyde was obtained from Lancaster and metal(II) nitrates were obtained from Merck. All other reagents and solvents were purchased from commercial sources and were of analytical grade. Solvents were purified and dried by standard methods (Vogel, 1978).
2.2 Synthesis of Schiff base ligand
Glycylglycine (1 mmol) was dissolved in 20 cm3 of methanol containing KOH (1 mmol). A solution of indole-3-carboxaldehyde (1 mmol) in 10 cm3 of absolute methanol was added dropwise with stirring and refluxed for 2 h. The volume of the yellow solution was cooled at room temperature and then reduced in vacuo using a rotary evaporator. Anhydrous ether was added to deposit a yellowish precipitate, which was then recrystallized from ethanol.
2.3 Synthesis of Schiff base metal complexes
Schiff base ligand (1 mmol) was dissolved in 10 cm3 of methanol and aqueous Co(II)/Ni(II)/Cu(II) nitrate (1 mmol) solution was added dropwise into 20 cm3 of methanol. The resulting mixture obtained was stirred for 2 h. After allowing it to stand in air at room temperature the precipitated complex was filtered off, washed several times with cold ethanol, ether and then dried in vacuo over anhydrous CaCl2.
2.4 Instruments
Elemental analysis was performed using a Perkin–Elmer elemental analyzer. Metal contents present in the complexes were determined by EDTA titration. Molar conductance of the complexes was measured in DMSO solutions using a coronation digital conductivity meter. IR spectra were recorded in KBr disc on a JASCO FT/IR-410 spectrometer in the 4000–400 cm−1 region. The electronic spectra were recorded on a Perkin–Elmer Lambda-25 UV–Visible spectrometer. The 400 MHz 1H NMR spectrum of the Schiff base ligand was recorded in JEOL GSX 400 FT NMR spectrometer using tetramethylsilane as internal standard. The FAB-mass spectrum of the Schiff base ligand was recorded on a JEOL SX 102/DA-6000 mass spectrometer/Data system using Argon/Xenon (6 kV, 10 mA) as the FAB-gas. The accelerating voltage was 10 kV and the spectrum was recorded at room temperature using m-nitrobenzylalcohol as the matrix. Magnetic susceptibility measurements of the powdered complexes were carried out by employing the Guoy’s method at room temperature. Copper sulphate was used as calibrant. Room temperature magnetic measurements were performed on an EG & G PARC vibrating sample magnetometer with a maximum applied field of 7 Oe. X-band ESR spectra of Cu(II) complexes were recorded on a Varian E112 X-band spectrometer. Eletrochemical studies were carried out on a Bio Analytical System CV-50W electrochemical analyzer. The tetrabutylammonium perchlorate was used as the supporting electrolyte. Thermal studies were recorded on a Perkin–Elmer 7 series thermal analyzer, with a heating rate of 10 °C/min using N2 atmosphere. XRD was recorded on a Rigaku Dmax X-ray diffractometer with CuKα radiation (λ = 1.5404 Å). SEM images were recorded in a Hitachi SEM analyzer.
2.5 Antimicrobial studies
Antibacterial and antifungal activity of the ligand and its metal complexes were tested in vitro against the bacterial species viz S. aureus, E. coli, K. pneumaniae, P. vulgaris and P. aeruginosa and the fungal species C. albicans, R. stolonifer, A. flavus, A. niger and R. bataicola by Kirby Bayer Disc Diffusion method (Bayer et al., 1996). Amikacin, ofloxacin and ciprofloxacin were used as the standard antibacterial agents whereas nystatin was used as the standard antifungal agent. The test organisms were grown on nutrient agar medium in petri plates. Discs were prepared and applied over the long culture. The compounds were prepared in DMSO and soaked in filter paper disc of 5 mm diameter and 1 mm thickness. The concentrations of ligand and the complexes used in this study was 0.01 μg/ml. The discs were placed on the previously seeded plates and incubated at 37 °C and the diameter of inhibition zone around each disc was measured after 24 h for antibacterial activity and after 74 h for antifungal activity.
2.6 DNA cleavage studies
The DNA cleavage experiment was conducted using CT DNA by gel electrophoresis method. Cleavage reactions were run between the metal complexes and the DNA, and the solutions were diluted with loading dye using 1% agarose gel. Buffer solutions of 50 mmol tris–HCl/18 mmol NaCl in water (pH 7.1) and tris-acetic acid-EDTA in water (pH 8.3) were used, followed by the addition of 0.5 g of powdered agarose and mixed well. The solution was heated to boiling to dissolve agarose completely. The completely dissolved agarose gel solution was kept in the water bath at 65 °C. Then 3 μl of ethidium bromide (0.5 μg/ml) was added to the above solution and mixed well. The warmed agarose was poured and clamped immediately with comb to form sample wells. After setting (30–45 min. at room temperature) comb was removed and taped. The gel was mounted into electrophoretic tank. Enough electrophoretic buffers were added to cover the gel to a depth of about 1 mmol. The DNA sample (30 μm), 50 μm metal complex and 500 μm H2O2 in tris–HCl/50 mmol NaCl buffer (pH 7.1) were mixed with loading dye and loaded into the well of the submerged gel using a micropipette. The electric current was passed into running buffer. The sample was running from negative to positive pole (Pelczar et al., 1998). After 1–2 h the gel was taken out from the buffer. After electrophoresis, the gel was photographed under UV transilluminator.
3 Results and discussion
3.1 Synthesis and characterization of ligand
Schiff base ligand is light yellow in colour and it is soluble in common organic solvents. The Schiff base formed was characterized with respect to its composition by elemental and spectral analysis. The physical characterization and its analytical data are given in Table 1. Elemental analysis data of the ligand show good agreement with theoretical values.
Compounds
Formula
Colour
Analytical (%) calculated (found)
Molar conductance (Ω−1 cm2 mol−1)
C
H
N
M
K[L]
KC13H12N3O3
Yellow
52.51 (52.35)
4.07 (4.05)
14.13 (14.08)
–
–
[CoL(H2O)]NO3
CoC13H14N4O7
Pink
39.31 (39.71)
3.55 (3.20)
14.11 (14.55)
14.84 (14.54)
69.81
[NiL(H2O)]NO3
NiC13H14N4O7
Pale green
39.33 (39.69)
3.55 (3.18)
14.11 (14.76)
14.78 (14.48)
70.72
[CuL(H2O)]NO3
CuC13H14N4O7
Blue
38.86 (38.64)
3.51 (3.16)
13.94 (13.67)
15.81 (15.91)
73.32
In the IR spectrum of indal-glygly, the characteristic stretching frequency of the azomethine group, (C⚌N) has occurred at 1618 cm−1 and the νasym(COO−) and νsym(COO−) have appeared, respectively at 1587 and 1384 cm−1. The amide band of the potassium salt of the Schiff base ligand was seen at 1532 cm−1. The imine (N–H) stretching frequency of glygly at 3100 cm−1 and carbonyl oxygen (C⚌O) stretching frequency of indal at 1700 cm−1 have disappeared in the Schiff base ligand. This confirms the formation of indal-glygly from indal and glygly. The electronic spectrum of indal-glygly ligand exhibits an absorption band at 307 nm, which can be attributed to the π–π* transition of the azomethine chromophore.
1H NMR spectrum of indal-glygly shows the azomethine proton (–HC⚌N–) signal at 8.2 ppm and amide proton (–CONH–) signal at 7.6 ppm. The (–NH–) proton of indole ring shows the signal at 10.3 ppm and aromatic protons show the multiplet (aromatic-CH⚌CH–) at ∼7.4–8.0 ppm. The two aliphatic protons (aliphatic-CH2–) in the chain show the multiplet signal at ∼3.8–4.2 ppm.
The fast atom bombardment mass spectrum of indal-glygly recorded at room temperature shows the fragmentation pattern with the base peak (M+) at m/z = 259 (C13H12N3O3+). The fragments at m/z = 143 and 116 corresponds, respectively to C11H9N2O+ and C9H7N2+. Based on the above studies, the proposed structure of indal-glygly is given in Fig. 1. The Schiff base ligand can bind the metal ion through azomethine, peptide and carboxylato groups.
Proposed structure of Schiff base ligand.
3.2 Synthesis and characterization of metal complexes
The complexes are stable in air and atmosphere. All the complexes are soluble in DMSO, but they are insoluble in some common organic solvents. The analytical data (Table 1) indicate that the metal to ligand ratio is 1:1 in all the complex systems and it can be represented as [ML(H2O)] NO3, where L = indole-3-carboxaldehyde-glycylglycine(indal-glygly); M = Co(II), Ni(II) and Cu(II). The molar conductivity of metal complexes in DMSO solution (10−3 M) at room temperature was measured to establish the charge of the metal complexes. The high molar conductance values (Table 1) indicate that all the metal complexes behave as 1:1 electrolytes (Geary, 1971) as evidenced by the non-involvement of the nitrate group in coordination.
3.2.1 Infrared spectral studies
The Schiff base ligand shows ν(C⚌N) azomethine band at 1618 cm−1. On complexation, this band was shifted to lower frequency values in all the complexes (Table 2). It indicates that the azomethine nitrogen is coordinated to the metal ions (Nakamoto, 1997). In the spectrum of Schiff base ligand, the peptide band appeared at 1532 cm−1. On complexation, this band was shifted to lower frequency values (Table 2) indicating the linkage between metal ion and the peptide nitrogen atom (Nakamoto, 1997). The asymmetric carboxyl νasym(COO−) was shifted to higher frequency region and the symmetric carboxyl νsym(COO−) was shifted to lower frequency region (Table 2), indicating the linkage between the metal ion and carboxylato oxygen atom (Deacon and Phillips, 1980; Szorcsik et al., 2004). The νasym(COO−) and νsym(COO−) of the carboxylato group in the complexes show the separation value (Δν) greater than 200 cm−1. This indicates monodentate binding of the carboxylato group in Co(II), Ni(II) and Cu(II) complexes (Grag et al., 2005). Furthermore, the presence of coordinated water molecules as evidenced by broad bands appeared at 3389–3415 cm−1 in complexes may be attributed to O–H stretching vibration as supported from the thermal analysis (Mohamed et al., 2005). The IR spectra of the complexes show the bands appeared at 1361–1371 cm−1, which can be ascribed to the presence of free NO3 group (Khalil, 2000). The appearance of two bands at 519–534 and 417–449 cm−1 correspond to ν(M–O) and ν(M–N) vibrations, (El-Jouad et al., 2001), respectively.
Compound
ν(C⚌N)
ν(O–H)
ν(peptide)
νasym(COO−)
νsym(COO−)
ν(M–N)
ν(M–O)
K[L]
1618
3364
1532
1591
1386
–
–
[CoL(H2O)]NO3
1607
3415
1527
1593
1385
522
443
[NiL(H2O)]NO3
1612
3393
1526
1596
1381
519
417
[CuL(H2O)]NO3
1608
3389
1523
1590
1382
524
435
Thus the IR spectrum indicates that the Schiff base ligand (Fig. 1) in all the complexes under investigation is tridentate and the binding sites are azomethine nitrogen, peptide nitrogen and carboxylato oxygen atoms in all the three M(II)–indal-glygly complexes. The fourth position in the coordination sphere would be completed by water molecule.
3.2.2 Electronic spectral measurements
The UV–Visible spectrum of the Schiff base ligand exhibits an absorption band at 307 nm in DMSO solution, which can be attributed to π–π* transition of the azomethine chromophore. On complexation, this band was shifted to lower wavelength region, suggesting the coordination of azomethine nitrogen with the metal ions (Lever, 1968).
The spectrum of Co(II) complex of indal-glygly shows a peak with λmax value of 625 nm. This is due to the tetrahedral environment of the ligand around the metal ion due to 4A2(F) → 4T1(P) transition. Hence, Co(II) complex can be assigned tetrahedral geometry. The spectrum of Ni(II) complex of indal-glygly shows an absorption band at 582 nm. This peak corresponds to the transition 3T1(F) → 3T1(P) which indicates the tetrahedral environment of the ligand surrounding Ni(II) in the complex (Lever, 1968). In general, due to Jahn–Teller distortion, square planar Cu(II) complexes give a broad absorption band between 600 and 700 nm. The present Cu(II) complex shows the band at 681 nm suggesting the complex to have square planar geometry.
3.2.3 Magnetic susceptibility measurements
The observed magnetic moment value of the Co(II)–indal-glygly complex is 4.66 BM. This is the expected value of 4.2–4.88 BM for the tetrahedral Co(II) complexes, which is the sum of contributions due to spin only moments and spin–orbit coupling. Thus, the Co(II)–indal-glygly complex shows the tetrahedral geometry. The magnetic moment value of 3.57 BM for the Ni(II)–indal-glygly complex is in the range of 3.2–4.0 BM expected for the tetrahedral Ni(II) complexes. Cu(II) square planar complexes exhibit magnetic moments in the range 1.8–2.1 BM. These values are slightly higher than the spin only value of 1.73 BM and this is due to the spin–orbit coupling followed by lowering of symmetry (Banerjea, 1993). The magnetic moment obtained for Cu(II)–indal-glygly complex is 1.81 BM, which is characteristic for the square planar geometry of the Cu(II) complexes.
The vibrating sample magnetometer measurements (Fig. 2a and b) shows the plot of magnetization (M) as a function of applied field (H) for the Co(II) and Ni(II) complexes. The plots show the hysteresis loop for complexes at room temperature and give a saturation magnetization of 0.25 emu/g. The coercivities of the Co(II) and Ni(II) complexes were 340 and 706 Oe, respectively. The low saturation magnetization and the presence of coercivities for the samples indicate that these complexes are weakly ferromagnetic (Cullity, 1972). But Cu(II) complex did not show any hysteresis loop at room temperature indicating that the Cu(II) complex is paramagnetic (Cullity, 1972; Joseph et al., 2005) in nature.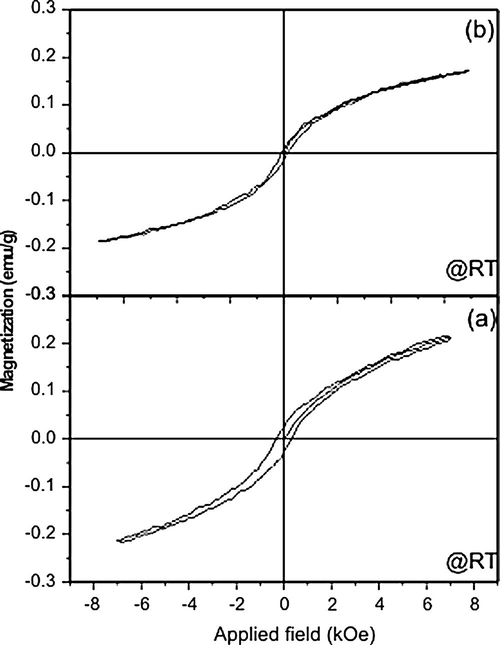
Magnetization versus applied field plots for (a) Co(II) and (b) Ni(II) Schiff base complexes.
3.2.4 Electron spin resonance spectra
The ESR spectra of the Cu(II) complex recorded in DMSO at 300 and 77 K are shown in Fig. 3a and b. The spectrum recorded at 300 K shows one intense absorption band at high field, which is isotropic due to the tumbling motion of the molecules. However, this complex in the frozen state shows four well resolved peaks with low intensities in the low field region and one intense peak in the high field region. The magnetic susceptibility of 1.81 BM for the Cu(II)–indal-glygly complex indicates the presence of one unpaired electron, showing the complex to be mononuclear in nature. This fact is also evident from the absence of a half field signal, observed in the ESR spectrum at 1600 G due to the ms = ±2 transitions, ruling out any Cu–Cu interaction (Farmer and Urbach, 1974; Ray and Kantiman, 1990; Antosik et al., 1969; Ismail, 2005). For the present Cu(II) complex, the observed g values are g|| (2.45) > g⊥ (2.13) > ge (2.0023), suggesting the unpaired electron to be in the
orbital and the complex is square planar.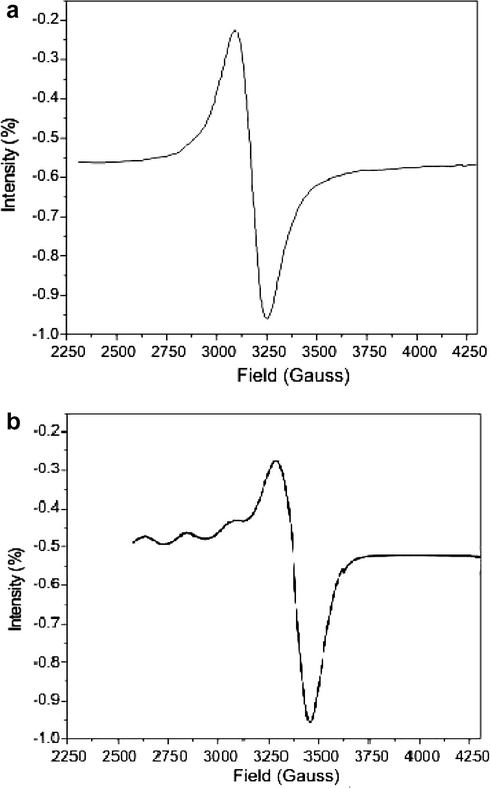
ESR spectra of Cu(II) Schiff base complexes at (a) 300 K and (b) 77 K.
In the axial spectra, the g-values are related with exchange interaction coupling constant (G). The observed value of 3.5 for G in the present copper complex suggests that significant exchange coupling is present and the misalignment is appreciable, and the unpaired electron is present in the
orbital. This result also indicates that the exchange coupling effects are not operative in the present complex. It is usual to determine the covalent bonding parameters for Cu(II) in various ligand field environments. In a square planar Cu(II) complex, the unpaired electron resides in the
orbital and g// and g⊥ are given in the order g|| > g⊥ > 2. When the unpaired electron is in the
orbital g|| and g⊥ are given in the order g⊥ > g|| > 2. The exchange interaction coupling constant G is calculated from Eq. (1).
According to Hathaway (Hathaway and Tomlinson, 1970), if G > 4.0, the local tetragonal axes are aligned parallel or only slightly misaligned. If G < 4.0, significant exchange coupling is present and the misalignment is appreciable. The in-plane σ-bonding covalency parameters (Fidone and Stevens, 1959), α2 are related to g|| and g⊥ according to Eq. (2).
The α2 value of 0.5 indicates complete covalent bonding, while that of 1.0 suggests complete ionic bonding. The out-of-plane π-bonding (γ2) and in-plane π-bonding (β2) parameters are calculated using Eqs. (3) and (4).
Here, λ = −828 cm−1 for free Cu(II) ion and E is the electronic energy for 2B1g → 2A1g transition This is also confirmed by orbital reduction factors K, which can be estimated using Eqs. (5) and (6).
Significant information about the nature of bonding in the Cu(II) complex can be derived from the relative magnitudes of K|| and K⊥. In the case of pure σ-bonding, K|| ≈ K⊥ = 0.77, whereas K|| < K⊥ implies considerable in-plane π-bonding, while for out-of plane π-bonding K|| > K⊥. Molecular orbital coefficients α2 (in-plane σ-bonding), β2 (in-plane π-bonding) and γ2 (out-plane π-bonding) were calculated using the Eqs. (2)–(4). The observed α2 value (0.916) indicates that Cu(II) complex is predominantly ionic in character. The observed β2 value (1.17) and γ2 value (1.32) shows that there is interaction in the out-of-plane π-bonding, whereas the in-plane π-bonding is predominantly ionic. This is also confirmed by orbital reduction factors (West, 1984) which were estimated from the simple relations. For the present complex, the observed order K⊥(1.21) > K||(1.07) implies a greater contribution from in-plane π-bonding than for out-of-plane π-bonding in metal–ligand π-bonding. Thus, the ESR study of the copper complex has provided supporting evidence for the optical results.
3.2.5 Electrochemical studies
The electrochemical behaviour of the Co(II), Ni(II) and Cu(II) complexes were examined in DMSO solution at 0.1 V s−1 scan rate and the results are summarized in Table 3. The cobalt complex shows (Table 3) an irreversible peak at −0.720 V which is attributed to Co(II)/Co(I) couple. The nickel complex also shows (Table 3) an irreversible peak at 0.740 V. This is due to Ni(II)/Ni(I) couple.
Compound
Couple
Epc (V)
Epa (V)
ipc (μA)
ipa (μA)
[CoL(H2O)]NO3
Co(II)/Co(I)
−0.720
–
15.0
–
[NiL(H2O)]NO3
Ni(II)/Ni(I)
–
0.740
–
3.0
[CuL(H2O)]NO3
Cu(II)/Cu(III)
−0.730
−0.620
12.5
9.2
The cyclic voltammogram of Cu(II) complex (Fig. 4) in DMSO solution at 300 K in the potential range +0.2 to −1.2 V and at scan rate 0.1 V s−1 was recorded. It shows a well defined redox process corresponding to the quasi-reversible Cu(II)/Cu(I) couple. The anodic peak at Epa = −0.730 V versus Ag/AgCl and the associated cathodic peak at Epc = −0.620 V correspond to the Cu(II)/Cu(I) couple. The Cu(II) complex exhibits a quasi-reversible behaviour as indicated by the non-equivalent current intensity of cathodic and anodic peaks and a peak separation, ΔEp value of 110 mV. The quasi-reversibility of the Cu(II)/Cu(I) couple was checked by varying the scan rates with peak potentials (Long et al., 1999; Arslan et al., 2002). The complex is found to be stabilized in the unusual oxidation state of copper in its +1 oxidation state during electrolysis. These observations suggest that indal-glygly can stabilize Cu(I) ion probably because of its indole group having π back bonding effect (Bottcher et al., 1997). These observation suggested that the ligand can stabilize the unusual oxidation states of Co(I) and Ni(I) for cobalt and nickel complexes during electrolysis whereas Cu(III) for copper complex.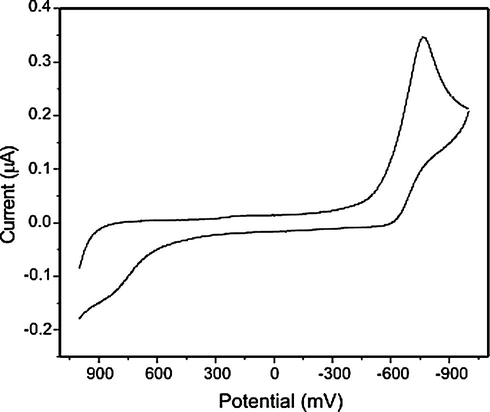
Cyclic voltammogram of Cu(II) Schiff base complex.
3.2.6 Thermal studies
The thermal behaviour of the complexes has been studied using TGA and DSC analysis.
3.2.6.1 TGA analysis
The thermal decomposition results of Cu(II) complex takes place in three stages. The first stage (Fig. 5a) of decomposition is noticed in the temperature range 120–135 °C. It is due to the elimination of coordinated water molecule (Vargova et al., 2004). The mass loss observed in this step is 4.45% against the calculated loss of 4.37%. The second stage of decomposition occurs in the temperature range of 210–235 °C, due to melting and partial decomposition of the ligand, this step bringing the weight loss of 17% (calc. 17.76%). The decomposition range (310–335 °C) of weight loss in third stage gives 70% (calc. 70.21%). This is due to the decomposition of the ligand molecule. The complex is present in the form of its metal oxide above 400 °C.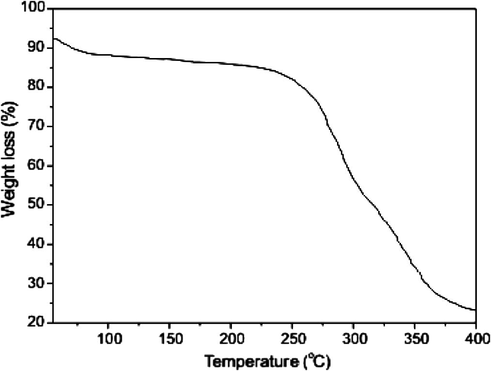
TGA curve of Cu(II) Schiff base complex.
3.2.6.2 DSC analysis
The DSC curve of the Cu(II) complex (Fig. 5b) shows an exothermic peak at ∼125 °C due to the evaporation of the coordinated water molecule. Another sharp endothermic peak at 215 °C is noticed probably due to the melting and partial decomposition of the complex. The broad exothermic peak in the temperature region 320–330 °C is due to the final decomposition of the complex. The final residue in the complex above 400 °C is the metal oxide in keeping with the observation made in the case of monomeric systems. Similar type of TGA and DSC results (Table 4) were obtained for Co(II) and Ni(II) complexes.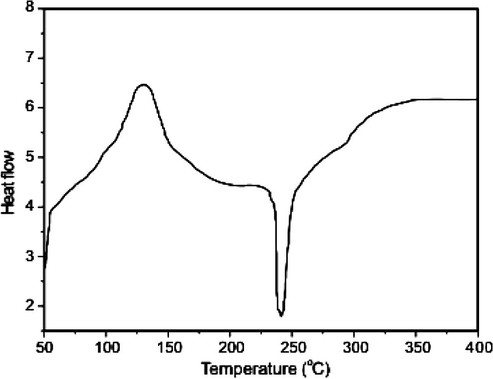
DSC curve of Cu(II) Schiff base complex.
Compound
Temperature range (°C)
Loss in weight found (calc.) (%)
DSC peak (°C)
ΔH (J g−1)
Assignments
[CoL(H2O)]NO3
50–136
136–285
287–3979.2 (9.17)
8.89 (8.86)
81.68 (81.43)149
181
38187.79
54.27
−79.85H2O
Ligand
CoO
[NiL(H2O)]NO3
50–141
141–246
246–4006.6 (6.17)
16.27 (16.76)
77.07 (77.21)117
159
38467.92
28.27
−92.52H2O
Ligand
NiO
[CuL(H2O)]NO3
50–164
164–260
260–4005.5 (5.17)
17 (17.76)
77 (77.21)134
250
39194.01
−42.70
73.79H2O
Ligand
CuO
3.2.7 X-ray diffraction studies
XRD pattern of the Co(II), Ni(II) and Cu(II) complexes are shown in Figs. 6(a–c). The XRD pattern of the metal complexes shows well defined crystalline peaks indicating that the samples were crystalline in phase (Souaya et al., 2000; Yaacob, 2005). The metal complexes show sharp crystalline XRD patterns, which differ considerably from that of the ligand. The appearance of crystallinity in the metal–Schiff base complexes is due to the inherent crystalline nature of the metallic compounds. The grain size of the metal Schiff base complexes, dXRD was calculated using Scherre’s formula (Cullity, 1978) by measuring the full width at half maximum of the XRD peaks.
where ‘λ’ is the wavelength, ‘β’ is the full width at half maximum and ‘θ’ is the peak angle. The complexes have the average crystallite size of 31, 40 and 67 nm, respectively suggesting that the complexes are nanocrystalline.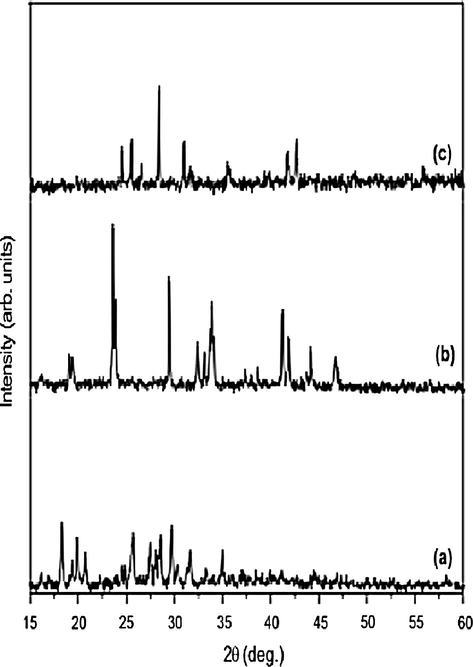
XRD pattern of (a) Co(II), (b) Ni(II) and (c) Cu(II) Schiff base complexes.
3.2.8 Scanning electron microscope
The SEM micrographs of the Co(II), Ni(II) and Cu(II) complexes are shown in Figs. 7a–c, respectively. It is seen from the figures that the Co(II) and Ni(II) complexes shows platelet-like structure, while Cu(II) complex exhibit the cauliflower-like structure. The particle sizes of the Co(II), Ni(II) and Cu(II)–indal-glygly complexes were in the diameter range of few microns. However, particles with size less than 100 nm were also observed which groups to form agglomerates of larger size. The average crystallite size obtained from XRD also shows that the particles were agglomerated that these complexes have polycrystalline with nanosized grains.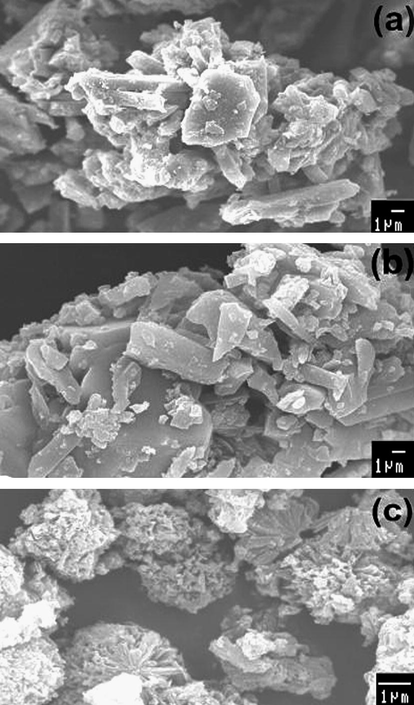
SEM images of (a) Co(II), (b) Ni(II) and (c) Cu(II) Schiff base complexes.
3.3 Antimicrobial studies
The antibacterial and antifungal activities of the Schiff base ligand and its Co(II), Ni(II) and Cu(II) complexes were compared with standard antibiotics like Amikacin, Ofloxacin, Ciprofloxacin and Nystatin. The antibacterial and antifungal results are summarized in the Table 5a and b. The antibacterial and antifungal activity of the ligand and its metal complexes indicate that the complexes possess higher growth inhibition potential compared to those of the ligand. The antimicrobial activity of the metal complexes increases with increase in concentration of the complexes. It is suggested that the complexes having antibacterial and antifungal activities inhibit multiplication process of the microbes by blocking their active sites (Sari et al., 2003; Mohamed, 2006; Mishra and Singh, 1993).
Compounds
Gram positive bacteria
Gram negative bacteria
S. aureus
K. pneumaniae
P. vulgaris
E. coli
P. aeruginosa
K[L]
5
3
6
4
10
[CoL(H2O)]NO3
27
24
18
14
20
[NiL(H2O)]NO3
18
22
15
10
14
[CuL(H2O)]NO3
34
28
22
24
28
Amikacina
36
38
40
44
48
Ofloxacina
42
40
38
32
36
Ciprofloxacina
38
30
28
24
34
Compounds
C. albicans
R. stolonifer
A. niger
A. flavus
R. bataicola
K[L]
6
12
10
8
4
[CoL(H2O)]NO3
18
22
20
22
16
[NiL(H2O)]NO3
12
18
16
20
10
[CuL(H2O)]NO3
26
32
28
30
20
Nystatina
30
38
42
36
28
The mechanism of toxic activity of the complexes with the ligands can be ascribed to the increase in the lipophilic nature of the complexes arising from chelation. Chelation reduces the polarity of the metal atom mainly because of partial sharing of its positive charge with the donor groups and possible π electron delocalization within the whole chelate ring. The chelation also increases the lipophilic nature of the central metal atom, which subsequently favours the permeation through the lipid layer of cell membrane. The mode of action of complexes involves the formation of hydrogen bonds with the imino group by the active sites leading to interference with the cell wall synthesis (Bayer et al., 1996). This hydrogen bond formation damages the cytoplasmic membrane and the cell permeability may also be altered leading to cell death.
The bioactivity of the ligand and its complexes is found to be in the order: Cu(II) > Co(II) > Ni(II)>indal-glygly. The difference in antimicrobial activity is due to the nature of metal ions and also the cell membrane of the microorganisms. The higher bioactivity of the complexes compared to that of the ligand is due to the decrease in the charge localization of the metal ion that leads to more lipid solubility. The higher activity of Cu(II) complexes can be explained as, on chelation the polarity of Cu(II) ion is found to be reduced to a greater extent due to the overlap of the ligand orbital and partial sharing of the positive charge of the copper ion with donor groups. Therefore, Cu(II) ions are adsorbed on the surface of the cell wall of microorganisms (Ferrari et al., 1999; Wahab et al., 2004). The adsorbed Cu(II) ions disturb the respiratory process of the cells, thus blocking the synthesis of proteins. This, in turn, restricts further growth of the organisms.
3.4 DNA cleavage studies
There are a number of agents, which exert their effect by inhibiting enzymes that act upon DNA. These inhibitions result from the binding of agents to the enzyme’s site of interaction on DNA. Transition metals have been seen to inhibit DNA repair enzymes. When DNA is run on horizontal gel using electrophoresis, the fastest migration will be observed for the open circular form (Form I). If one strand is cleaved a slower-moving linear form (Form II) is observed. Gel electrophoretic experiment using CT DNA was performed with metal complexes at 35 °C in the presence of H2O2 as oxidant. The DNA cleavage efficiency of the complex was due to the different binding affinity of the complex to DNA. Control experiment using DNA alone (Lane 1) does not show any significant cleavage even on longer exposure time (Pelczar et al., 1998).
The results (Fig. 8a) indicate that the present copper complex (Lane 4) can cleave DNA effectively compared to other complexes. The other complexes do not cleave DNA in the presence of H2O2. Probably this is due to the formation of redox couple of the metal ions and its behaviour. The redox cycling between Cu(II) and Cu(I) can catalyze the production of highly reactive hydroxyl radicals. These hydroxyl radicals (Pelczar et al., 1998) participate in the oxidation of the deoxyribose moiety, followed by hydrolytic cleavage of the sugar–phosphate backbone. It is observed that most cleavage cases are caused by copper ions reacting with H2O2 to produce the diffusible hydroxyl radical or molecular oxygen, which may damage DNA through Fenton type chemistry. Further, the presence of a smear in the gel diagram indicates the presence of radical cleavage.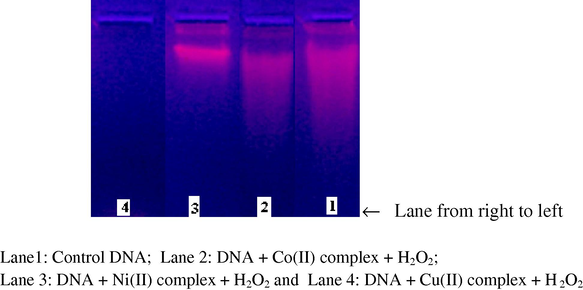
Agarose gel (1%) showing the results of electrophoresis of CT DNA with Schiff base metal complexes.
3.5 Investigation of the active oxygen species
In the presence of reactive oxygen donor species, copper is thought to be able to form different intermediates, depending on the specific complex and conditions. A non-diffusible copper–oxene intermediate has been invoked in some cleavage reactions, while in others Fenton-type chemistry which involves release of diffusible hydroxyl radicals has been suggested. In order to study the active species, standard scavengers of reactive oxygen intermediates were included in the electrophoretic studies. To understand the active oxygen species in the reactions, inhibition experiments were carried out with standard scavengers for reactive oxygen intermediates and degradation experiments with Rhodamine B dye (552 nm). The degradation of the dye provides a direct measure of the concentrations of hydroxyl radicals (Fig. 8b) in the reaction mixture. From the observation, it is suggested that reactive oxygen species can be produced by the copper complex in the presence of oxidant.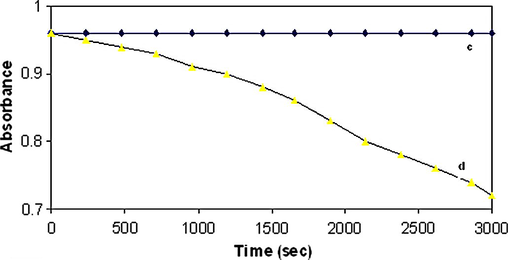
Rhodamine B degradation followed by decrease of absorbance at 552 nm, pH 8.1 in 10 mmol phosphate buffer: (c) in presence of 0.1 mmol Cu(II) complex and (d) in presence of 0.1 mmol Cu(II) complex, 1 mmol H2O2 and 10 mmol ascorbic acid.
4 Conclusion
Co(II), Ni(II) and Cu(II) complexes of the Schiff base ligand derived from glycylglycine and indole-3-carboxaldehyde were synthesized and characterized. Conductance measurements indicated that the complexes are 1:1 electrolytes. The results clearly demonstrate that the Schiff base ligand is tridentate, Co(II) and Ni(II) complexes have tetrahedral geometry, while the Cu(II) complex has square planar geometry. IR and thermal studies indicated that the fourth position would be occupied by a water molecule in complexes. XRD pattern of the complexes showed the crystallite size of 31, 40 and 67 nm, respectively. The surface morphology using SEM showed that the particles were agglomerated in all the complexes. The antimicrobial activity of the ligand and its complexes indicate that the Cu(II) complexes possess high bacterial and fungal activities than the other complexes and ligand. Such activity is explained on the basis of chelation theory and overtones concept. Copper ions are proved to be essential for the growth-inhibitor effect. The extent of inhibition appeared to be strongly dependent on the initial cell density and on the growth medium. Gel electrophoretic experiment using CT DNA were performed with metal complexes in the presence of H2O2 as an oxidant. In order to study the active species, standard scavengers of reactive oxygen intermediates were included in the electrophoretic studies.
Acknowledgement
We thank the Department of Nuclear Physics, University of Madras, Guindy Campus, Chennai, India for extending their research facilities to carry part of this study.
References
- J. Chem. Soc. A. 1969;545
- Thermochim. Acta. 2002;383:69.
- Banerjea, D., 1993. Coordination Chemistry. Tata McGraw-Hill Publisher.
- Am. J. Clin. Pathol.. 1996;45:493.
- Inorg. Chem.. 1997;36:2498.
- Inorg. Chem.. 2000;39:2882.
- Introduction to Magnetic Materials. London: Addison-Wesley Publisher; 1972.
- Elements of X-ray Diffraction (second ed.). Publisher, Philippines: Addison-Wesley; 1978.
- Inorg. Chim. Acta. 2003;50:348.
- Coord. Chem. Rev.. 1980;33:227.
- Polyhedron. 2001;20:67.
- Inorg. Chem.. 1974;13:587.
- Inorg. Chim. Acta. 1999;286:134.
- Proc. Phys. Soc. Lond.. 1959;73:116.
- Coord. Chem. Rev.. 1971;7:81.
- Spectrochim. Acta A. 2005;61:141.
- Coord. Chem. Rev.. 1970;5:1.
- J. Coord. Chem.. 2005;58:141.
- Mater. Lett.. 2005;59:2720.
- Transition Met. Chem.. 2006;31:699.
- Mycobiology. 2008;36(2):93.
- J. Coord. Chem.. 2005;58(7):567.
- J. Inorg. Biochem.. 2001;84:33.
- J. Coord. Chem.. 2000;52:73.
- Lever, A.B.P., 1968. Inorganic Electronic Spectroscopy, second ed. Elsevier, New York.
- J. Chem. Soc., Dalton Trans.. 1999;12:1999.
- Coord. Chem. Rev.. 2002;225:201.
- Indian J. Chem. A. 1993;32:446.
- Spectrochim. Acta A. 2006;64:188.
- Spectrochim. Acta A. 2005;62:1140.
- Spectrochim. Acta A. 2008;70:749.
- J. Coord. Chem.. 2007;60:1291.
- Infrared and Raman Spectra of Inorganic and Coordination Compounds (fifth ed.). New York: Wiley; 1997.
- Pelczar, M.J., Chan, E.C.S., Krieg, N.R., 1998. Microbiology, fifth ed. New York.
- J. Mol. Struct.. 2002;611:193.
- Inorg. Chim. Acta. 1990;173:207.
- J. Sci.. 2003;16:283.
- Molecules. 2000;5:1121.
- Thermochim. Acta. 2004;423:149.
- Thermochim. Acta. 2004;423:149.
- Vogel, A.I., 1978. A Textbook of Quantitative Inorganic Analysis Including Elementary Instrumental Analysis, fourth ed. Longman, London.
- Spectrochim. Acta A. 2004;60:2861.
- J. Inorg. Nucl. Chem.. 1984;43:3161.
- Mater. Forum.. 2005;29:199.


