Translate this page into:
Synthesis of Fe3O4/CuO/ZnO/RGO and its catalytic degradation of dye wastewater using dielectric barrier discharge plasma
⁎Corresponding author. shenyj@czust.edu.cn (Yongjun Shen)
-
Received: ,
Accepted: ,
This article was originally published by Elsevier and was migrated to Scientific Scholar after the change of Publisher.
Abstract
The design of an efficient and green dye degradation technology is of great significance to mitigate water pollution as well as ecological damage. Fe3O4/CuO/ZnO/RGO was prepared by solvothermal synthesis and homogeneous precipitation. X-ray diffraction (XRD), field emission scanning electron microscope (FESEM), transmission electron microscopy (TEM), and vibrating-sample magnetometry (VSM) were used to characterize the samples, to explore the morphology and structural composition of the composites. To enhance the degradation efficiency, a dielectric barrier discharge (DBD)–Fe3O4/CuO/ZnO/RGO co-catalytic system was created based on the DBD plasma technology. Response surface methodology analysis results demonstrate that the degradation effect of DBD–Fe3O4/CuO/ZnO/RGO is optimal and the decolorization rate is 95.06 % when the solution pH is 3, conductivity is 0.5 mS/cm, the input voltage is 90 V, and Fe3O4/CuO/ZnO/RGO concentration is 0.18 g/L. Therefore, this study offers a novel method for dye degradation and confirms the viability of a DBD–Fe3O4/CuO/ZnO/RGO synergistic catalytic system.
Keywords
DBD plasma
Fe3O4/CuO/ZnO/RGO
Wastewater treatment
Degradation mechanisms
Response surface methodology
1 Introduction
Given the rapid development of the chemical industry and the continuous expansion of factory production scales, industrial wastewater discharge is increasing steadily. Although dyes make our living environment more colorful, dye wastewater are saturated, complex, and poisonous owing to the complex production technology, molecular structure, and color of dyes (Miklos et al., 2018; Kavitha et al., 2022, Alorabi et al., 2020). When discharged into the water, dyes and byproducts may cause serious water pollution anddamage the environment. Therefore, it is necessary to design an economical, environmentally efficient treatment method for the complete degradation of dyes in order to relieve environmental pressure.
The current treatment methods for wastewater pollution mainly comprise physical methods, biological methods, physical and chemical methods (Foroutan et al., 2020; Che et al., 2022; Keerthana et al., 2021). Compared with these technologies, dielectric barrier discharge (DBD) plasma technology degrades dyes faster, has a higher degradation rate, has better oxidation performance, and does not form harmful by-products during the degradation process. In particular, no studies have been reported on the degradation of DB15 by DBD plasma technology. UV radiation, shockwaves, strong electric fields, and a large number of activated species, including •OH, •H, •O2−, and O3, can be generated during the discharge process (Butman et al., 2020; Meropoulis et al., 2021).
However, the DBD plasma technology has several drawbacks that have restricted its broad use, including low energy efficiency and mineralization. A combination of catalysts should be able to overcome the shortcomings of DBD plasma. Yao et al. (Yao et al., 2018) used a MnOx/zeolite-packed DBD reactor to degrade toluene. It was found that when MnOx/zeolite with 3 % manganese loading was added to the plasma system, the degradation efficiency of toluene was significantly improved, with a maximum conversion rate of 99.4 %. Lu et al. (Lu et al., 2018) studied the diagnostics of plasma behavior and TiO2 properties based on a hybrid DBD/TiO2 system. According to the experimental findings, adding a TiO2 coating to the dielectric material caused the discharge intensity to rise. The hybrid system’s ozone generation efficiency increased by 38 % when the voltage hit 13 kV.
ZnO is a common semiconductor catalyst that has photosensitivity, strong oxidizing ability, favorable band gap energy, and excellent chemical and mechanical stability (Reddy et al., 2022; Jyothi et al., 2020; Selvam et al., 2022). However, it has various weaknesses, including low light utilization, poor adsorption capacity, and poor separation ability. Some researchers have demonstrated that coupling ZnO with CuO nanoparticles can effectively prolong the photoelectron lifetime of ZnO and improve its catalytic activity (Nandi et al., 2020; Shibu et al., 2022). Graphene, as an emerging type of carbon material, has a great specific surface area and strong electron transfer ability, which can increase the adsorption capacity and quantum photo yield of ZnO (Kumar et al., 2022). Fe3O4 is a special magnetic oxide that can facilitate the reuse of catalysts from solution. Therefore, combining graphene, CuO, and Fe3O4 with ZnO NPs could enhance their catalytic activity and usefulness.
Given that traditional wastewater treatment methods have slow degradation rates, high costs, and are prone to secondary pollution, it is difficult to effectively degrade organic pollutants in wastewater. Therefore, a new type of plasma combined with composite material was used in this study to degrade dyes. Direct blue 15 (DB15) was selected as the target pollutant. We synthesized the quaternary composite catalyst of Fe3O4/CuO/ZnO/reduced graphene oxide by a simple experimental method, applied it to the DBD plasma, and evaluated the catalytic effect. In addition, the synthetic mechanism of prepared Fe3O4/CuO/ZnO/RGO, optimal degradation conditions of DB15 in the DBD-Fe3O4/CuO/ZnO/RGO system, coupling mechanism of DBD-Fe3O4/CuO/ZnO/RGO system, and the reusability of Fe3O4/CuO/ZnO/RGO was investigated. The study shows that the coupling mechanism of the system is mainly because the synergistic effect between the catalyst components reduces the recombination process of electron holes, increases the generation of active substances, and can change the discharge behavior of plasma, increase the collision probability of pollutants and active substances, and improve the degradation effect. Finally, we also analyzed DB15′s degradation path in detail, which has not been studied yet. Therefore, this paper provides an effective new way for the efficient degradation of dyes.
2 Experiments
2.1 Materials
All chemical reagents used in the experiments were of analytic grade (≥99.7 %) and were purchased from Xilong Scientific Co., ltd., China. DB15 was purchased from Shanghai Jiaying Co., ltd., China. The deionized water was used throughout this study.
2.2 Synthesis of catalyst
2.2.1 Preparation of graphene oxide
Graphene oxide (GO) was prepared by Hummers’ method (Wu et al., 2010). First, 23 mL H2SO4 was added in a three flasks and stirred at 273–277 K for 30 min; subsequently, 0.5 g flake graphite and 0.25 g sodium nitrate were added into the three flasks, and stirring was continued until the solution became viscous. Then, 3 g potassium permanganate was divided into six batches, with one batch added every half an hour, and reacted for 3 h. Continue to react in a water bath at 308 K for about 2 h. 60 mL of deionized water was added and heat it to 363 K. Additional 1 h was used for condensation and reflux. 30 mL of 30 % hydrogen peroxide solution was slowly added by stirring for 15 min. Finally, the suspension was decanted slowly into the biofilm filtration until the sample was neutral, then GO was collected.
2.2.2 Preparation of Fe3O4
FeCl3·6H2O was dissolved in 40 mL ethylene glycol to form a clear solution, and then 3.6 g NaAc and 1.0 g polyethylene glycol were added. The mixture was stirred vigorously for 30 min and sealed in a Teflon-lined stainless steel autoclave. The autoclave was heated to 473 K and maintained at that temperature for 12 h. The formed black products were washed several times with ethanol and dried at 333 K for 6 h.
2.2.3 Preparation of CuO
In a beaker, 50 mL NH3·H2O and 2.52 g CuSO4.5 H2O were mixed and then continuously stirred. The mixture was sealed in a Teflon-lined stainless steel autoclave at 403 K for 24 h. After cooling to room temperature, the obtained sample was washed by centrifugation with ethanol and deionized water, and then dried at 323 K for 13 h.
2.2.4 Preparation of Fe3O4/CuO/ZnO
First, 0.0125 mol ZnSO4·7H2O was dissolved in 25 mL distilled water under magnetic stirring. Then, 1.0 g NaOH dissolved in 65 mL deionized water was added dropwise into the solution; this was designated as Solution A. Afterward, Solution A was stirred and heated to 353 K. Meanwhile, the synthesized Fe3O4 and CuO were each dispersed in 25 mL ethanol (designated as Solution B and Solution C, respectively). Subsequently, Solutions B and C were introduced into Solution A, and the mixture was continuously stirred at 353 K for 2 h. The obtained mixture was centrifuged, washed with ethanol and distilled water, and then heated at 373 K for 1 h.
2.2.5 Preparation of Fe3O4/CuO/ZnO/RGO
After synthesis as described above, 0.1 g GO was dissolved into a solution of 80 mL water and 40 mL ethanol through ultrasonic treatment for 2 h. Then, 1 g Fe3O4/CuO/ZnO was added to the GO solution and stirred for an additional 2 h to achieve a homogeneous suspension. The suspension was then heated at 393 K for 3 h. The resulting nanocomposite was isolated by centrifugation and dried at 343 K for 12 h.
2.3 Characterization
The phase composition of the material was determined using a D8 Advanced X-ray diffractometer produced by Bruker, Germany, which uses a Cu-Kα radiation source at a scanning speed of 5°min−1. The morphology of the prepared samples was examined using a field emission scanning electron microscope (FESEM, S-4800) and transmission electron microscopy (TEM, Tecnai 12). The magnetic properties of the samples were measured by SQUID-MPMS3 vibrating-sample magnetometer (VSM) produced by QUANTUM DESIGN Company.
The mechanism of Fe3O4/CuO/ZnO/RGO synthesis is shown in Fig. 1. After ultrasonic treatment, Fe3O4 and CuO were negatively charged in absolute ethanol, with many nucleophilic, free hydroxyl groups attached to their surface. Therefore, Fe3O4, CuO, and Zn(OH)2 were compounded by electrostatic interaction, and Fe3O4/CuO/ZnO was synthesized by dehydration and dehydrogenation during the drying process. Owing to the existence of many oxygen-containing functional groups on GO, the Fe3O4/CuO/ZnO nanoparticles uniformly adhered to the surface of GO. Under hydrothermal conditions, the oxygen-containing groups on GO were removed and converted into RGO. During the reduction process, Fe3O4/CuO/ZnO nanoparticles become re-stacked, with Fe3O4 and CuO becoming embedded between ZnO nanosheets. After further compounding, Fe3O4, CuO, and ZnO were loaded onto the surface of graphene by covalent bonding or electrostatic interaction, thus forming the quaternary Fe3O4/CuO/ZnO/RGO catalyst.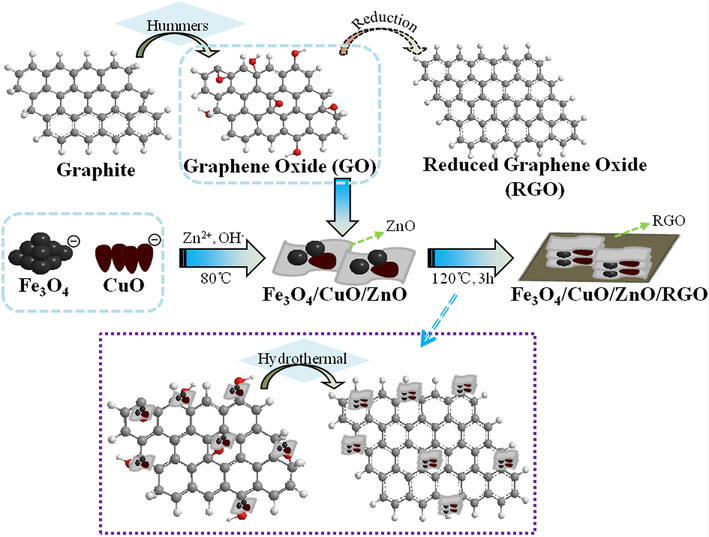
Synthesis mechanism of catalyst Fe3O4/CuO/ZnO/RGO.
2.4 Experimental design
A schematic of the plasma–catalyst system is shown in Fig. 2. First, 10 mL of 100 mg/L DB15 solutions with 2 g/L Fe3O4/CuO/ZnO/RGO catalyst was treated in a quartz reaction kettle. The discharge current control was fixed at 1.2 A. The pH value of the DB15 solution was adjusted with H2SO4 or NaOH, and the solution conductivity was regulated by KCl. After the reaction, the absorbance of the DB15 solution at 596 nm was measured by ultraviolet/visible spectrophotometry. The decolorization rate of DB15 was calculated from Eq. (1):
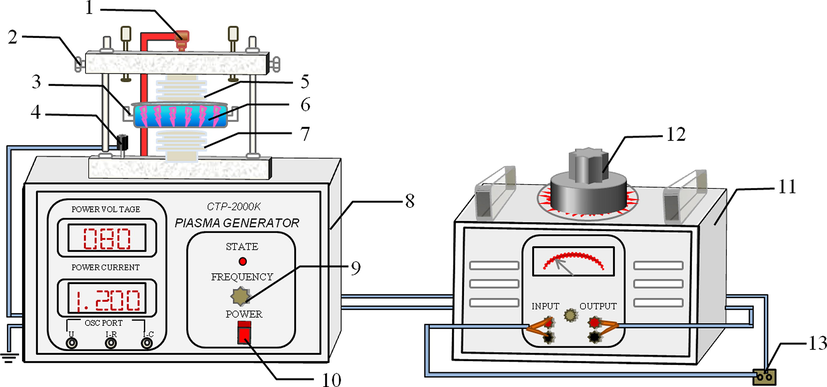
The experimental setup. (1 - high voltage connection bolt, 2 - air gap adjusting screw, 3 - reaction kettle, 4 - earth pole connection bolt, 5 - top electrode, 6 - DB15 solution with catalyst, 7 - lower electrode, 8 - plasma generator, 9 - current adjustment knob, 10 - switch button, 11 - voltage regulator, 12 - regulation valve, 13 - alternating current power source.).
3 Results and discussion
3.1 Catalyst analysis
The characterization results for each sample are presented in Fig. 3. The XRD pattern of the Fe3O4/ZnO/CuO/RGO nanocomposite is shown in Fig. 3(a). The pattern contained the characteristic diffraction peaks of Fe3O4, CuO, and ZnO (Deng et al., 2010; Tju et al., 2016). No obvious diffraction peak attributable to graphite was observed, indicating that the stacking of RGO sheets remained disordered (Sun et al., 2014). In addition, impurities and a second phase were not detected, demonstrating the successful preparation of Fe3O4/ZnO/CuO/RGO nanocomposite.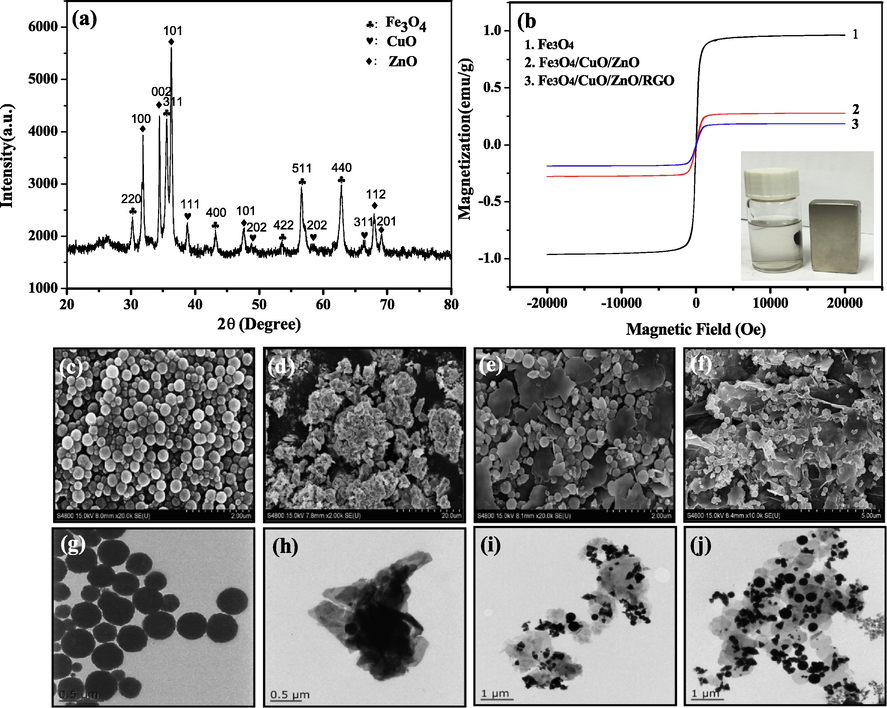
XRD pattern of Fe3O4/ZnO/CuO /RGO (a). VSM spectra of nanocomposites (b). FESEM image of (c) Fe3O4, (d) CuO, (e) Fe3O4/ZnO/CuO, (f) Fe3O4/ZnO/CuO/RGO. TEM image of (g) Fe3O4, (h) CuO, (i) Fe3O4/ZnO/CuO, (j) Fe3O4/ZnO/CuO/RGO.
The magnetic hysteresis curves of Fe3O4, Fe3O4/CuO/ZnO, Fe3O4/CuO/ZnO/RGO are presented in Fig. 3(b). All three of these samples exhibited ferromagnetic behavior and the value of saturation magnetization decreased as Fe3O4 was coupled with CuO, ZnO, and RGO. This may be due to the decrease in the magnetic properties of the attached Fe3O4 particles after their surface loading with other nanoparticles, which reduces the exposed crystalline surface and decreases the magnetization intensity. To study the magnetic separability of Fe3O4/CuO/ZnO/RGO, a magnetic bar was placed near the sample holder supporting the Fe3O4/CuO/ZnO/RGO composites in water. As seen from the inset of Fig. 3(b), a suspension of Fe3O4/CuO/ZnO/RGO could be successfully separated from water using a magnetic bar, indicating that the magnetic properties of Fe3O4/CuO/ZnO/RGO meet the requirements of magnetic separation and recovery, and have the advantages of being recyclable, convenient and fast.
The FESEM images of Fe3O4, ZnO, Fe3O4/ZnO/CuO, and Fe3O4/ZnO/CuO/RGO, are shown in Fig. 3(c)–(f), respectively. The Fe3O4 prepared by the hydrothermal method is spherical. Polyethylene glycol was added as a surfactant in the preparation process, so the prepared ferric oxide nanoparticles were uniformly dispersed. The SEM image of CuO shows that the surface of CuO is rough and has an agglomeration phenomenon, and the single copper oxide crystal is a cubic block structure. To obtain pure CuO, a high concentration of alkali source was used in the preparation process and calcined at high temperatures. Therefore, CuO nanocrystals with a cubic bulk structure formed flower-like mass structures through aggregation and self-assembly, and some pores were generated on the surface (Ahsani-Namin et al., 2022). A new type of flaky substance was present in Fe3O4/ZnO/CuO; this was the ZnO particles. The morphology of Fe3O4/CuO/ZnO/RGO showed that Fe3O4, ZnO, and CuO were more closely bound and loaded on the graphene surface. To further investigate the structure of the prepared catalyst, TEM images were observed, as shown in Fig. 3(g-j). The TEM images were consistent with the FESEM images. Moreover, the loading capacity was increased and the condition of Fe3O4, ZnO, and CuO was improved after the introduction of graphene.
3.2 Effect of different factors on degradation of DB15
The effect of initial concentration on the decolorization rate of DB15 is shown in Fig. 4(a); the reaction time was 120 s, the input voltage was 80 V, the discharge current was 1.2 A, and the catalyst concentration was 0.2 g/L. As can be seen from Fig. 4(a), a high decolorization rate was obtained at the low initial concentration. The degradation effect of the DBD-Fe3O4/CuO/ZnO/RGO system was better than that of DBD plasma alone. A possible explanation is that the quantity of the active substance was quantitative under the same operating condition. Moreover, the addition of a catalyst can make the system produce more active factors (Bhaumik et al., 2017). Consequently, a high initial concentration of DB15 led to a poor degradation effect, and the degradation of DBD-Fe3O4/CuO/ZnO/RGO was improved.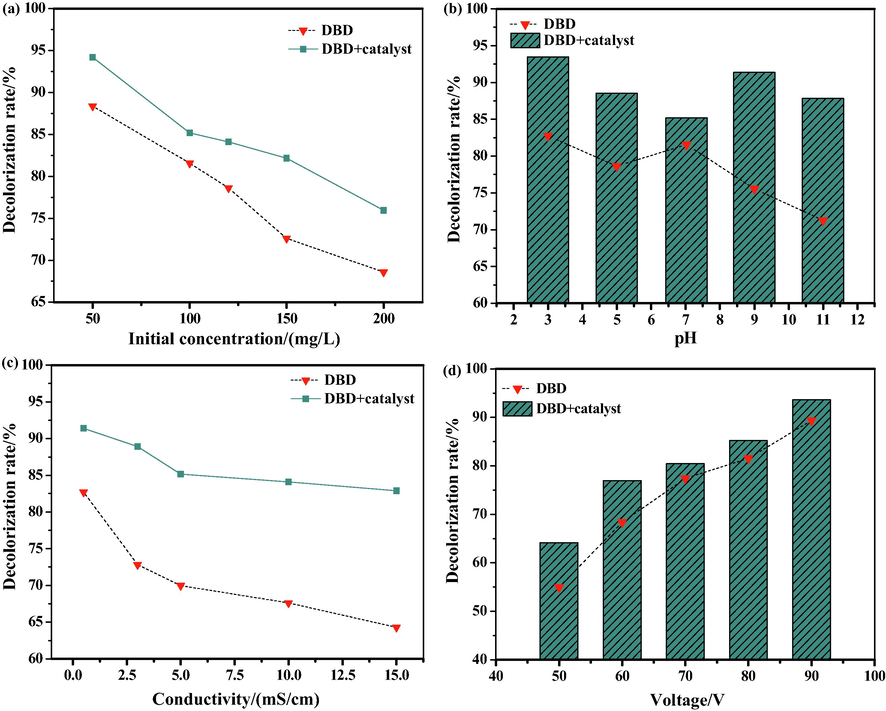
The effects of different factors on decolorization rate of DB15: (a) Initial concentration; (b) pH value; (c) Solution conductivity; (d) Input voltage.
The effect of pH value on the decolorization rate of DB15 is shown in Fig. 4(b). The operating conditions were: initial concentration, 100 mg/L; reaction time, 120 s; input voltage, 80 V; discharge current, 1.2 A; and catalyst dosage, 0.2 g/L. It can be seen from Fig. 4(b) that the degradation effect of DBD plasma alone and the DBD-Fe3O4/CuO/ZnO/RGO system was notably different when the pH was changed. The combined system had better decolorization rates under different conditions, whereas the degradation effect of DBD plasma alone was not very good in alkaline conditions. Electrons (e−) and holes (h+) can be generated by catalysts under ultraviolet radiation produced by discharge. The holes have a strong oxidation ability, which can react with H2O molecules in solution to generate hydroxyl radicals (•OH), and then with hydroxyl ions to produce •OH in alkaline conditions (Fauzian et al., 2016). Thus, a high decolorization rate was observed in DBD-Fe3O4/CuO/ZnO/RGO system.
The effect of the conductivity of DB15 was investigated under the following conditions; initial concentration, 100 mg/L; reaction time, 120 s; input voltage, 80 V; discharge current, 1.2 A; and catalyst concentration, 0.2 g/L. Take 5 copies of a certain amount of DB15 dye, turn on the conductivity meter and insert the probe into the dye solution, then adjust its conductivity to 2.5 ms/cm, 5.0 ms/cm, 10.0 ms/cm, and 15.0 ms/cm with 2 mol/L potassium nitrate solution. Add 10 mL of each to quartz reactor for degradation. The plot in Fig. 4(c) shows that the decolorization rate decreased when the conductivity of the DB15 solution increased. In addition, the decolorization rate of DB15 in DBD plasma alone was lower than that in the DBD-Fe3O4/CuO/ZnO/RGO system. As the conductivity increased, the inorganic salt content was increased, which hindered the accumulation of high-energy electrons and the subsequent production of active substances (Jiang et al., 2014). Moreover, the discharge intensity and discharge energy were weakened, resulting in a decrease in the decolorization rate. However, the quantity of active substances in the solution increased after the addition of Fe3O4/CuO/ZnO/RGO in DBD plasma, the degradation ability was improved, and the decolorization rates were increased.
The decolorization rates of DB15 by DBD plasma and DBD-Fe3O4/CuO/ZnO/RGO at different input voltages are presented in Fig. 4(d). The initial concentration was 100 mg/L, the reaction time was 120 s, the discharge current was 1.2 A, and the catalyst concentration was 0.2 g/L. As can be seen from Fig. 4(d), as the input voltage increased, the decolorization rate of DB15 in DBD plasma and the combined system both showed an upward trend. The coupling effect of DBD-Fe3O4/CuO/ZnO/RGO was beneficial at low voltages. As the voltage increased, the electric field intensity in the discharge area was increased, which was conducive to the formation of plasma discharge channels, high-energy electrons, and active substances. Therefore, the decolorization rates of DB15 were increased with increasing voltage for both DBD plasma alone and the DBD-Fe3O4/CuO/ZnO/RGO system. It was found that the catalyst agglomerated when the voltage was increased to a certain extent, which led to the phenomenon in which the decolorization rate of the combined system at high voltage was not significantly raised.
3.3 Analysis on the degradation of DB15by RSM
3.3.1 Establishment of model equation and significant analysis
From the experimental design software, the response surface experimental scheme is shown in Table 1. The analysis of variance is presented in Table 2. The magnitude of the P-value represents the significance of each source of variance, with P-values less than 0.0001 being highly significant, less than 0.01 being more significant, and less than 0.05 being significant (Azarang et al., 2019). As shown in Table 2, the P value of the model was far less than 0.0001, indicating that that the experimental model had remarkable adaptability. The P value for “lack of fit” was 0.6445 (>0.05), which illustrated that the nonlinear relationship between factors and response was significant and that the model was reliable. The P values of X1, X3, X1X2, and X2X3 were < 0.05, showing the clear effects of those variables. The influence of variables on the decolorization rate was determined by the F value. Large F values mean that the variable has a large influence on the decolorization rate (Korbahti et al., 2008). That said, the influence sequence of each single factor on the decolorization rate followed the order X3 > X1 > X4 > X2. The coefficient of determination (R2) of the model was 0.9118, the adjustment coefficient (Radj2) was 0.8235, and the difference between the two coefficients was < 0.2, indicating that the model had good precision and creditability. Through the fitting analysis of the response surface system, the regression equation for the decolorization rate of DB15 (Y) could be presented as in Eq. (2):
Run
X1: pH
X2:Conductivity (mS/cm)
X3:Input voltage
(V)X4:Catalyst dosage
(g)Decolorization rate
(%)
1
11.00
15.00
70.00
0.55
81.3299
2
7.00
7.75
70.00
0.55
79.3478
3
3.00
7.75
50.00
0.55
79.6675
4
7.00
15.00
70.00
1.00
78.5808
5
7.00
7.75
70.00
0.55
78.7724
6
7.00
7.75
70.00
0.55
82.4808
7
7.00
7.75
70.00
0.55
81.266
8
3.00
7.75
70.00
1.00
82.0972
9
11.00
7.75
90.00
0.55
80.9463
10
3.00
7.75
70.00
0.10
84.0153
11
7.00
0.50
50.00
0.55
71.8882
12
7.00
7.75
70.00
0.55
82.3529
13
11.00
7.75
70.00
1.00
79.2199
14
7.00
15.00
90.00
0.55
82.5448
15
7.00
7.75
50.00
0.10
78.7084
16
11.00
7.75
50.00
0.55
78.5166
17
3.00
0.50
70.00
0.55
87.468
18
11.00
7.75
70.00
0.10
79.0921
19
7.00
0.50
70.00
0.10
83.2481
20
11.00
0.50
70.00
0.55
75.7033
21
3.00
15.00
70.00
0.55
82.6726
22
7.00
7.75
90.00
0.10
85.0384
23
7.00
15.00
70.00
0.10
80.6905
24
7.00
0.50
70.00
1.00
81.9013
25
7.00
0.50
90.00
0.55
89.3223
26
7.00
7.75
90.00
1.00
85.9335
27
7.00
7.75
50.00
1.00
75.9591
28
3.00
7.75
90.00
0.55
88.3402
29
7.00
15.00
50.00
0.55
80.4348
Source
Sum of squares
df
Mean square
F-value
P-value
Prob > F
Model
363.89
14
25.99
10.33
<0.0001
Significant
X1
72.29
1
72.29
28.73
0.0001
X2
0.90
1
0.90
0.36
0.5603
X3
183.70
1
183.70
73.02
<0.0001
X4
4.20
1
4.20
1.67
0.2171
X1 X2
27.15
1
27.15
10.79
0.0054
X1 X3
9.74
1
9.74
3.87
0.0692
X1 X4
1.05
1
1.05
0.42
0.5294
X2 X3
58.71
1
58.71
23.34
0.0003
X2 X3
0.15
1
0.15
0.058
0.8134
X2 X4
3.32
1
3.32
1.32
0.2699
X12
2.13
1
2.13
0.85
0.3729
X22
0.17
1
0.17
0.068
0.7976
X32
0.80
1
0.80
0.32
0.5806
X42
5.424E-007
1
5.424E-007
2.156E-007
0.9996
Residual
35.22
14
2.52
Lack of fit
23.56
10
2.36
0.81
0.6445
Not significant
Pure error
11.66
4
2.92
Cor total
399.11
28
3.3.2 Interactive effect of different factors
The interaction effects of pH and conductivity on the decolorization rate of DB15 are illustrated in Fig. 5. The input voltage was 70 V and the Fe3O4/CuO/ZnO/RGO dosage was 0.55 g/L. As can be seen from Fig. 5, the decolorization rate was high when the initial pH and conductivity value were lowest (3 and 0.5 mS/cm, respectively). Boguslavsky et al. reported that approximately 10 % of energy was consumed in the transition layer after discharge, with more energy consumed for heating as the conductivity increased, which reduced the decolorization rate (Boguslavsky et al., 2001). In the process of DBD plasma discharge,.OH can be produced. ∙OH has a stronger oxidation capacity under acidic conditions, which can lead to an increase in the decolorization rate (Gao et al., 2004).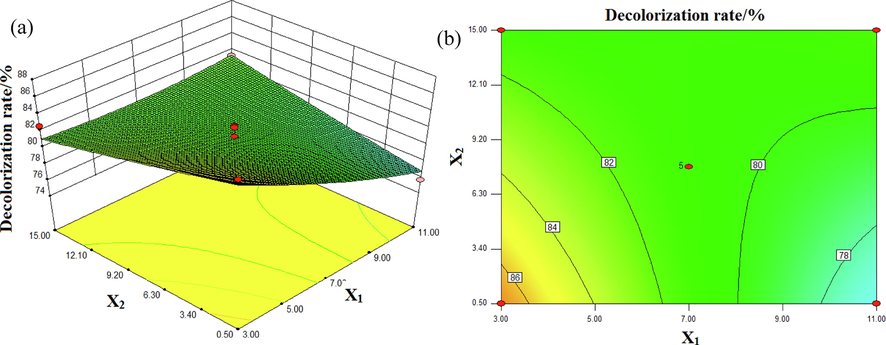
Interactive effects of pH (X1) and conductivity (X2) on the decolorization rate (%): (a) response surface, (b) contour plot.
The interaction effects of pH and input voltage on the decolorization rate of DB15 are presented in Fig. 6. The conductivity value was 7.75 mS/cm and the Fe3O4/CuO/ZnO/RGO concentration was 0.55 g/L. As shown in Fig. 6(a), the higher the input voltage, the greater the decolorization rate of DB15. In Fig. 6(a), the arc of the contour is small and almost linear, indicating that the interaction effect between input voltage and pH was not obvious. The electrons were at a higher energy with high interior input power. In addition, it was beneficial for the production of more active substances and high-energy electrons, which would accelerate the degradation of DB15; thus, higher decolorization rates were obtained (Gao et al., 2013).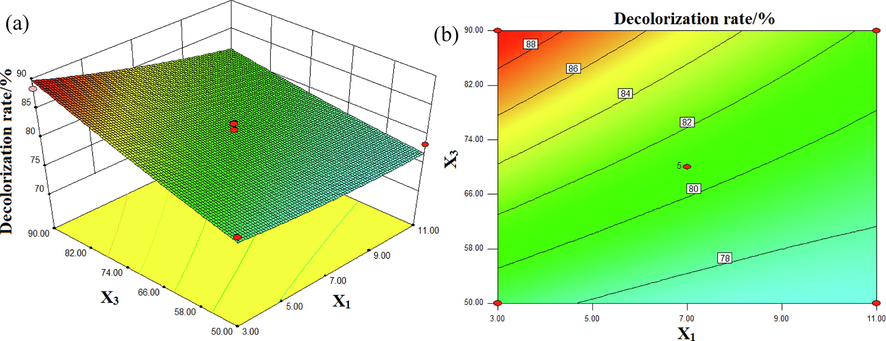
Interactive effects of pH (X1) and input voltage (X3) on the decolorization rate (%): (a) response surface, (b) contour plot.
The interactive effect of pH and Fe3O4/CuO/ZnO/RGO concentration on the decolorization rate of DB15 is shown in Fig. 7. The solution conductivity was 7.75 mS/cm and the input voltage was 70 V. From the steepness of the response surface, it can be seen that the Fe3O4/CuO/ZnO/RGO concentration had less effect on the decolorization rate of DB15 than the pH of solution. It can also be seen from the contour plot that the decolorization rate of DB15 was higher when the solution was strongly acidic. The contour curve has no obvious radian, indicating that the interaction effect between pH and Fe3O4/CuO/ZnO/RGO concentration on the decolorization rate of DB15 was not significant.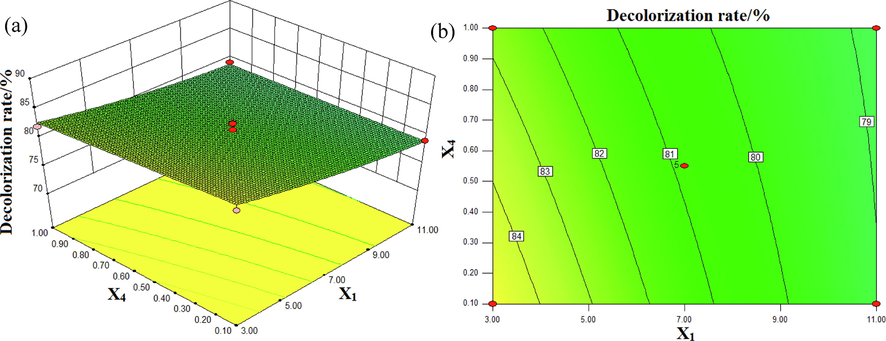
Interactive effects of pH (X1) and Fe3O4/CuO/ZnO/RGO dosage (X4) on the decolorization rate (%):(a) response surface, (b) contour plot.
The effect of conductivity and input voltage on the decolorization rate of DB15 at pH 7 and with an Fe3O4/CuO/ZnO/RGO concentration of 0.55 g/L is shown in Fig. 8. As shown in Fig. 8, the decolorization rate of DB increased with increasing input voltage at a constant conductivity. The decolorization rate of DB15 was the highest under the conditions of minimum conductivity and maximum input voltage. The obvious arc of the contour indicated that the interaction between conductivity and the input voltage had a significant effect on the decolorization rate of DB15.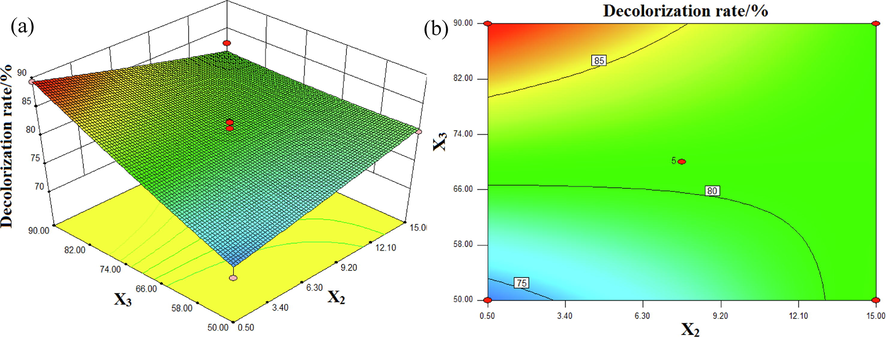
Interactive effects of conductivity (X2) and input voltage (X3) on the decolorization rate (%):(a) response surface, (b) contour plot.
The interaction effects of conductivity and Fe3O4/CuO/ZnO/RGO concentration on the decolorization rate of DB15 at pH 7 and with an input voltage of 70 V are shown in Fig. 9. It can be found in Fig. 9 that excessive catalyst dosage led to the decrease of decolorization rate of DB15. This was because plasma discharge can cause the agglomeration of catalyst if an excessive catalyst is put into wastewater, thus leading to the inability of the catalyst to display its catalytic activity in full. At the same time, agglomeration reduces the transmittance of the solution, meaning that ultraviolet light cannot be absorbed completely by the solution, which results in a decrease in the decolorization rate (Fathima et al., 2007).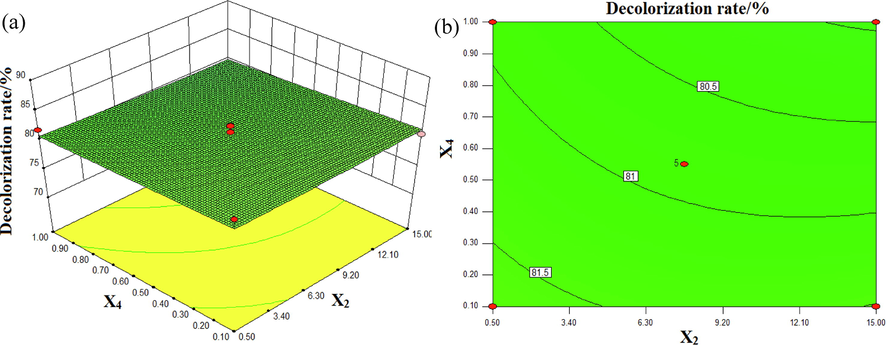
Interactive effects of conductivity (X2) and Fe3O4/CuO/ZnO/RGO dosage (X4) on the decolorization rate (%): (a) response surface, (b) contour plot.
The effect of input voltage and Fe3O4/CuO/ZnO/RGO dosage on the decolorization rate of DB15 is shown in Fig. 10. The pH was 7 and the conductivity was 7.75 mS/cm. As shown in Fig. 10(a), the slope of the response surface on the side of the input voltage was obviously higher than that of the Fe3O4/CuO/ZnO/RGO concentration, which indicated that the influence of input voltage on the decolorization rate of DB15 was more significant. In Fig. 10(b), the arc of the contour is small, indicating that the interaction between the input voltage and Fe3O4/CuO/ZnO/RGO concentration was not obvious.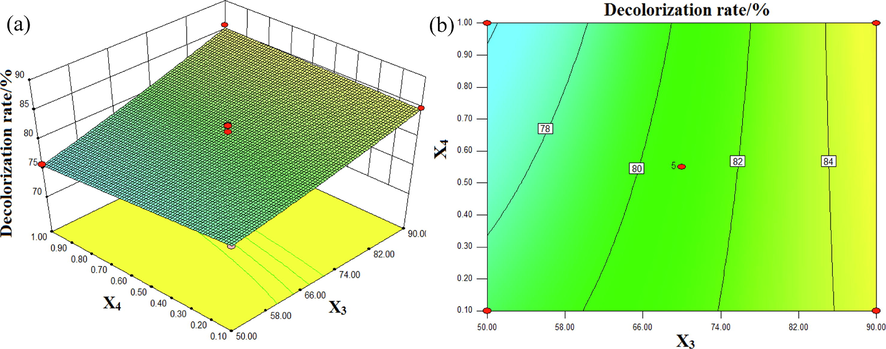
Interactive effects of input voltage (X3) and Fe3O4/CuO/ZnO/RGO dosage (X4) on the decolorization rate (%): (a) response surface, (b) contour plot.
3.3.3 Optimization and verification of the model
Through the RSM analysis, the optimal conditions for DB15 degradation were obtained. When the initial pH was 3, the conductivity was 0.5 mS/cm, the Fe3O4/CuO/ZnO/RGO concentration was 0.18 g/L, and the input voltage was 90 V, the predicted decolorization rate of DB15 reached 96.57 %. Three parallel verification experiments were performed under optimal conditions, yielding an experimental decolorization rate for DB15 of 95.06 %. The experimental results matched well with the predicted value. The study shows that an error of less than 3 % between the experimental and predicted values is acceptable, i.e., the accuracy of the model is higher than 97 % (Farahani et al., 2020). The relative error between the predicted and experimental values was only 1.51 %, illustrating that the model was certainly stable (Shen et al., 2017). In addition, the decolorization rate of DBD-Fe3O4/CuO/ZnO/RGO co-catalytic system was better than that of other techniques reported for the degradation of direct blue 15 (Table 3). This illustrates the superiority of DBD-Fe3O4/CuO/ZnO/RGO technology.
Degradation Technology (Ref.)
Optimum conditions
Decolorization rate
DBD-Fe3O4/CuO/ZnO/RGO (This Work)
pH = 3; conductivity = 0.5;
input voltage = 90 V;
concentration = 0.18 g/L95.06 %
Ag-doped ZnO NPs + UV
(Ebrahimi et al., 2019a)
concentration = 100 mg/L;
pH = 7; UV intensity = 30 W;
NP concentration = 2 g/L;
dopant percentage = 2.5 %73.6 %
Fe-Si-B + H2O2
(Deng et al., 2017)concentration = 100 mg/L;
H2O2 mass = 5.8 mM;
temperature = 333 K90 %
CdS/Ag + UV
(Ravikumar et al., 2022)catalyst amount = 100 mg/L;
dye concentration = 10 ppm94 %
CeO2-ZnO + solar light
(Lamba et al., 2015)dye concentration = 50 ppm;
catalyst dose = 0.50 g/L;
pH = natural
WO3-doped ZnO + UV
(Ebrahimi et al., 2019b)light intensity = 505 W/m2;
the dopant percentage = 5 % w/v; concentration = 100 mg/L86.9 %
TiO2 + UV
(Jada et al., 2021)pH = 4; Dye Concentration = 9 mg/L;
Catalyst Loading = 8.72*10-4 Kg/m2;
Light Intensit = 11.2 W/m2
83.64 %
3.4 Reusability of the catalyst
To examine the reusability of Fe3O4/CuO/ZnO/RGO, the prepared catalyst was separated from the DB15 solution using an external magnet and reused five times. The decolorization rate of DB15 and the FESEM images of Fe3O4/CuO/ZnO/RGO before and after use are shown in Fig. 11. The decolorization rate of DB15 did not significantly decrease after five cycles. The morphology of Fe3O4/CuO/ZnO/RGO changed slightly, with the ZnO sheet becoming thinner after use. This was due to the strong plasma discharge on the surface of the catalyst. However, the Fe3O4/CuO/ZnO/RGO nanoparticles were still well supported and did not desorb. Therefore, the prepared Fe3O4/CuO/ZnO/RGO has good repeatability and stability in plasma applications.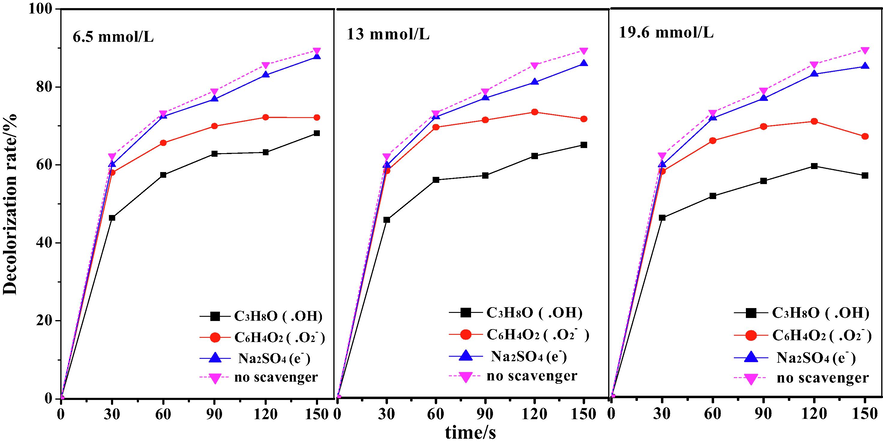
The result of recyling experiment and SEM images of Fe3O4/CuO/ZnO/RGO before and after use.
3.5 Analysis of the role of active factors
To detect the main active oxidative species responsible for the degradation of DB15, control experiments were performed with added scavengers for hydroxyl radicals (.OH), superoxide radicals (.O2−), and high-energy electrons (e−), using isopropyl alcohol, benzoquinone, and sodium sulfate, respectively. In Fig. 11, scavenger loading at 6.5, 13, and 19.6 mmol/L is presented. The addition of these scavengers inhibited the treatment of DB15, which indirectly proved that.OH,.O2−, and e− participate in the degradation of pollutants (Tju et al., 2017). As the scavenger concentration increased, the inhibition increased, and the decolorization rates of DB15 were decreased. As can be seen from Fig. 12, isopropyl alcohol had the most significant effect on the decolorization rate of DB15, whereas the addition of sodium sulfate did not change the degradation performance significantly greatly. Therefore, •OH and •O2– radicals played significant roles in the degradation of DB15, The strength of the effect of these active substances on the degradation efficiency of DB15 followed the order •OH > •O2– > e-.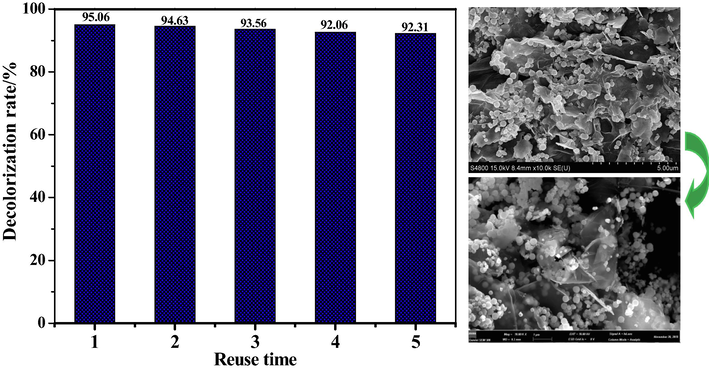
Effect of different scavengers on decolorization rate of DB15.
3.6 Coupling mechanism
A possible coupling mechanism for the DBD-Fe3O4/CuO/ZnO/RGO system is presented in Fig. 13 based on the degradation results. Under the ultraviolet light irradiation produced by DBD, a process of charge separation and the transfer was induced in Fe3O4/CuO/ZnO/RGO, reducing the recombination of electron holes. The electrons excited in the conduction band (CB) of CuO were transferred to the CB of ZnO, whereas holes in the valence band (VB) of ZnO were transferred to the VB of CuO (Saravanan et al., 2013, Li et al., 2010). In this way, the recombination of electrons and holes was successfully avoided, which enhanced the catalytic activity. Fe3O4 and graphene had good conductivity, which was conducive to electron transport and further improved the separation efficiency of the photogenerated carriers. At the same time, the addition of Fe3O4/CuO/ZnO/RGO could change the discharge behavior of plasma. The micro-discharge around the catalyst can propagate along its surface, enlarging the discharge area and increasing the probability of collision between pollutants and active substances (Van Durme et al., 2008). In addition, graphene has a special two-dimensional planar structure and conjugated structure that can adsorb dye molecules. Thus, the combined DBD-Fe3O4/CuO/ZnO/RGO system had an excellent degradation effect.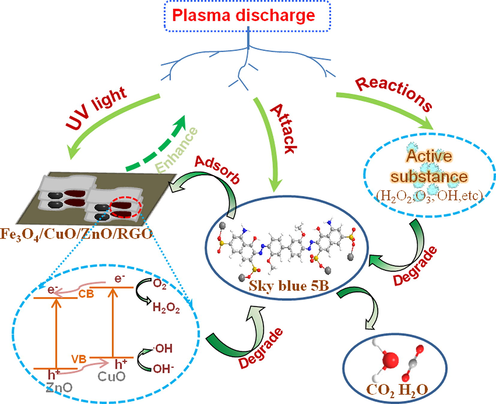
Possible coupling mechanism of DBD-Fe3O4/CuO/ZnO/RGO system.
3.7 Degradation mechanism on intermediates and pathway of DB15
3.7.1 Analysis of UV–vis spectrum
The UV–vis spectra of DB15 after different degradation periods are shown in Fig. 14. DB15 has three characteristic peaks between the wavelengths of 200 and 800 nm. The maximum absorption wavelength is 596 nm; this characteristic absorption peak is caused by the absorption of visible light from the conjugated structure formed between the azo bond and benzene ring in the dye molecule. The characteristic peak at 321 nm is the absorption peak of the benzene ring in the direct lake blue 5B dye molecule, whereas the characteristic peak at 249 nm corresponds to the naphthalene ring structure in the dye molecule. For a degradation time of 30 s, the characteristic absorption peaks in both the near-ultraviolet and visible regions decreased rapidly, and the peak at 596 nm decreased significantly, indicating that the conjugated structure inside the dye molecule was attacked. The absorption peaks at the shorter wavelengths of 321 nm and 249 nm disappeared, indicating that the benzene and naphthalene ring structures underwent ring-opening reactions. Over time, the waveform gradually flattens. When the degradation time was 150 s, the absorption peak at 596 nm disappeared, indicating that the conjugated system comprising the azo bond and the benzene ring was completely destroyed. The UV spectrum finally turned into a smooth curve, indicating that the DB15 dye molecules were effectively degraded under the plasma discharge system, eventually generating small molecular organic acids and even carbon dioxide and water molecules.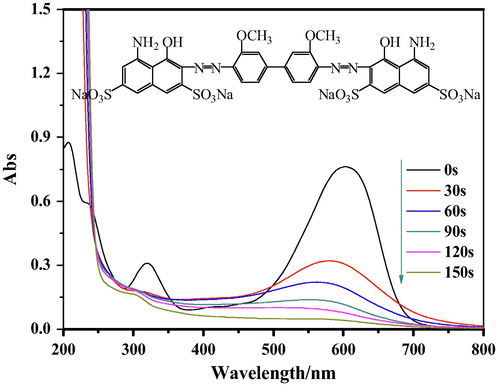
UV–vis spectra of DB15 at different times.
3.7.2 Analysis of FT-IR spectrum
The FT-IR spectrum of DB15 is shown in Fig. 15. The undegraded DB15 dye has a broad absorption peak at 3434.69 cm−1, corresponding to the –NH2 or –NH groups in the molecular structure of DB15 dye; absorption peaks at 1450 cm−1–1650 cm−1 caused by the vibration of the benzene ring skeleton; and 1130.90 cm−1, 1043.58 cm−1, and 615.97 cm−1 were the vibrational absorption peaks caused by–NaSO3 on the naphthalene ring. The intensity of the absorption peaks at 1450 cm−1–1650 cm−1 decreases at 30 s of degradation time, indicating the benzene ring structure in the dye molecule is breaking, and a new characteristic absorption peak appears at 1384.38 cm−1, which is the bending vibrational peak of a methyl group. When the degradation time was 90 s, the characteristic peak of –NaSO3 was obviously weakened; the characteristic peaks of –NH2 and –NH were still present but the amplitude of the absorption peaks was significantly reduced, indicating that the number of –NH2 or –NH groups was reduced; and the bending vibration peak of the methyl group at 1384.38 cm−1 was weakened, indicating that the methyl generated during the degradation process was further substituted. The results showed that the plasma bombardment of 90 s successfully disrupted the molecular structure of the dye and mineralized it into small molecules.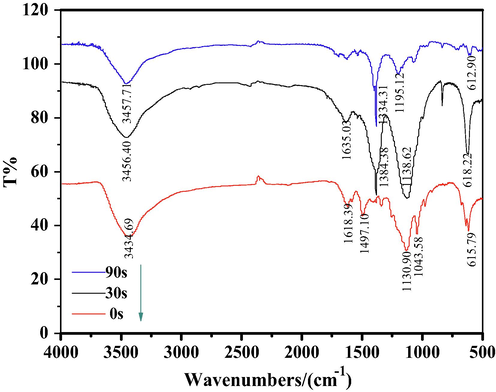
FT-IR spectra of DB15 at different time.
3.7.3 Analysis of GC–MS spectrum
To study the degradation process of DB15 in the plasma atmosphere, the DB15 wastewater during the process of degradation was measured by gas chromatography-mass spectrometry (GC–MS). As can be seen in Fig. S1, the DB15 degradation process produced phthalic acid.
3.7.4 Degradation mechanism
3.7.4.1 A pathway
By combining the GC–MS detection results, UV–vis spectroscopy, and FT-IR spectroscopy, the possible degradation processes are proposed and the complete degradation pathways are described in Fig. 16. The identity of the possible intermediates and their corresponding numbers are shown in Table 4.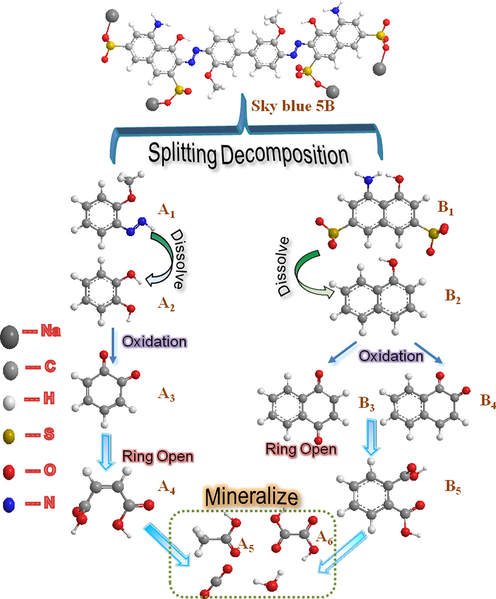
The probable degradation pathway of DB15.
编号
名称
分子式
结构式
A1
(3-Methoxyphenyl)diazole
C7H5N2O

A2
Catechol
C6H6O2

A3
o-quinone
C6H4O2

A4
(Z)-butenedioic acid
C4H4O4

A5
acetic acid
C2H4O2

A6
oxalic acid
C2H2O4

B1
4- amino −5- hydroxynaphthalene −2,7- disulfonate
C10H7NO7S22-

B2
1-Naphthol
C10H8O

B3
1,2- naphthoquinone
C10H6O2

B4
1,4- naphthoquinone
C10H6O2

B5
1,2-dicarboxybenzene
C8H6O4

3.7.4.2 Mechanism analysis of main intermediate
Based on the GC–MS measurements, we present a mechanistic analysis of the main intermediates in the degradation of DB15. As shown below, we explain the general steps in the degradation pathway.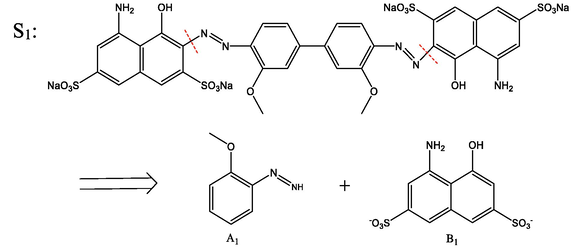
After DB15 is subjected to strong oxidizing radicals and shock waves, the carbon–nitrogen (-C—N-) bond on the naphthalene ring side of the dye macromolecule is more vulnerable to attack by hydroxyl radicals because the electron cloud density on the naphthalene ring side of the dye macromolecule structure is greater than that on the benzene-ring side. Therefore, the -C—N- bond attached to the naphthalene ring in the DB15 molecule will be broken first, causing the naphthalene ring on both sides of the molecule to break off and the solution to decolorize; hence, the DB15 dye macromolecule is degraded into (3-methoxyphenyl)diazole (A1) and 4-amino-5- hydroxynaphthalene-2,7-disulfonate (B1).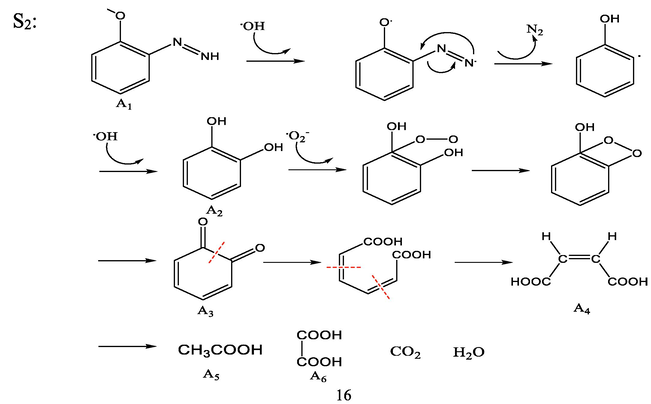
In the second step, under the action of hydroxyl radicals and the attack of a strong electric field, in the generated intermediate product A1, the methyl group is dropped, the azo bond (-N⚌N-) on the molecule is removed, in the form of nitrogen. It is discharged to generate an unstable hydroxyl-substituted intermediate, and the hydroxyl group is further substituted to generate the product catechol (A2). A2 undergoes oxidation by superoxide radicals; the phenolic hydroxyl group in the A3 molecule is oxidized and undergoes a ring-opening reaction and a series of bond breaks to become cis-hydroxybenzoic acid (A4) (Shen et al., 2016; Mvula et al., 2003). A4 is further oxidized to acetic acid (A5), oxalic acid (A6), carbon dioxide, water, and other small molecules.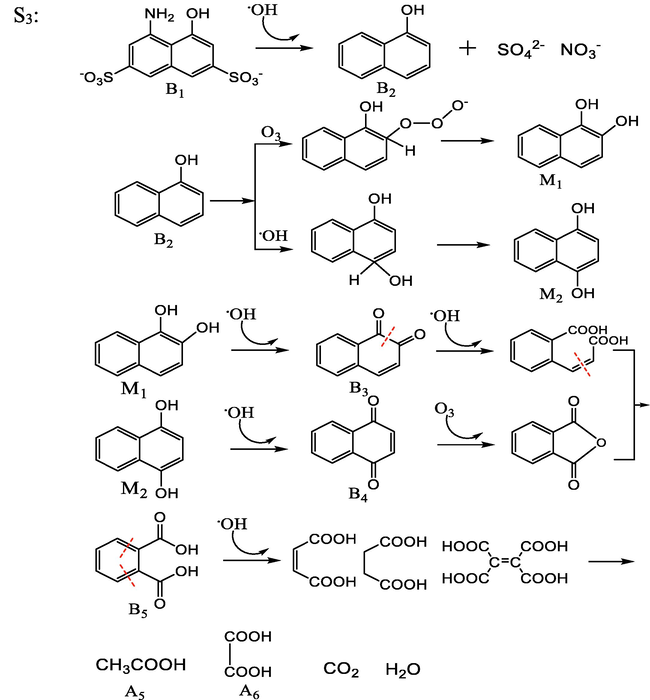
In the third step, the intermediate product B1 is attacked by hydroxyl radicals and the –SO3− and –NH2 groups on the molecule are lost from the naphthalene ring, causing the conversion of B1 to 1-naphthol (B2), and those–SO3− and –NH2 groups are further oxidized to inorganic ions such as SO42− and NO3− and dissolved in water. B2 undergoes hydroxyl and ozonation in different positions and hydroxyl substitution reactions transform to intermediate products M1 and M2. The phenolic hydroxyl groups on M1 and M2 were oxidized to ketone groups to produce 1,2-naphthoquinone (B3) and 1,4-naphthoquinone (B4), respectively. B3 and B4 underwent ring-opening reactions to form phthalic acid (B5) (Song et al., 2007). B5 underwent decarboxylation and oxidation under the action of a strong electric field and shock waves and finally mineralized to acetic acid (A5), oxalic acid (A6), and other small molecule acids or carbon dioxide and water (Bianchi et al., 2006).
4 Conclusions
The DBD-Fe3O4/CuO/ZnO/RGO system can effectively degrade DB15. Fe3O4/CuO/ZnO/RGO can be successfully prepared by solvothermal synthesis and homogeneous precipitation. Fe3O4 and CuO were embedded between the ZnO nanosheets and loaded on the surface of graphene by covalent bonding or electrostatic interaction. The results of RSM showed that at the optimal conditions—initial pH of 3, conductivity of 0.5 mS/cm, Fe3O4/CuO/ZnO/RGO concentration of 0.18 g/L, and input voltage of 90 V—the predicted decolorization rate of DB15 reached 95.06 %. In addition, the properties of Fe3O4/CuO/ZnO/RGO are stable. After repeated use five times, the decolorization rate of direct blue 15 (DB15) only decreases by 2.75 % compared with the first time. The strength of the effect of active substances on the degradation efficiency followed the order •OH > •O2– > e-. A possible coupling mechanism for the combined system was proposed based on the results.
Acknowledgements
This work was supported by the National Natural Science Foundation of China (No. 21246010), the Key Natural Science Foundation of the Jiangsu Higher Education Institutions of China (Grant No. 22KJA610001) and supported by Science and Technology Project Fund of Nantong (JC2021163) and Changzhou Institute of Technology High level Talent Launch Project (YN22010).
Declaration of competing interest
The authors declare that they have no known competing financial interests or personal relationships that could have appeared to influence the work reported in this paper.
References
- Green mediated combustion synthesis of copper zinc oxide using Eryngium planum leaf extract as a natural green fuel: Excellent adsorption capacity towards Congo red dye. Ceram. Int.. 2022;48:20961-20973.
- [Google Scholar]
- Fe3O4-CuO-activated carbon composite as an efficient adsorbent for bromophenol blue dye removal from aqueous solutions. Arab. J. Chem.. 2020;13:8080-8091.
- [Google Scholar]
- Modeling and optimization of pertraction performance of heavy metal ion from aqueous solutions using M2EHPA/D2EHPA: application of response surface methodology. Environ. Technol. Innov.. 2019;15:100432
- [Google Scholar]
- Synthesis and characterization of Fe0/TiO2 nano-composites for ultrasound assisted enhanced catalytic degradation of reactive black 5 in aqueous solutions. J. Colloid Interf. Sci.. 2017;506:403-414.
- [Google Scholar]
- Mechanism and efficiency of atrazine degradation under combined oxidation processes. Appl. Catal. B-Environ.. 2006;64:131-138.
- [Google Scholar]
- Optical studies of the plasma-liquid transition layer in pulsed corona discharges in strong water electrolytes. Tech. Phys.. 2001;46:174-178.
- [Google Scholar]
- Synergistic effect of dielectric barrier discharge plasma and TiO2-pillared montmorillonite on the degradation of rhodamine b in an aqueous solution. Catalysts. 2020;10(4):359.
- [Google Scholar]
- Activated carbon modified with nano manganese dioxide triggered electron transport pathway changes for boosted anaerobic treatment of dyeing wastewater. Environ. Res.. 2022;203:111944
- [Google Scholar]
- Fe-based metallic glass catalyst with nanoporous surface for azo dye degradation. Chemosphere. 2017;174:76-81.
- [Google Scholar]
- Monodisperse magnetic single-crystal ferrite microspheres. Angew. Chem. Int. Edit.. 2010;44:2782-2785.
- [Google Scholar]
- Microfluidic solvent extraction of Cd(II) in parallel flow pattern: optimization, ion exchange, and mass transfer study. Sep. Purif. Technol.. 2020;258:118031
- [Google Scholar]
- Effects of doping zinc oxide nanoparticles with transition metals (Ag, Cu, Mn) on photocatalytic degradation of Direct Blue 15 dye under UV and visible light irradiation. J. Environ. Health Sci. Eng.. 2019;17:479-492.
- [Google Scholar]
- Photocatalytic degradation of organic dyes using WO3-doped ZnO nanoparticles fifixed on a glass surface in aqueous solution. J. Ind. Eng. Chem.. 2019;73:297-305.
- [Google Scholar]
- Dye house wastewater treatment through advanced oxidation process using Cu-exchanged Y zeolite: a heterogeneous catalytic approach. Chemosphere. 2007;70:1146-1151.
- [Google Scholar]
- Improvement of catalytic activity of Fe3O4/CuO/TiO2 nanocomposites using the combination of ultrasonic and UV light irradiation for degradation of organic dyes. AIP Conf. Proc.. 2016;1725:020020
- [Google Scholar]
- Performance of montmorillonite/ graphene oxide/CoFe2O4 as a magnetic and recyclable nanocomposite for cleaning methyl violet dye-laden wastewater. Adv. Powder Technol.. 2020;31(9):3993-4004.
- [Google Scholar]
- Degradation of dye wastewater by ns-pulse DBD plasma. Plasma Sci. Technol.. 2013;15:928-934.
- [Google Scholar]
- Oxidative degradation of nitrophenols in aqueous induced by plasma with submersed glow discharge electrolysis. Plasma Process. Polym.. 2004;1:171-176.
- [Google Scholar]
- Photocatalytic degradation of diazo dye over suspended and immobilized TiO2 catalyst in swirl flow reactor: Kinetic modeling. Processes. 2021;9:1741.
- [Google Scholar]
- Review on electrical discharge plasma technology for wastewater remediation. Chem. Eng. J.. 2014;236:348-368.
- [Google Scholar]
- Optimum pH for effective dye degradation: Mo, Mn, Co and Cu doped ZnO photocatalysts in thin film form. Ceram. Int.. 2020;46:23289-23292.
- [Google Scholar]
- Ceria nanoparticles anchored on graphitic oxide sheets (CeO2-GOS) as an efficient catalyst for degradation of dyes and textile effluents. Water Res.. 2022;209:112750
- [Google Scholar]
- Influence of tin (Sn) doping on Co3O4 for enhanced photocatalytic dye degradation. Chemosphere. 2021;277:130325
- [Google Scholar]
- Response surface methodology (RSM) analysis of photoinduced decoloration of toluidine blue. Chem. Eng. J.. 2008;136:25-30.
- [Google Scholar]
- Sonophotocatalytic dye degradation using RGO -BIVO4 composites. Glob. Chall.. 2022;6:2100132.
- [Google Scholar]
- CeO2-ZnO hexagonal nanodisks: Effificient material for the degradation of direct blue 15 dye and its simulated dye bath efflfluent under solar light. J. Alloys Compd.. 2015;620:67-73.
- [Google Scholar]
- Facile synthesis and photocatalytic activity of ZnO-CuO nanocomposite. Superlattices Microstruct.. 2010;47(2010):615-623.
- [Google Scholar]
- Diagnostics of plasma behavior and TiO2 properties based on DBD/TiO2 hybrid system. Plasma Chem. Plasma P.. 2018;38:1239-1258.
- [Google Scholar]
- Structure-Degradation efficiency studies in the remediation of aqueous solutions of dyes using nanosecond-pulsed DBD plasma. Sep. Purif. Technol.. 2021;274
- [Google Scholar]
- Evaluation of advanced oxidation processes for water and wastewater treatment-A critical review. Water Res.. 2018;139:118-131.
- [Google Scholar]
- Ozonolysis of phenols in aqueous solution. Org. Biomol. Chem.. 2003;1(10):1749-1756.
- [Google Scholar]
- ZnO-CuxO heterostructure photocatalyst for efficient dye degradation. J. Phys. Chem. Solids. 2020;143
- [Google Scholar]
- Development of highly efficient cost-effective CdS/Ag nanocomposite for removal of azo dyes under UV and solar light. Int: Ceram; 2022.
- Construction of various morphological ZnO-NiO S-scheme nanocomposites for photocatalytic dye degradation. Inorg. Chem. Commun.. 2022;146
- [Google Scholar]
- Enhanced photocatalytic activity of ZnO/CuO nanocomposite for the degradation of textile dye on visible light illumination. Mat. Sci. Eng. C-Mater.. 2013;33:91-98.
- [Google Scholar]
- Enhanced photocatalytic activity of novel Canthium coromandelicum leaves based copper oxide nanoparticles for the degradation of textile dyes. Water Res.. 2022;211:113046
- [Google Scholar]
- Degradation of Reactive Yellow X-RG by O3/Fenton system: response surface approach, reaction mechanism, and degradation pathway. Water Sci. Technol.. 2016;74(10):2483-2496.
- [Google Scholar]
- Optimization and mechanism study of C.I. Acid Blue 25 wastewater degradation by ozone/Fenton oxidation process: response surface methodology, intermediate products and degradation pathway. Desalin. Water Treat.. 2017;65:313-326.
- [Google Scholar]
- White LED active α-Fe2O3/rGO photocatalytic nanocomposite for an effective degradation of tetracycline and ibuprofen molecules. Water Res.. 2022;212:113301
- [Google Scholar]
- Mechani sm of decolorization and degradation of CI Direct Red 23 by ozonation combined with sonolysis. Chemosphere. 2007;66(9):1782-1788.
- [Google Scholar]
- Controllable synthesis of porous Fe3O4@ZnO sphere decorated graphene for extraordinary electromagnetic wave absorption. Nanoscale. 2014;6:6557-6562.
- [Google Scholar]
- Enhanced UV Photocatalytic Performance of Magnetic Fe3O4/CuO/ZnO/NGP Nanocomposites. J. Phys. Conf. Ser.. 2016;710:012005
- [Google Scholar]
- Tju, H., Prakoso, S.P., Taufik, A., Saleh, R., 2017. Synthesis and characterization of noble metal nanocomposites: Ag/Fe3O4/ZnO and Ag/Fe3O4/CuO/ZnO for better photocatalytic activity under visible light irradiation. 188, 012032.
- Combining non-thermal plasma with heterogeneous catalysis in waste gas treatment: a review. Appl. Catal. B-Environ.. 2008;78:324-333.
- [Google Scholar]
- Solvothermal synthesis and characterization of sandwich-like graphene/ZnO nanocomposites. Appl. Surf. Sci.. 2010;256:2826-2830.
- [Google Scholar]
- Plasma-catalytic removal of toluene over the supported manganese oxides in DBD reactor: Effect of the structure of zeolites support. Chemosphere. 2018;208:922-930.
- [Google Scholar]
Appendix A
Supplementary material
Supplementary data to this article can be found online at https://doi.org/10.1016/j.arabjc.2023.104571.
Appendix A
Supplementary material
The following are the Supplementary data to this article:Supplementary data 1
Supplementary data 1


