

Translate this page into:
Synthesis of multi-application activated carbon from oak seeds by KOH activation for methylene blue adsorption and electrochemical supercapacitor electrode
⁎Corresponding author at: Ton Duc Thang University, Ho Chi Minh City, Viet Nam. azam.marjani@tdtu.edu.vn (Azam Marjani)
-
Received: ,
Accepted: ,
This article was originally published by Elsevier and was migrated to Scientific Scholar after the change of Publisher.
Abstract
In the current study, an oak as a non-expensive, renewable, and a biomass resource was used to generate a nano-porous activated carbon applicable in methylene blue adsorption from wastewater and energy storage equipment. Furnace activation in the temperature range of 450, 550, 650 and 750 °C was used for activated carbon synthesis after infusion with potassium hydroxide. The synthesized activated carbon was characterized using different techniques including nitrogen adsorption/desorption, scanning electron microscopy, and fourier-transform infrared spectroscopy. The results showed that temperature has significant effect on activated carbon efficiency. Specific surface and pore volumes increased with the enhancement of temperature until 650 °C, but then it was decreased. Pores volume was consisting of mesoporous and microporous structure. The highest surface area (2896 m2/g) and pores volume (1.554 cm3/g) was obtained for the sample prepared at 650 °C. Freundlich isotherm model is appropriate for methylene blue adsorption isotherm by the synthesized activated carbon. The maximum adsorption capacity of MB was obtained as 24 mg/g. Moreover, the synthesized activated carbon exhibited the highest specific capacitance when it was used as electrode (551 F/g at current density of 1 A/g) in 1 M sulphuric acid electrolyte and 96% specific capacitance was remained after 5000 charge-discharge cycles at a current density of 10 A/g.
Keywords
Activated carbon
Adsorbent
Supercapacitor
Methylene blue

1 Introduction
The use of activated carbon (AC) was firstly recorded for the reduction of different metals including zinc, copper and tin ores to build bronze (Derbyshire et al., 1995). Well-developed microporous and mesoporous structures and huge internal surface areas are the main characterisation of activated carbon (Rodríguez Reinoso, 1997). Many various carbonaceous sources materials such as biomass materials can be used for activated carbon preparation. The most popular method for AC preparation is activation processes at high temperature. Selection of source and operating parameters such as activation time and temperature, and activation agent type could have substantial influence on the physical properties and performance of synthesized activated carbon (Guzel and Uzun, 2002). Pores volume, surface area and porosity specification of synthesized AC are measured to find optimal source and operating conditions (Yue et al., 2008). Furthermore, its application is examined in various processes consisting of gas separation (Khabazipour and Anbia, 2019; Ogungbenro et al., 2020), using as catalysts (Akbayrak et al., 2020), pollutants removal and wastewater treatment (Malhotra et al., 2018), electronic devices (Yumak et al., 2019) and fuel additive synthesis (Dizoğlu and Sert, 2020).
Biomass such as wood and fruit shells and seeds has attracted great intense interest as non-expensive source for production of activated carbon, and can be considered as sustainable processing. The main advantages of biomass are renewability, abundance, and their low cost (González-García, 2018). A lot of researchers have investigated various biomass residues for activated carbon synthesis. All biomass contains lignin, cellulose, and hemicellulose in their structure and the percentage of these compounds varies with each biomass (Queiroz et al., 2020). Queiroz et al. (2020) used acai seed as biomass source to make activated carbon using potassium hydroxide (KOH) as activation agent and it was found that increasing impregnation ratio improved its textural properties and it had great performance for metal removal. The KOH agent is one of the alkaline hydroxides which has some benefits such as melting without decomposition, and reaction with inert chemicals such as carbon materials (Jawada et al., 2018; Rashid et al., 2016). Hydrogen storage capacity of synthesized activated carbon from tangerine peel was evaluated and zinc chloride (ZnCl2) as activation agent was better than KOH and also there was Van der Waals interactions between hydrogen and activated carbon at cryogenic temperature (Doğan et al., 2020).
Oak trees’ different parts have been used for synthesis of activated carbon (Adibmehr and Faghihian, 2019; Niazi et al., 2018; Sulyman et al., 2014; Timur et al., 2010). Chestnut oak shells was used for activated carbon synthesis using phosphoric acid (H3PO4) and the AC was applied for chromium (VI) elimination by a batch adsorption system. Chestnut shell and prepared AC were able to adsorb 4.44 mg/g and 33 mg/g chromium, respectively (Niazi et al., 2018). Oak Leaves also can be used as a source for making activated carbon and its performance was examined for removal of crystal violet from aqueous solution (Sulyman et al., 2014). Chemical activation approach using zinc chloride and phosphoric acid was used for activated carbon synthesis from oak cups pulp. Maximum surface area was measured 1000 and 1152 m2/g when phosphoric acid and zinc chloride was used as activation agent (Timur et al., 2010). Magnetized AC synthesis using oak shell biowaste as source, then, modification with nickel hexacyanoferrate for selective separation of cesium from aquatic systems (Adibmehr and Faghihian, 2019). The adsorption data was examined using various isotherm models and it was found that Langmuir model can be successfully used to describe the system behaviour (Adibmehr and Faghihian, 2019).
Methylene blue (MB) is considered as cationic dye category and it has many industrial applications (Ravi and Pandey, 2019). It may cause negative impacts consisting of enhancement of heart rate, leptomeninges inflammation etc. in human health and contamination of the water (Hassan et al., 2014). A number of techniques is suggested to remove methylene blue and treatment of wastewater including flocculation, hollow fibre membrane contactor, adsorption, chemical oxidation and etc. (Alver et al., 2020; Lin et al., 2013). Adsorption process is considered as the powerful, versatile, and simple separation method to eliminate environmental contaminants from aqueous solutions. The most widely applied adsorbent for this aim is activated carbon. Therefore, prepared activated carbon was used for elimination of methylene blue using adsorption process (Alver et al., 2020).
Alabadi et al. prepared activated carbon doped with a certain amount of nitrogen. The used precursor to produce activated carbon was pyrolysis of poly[(pyrrole-2,5-diyl)-co-(benzylidene)] (PPCB). Then, the prepared samples were used to make a supercapacitor electrode. The results showed that the samples prepared at 700 and 800 °C showed the highest specific capacitance of 525.5 F/g as well as an energy density of ca. 262.7 (W.h)/kg at a current density 0.26 A/g in 2 M KOH electrolyte (Alabadi et al., 2014).
Xu et al. high volumetric activated carbon was synthesized by optimizing process conditions. They found that by increasing carbonization temperature, the electrode density would be increased. Carbonization temperature of 500 °C will have a specific capacitance of 339 F/g and an electrode density of 0.504 g/cm in a 6 M electrolyte (Xu et al., 2010).
Rani et al. used sweet corn husk as a precursor to porous carbon (high specific surface area 1370 m2/g) production. The produced electrode from activated carbon showed a specific capacitance of 127 F/g and an energy density of 4.4 (W.h)/kg in a 6 M KOH electrolyte solution. The resulting electrode maintained 90% of its specific capacitance after 5000 cycles (at 2 A/g) (Usha Rani et al., 2020).
Nazem et al. (2020) synthesized activated carbon from pistachio, walnut and peanut shells. But the aim of the current study is synthesis of an activated carbon with nanoporous structure for making supercapacitor and dye removal from wastewater. In the current work, Iranian oak seeds are used to prepare activated carbon and the product was used for methylene blue removal from a wastewater which have not been investigated in the literature. The effects of activation time and temperature and the oak seeds to activation agent ratio on the activated carbon efficiency and methylene blue adsorption was investigated. Furthermore, physicochemical properties of synthesized activated carbon were studied using scanning electron microscope (SEM) analysis, Fourier-transform infrared spectroscopy (FTIR) and nitrogen (N2) adsorption analysis. Finally, the produced activated carbon was used for making supercapacitor.
2 Materials and method
Different species of oak including quercus brantii or quercus persica, quercus libani, and quercus infectoria can grow in Zagros mountains, Iran. Fig. 1 demonstrates the whole process of producing a supercapacitor product from an oak source. Herein, quercus perisca was used in the experiments. This oak’s auto-ignition temperature, and density is more than 200 °C and 600–700 kg/m, respectively. It is insoluble in water and its vapour pressure is too low and ignorable. Production of activated carbon from quercus perisca was evaluated using chemical activation with potassium hydroxide as activation agent. The activated carbon was made in a ceramic furnace with fireproof brick insulation.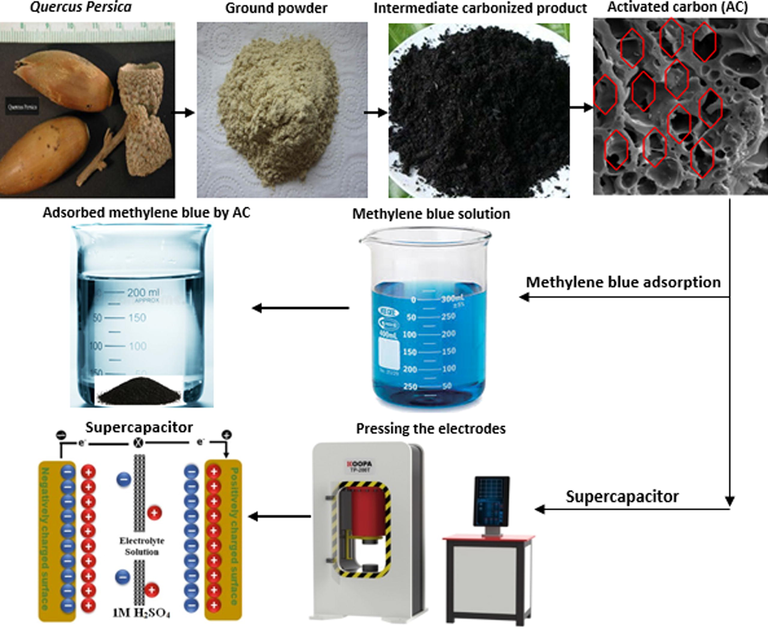
Production process of supercapacitor product from an oak source.
2.1 Chemicals
Nitrogen gas was used with 99% purity in this work. The chemicals including potassium hydroxide (KOH), methylene blue (C16H18ClN3S), hydrochloric acid (HCl), sulphuric acid (H2SO4), sodium sulphate (Na2SO4), and N-methyl-2-pyrrolidone were purchased from Merck. Polytetrafluoroethylene (PTFE) was bought from Alfa Aesar.
2.2 Activated carbon synthesis
In order to make activated carbon, oak seeds were firstly crushed by a mill. Then, the ground oak was sieved to different particle sizes. The oak particles in the range of 1–2 mm were selected for the experiments. After sieving, the particles were washed and kept in oven at 110 °C for 24 h. Afterwards, the prepared samples were mixed with potassium hydroxide in different oak seeds to activation agent ratios including 0.5, 1, 1.5, 2, and 2.5. The mixture was added in 250 mL flasks, then, 100 mL distilled water was poured into the mixture. The flasks were placed in an orbital shaker at 80 °C, agitated at 100 rpm for 24 h. After that, the flasks were moved into an oven at 110 °C for 24 h for activation of impregnated cake in the furnace. Chemical activation was performed in the furnace at different temperatures such as 450, 550, 650 and 750 °C. Also, the nitrogen flow rate, heating rate, and holding time were 100 cm3/min, 10 °C/min and 1–3 h, respectively. Post treatment was needed to eliminate excess KOH from the AC. Therefore, the synthesized activated carbons were treated with hydrochloric acid, then, distilled water was used to wash and remove excess chloride, and dried at 110 °C for 24 h. Furthermore, four samples synthesized at different activation temperatures (ACO-450 °C, ACO-550 °C, ACO-650 °C, and ACO-750 °C) were selected for supercapacitor tests.
Activated carbon efficiency is defined as the ratio of activated carbon mass to oak mass based on Eq. (1):
2.3 Characterization procedures
In order to investigate the physicochemical properties of synthesized activated carbons for adsorption process, various analytical methods were employed. Fourier transform infrared (FTIR) spectroscopy was used for determination of surface functional groups (Bruker TENSOR 27). A Scanning Electron Microscope (CAMSCAN MV2300) was applied to study the samples surface properties in terms of topography, morphology and composition of the materials. The surface area and pore structure of synthesized activated carbon were determined at −196 °C using nitrogen adsorption/desorption method by Brunauer–Emmett–Teller (BET) analyzer (Belsorp mini II, BelJapan, Japan). A X-ray Photoemission Spectrometer (XPS, ESCA) instrument with monochromatic Al-Kɑ was used to analyze the surface chemical composition of selected carbons.
2.4 Methylene blue adsorption experiments
Methylene blue (MB) was used for adsorption experiments in order to examine the synthesized activated carbon performance. The amount of 100 mL different solutions containing 25, 50, 100, 250, 500 mg/L MB were prepared and placed in 250 mL flasks. Then, 0.02 g activated carbon was added into the mixture. All of the flasks were agitated at 100 rpm for 2 h. Finally, the mixture was filtered and prepared for UV–Vis 2100 spectrophotometric analysis to measure MB concentrations. MB concentration was determined at 660 nm wavelength. All of the experiments were performed in triplicate mode. The methylene blue adsorption capacity Q (mg/g) was calculated based on the Eq. (2):
2.5 Electrochemical equipment
Cyclic voltammetry and impedance spectra analyses were performed using Autolab potentiostat/galvanostat instrument. WonATech (WPG100e) was used for 2-electrode charge-discharge tests at constant current.
2.6 Activated carbon electrode construction
In this study, synthesized activated carbon from an oak (50%), carbon black (45%), and PTFE (5%) was homogenously mixed to manufacture electrode. The activated carbon powder, carbon black, and PTFE polymer with different weight ratios were used to prepare the best carbon electrode (weight ratio of 50:45:5 showed the most symmetric voltammograms, so this ratio was selected for all electrochemical measurements). The mixed solution was stirred for 1 hr to make sure it is homogeneous. Then, the carbon slurry was placed on steel sieves and it was pressed by 15-ton laboratory press for 10 min. Then, the electrode was put in 0.5 M sodium sulphate for 72 hr, each working electrode contained approximately 3.0 mg of active carbon. In 3-electrode system the counter electrode and reference electrode were platinum and Ag/AgCl, respectively.
The galvanostatic charge/discharge (GCD) and cyclic voltammetry (CV) tests on a potentiostat, and electrical impedance spectroscopy (EIS) were used to characterize the capacitive performance of various carbons. A three-electrode electrochemical cell was used to conduct the experiments at room temperature. The measurement of capacitive properties of electrodes was carried out in a 1 M H2SO4 electrolyte solution. The CV test was investigated in a potential range of 0–1 V using a scan rate window of 10–500 mV/s. The GCD measurement was also done with the current density and potential in the range of 1–20 A/g and 0–1 V, respectively. The galvanostatic capacitance was calculated using the following Eq. (Zapata-Benabithe et al., 2012, 2013):
Coulombic efficiencies were calculated using charge and discharge time (tc and td) as follows:
The specific energy and power densities were calculated based on the Eqs. (5) and (6) at various current densities to find Ragone plot (Bello et al., 2015; Korenblit et al., 2010):
The amount of GCDs was tested less than 10,000 cycles. The frequency ranges of electrochemical impedance spectroscopy (EIS) measurements ranged from 105 to 106 Hz at the open-circuit potential with applied voltage of 10 mV signal. The maximum capacitance was obtained as follows:
In cyclic voltammetry test, the specific capacitance of the carbon electrode was determined as follows (Zhao et al., 2015):
3 Results and discussion
3.1 Activation temperature and time effect on the activated carbon efficiency
Activated carbon efficiency as function of activation time and temperature is provided in Fig. 2. The ratio of oak seeds mass to activation agent mass was considered 1. As was witnessed from Fig. 2, the activated carbon efficiency was decreased with the increase of temperature, which were down to 25%, 22%, and 21% for 1, 2, and 3 h’ activation respectively. Furthermore, it should be pointed out that temperature has significant effect on the activated carbon efficiency especially in the range of 450–550 °C. It could be attributed to that quick evaporation of volatile compound with the enhancement of the temperature from 450 to 650 °C. However, the time has slight effect on the activated carbon efficiency.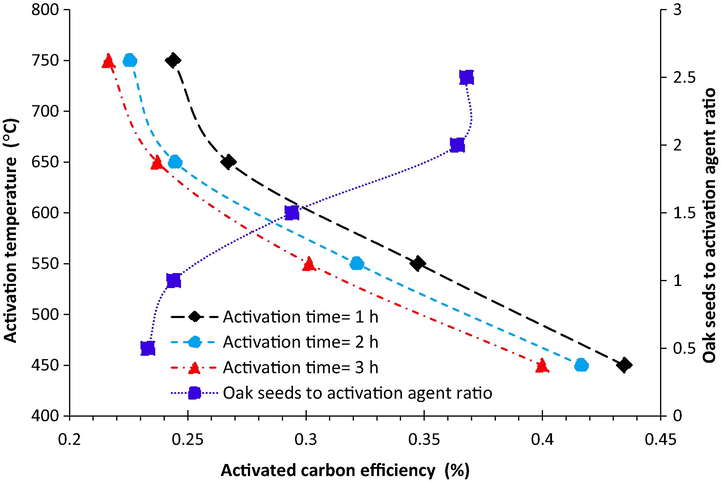
The activated carbon efficiency as a function of activation time and temperature also as a function of oak seeds to activation agent ratio.
3.2 Oak seeds mass/activation agent effect on the activated carbon efficiency
The effect of the oak seeds mass/activation agent mass on the activated carbon efficiency at 650 °C for 2 h was illustrated in Fig. 2. The values of activated carbon efficiency showed increasing trend with increasing the Oak seeds mass/activation agent mass ratio from 0.5 to 2.5. The increase in hydroxide potassium concentration results in increase in oxidation reaction rate. In lower potassium hydroxide concentration, the main dominant reaction will be the evaporation of atoms on the carbon surface which leads to the reduction of activated carbon weight. There was only slight increase in the yield when the ratio of oak seeds mass/ activation agent was more than 2. Therefore, the value of 2 for the oak seeds mass/ activation agent ratio was considered as optimum ratio.
3.3 Activation temperature effects on specific surface and pores volume
Adsorption/desorption isotherms of activated carbon synthesized at various activation temperatures, an oak seed to activation agent ratio = 1:2, and 2 h are provided in Fig. 3a. The mix of type I and type IV isotherms can be seen for all activated carbons adsorption isotherms based on the IUPAC classification, which it means that there is both micro- and mesopore structures in the samples. From Fig. 3, with the enhancement of the temperature from 450 to 650 °C, the N2 adsorption enhances at low relative pressures indicating the higher micro-porosity of the produced activated carbon. It should be pointed out that Type I isotherm is usually related to the microporous samples which have relatively small external surface, however, there is also mesopores in the activated carbon because of the enhancement of nitrogen adsorption at higher relative pressure (Mojoudi et al., 2019). The results are consistent with the reported data by (Elmouwahidi et al., 2017). Furthermore, progressive P/P0 increasing in the isotherm of type I led to the extension of horizontal line. The type I isotherm explains the monolayer adsorption and it is relatively consistent with the Langmuir equation. Porous structure contraction happened, when the activation temperature increases up to 750 °C. Also, it should be noted that tiny amounts of metallic potassium between the carbon layers are found at activation temperatures higher than 700 °C. The pores destruction could be taken place at higher activation temperatures and meso- or macro-pores are created in the activated carbon instead of microporous. This phenomenon led to the reduction of activated carbon porosity. Furthermore, very high temperatures can result in an increase in gasification reaction rate and subsequently destruction of micropores and decreasing the surface area of activated carbon.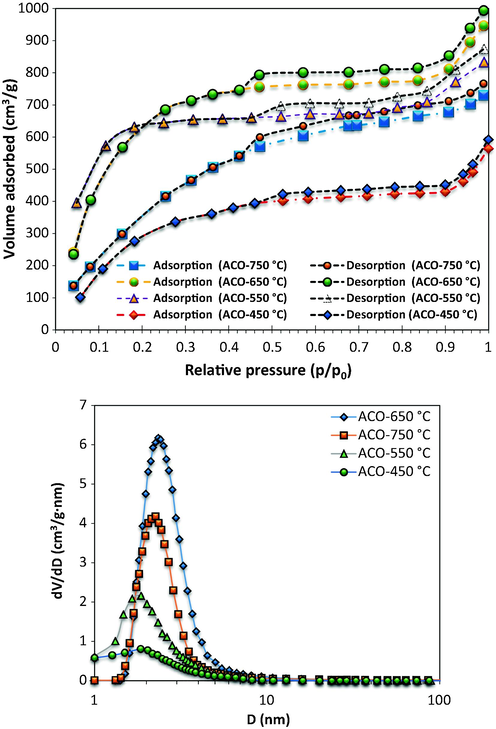
(a) N2 adsorption/desorption isotherms at −196 °C of the prepared activated carbons by KOH from oak seeds at different activation temperatures (T = 450, 550, 650 and 750 °C) (b) pore size distribution for ACO samples.
It should be pointed out that there is optimal value for the development of mesopores at higher activation temperatures. The amount of micropores is 83% for the sample prepared at 450 °C and 550 °C while the amount of mesopores was less than 4%. However, at higher temperature the percentage of micropores was about 60% and 55% for the samples prepared at 650 °C and 750 °C in terms of mesopores, 40% and 37% was occupied at 650 °C and 750 °C.
The adsorption capacity of an activated carbon depends largely on the presence of micro pores on surface area. Surface areas and pores volume of activated carbon produced from oak seeds at different activation temperatures was illustrated in Table 1. Activation time and oak seeds to potassium hydroxide ratio were considered 2 h, and 2 respectively. The results indicated that as the temperature is increased, the micro pore volume and specific surface increases, reaching a maximum at 650 °C. Further increase in the temperature to 750 °C resulted in a decrease in the micro pore volume and specific surface. Increasing temperature from 450 °C to 750 °C, increases volatile compounds evaporation rate which leads to the development and increasing pores in the activated carbon. In addition, potassium is placed into carbon matrix. This phenomenon can increase the space between carbon layers and consequently increases total pore volumes. Based on the XPS results, it was observed that the carbon content of activated carbon was decreased with increasing activation temperature up to 650 °C but there was increase in the oxygen content. It is expected that increasing the oxygen content in the activated carbon can improve its wettability. This phenomenon leads to enhancement of fabricated electrodes capacity through improvement of the electrolyte solution penetration into the electrode pores.
Samples
SBET
Smicro
Vtotal
Vmicro
Vmeso
Average pore size (nm)
Atomic Conc. (atom%)
C/O
(m2/g)
(cm3/g)
C
O
ACO-450 °C
949
747
0.313
0.259
0.014
1.53
95.97
6.37
15.06
ACO-550 °C
1691
1005
0.676
0.534
0.021
1.78
86.43
9.04
9.56
ACO-650 °C
2896
2235
1.554
0.925
0.619
2.90
80.34
15.47
5.19
ACO-750 °C
2623
1803
1.346
0.730
0.502
1.98
83.54
12.87
6.49
Surface area and pores specifications of four samples were provided in Table 1. The average pores diameter was increased with increasing activation temperature. Ion transfer kinetics in electrodes has considerable role in the supercapacitor’s performance. The ion transfer kinetics can be considerably affected by surface area and electrode pores structure. It is expected that the mix of micropores and mesopores along with a high specific surface area can improve the electrodes in terms of electrochemical performance (Sylla et al., 2019). Mesopores are able to provide a fast transfer route for electrolyte in the electrode while the existence of micropores results in high surface area for adsorption of ions. The highest surface area and pores volume of 2896 m2/g and 1.554 cm3/g was obtained for the synthesized activated carbon which was prepared at 650 °C activation temperature. It was observed slight decrease in carbon content and a bit increase in oxygen content for the sample prepared at 650 °C activation temperature. It is expected that increase in oxygen content leads to the enhancement of wettability of activated carbon and consequently improves electrolyte penetration into the electrode pores. Furthermore, presence of heteroatoms can result in improvement of semi-capacitance and subsequently increases in total capacitance of the electrode.
3.4 SEM results
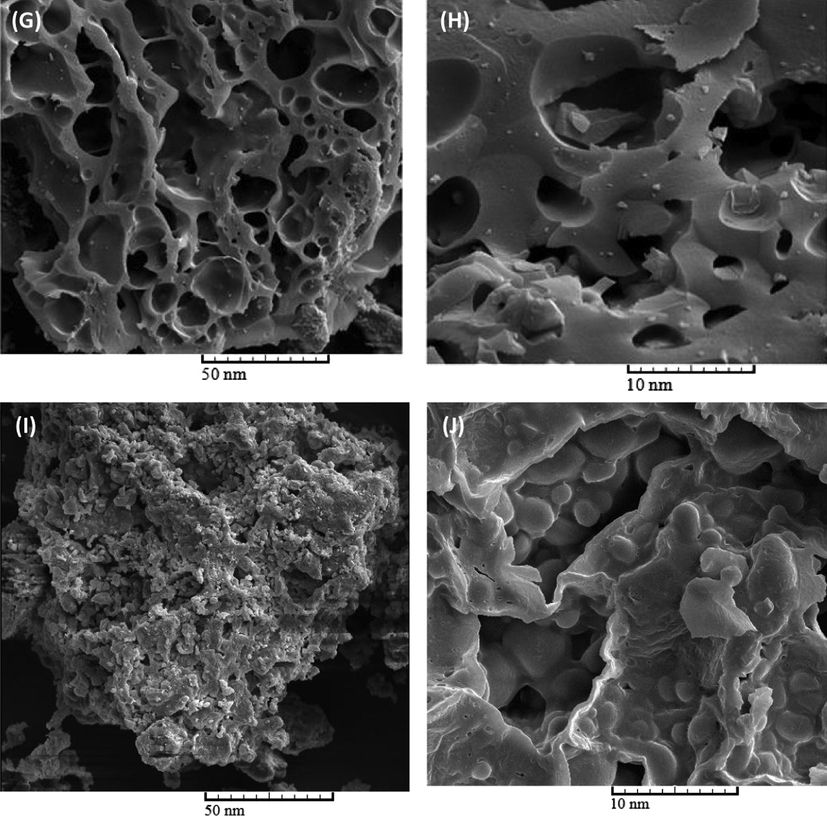
SEM characterization of oak seeds (Fig. 4 (A and B)) and activated carbons synthesized at different temperatures including 450 °C (Fig. 4 (C and D)), 550 °C (Fig. 4 (E and F)), 650 °C (Fig. 4 (G and H)), and 450 °C (Fig. 4 (I and J)) was carried out to investigate the effect of temperature on the microstructure and morphology of produced activated carbon. The oak seeds to activation agent ratio was 1:2 and the samples were treated for 2 h. Form Fig. 4 (A and B), it was observed that oak seeds have a rough external structure. However, the synthesized activated carbons had many pores. In particular, there are so many pores in the prepared activated carbon at 650 °C. It seems that the creation of pores is due to evaporation of KOH at higher temperature which was occupied by potassium hydroxide. Except for the sample produced at an activation temperature of 650 °C, at low magnifications, similar microstructure was observed for all samples. There is good consistency between SEM results and nitrogen sorption test.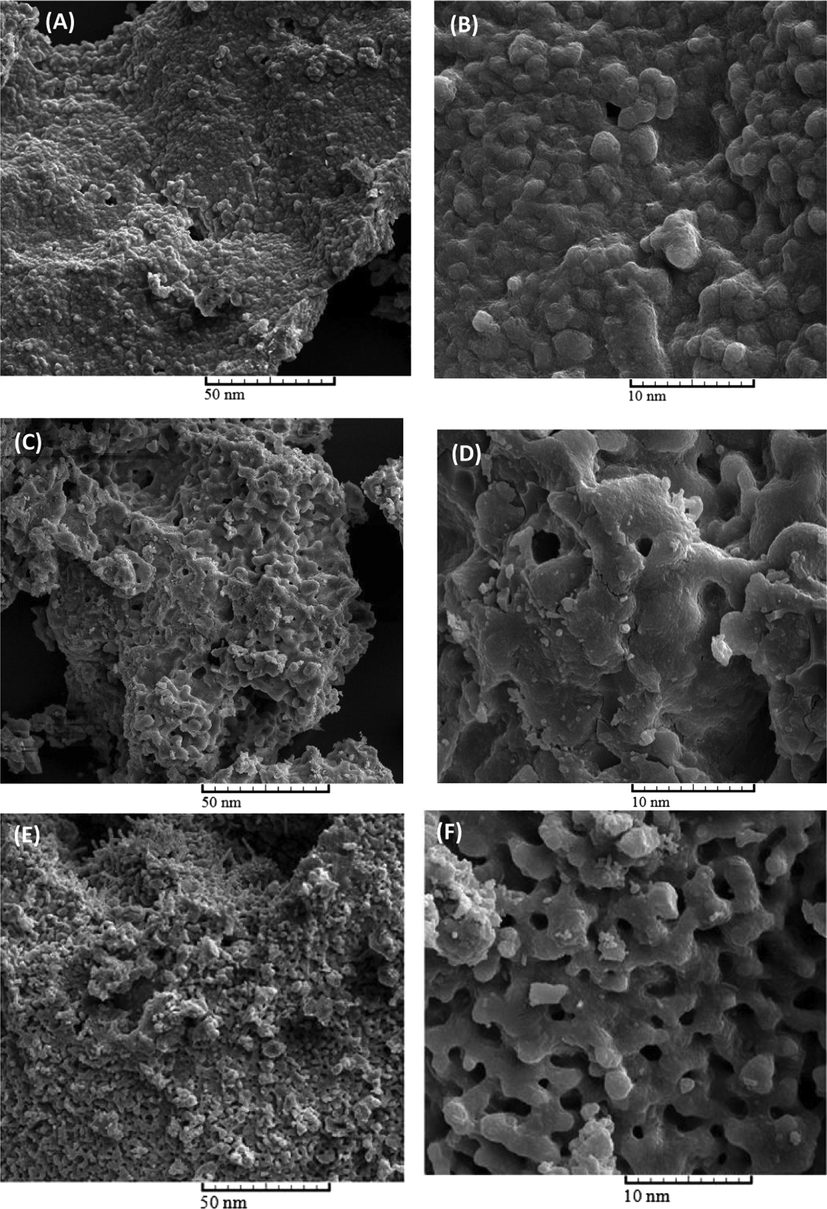
Structure and morphology characterizations of oak seeds (A, B) and the activated carbons prepared at different temperature, At 450 °C (C, D), 550 °C (E, F), 650 °C (G, H) and 750 °C (I, J).
Structure and morphology characterizations of oak seeds (A, B) and the activated carbons prepared at different temperature, At 450 °C (C, D), 550 °C (E, F), 650 °C (G, H) and 750 °C (I, J).
3.5 FTIR analysis
Determination of activated carbon pores structure is important. The FTIR for the prepared activated carbon adsorbents at different activation temperatures at wave numbers from 400 to 4000 cm−1 were given in Fig. 5. It was observed different bands including C–H, O–H, CH2, (CH2)n>5, CH3, C–O, and C–C groups at 2930, 3245, 1456, 720, 1388, 1040, and 887 (cm−1) respectively. Formation of these bands on activated carbon surface can lead to increase in its porosity and specific surface (Jawad and Abdulhameed, 2020; Jawad et al., 2019). The performance of synthesized activated carbons was investigated by using in dye removal process and fabrication of supercapacitors.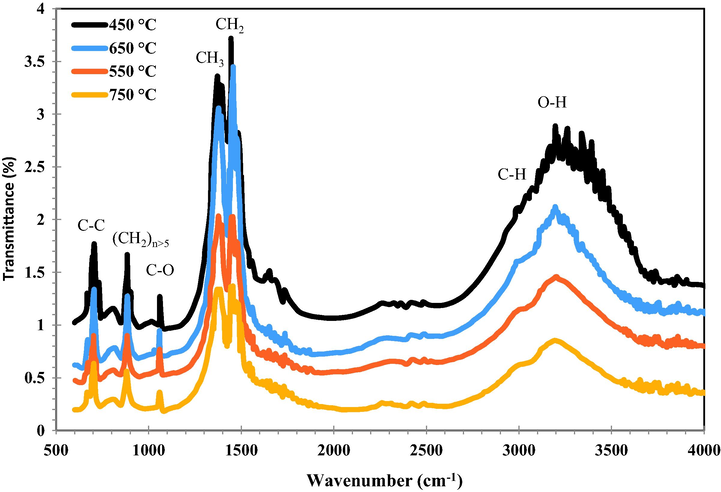
FTIR spectrum of activated carbons treated at different temperatures.
3.6 Methylene blue adsorption
Effect of pH and contact time, effect of adsorbent dose, and effect of MB initial concentration on the MB removal and the amount of adsorbed dye at equilibrium was shown in Fig. 6. The activated carbon was prepared at temperature of 650 °C and oak seeds to activation ratio of 2. It was seen that the MB removal increases with increasing of pH. There is sharp increase in the adsorbed MB at equilibrium with increasing contact time up to 30 min, then, it becomes almost constant (Fig. 6 (A)). Adsorbent dose (Fig. 6 (B)) and initial MB concentration (Fig. 6 (C)) have positive impact on the MB removal from solution, however, the amount of MB adsorption per mass of activated carbon was decreased with increasing these two parameters.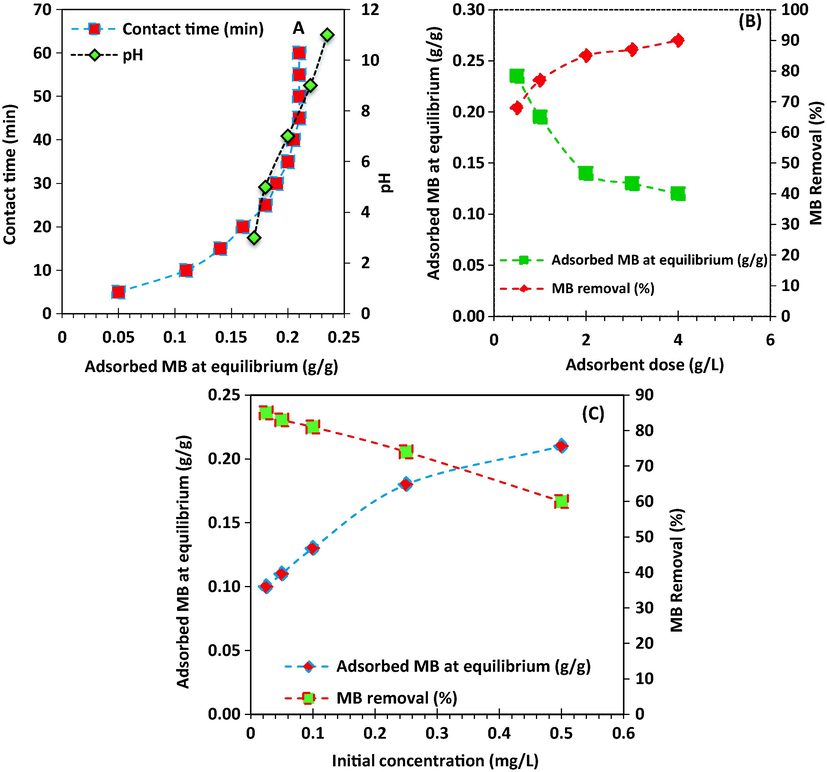
(A) Effect of pH and contact time, (B) Effect of adsorbent dose, and (C) effect of MB initial concentration on the MB removal and the amount of adsorbed dye at equilibrium.
Fig. 7 shows isotherm of methylene blue adsorption on the synthesized activated carbon prepared at different activation temperatures and times. As it was observed, the amount of methylene blue adsorption increases with increasing of activation time. Furthermore, it is observed that the methylene blue adsorption on the synthesized activated carbon enhanced with temperature until 650 °C. After that, MB adsorption was decreased with enhancement of temperature to 750 °C which the obtained result is consistent with BET results.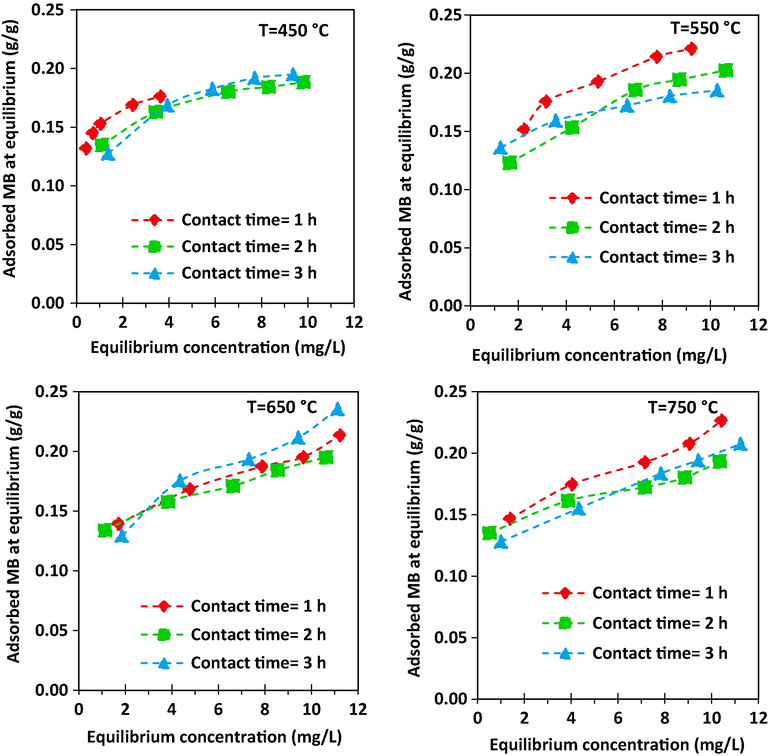
Adsorption isotherm for MB adsorption onto activated carbon prepared at different activation temperatures and times.
Adsorption isotherms of synthesized activated carbon were investigated using two common adsorption models. The Langmuir (Langmuir, 1918) and Freundlich (Freundlich, 1906) models were applied to study the activated carbon adsorption isothermal behaviour. The Langmuir model was build based on a number of assumptions including: (1) adsorption is localized on a monolayer; (2) adsorption sites on the adsorbent are homogeneous; (3) same adsorption capacity of the sites. The Langmuir isotherm equation can be written as follows (Langmuir, 1918; Tsai et al., 2001):
Activation temperature
Time (h)
Langmuir adsorption model
Freundlich adsorption model
Q0(g/g)
b(L/mg)
R2
Kf
n
R2
450 °C
1
0.187
1.581
0.980
0.453
0.619
0.987
2
0.642
1.680
0.977
3.313
2.785
0.995
3
0.720
2.125
0.995
3.358
2.693
0.986
550 °C
1
0.693
1.913
0.960
3.396
2.844
0.998
2
0.840
2.587
0.950
3.651
3.080
0.989
3
0.845
3.295
0.987
3.431
2.620
0.978
650 °C
1
0.667
1.7
0.893
3.419
2.938
0.975
2
0.904
2.684
0.926
3.847
3.391
0.976
3
0.91
2.900
0.972
3.793
3.271
0.982
750 °C
1
0.400
0.680
0.860
3.127
3.047
0.948
2
0.657
1.477
0.860
3.567
3.256
0.957
3
0.765
2.140
0.890
3.579
3.066
0.958
In the Freundlich isotherm model, it is assumed that there are multi-layer adsorption processes exist on the heterogeneous surfaces. The Freundlich isotherm linear equation can be expressed as follows (Freundlich, 1906; Ng et al., 2002):
Finally, adsorption capacity of synthesized activated carbon was compared with the data reported in the literature. Table 3 shows adsorption capacity of different activated carbons which have been synthesised from various sources. As it can be seen, the synthesized activated carbon has great capacity for the MB adsorption.
Samples
Adsorption capacity (mg/g)
Dosage (g)
Solution pH
Temperature (°C)
Reference
Black cumin seeds
16.85
0.1
4.8
25
(Thabede et al., 2020)
Sunflower oil cake
16.43
0.2
6
25
(Karagöz et al., 2008a)
Rice husk
9.83
0.5
7
30
(Sharma and Uma, 2010)
Glass wool
8.82
1
9
35
(Chakrabarti and Dutta, 2005)
Leaginous microalga, S
7.80
100
7
25
(Sarat Chandra et al., 2015)
Rice straw
129
0.1 g/0.1 L
–
25
(Gao et al., 2011)
Waste apricot
102.04–136.48
0.1 g/0.05 L
–
30–50
(Başar, 2006)
Wood apple rind
40.1
0.1 g/0.05 L
9
–
(Malarvizhi and Ho, 2010)
Sunflower cake
16.43
0.02 g/0.01 L
6
25
(Karagöz et al., 2008b)
Coffee press cake
14.27
20 g/1 L
5
–
(Nunes et al., 2009)
Corncob
28.65
0.02 g/0.1 L
8
25
(El-Sayed et al., 2014)
ACO-650 °C
235
0.5
7
25
Present work
3.7 Electrochemical energy storage analysis and measurements
3.7.1 Electrochemical energy storage analysis and measurements for all samples
The prepared activated carbon samples’ electrochemical performance was investigated using a three-electrode system in 1 M H2SO4 (electrolyte) and the CV, GCD, and EIS was presented in Fig. 8. The CV profiles were measured using 100 mV/s scan rate and those were provided in Fig. 8 (a). The rectangular shape of CV profiles was obtained for all samples, in particular for the samples with higher activation temperature. That means the material is reversible for supercapacitor application. A larger specific capacitance was found with increasing activation temperature until 650 °C, then, it becomes smaller at 750 °C. The size of rectangular was directly related to the material’s surface area and pores volume.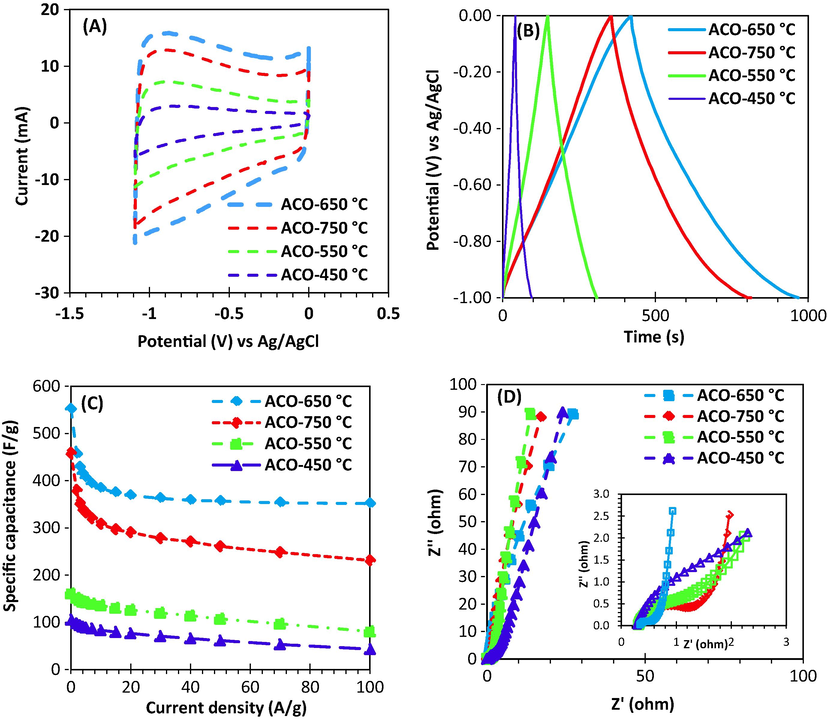
The synthesized activated carbon electrochemical performance: (A) Cyclic voltammetry (CV) at scan rate of 100 mV/s (B) GCD cycle at a current density of 1 A/g (C) Specific capacitance vs. current density (D) Nyquist plot.
The GCD profiles with current density of 1 A/g was shown in Fig. 8 (b). The samples prepared at 450 °C and 550 °C showed a symmetric triangular shape while GCD profiles were semi-symmetric for the samples prepared at 650 °C and 750 °C. The change in GCD profiles is due to heteroatom-doping, it means that at semi-symmetric state the oxygen is produced in the system. The XPS analysis confirmed that the presence of high amount of oxygen for the samples with activation temperatures of 650 °C and 750 °C. The function groups containing oxygen provide a semi-capacitor which improves the total capacitance of the electrode. In addition, the samples prepared at high temperatures had the longest charge-discharge cycle, indicating their remarkable electrochemical performance. These findings were proved using measurement of specific capacitance at different current densities for all samples.
Change in the specific capacitance as a function of current densities was shown in Fig. 8 (c). The specific capacitance is significantly higher for the samples prepared at of 650 °C and 750 °C than other two samples in the whole range of current. In fact, the specific capacitance at 1 A/g current density was 106, 161, 552, and 458 F/g for 450 °C, 550 °C, 650 °C and 750 °C, respectively.
Fig. 8 (d) shows Nyquist plot obtained from EIS analysis in the range of 0.01 Hz to 1 MHz. The vertical line in the domain of lower frequency is approximately parallel with Z axis for the sample prepared at 650 °C and 750 °C. This phenomenon corresponds to the great capacitance behaviour of the samples while the other two samples showed weak capacitance behaviour as the slope of lines is lower. This could be attributed to the lower pores volume and surface area of the samples prepared at capacitance 450 °C and 550 °C activation temperature. The Equivalent Series Resistance (RESR-value) is usually obtained at very high frequencies from extrapolation on the real axis of the Nyquist plot which it is a combination of surface resistivity of electrode and ionic resistance of electrolyte solution. High to medium frequency zone shows load resistance. All activated carbon samples had too low ESR in the range of 0.29–0.36 Ω. Semi-circle diameter in medium frequency region is related to the sum of bulk electrolyte resistance and load resistance. It was found that the sample prepared at 650 °C has the least semicircle (Fig. 8 (d)) which means the lowest load resistance. Presence of a straight line with 45-degree slope in low frequency region proves Warberg response. The Warberg response corresponds ionic exchange and diffusion resistance of ions into electrode pores. Again, it was observed that the sample prepared at 650 °C has the smallest Warberg region in comparison with other samples. It means that ionic diffusion is high for this sample. Based on the obtained results, it is clear that the samples prepared at 650 °C and 750 °C had better electrochemical performance. As the sample prepared at 650 °C was better than the sample prepared at 750 °C in terms of performance, the further analyses were only carried out on the sample prepared at 650 °C.
3.7.2 Electrochemical energy storage analysis and measurements for the best sample
Fig. 9 (a) presents the CV with different scan rates. The rectangular shape of CV pattern was seen in all scan rates from 10 to 500 mV/S and also an excellent capacitance behaviour based on the higher reversible adsorption-desorption rate of electrolyte ions in pores of electrode. Furthermore, the absence of redox or reduction peaks means that electric double layer capacitance (EDLC) mechanism is dominant in the system.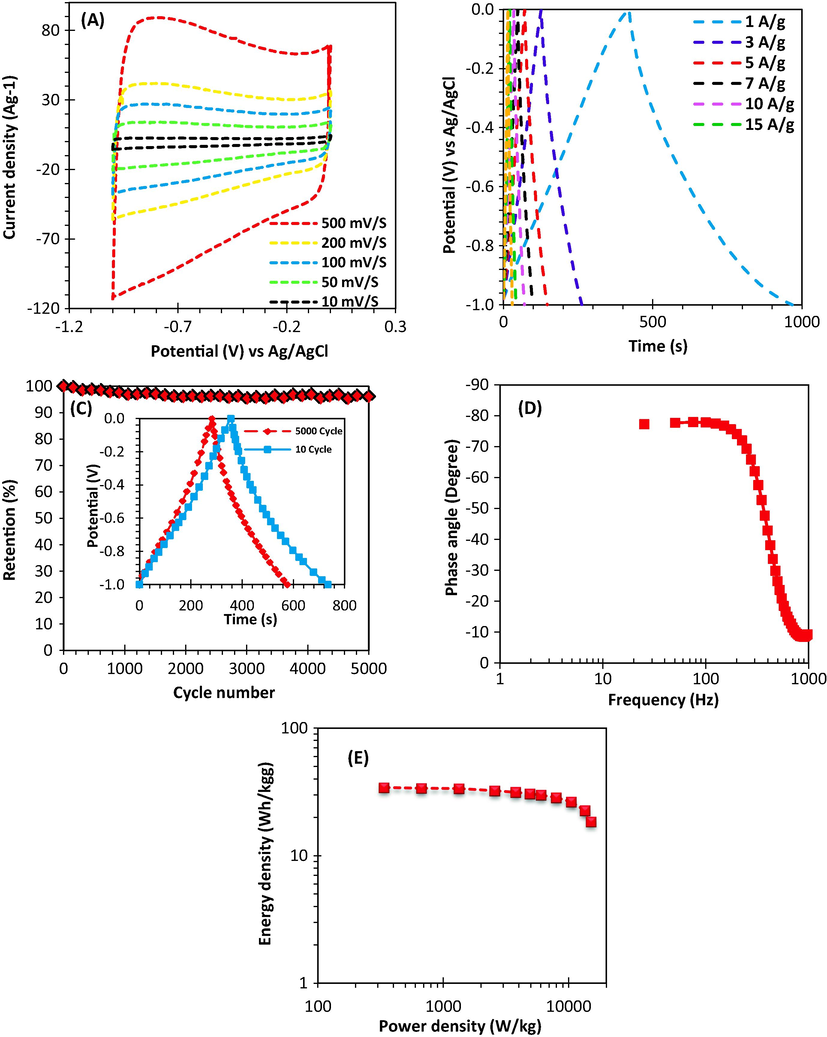
Electrochemical properties of ACO-650 °C: (A) CV as a function of various scan rates. (B) GCD cycle as a function of various current densities (C) Bode plot (D) Cycling stability at a constant current density (10 A g−1) and inset indicating charge–discharge curves at the beginning and end of the cycles. (E) Ragone plot.
The GCD profile in the current densities range of 1–20 A/g was shown in Fig. 9 (b). The profiles are approximately linear and symmetrical in all current densities which means that electric double layer capacitance mechanism and higher coulombic efficiency. The sample prepared at 650 °C holds a reversible capacity of 352 F/g even at current densities higher than 100 A/g (Fig. 9 (c)).
Furthermore, high rate performance was obtained for the electrodes based on the Bode plot (Fig. 9 (d)). From the f0 (4.2 Hz) at 45° phase angle, it was found that the response time τ0 (τ0 = 1/f0) is only 0.24 s, indicating that the electrode has a proper rate performance. This frequency shows a point which apparent resistivity related to capacitor and non-conductive is equal and at higher than the relaxation time constant (τ0) supercapacitor transforms from purely capacitive to purely resistive behaviour. Cycle performance of electrode is presented in Fig. 9 (d), indicating that the electrode is able to hold 96% of initial capacitance after 5000 cycles at current density of 10 A/g. According to Ragone plot (Fig. 9 (e)), it was observed that the electrode (from the activated carbon synthesized at 650 °C) has a high E of 34 W.h/kg at a P of 336 W/kg which was higher than many symmetric supercapacitors based on carbon in aqueous electrolyte (Cai et al., 2016; Sun et al., 2015). The energy density was faced a decrease at higher power density. For example, the energy density was obtained 18.5 W.h/kg at power density of 14.9 KW/kg. The magnificent electrochemical performance of the electrode prepared from the activated carbon (synthesized at 650 °C) can be related to optimum combination between micropores and mesopores as well as high specific surface area. In addition, the presence of oxygen improves total capacitance and results in the enhancement of electrode wetting by the electrolyte. High number of micropores in the sample prepared at 650 °C plays significant role in the optimization of electric double layer surfaces and increasing of specific capacitance of an electrode in an aqueous electrolyte for the highest ion adsorption. Mesopores provides interconnected internal channels with micropores.
Surface area and pores structure parameters of this study for the activated carbon and its specific capacitance was compared with previous works and the data was given in Table 4. As it can be seen, the activated carbon specification is highly dependent on the synthesis method and activation agent. According to Table 4, the synthesized activated carbon in this study has the highest specific capacitance in comparison with previous studies.
Samples
SBET (m2/g)
Smicro (m2/g)
Vtotal (cm3/g)
Vmicro (cm3/g)
Vmeso (cm3/g)
Average pore size (nm)
Agent
Specific capacitance (F/g)
Electrolyte
Cell configuration
Ref
Straw pulping
917
686
–
–
–
–
KOH
–
–
–
(Jin et al., 2012)
Soybean oilcake
618.54
273.7
0.291
0.143
0.148
–
KOH
–
–
–
(Tay et al., 2009)
Cocoa podhusk
490
–
0.24
–
–
2.9
KOH
–
–
–
(Cruz et al., 2012)
Coffee endocarp
361
–
0.17
0.11
–
–
KOH
69
1 M H2SO4
3E
(Nabais et al., 2011)
Waste tea leaves
2841
–
–
1.366
–
2.67
KOH
330
2MKOH
3E
(Peng et al., 2013)
Sunflower seed shell
1162
1153
0.67
0.59
0.08
2.2
KOH
244
30 wt% KOH
2E
(Li et al., 2011)
Camellia oleifera shell
1935
265
1.18
0.12
1.06
2.3
ZnCl2
374
1 M H2SO4
3E
(Zhang et al., 2012)
Cassava peel waste
1352
876
0.579
0.356
–
–
KOHþCO2
153
0.5 M H2SO4
3E
(Ismanto et al., 2010)
Sugarcane bagasse
1788
–
1.74
0.19
1.55
–
ZnCl2
300
1 M H2SO4
2E, 3E
(Rufford et al., 2010)
Apricot shell
2335
–
0.984
0.797
0.187
–
NaOH
339
6 M NaOH
2E
(Xu et al., 2010)
Waste coffee beans
1019
–
0.48
0.21
–
–
ZnCl2
368
1 M H2SO4
2E, 3E
(Rufford et al., 2008)
Oil palm EFB
1704
–
0.89
0.62
–
2.24
KOH/CO2
149
1 M H2SO4
2E
(Farma et al., 2013)
Argan seed shells
2062
–
2.18
0.96
1.22
–
KOH
355
1 M H2SO4
3E
(Elmouwahidi et al., 2012)
Rice husks
1527
–
–
–
–
–
MW-ZnCl2
194
1 M Et4NBF4/PC
2E
(He et al., 2013)
Peanut shell
1552
–
–
–
–
–
MW-ZnCl2
199
1 M Et4NBF4/PC
2E
(He et al., 2013)
ACO-650 °C
2896
2235
1.554
0.925
0.719
2.90
KOH
552
1 M H2SO4
3E
Present Work
4 Conclusion
In the current study, oak seeds biomass was used as a sustainable source for the preparation of activated carbon (AC) using chemical activation technique with potassium hydroxide. The performance of the synthesized activated carbon with high specific surface area and pores was investigated in removal of methylene blue and fabrication of electrode as supercapacitor.
The yield was calculated by change in activation temperature and time and the oak seeds to activation agent ratio. Also, the produced carbons structural properties are investigated using SEM, FTIR, and N2 adsorption techniques. The optimum temperature was found to be 650 °C, while time did not have considerable influence on the activated carbon yield. The specific surface area and pores volume were determined 2896 m2/g and 554 cm2/g for the synthesized activated carbon and the pores were mix of mesopores and micropores.
Furthermore, the methylene blue adsorption results indicated that increasing activation time increases the MB adsorption and the adsorption was enhanced with increasing temperature from 450 to 650 °C, then, there was a decrease in the MB adsorption in the range of 650–750 °C. Isotherm model analyses showed that the experimental data well fitted the Freundlich isotherm model.
The activated carbon electrochemical performance was great when it was used as supercapacitor electrode. Its specific capacitance was 552 F/g at 1 A/g current density in 1 M sulphuric acid. It showed high specific capacitance (352 F/g) even at too high current density (100 A/g). The results confirmed that an oak has considerable potential for fabrication of electrode in supercapacitors. It is also feasible to make in large scale due to its synthesis method simplicity.
Acknowledgment
Saeed Shirazian acknowledges the supports by the Government of the Russian Federation (Act211, contract 02.A03.21.0011) and by the Ministry of Science and Higher Education of Russia (grant FENU-2020-0019).
Declaration of Competing Interest
The authors declare that they have no known competing financial interests or personal relationships that could have appeared to influence the work reported in this paper.
References
- Magnetized activated carbon prepared by oak shell biowaste and modified with nickel hexacyanoferrate for selective removal of cesium. J. Inorg. Organomet. Polym Mater.. 2019;29(6):1941-1955.
- [Google Scholar]
- Activated carbon derived from tea waste: A promising supporting material for metal nanoparticles used as catalysts in hydrolysis of ammonia borane. Biomass Bioenergy. 2020;138:105589
- [Google Scholar]
- Nitrogen-doped activated carbons derived from a co-polymer for high supercapacitor performance. J. Mater. Chem. A. 2014;2(30):11697-11705.
- [Google Scholar]
- Methylene blue adsorption on magnetic alginate/rice husk bio-composite. Int. J. Biol. Macromol.. 2020;154:104-113.
- [Google Scholar]
- Applicability of the various adsorption models of three dyes adsorption onto activated carbon prepared waste apricot. J. Hazard. Mater.. 2006;135(1–3):232-241.
- [Google Scholar]
- Symmetric supercapacitors based on porous 3D interconnected carbon framework. Electrochim. Acta. 2015;151:386-392.
- [Google Scholar]
- Facile synthesis of three-dimensional heteroatom-doped and hierarchical egg-box-like carbons derived from moringa oleifera branches for high-performance supercapacitors. ACS Appl. Mater. Interfaces. 2016;8(48):33060-33071.
- [Google Scholar]
- On the adsorption and diffusion of Methylene Blue in glass fibers. J. Colloid Interface Sci.. 2005;286(2):807-811.
- [Google Scholar]
- Production of activated carbon from cocoa (Theobroma cacao) pod husk. J. Civil Environ. Engg.. 2012;2(1–6):2.
- [Google Scholar]
- Porosity in Carbons. London: Eduar Arnold; 1995.
- Fuel additive synthesis by acetylation of glycerol using activated carbon/UiO-66 composite materials. Fuel. 2020;281:118584
- [Google Scholar]
- Activated carbon synthesis from tangerine peel and its use in hydrogen storage. J. Energy Inst. 2020
- [Google Scholar]
- Assessment of activated carbon prepared from corncob by chemical activation with phosphoric acid. Water Resour. Ind.. 2014;7–8:66-75.
- [Google Scholar]
- Activated carbons from KOH and H3PO4-activation of olive residues and its application as supercapacitor electrodes. Electrochim. Acta. 2017;229:219-228.
- [Google Scholar]
- Activated carbons from KOH-activation of argan (Argania spinosa) seed shells as supercapacitor electrodes. Bioresour. Technol.. 2012;111:185-190.
- [Google Scholar]
- Preparation of highly porous binderless activated carbon electrodes from fibres of oil palm empty fruit bunches for application in supercapacitors. Bioresour. Technol.. 2013;132:254-261.
- [Google Scholar]
- Preparation and characterization of activated carbon produced from rice straw by (NH4)2HPO4 activation. Bioresour. Technol.. 2011;102(3):3645-3648.
- [Google Scholar]
- Activated carbon from lignocellulosics precursors: A review of the synthesis methods, characterization techniques and applications. Renew. Sustain. Energy Rev.. 2018;82:1393-1414.
- [Google Scholar]
- Determination of the micropore structures of activated carbons by adsorption of various dyestuffs from aqueous solution. Turkish J. Chem.. 2002;26:369-378.
- [Google Scholar]
- Comparative study of calcium alginate, activated carbon, and their composite beads on methylene blue adsorption. Carbohydr. Polym.. 2014;102:192-198.
- [Google Scholar]
- Efficient preparation of biomass-based mesoporous carbons for supercapacitors with both high energy density and high power density. J. Power Sources. 2013;240:109-113.
- [Google Scholar]
- Preparation of capacitor’s electrode from cassava peel waste. Bioresour. Technol.. 2010;101(10):3534-3540.
- [Google Scholar]
- Statistical modeling of methylene blue dye adsorption by high surface area mesoporous activated carbon from bamboo chip using KOH-assisted thermal activation. Energy, Ecology and Environ.. 2020;5(6):456-469.
- [Google Scholar]
- Conversion of Malaysian low-rank coal to mesoporous activated carbon: Structure characterization and adsorption properties. Chin. J. Chem. Eng.. 2019;27(7):1716-1727.
- [Google Scholar]
- Large surface area activated carbon from low-rank coal via microwave-assisted KOH activation for methylene blue adsorption. Desalin. Water Treat.. 2018;110:239-249.
- [Google Scholar]
- Preparation of activated carbon from lignin obtained by straw pulping by KOH and K2CO3 chemical activation. Cellul. Chem. Technol.. 2012;46(1):79.
- [Google Scholar]
- Activated carbons from waste biomass by sulfuric acid activation and their use on methylene blue adsorption. Bioresour. Technol.. 2008;99(14):6214-6222.
- [Google Scholar]
- Removal of hydrogen sulfide from gas streams using porous materials: A review. Ind. Eng. Chem. Res.. 2019;58(49):22133-22164.
- [Google Scholar]
- High-rate electrochemical capacitors based on ordered mesoporous silicon carbide-derived carbon. ACS Nano. 2010;4(3):1337-1344.
- [Google Scholar]
- THE Adsorption of gases on plane surfaces of glass, mica and platinum. J. Am. Chem. Soc.. 1918;40(9):1361-1403.
- [Google Scholar]
- Preparation of capacitor’s electrode from sunflower seed shell. Bioresour. Technol.. 2011;102(2):1118-1123.
- [Google Scholar]
- Dye adsorption of mesoporous activated carbons produced from NaOH-pretreated rice husks. Bioresour. Technol.. 2013;136:437-443.
- [Google Scholar]
- The influence of pH and the structure of the dye molecules on adsorption isotherm modeling using activated carbon. Desalination. 2010;264(1):97-101.
- [Google Scholar]
- Tea waste derived activated carbon for the adsorption of sodium diclofenac from wastewater: adsorbent characteristics, adsorption isotherms, kinetics, and thermodynamics. Environ. Sci. Pollut. Res.. 2018;25(32):32210-32220.
- [Google Scholar]
- Coniferous pine biomass: A novel insight into sustainable carbon materials for supercapacitors electrode. Mater. Chem. Phys.. 2016;182:139-147.
- [Google Scholar]
- Phenol adsorption on high microporous activated carbons prepared from oily sludge: equilibrium, kinetic and thermodynamic studies. Sci. Rep.. 2019;9(1):19352.
- [Google Scholar]
- Development of easy made low cost bindless monolithic electrodes from biomass with controlled properties to be used as electrochemical capacitors. Bioresour. Technol.. 2011;102(3):2781-2787.
- [Google Scholar]
- Preparation and optimization of activated nano-carbon production using physical activation by water steam from agricultural wastes. RSC Adv.. 2020;10(3):1463-1475.
- [Google Scholar]
- Freundlich adsorption isotherms of agricultural by-product-based powdered activated carbons in a geosmin–water system. Bioresour. Technol.. 2002;85(2):131-135.
- [Google Scholar]
- Chestnut oak shells activated carbon: Preparation, characterization and application for Cr (VI) removal from dilute aqueous solutions. J. Cleaner Prod.. 2018;185:554-561.
- [Google Scholar]
- Activated carbons from waste biomass: an alternative use for biodiesel production solid residues. Bioresour. Technol.. 2009;100(5):1786-1792.
- [Google Scholar]
- Synthesis and characterization of activated carbon from biomass date seeds for carbon dioxide adsorption. J. Environ. Chem. Eng.. 2020;8(5):104257
- [Google Scholar]
- Promising activated carbons derived from waste tea-leaves and their application in high performance supercapacitors electrodes. Electrochim. Acta. 2013;87:401-408.
- [Google Scholar]
- Activated carbon obtained from amazonian biomass tailings (acai seed): Modification, characterization, and use for removal of metal ions from water. J. Environ. Manage.. 2020;270:110868
- [Google Scholar]
- KOH-activated carbon developed from biomass waste: adsorption equilibrium, kinetic and thermodynamic studies for Methylene blue uptake. Desalin. Water Treat.. 2016;57(56):27226-27236.
- [Google Scholar]
- Enhanced adsorption capacity of designed bentonite and alginate beads for the effective removal of methylene blue. Appl. Clay Sci.. 2019;169:102-111.
- [Google Scholar]
- Rodríguez Reinoso, F., 1997. Activated Carbon: Structure, characterization, preparation and applications. Introduction to Carbon Technologies, Publicaciones La Univ. Alicant. Alicant., Spain.
- Microstructure and electrochemical double-layer capacitance of carbon electrodes prepared by zinc chloride activation of sugar cane bagasse. J. Power Sources. 2010;195(3):912-918.
- [Google Scholar]
- Nanoporous carbon electrode from waste coffee beans for high performance supercapacitors. Electrochem. Commun.. 2008;10(10):1594-1597.
- [Google Scholar]
- Defatted algal biomass as a non-conventional low-cost adsorbent: surface characterization and methylene blue adsorption characteristics. Bioresour. Technol.. 2015;184:395-404.
- [Google Scholar]
- Optimization of parameters for adsorption of methylene blue on a low-cost activated carbon. J. Chem. Eng. Data. 2010;55(1):435-439.
- [Google Scholar]
- Utilization of new activated carbon derived from oak leaves for removal of crystal violetfrom aqueous solution. Pol. J. Environ. Stud.. 2014;23(6):2223-2232.
- [Google Scholar]
- Three-dimensional hierarchical porous carbon/graphene composites derived from graphene oxide-chitosan hydrogels for high performance supercapacitors. Electrochim. Acta. 2015;171:13-22.
- [Google Scholar]
- Effect of porosity enhancing agents on the electrochemical performance of high-energy ultracapacitor electrodes derived from peanut shell waste. Sci. Rep.. 2019;9(1):13673.
- [Google Scholar]
- Electrochemical characteristics and impedance spectroscopy studies of carbon-carbon supercapacitors. J. Electrochem. Soc.. 2003;150(3):A292.
- [Google Scholar]
- Preparation and characterization of activated carbon from waste biomass. J. Hazard. Mater.. 2009;165(1–3):481-485.
- [Google Scholar]
- High surface area activated carbon from rice husk as a high performance supercapacitor electrode. Electrochim. Acta. 2016;192:110-119.
- [Google Scholar]
- Removal of methylene blue dye and lead ions from aqueous solution using activated carbon from black cumin seeds. S. Afr. J. Chem. Eng.. 2020;33:39-50.
- [Google Scholar]
- Characterization and application of activated carbon produced from oak cups pulp. Jf. Anal. Appl. Pyrol.. 2010;89(1):129-136.
- [Google Scholar]
- Adsorption of acid dye onto activated carbons prepared from agricultural waste bagasse by ZnCl2 activation. Chemosphere. 2001;45(1):51-58.
- [Google Scholar]
- Corn husk derived activated carbon with enhanced electrochemical performance for high-voltage supercapacitors. J. Power Sources. 2020;471:228387
- [Google Scholar]
- Activated carbon with high capacitance prepared by NaOH activation for supercapacitors. Mater. Chem. Phys.. 2010;124(1):504-509.
- [Google Scholar]
- Efficient CO2 Capturer Derived from As-Synthesized MCM-41 Modified with Amine. Chem. – Europ. J.. 2008;14(11):3442-3451.
- [Google Scholar]
- Effect of synthesis methods on the surface and electrochemical characteristics of metal oxide/activated carbon composites for supercapacitor applications. Appl. Surf. Sci.. 2019;469:983-993.
- [Google Scholar]
- Preparation, surface characteristics, and electrochemical double-layer capacitance of KOH-activated carbon aerogels and their O-and N-doped derivatives. J. Power Sour.. 2012;219:80-88.
- [Google Scholar]
- Electrochemical performance of Cu-and Ag-doped carbon aerogels. Mater. Chem. Phys.. 2013;138(2–3):870-876.
- [Google Scholar]
- Preparation of activated carbon from waste Camellia oleifera shell for supercapacitor application. J. Solid State Electrochem.. 2012;16(6):2179-2186.
- [Google Scholar]
- Hydrophilic hierarchical nitrogen-doped carbon nanocages for ultrahigh supercapacitive performance. Adv. Mater.. 2015;27(23):3541-3545.
- [Google Scholar]


