

Translate this page into:
Synthesis of Na2WO4-MnxOy supported on SiO2 or La2O3 as fiber catalysts by electrospinning for oxidative coupling of methane
⁎Corresponding author at: Department of Chemical Engineering, Faculty of Engineering, Kasetsart University, Bangkok 10900, Thailand. fengasn@ku.ac.th (Anusorn Seubsai)
-
Received: ,
Accepted: ,
This article was originally published by Elsevier and was migrated to Scientific Scholar after the change of Publisher.
Peer review under responsibility of King Saud University.
Abstract
The oxidative coupling of methane (OCM) is an attractive route to convert natural gas directly into value-added chemical products (C2+). This work comparatively investigated SiO2- or La2O3-supported Na2WO4-MnxOy (denoted as NWM) catalysts in powder and fiber forms. The powder catalysts were prepared using a co-impregnation method and the fiber catalysts were prepared successfully using an electrospinning technique. The NWM/La2O3 fiber catalysts were activated at low temperature (500 °C) and had a 4.7% C2+ yield, with the maximum C2+ yield of 9.6% at 650 °C, while the NWM/SiO2 fiber catalyst was activated at 650 °C and had a maximum C2+ yield of 20.4% at 700 °C. The XPS results in the O 1s region indicated that NWM/La2O3 had a lower binding energy than NWM/SiO2, suggesting that the lattice oxygen species is easily released from the catalyst surface and creates vacancy sites that enhance performance. The stability test of the catalysts indicated that the La2O3-containing catalysts had excellent activity and high thermal stability, while the SiO2-containing catalysts had a higher C2+ yield when the prepared catalysts were compared at 700 °C. Considering the same component catalysts, the fiber catalysts achieved higher performance because their heat and mass transfer properties were enhanced.
Keywords
Fiber catalyst
La2O3
Na2WO4
Oxidative coupling of methane
SiO2

1 Introduction
Natural gas is a type of hydrocarbon compound, which is formed by the accumulation of fossil microbes from plants and animals for hundreds of millions of years in layers on the earth’s surface (Faramawy et al., 2016). Over time, the fossils can transform into petroleum (oil and natural gas) due to pressure and heat. Natural gas consists of many components with the greatest proportion being methane (CH4). CH4 is one of the six types of greenhouse gases that cause global warming or the greenhouse effect, with a lifetime in the atmosphere of around 10 years (Liu et al., 2019). It causes global warming and generates climate change at levels approximately 25 times greater than carbon dioxide (CO2) when the same amounts of these two gases are released into the atmosphere (Sringam et al., 2020). CH4 is created naturally from biological decomposition processes but also a variety of human activities such as agricultural livestock farming, industry, and waste management. In the USA, it is estimated that human activities are responsible for approximately 50–65% of CH4 emissions (Ciais et al., 2013).
To date, many researchers have tried to convert methane to value-added chemicals such as hydrogen, ammonia, methanol, and ethylene. Various routes of methane conversion to value-added chemicals have been developed recently. The most well-known route that is commercially viable is the indirect conversion of CH4 to synthesis gas or syngas (a mixture of CO and H2), which then can be converted to methanol and olefins via a methanol-to-olefin reaction (called methanol-to-olefins) (Huang et al., 2018). The non-oxidative coupling of CH4 to C2H6 using photo-catalysts has also recently become an attractive route (Chen et al., 2021; Levin et al., 2020). The oxidative coupling of methane (OCM) is another direct route to convert methane to higher hydrocarbons such as ethylene and ethane (Gambo et al., 2018; Sringam et al., 2020). It involves a direct reaction between CH4 and O2 over a catalyst to form C2+ hydrocarbons (C2H4, C2H6, C3H6, C3H8, etc.), water, and heat. The OCM reactions for the formation of C2H4 and C2H6 are shown in equations (1) and (2), respectively (Hayek et al., 2019) :
The mechanism of the OCM reaction can be generally explained as follows. First, CH4 molecules interact with an adsorbed oxygen on a catalyst surface and generate *CH3 radicals. Subsequently, two *CH3 radicals combine into ethane (C2H6) in the gas phase and then, ethylene (C2H4) can be generated by dehydrogenation. The adsorbed oxygen species with the abstracted hydrogen atom then transform to H2O. Afterward, O2 molecules from the gas phase replace the vacancy sites and create active oxygen species, which subsequently proceed to the next cycle (Fleischer et al., 2016; Gambo, et al., 2018). However, the OCM reaction can create CO and CO2 as side products. Alternatively, O2 can be replaced by other, more mildly oxidant gaseous reagents, such as N2O, CO2, and S2 (Arinaga et al., 2021). This is also an effective method for selectively producing C2+. Currently, the OCM process has yet to be made viable for industrial uses because of the lack of highly efficient catalysts (Fleischer, et al., 2016; Gambo, et al., 2018). Recent studies have shown that the economic feasibility of the OCM reaction using heterogeneous catalysts requires a product yield of high-value products (such as C2H4 and C3H6 = C2+) of over 30% (Karakaya et al., 2018) or a C2+ selectivity of at least 80% with CH4 conversion of at least 30% (Chukeaw et al., 2021; Hayek, et al., 2019).
Over the past decades, many researchers have investigated various metal oxides as catalysts for the OCM reaction, including i) alkaline earth oxides (Elkins et al., 2016; Lim et al., 2020), ii) transition metal oxides (Chukeaw et al., 2019; Yunarti et al., 2014), and iii) alkaline earth, transition, and rare earth oxide-based catalysts doped with another alkali, alkaline earth, and rare earth cations (Gu et al., 2018; Jones et al., 2020; Kidamorn et al., 2020; Liu et al., 2017; Ortiz-Bravo et al., 2021a; Sringam et al., 2020). Among the active catalysts, Mn/Na2WO4/SiO2-containing (denoted as NWMSi) catalysts are promising for industrial use. They provide high C2+ yields at approximately 1.3–29.0 % with 24–80% C2+ selectivity in a reaction temperature range of 800–825 °C (see Table S1). However, some reports showed that the NWMSi catalysts still deactivate with time on stream due to sintering and a loss of active Na2WO4 content at high temperatures (Hayek et al., 2019; Kidamorn, et al., 2020; Sringam et al., 2020).
Various catalyst supports have been investigated in the OCM reaction, such as La2O3, CaO, Al2O3, ZrO2, SiO2, SiC, TiO2, and Fe2O3. The SiO2 support is widely used in OCM because it has a high specific surface area that can provide well-dispersed active components (Hayek et al., 2019). In the OCM reaction, the SiO2 support transforms to the α-cristobalite phase when adding Na, W, and Mn oxides as the active components. Although the NWMSi catalysts exhibit high performance, they have a low surface area (<10 m2 g−1) (Chukeaw et al., 2019; Kidamorn et al., 2020) and poor thermal stability with time-on-stream experiments (Chukeaw et al., 2019), while also requiring a high temperature to be activated (greater than700 °C) (Xu et al., 2018). Bare La2O3 is active for an OCM reaction by itself at a temperature around 600 °C (Jiang et al., 2016), which is more advantageous compared to the SiO2 support. Furthermore, La2O3 has a large capacity for oxygen and various lattice oxygens that benefit the CH4 activation for the formation of ethane and ethylene. In addition, La2O3 contains moderately basic sites that can improve performance (Huang et al., 2013; Jiang et al., 2016; Wang et al., 2019; Xu et al., 2019). Several La2O3-based catalysts are shown in Table S2. Other supports such as CaO, Al2O3, and ZrO2 that were investigated with Na2WO4-MnxOy had similar C2+ yields to the SiO2 support, but those supports provided a much lower C2+ selectivity (Yildiz et al., 2014). Thus, catalysts using SiO2 and La2O3 as catalyst supports are still excellent candidates in the OCM reaction.
Most catalysts in the OCM reaction are in the form of powder and are used in a fixed bed reactor, which has a high-pressure drop, poor heat and mass transfer, and causes catalyst sintering. Recently, nanofibers have gained much attention worldwide (Barhoum et al., 2019). There have been interesting studies based on their unique properties such as high tensile strength and high surface area and porosity (Barhoum et al., 2019; Thenmozhi et al., 2017). Nanofibers can be used for various applications in many fields such as electronics, energy storage cells, fuel cells (Kallem et al., 2018), catalysis (Noon et al., 2013; Qin et al., 2014; Sollier et al., 2020), and filtering membranes (Lee et al., 2019). The nanofiber catalysts based on CeO2-La2O3 and Sr-La-Ce have been investigated in an OCM reaction (Noon et al., 2013; Sollier et al., 2020). The results indicated that the nanofibers performed better than the powder catalysts at low temperatures (600 °C) in the OCM reaction because the nanofibers provided benefits from their high heat and mass transfer properties.
Previous reports showed that nanofiber catalysts could be promising in OCM reactions. Additionally, catalysts containing Na2WO4-MnxOy/SiO2 provide high C2+ formation relative to other metal oxides (Chukeaw et al., 2019; Kiani et al., 2019) and La2O3-containing catalysts exhibit low temperature (approximately 500 °C) for CH4 activation relative to Na2WO4-MnxOy-containing catalysts (Song et al., 2015). Nevertheless, the performance of Na2WO4-MnxOy supported on SiO2 or La2O3 in the forms of powder and fiber has never been investigated comparatively. Therefore, the current work prepared and tested Na2WO4-MnxOy supported on either SiO2 or La2O3 in both powder and fiber forms for the OCM reaction. This study aimed to show the effect of catalyst structure on the OCM performance and whether the activity of Na2WO4-MnxOy/La2O3 could compete with Na2WO4-MnxOy/SiO2. The catalysts in the forms of powder and fiber were prepared using co-impregnation and electrospinning techniques. Various characterization techniques were carried out to analyze the physical and chemical properties of the prepared catalyst and then the information was correlated with the activity results.
2 Materials and methods
2.1 Preparation of catalysts
2.1.1 Precursor materials
The following materials were used: sodium tungsten dihydrate (Na2WO4·2H2O, 98.0–101.0%, Daejung), manganese (II) nitrate tetrahydrate (Mn(NO3)2·4H2O, Chem-supply), lanthanum (III) nitrate hexahydrate (La(NO3)3·6H2O, HIMEDIA), amorphous fumed SiO2 (surface area 85–115 m2/g, Alfa Aesar), ethanol (C2H5OH, 99.9%, QREC), tetraethyl orthosilicate (Si(OC2H5)4, TEOS, 99.0%, Aldrich), hydrochloric acid (HCl, QREC), acetic acid glacial (CH3COOH, QREC), polyvinylpyrrolidone (PVP, MW of 1,300,000, Aldrich), and deionized (DI) water. All chemicals were used without purification.
2.1.2 Preparation of Na2WO4-MnxOy/SiO2 fibers and powder
The Na2WO4-MnxOy/SiO2 fibers were prepared using an electrospinning method (Zong et al., 2015). PVP (3.0 g), TEOS (3.0 g), Na2WO4·2H2O (65.35 mg), and Mn (NO3)2·4H2O (175.69 mg) were mixed and dissolved in ethanol (38 mL), followed by stirring for 2 h at room temperature. A small amount of HCl solution (4.11 M, 2.0 mL) was added dropwise into the solution for the hydrolysis of TEOS. The solution was stirred for 12 h at room temperature and then transferred into a 20 mL plastic syringe fitted with a blunt-ended stainless-steel needle. A high voltage power supply was used for the electrospinning process and the fiber collector was covered with aluminum foil. The distance between the collector and the tip of the needle was 15 cm. The voltage (20 kV) was applied to the needle and the solution feeding rate was 2.0 mL h−1, which was controlled by a syringe pump (NE-300, Era Pump Systems). The fibers were calcined at 800 °C for 4 h using an air furnace with a heating rate of 0.5 °C min−1 to completely remove the organic components in the fibers. This slow heating rate (0.5 °C min−1) was used because the catalyst might not retain its fiber if the decomposition of PVP was too fast. Finally, the air furnace was naturally cooled to room temperature. The Na2WO4-MnxOy/SiO2 fibers were obtained and used in the activity test.
The Na2WO4-MnxOy/SiO2 powder catalyst was prepared using a co-impregnation method. Following our previous work’s our optimum ratio of Na2WO4:MnxOy on SiO2 (Chukeaw et al., 2019), the weight percentages (wt%) of Na2WO4 and MnxOy were selected for inclusion in the final catalyst using the fume SiO2 as the support at 6% and 4%, respectively. For example, the preparation of 100 mg of 6 wt% Na2WO4 + 4 wt% MnxOy on the SiO2 support was as follows. The Na2WO4·2H2O and Mn (NO3)2·4H2O precursors were dissolved in deionized water to make concentrations of 0.64 and 1.44 M, respectively. The Na2WO4·2H2O solution at 34.8 µL and the Mn (NO3)2·4H2O at 50.7 µL were pipetted onto the SiO2 support (90 mg). The mixture was stirred at room temperature for 2 h and dried at 100 °C for 2 h or until dry. The dried powder was calcined using the same conditions as the Na2WO4-MnxOy/SiO2 fibers, except that the heating rate used was 5 °C min−1. The Na2WO4-MnxOy/SiO2 powder catalyst was obtained and used in the activity test. A SiO2 bare support was prepared in parallel with the Na2WO4-MnxOy/SiO2 powder using the fumed silica without the addition of active metals.
2.1.3 Preparation of Na2WO4-MnxOy/La2O3 fibers and powder
The Na2WO4-MnxOy/La2O3 fibers were prepared using the electrospinning method, with a slightly different procedure for that in section 2.1.2. The weight percentages of Na2WO4 at 6% and MnxOy at 4% supported on La2O3 were selected for inclusion in the final catalyst. First, a mixture of ethanol (1 mL) and acetic acid (1 mL) was mixed and stirred for 1 h, denoted as Solution (A). Meanwhile, PVP (1.32 g) was mixed with ethanol (5 mL) and stirred for 2 h at room temperature until the solution was well mixed, denoted as Solution (B). Then, Solution (A) was added dropwise to Solution (B) with stirring for 6 h until a sol–gel precursor solution was obtained. After that, the Na2WO4-MnxOy/La2O3 fiber was prepared using the parameters: solution feeding rate of 0.4 mL h−1, setting voltage of 16 kV, calcination temperature of 625 °C, and heating rate of 2 °C min−1.
The Na2WO4-MnxOy/La2O3 powder was also prepared using the co-impregnation method and based on a similar preparation to that of the Na2WO4-MnxOy/SiO2 powder in section 2.1.2, except (La(NO3)3·6H2O (0.28 g) was used instead of the fumed SiO2, the calcination temperature was 625 °C, and the heating rate was 5 °C min−1. Notably, according to the thermogravimetric analysis (TGA) of the prepared catalysts (see Figure S1), all the PVP and impurities were completely decomposed at a temperature below 625 °C. In parallel, a La2O3 bare support was prepared, as was the previously mentioned SiO2 bare support, using (La(NO3)3·6H2O without the addition of active metals.
2.2 Testing activity of catalysts
All the prepared catalysts were tested for the OCM reaction using a plug flow reactor at atmospheric pressure. Each sample (50 mg) was packed in the middle of a quartz tube reactor (0.5 cm inner diameter and 40 cm length) and sandwiched between two layers of quartz wool. The feed gas consisted of CH4 (99.999%, Praxair), O2 (99.999% Linde), and N2 (99.999%, LABGAZ) with a gas ratio of CH4: O2: N2 equal to 3:1:4—CH4 and O2 are the reactant gases and N2 is the carrier gas—and a total feed flow rate of 35 mL min−1. All the feed flow rates were controlled using mass flow controllers (Aalborg GFC17S). The reactor temperatures were in a range of 450–750 °C. The effluent gases were analyzed using online gas chromatography (GC, Shimadzu, GC-14A). An Unibead C column connected to a thermal conductivity detector (TCD) was used to determine CO, CO2, and CH4. A Porapak Q column connected to a flame ionization detector (FID) was used to analyze C2H4, C2H6, C3H6, C3H8, C4H8, and C4H10. An example of a GC chromatogram is shown in Figure S2. The activity of each catalyst was analyzed after the reactor system had reached the set point for 1 h. To quantify each gaseous product, a standard calibration curve of the gas with a coefficient of determination (R2) greater than 0.99 was made using five points of the gas concentration. The catalyst activity was reported in terms of % CH4 conversion, % C2+ selectivity, % COx selectivity, % C2+ yield, and olefin-to-paraffin ratio, which were calculated using equations (3)–(7), respectively:
Thus, the data were reported as an average value with an error value of each catalyst, based on at least three repeats of each experiment. An example of carbon balance checks is shown in Figure S3 and Table S3. Note that the activity of each catalyst was presented in terms of the values obtained from equations (3)–(7). The amounts of H2O, H2, N2, and O2 were, therefore, not collected in every test.
2.3 Characterization of catalysts
TGA was used to evaluate the thermostability of each sample using a thermogravimetric analyzer (model TGA/SDTA 851e, Mettler Toledo, USA). To determine the content of moisture and organic compounds, the measurement for the thermal analysis was carried out over a range from 30 to 900 °C at a heating rate of 10 °C min−1 in N2 gas (50 mL min−1).
An X-ray diffractometer (XRD; JEOL JDX-3530 and Philips X-Pert, using Cu- radiation at 45 kV and 40 mA with a step size of 0.02° and a step time of 0.5 s) was used to identify the crystalline phases of the prepared catalysts.
A nitrogen adsorption–desorption analyzer (3Flex Physisorption Micrometrics) was used to determine the surface areas, pore sizes, and pore volumes of the catalysts at −196 °C. The average specific surface area of each catalyst was calculated using the Brunauer-Emmett-Teller (BET) method in a range of P/P0 values of 0.05–0.30. The pore size distribution of each catalyst was determined using the Barrett-Joyner-Halenda method. The total pore volume was estimated at a relative pressure (P/P0) of 0.995.
A scanning electron microscope with an energy dispersive X-ray spectrometer (SEM/EDS; JEOL, JSM7600 F) was used to investigate the surface morphology and the distribution of metals on the surface of the catalysts.
A high angle annular dark-field scanning transmission electron microscope and energy dispersive X-ray spectrometer (HAADF-STEM/EDS; JEOL, JEM-2010) were used to investigate element dispersion at an atomic scale. The transmission electron microscopy imaging was operated at 200 kV. The sample for measurement was prepared by dispersing the catalyst in ethanol solution for 30 min, and then dropping the dispersant onto a copper grid and drying it in air at room temperature.
An X-ray photoelectron spectrometer (XPS; Kratos Axis Ultra DLD, using Al Kα for the X-ray source) was used to determine the elemental composition of the catalysts and the binding energy of each element in the catalysts. The binding energy of C 1s was used to standardize all binding energies.
3 Results and discussion
3.1 XRD analysis of catalysts
The Na2WO4-MnxOy/SiO2 and Na2WO4-MnxOy/La2O3 fibers (denoted as NWMSi-F and NWMLa-F, respectively) and powders (denoted as NWMSi-P and NWMLa-P, respectively) were synthesized and tested for OCM reaction under the same conditions. The XRD patterns of the NWMSi and NWMLa are presented in Fig. 1 and their peak positions of each catalyst are shown in Table S4. In Fig. 1(a), the crystallinity of NWMSi-F was virtually the same as NWMSi-P. Furthermore, the characteristic peak of α-cristobalite (ICDD No. 00–001-0438)) appeared in both NWMSi-P and NWMSi-F. This confirmed that the α-cristobalite phase occurs at low calcination temperature (800 °C) due to the presence of Na (Kiani et al., 2019; Kidamorn et al., 2020) so that the amorphous SiO2 phase can transform to the α-cristobalite phase at a lower calcination temperature than the usual temperature (∼1500 °C) (Kim and McIntyre, 2002; Yildiz et al., 2014). Additionally, small peaks of α-tridymite and Mn2O3 were observed in both NWMSi-P and NWMSi-F. Note that it was speculated that the XRD peak at 2θ of approximately 33° could be identified as Mn2O3 and Mn7SiO12. But in accordance with data concerning similar catalysts in the literature, its Raman spectrum indicated that this XRD peak should be assigned to the crystalline Mn2O3 phase (Ortiz-Bravo et al., 2021b). The characteristic peak of Na2WO4 also appeared in both NWMSi-P and NWMSi-F. In Fig. 1(b), the characteristic XRD peaks of La2O3, La(MnO3), and La(OH)3 are apparent in both NWMnLa-P and NWMnLa-F. The characteristic XRD peaks of Na2WO4 and Mn2O3 could not be observed, probably due to the high dispersion of small Na2WO4 particles in the fibers. The crystallinity of NWMLa-F seemed to be lower than that of NWMLa-P, which could be the effect of the high dispersion of active metals in the fiber catalysts (see more detail in HAADF-STEM images in Fig. 4. Notably, the small peaks of the La(OH)3 phase were also observed because the La2O3 phase could interact with moisture in the air and transform into the La(OH)3 phase (Nguyen et al., 2014) before the XRD measurement.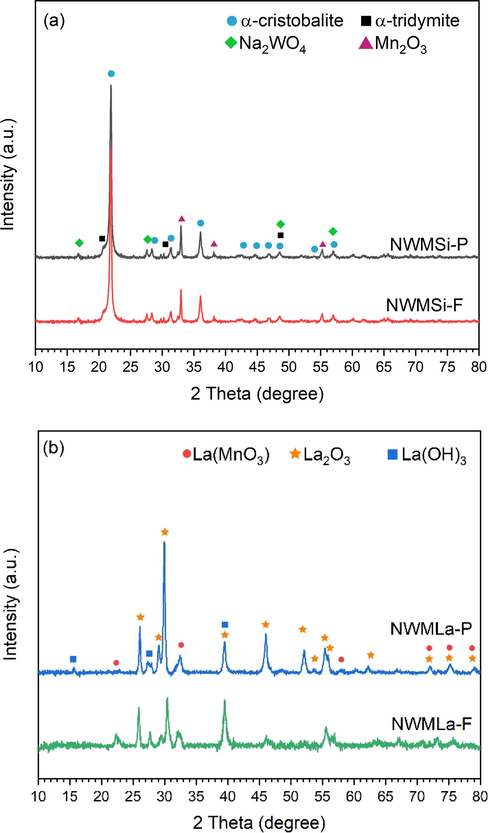
XRD patterns of fresh (a) NWMSi and (b) NWMLa in powder and fiber forms.
3.2 N2 adsorption–desorption analysis of catalysts
The NWMSi and NWMLa in both powder and fiber forms were determined for their BET surface area, pore size, and pore volume using the N2 adsorption–desorption analyzer. The results are shown in Table 1 and Fig. 2 and the plots of their pore size distribution are displayed in Figure S4. The pure Si and La in the forms of both powder and fiber were characterized using the same technique to compare the results with those catalysts. As seen in Table 1, the addition of NWM on either the Si or La support resulted in a decreased BET surface area. However, the addition of NWM on the Si support produced a much greater reduction of the BET surface area relative to the La support probably because the amorphous SiO2 phase had converted to the α-cristobalite phase that normally has a low BET surface area (<10 m2 g−1). All the catalysts in both powder and fiber forms had a BET surface area in the range 3.9–8.5 m2 g−1. Additionally, the pore volume of every sample was relatively low, indicating that every sample had a small number of intraparticle pores. Consequently, the pore size of every sample could have been the size between particles (the interparticle pore size).
Catalyst
BET Surface area
(m2 g−1)Pore-volume
(cm3 g−1)Pore size
(nm)
Si-P
79.7
0.23
1.4
Si-F
20.6
0.01
1.4
NWMSi-P
4.5
0.01
1.5
NWMSi-F
3.9
0.01
2.7
La-P
9.7
0.05
1.4
La-F
10.4
0.06
1.2
NWMLa-P
7.0
0.04
1.2
NWMLa-F
8.5
0.04
8.6
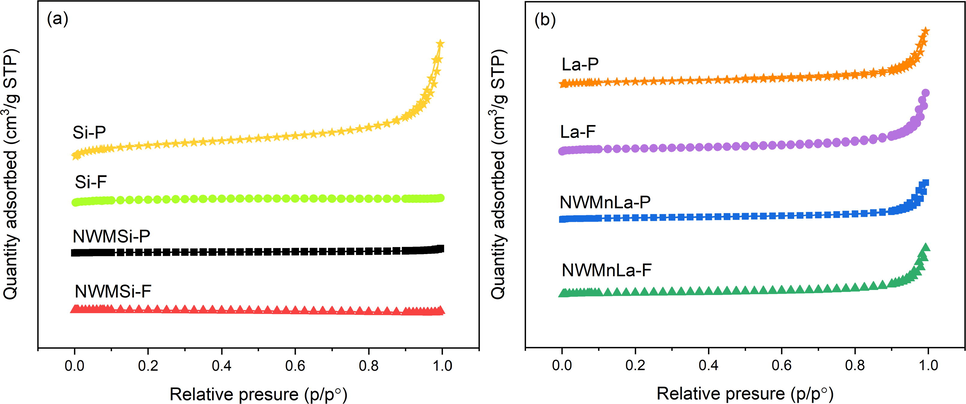
N2 adsorption–desorption isotherm of fresh (a) Si-based and (b) La-based catalysts.
The adsorption–desorption behavior of N2 adsorbed onto the surface of the fresh Si-based and La-based catalysts are displayed in Fig. 2(a) and 2(b), respectively, in terms of the plots between the quantity of N2 adsorbed and the relative pressure (P/P0). In both Fig. 2(a) and 2(b), the adsorption–desorption isotherms of all the catalysts could be classified into Type IV with an H3 hysteresis loop according to the International Union of Pure and Applied Chemistry classification (Alothman, 2012), indicating that the catalytic materials had a mesoporous structure and a wide pore size distribution. However, among the catalysts in Fig. 2(a), Si-P had a greater amount of N2 adsorbed onto its surface relative to the others perhaps because it had a much greater BET surface area than the others. Furthermore, the hysteresis loops of Si-F, NWMSi-P, and NWMSi-F were barely observed, implying that these catalysts had been almost transformed into nonporous material.
3.3 Surface morphology and elemental distribution of catalysts
The surface characteristics of each catalyst analyzed using SEM are shown in Fig. 3. Fig. 3(a)–(d) show the surface morphology of powder catalysts that were prepared using the co-impregnation method. Comparing the Si-P and NWMSi-P catalysts as shown in Fig. 3(a)–(b), respectively, it was clear that the addition of NWM into the SiO2 support increased the particle size of catalysts, and thus the BET surface area of NWMSi-P was largely reduced, as previously shown in Table 1. For La-P and NWMLa-P as shown in Fig. 3(c) and 3(d), respectively, the addition of NWM into the pure La powder resulted in a small change in the surface appearance of NWMLa-P; there seemed to be more agglomeration of particles in NWMLa-P than in La-P. Thus, the BET surface area of NWMLa-P was less than for La-P, consistent with the results in Table 1.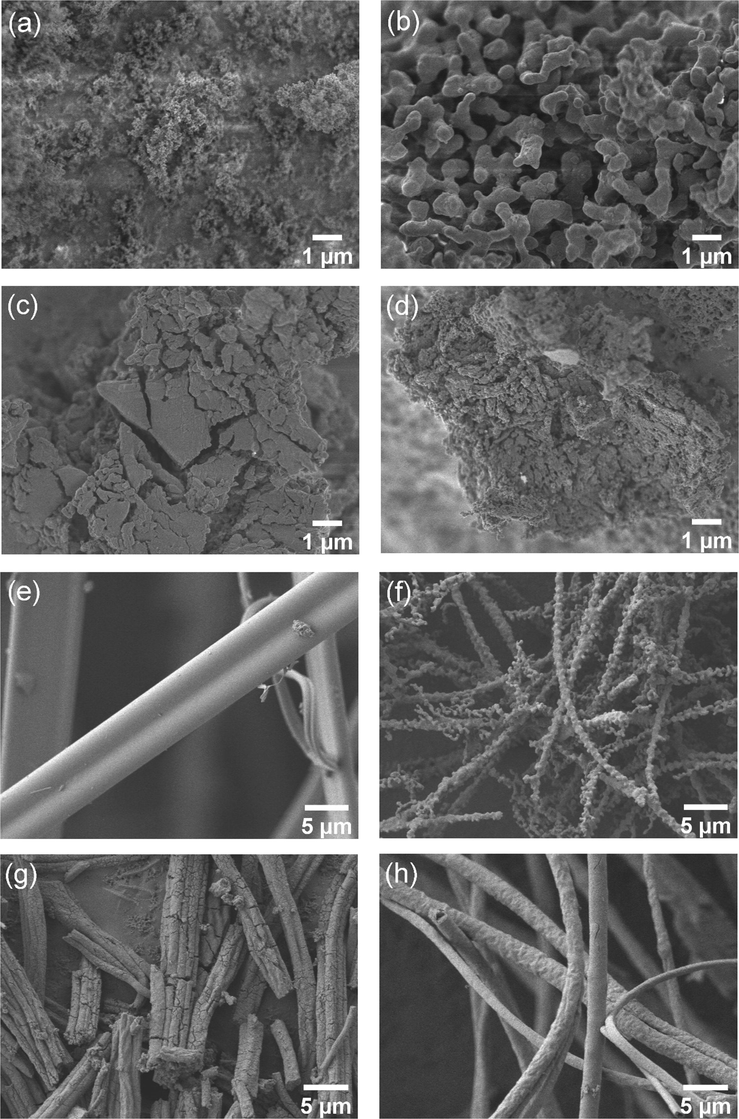
SEM micrographs of (a) Si-P, (b) NWMSi-P, (c) La-P, d) NWMLa-P, (e) Si-F, (f) NWMSi-F, (g) La-F, and (h) NWMLa-F.
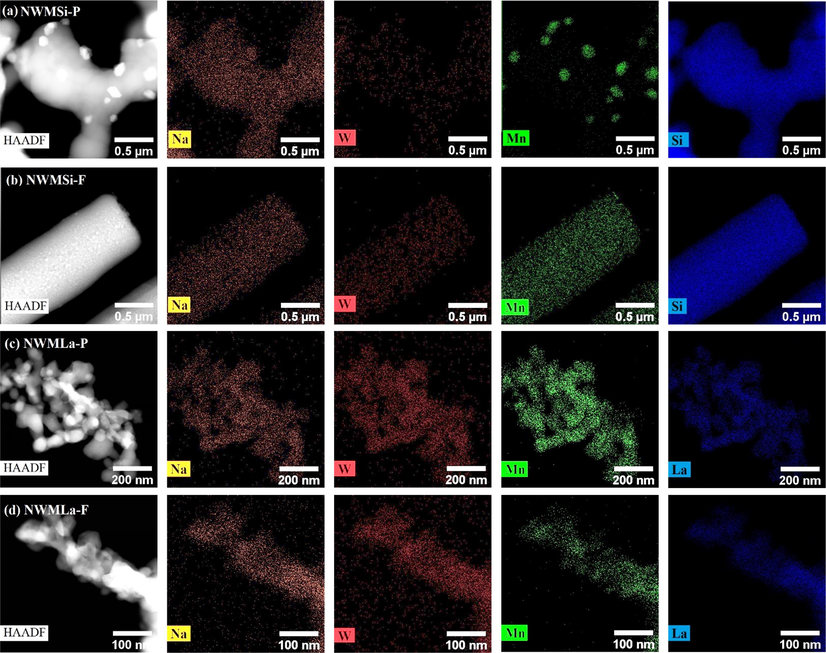
Elemental distribution analysis of NWMSi-P, NWMSi-F, NWMLa-P, and NWMLa-F recorded by HAADF-STEM with EDS.
Fig. 3(e)–(h) show the surface morphology of fiber catalysts prepared using the electrospinning method. As observed, the catalysts in the fiber form were successfully prepared. As shown in Fig. 3(e), Si-F has long rod fibers (approximately 6.8 µm in diameter) with a smooth surface. However, NWMSi-F, as shown in Fig. 3(f), has long fibers with a much smaller diameter (approximately 0.9 µm in diameter) and a rough surface. This rough surface could be due to the presence of Na and the transformation of amorphous SiO2 to α-cristobalite. Fig. 3(g) and 3(h) illustrate the fibers of pure La (La-F) and the addition of NWM into La (NWMLa-F), respectively, with a lot of cracks on the surface and body of La-F, with no cracking on the surface of NWMLa-F that had a non-smooth surface. This led to the overall length of La-F being shorter than for NWMLa-F and thus, the BET surface area of La-F was slightly larger than for NWMLa-F, as previously shown in Table 1. Nevertheless, the average diameter sizes of La-F and NWMLa-F were approximately the same at 1.5 µm, suggesting that the addition of NWM into Si had a greater effect on the diameter size of the fibers relative to adding NWM into La.
The elemental distribution of selected catalysts was investigated using HAADF-STEM with EDX, as shown in Fig. 4. Much lower color spots (i.e. low concentrations) of the active elements (Na, W, and M) relative to those for the elements (La and Si) of the supports are observed in every catalyst since the total metal loading is only 10 wt% on each support. Nonetheless, Uniform dispersions of Na and W can be observed in every catalyst. The Mn is also well-distributed in every catalyst except for the NWMSi-P, in which some large particle clusters of Mn are observed. This may suggest that the overall distribution of the elements in the catalysts prepared in the fiber form (NWMSi-F and NWMLa-F) is better than those in the powder form.
3.4 Performance of catalysts
All the prepared catalysts were tested for the OCM reaction in the temperature range 400–750 °C and the results are shown in Fig. 5. The catalytic performances of Si-F and Si-P (see Fig. 5(a)) were much lower relatively compared to the catalysts with the presence of the active metals (Na2WO4 and MnxOy). The highest C2+ yields of Si-F and Si-P were obtained at 4.0% (32.8% C2+ selectivity with 12.2% CH4 conversion) and 2.7% (27.6% C2+ selectivity with 9.7% CH4 conversion) at 750 °C, respectively. NWMSi-P had the highest C2+ yield at 17.9% with 33.8% CH4 conversion and 53.0 % C2+ selectivity at 750 °C, as shown in Fig. 5(b), indicating that the addition of Na, W, or Mn on SiO2 improved the overall activity for C2+ formation. When the same catalyst was in the form of fiber (NWMSi-F), the C2+ yield increased even more from 2.1 to 7.6% and 17.3 to 20.4% at 650 and 700 °C, respectively. Notably, the NWMSi catalysts in either form did not show any product when the reactor temperature was below 600 °C.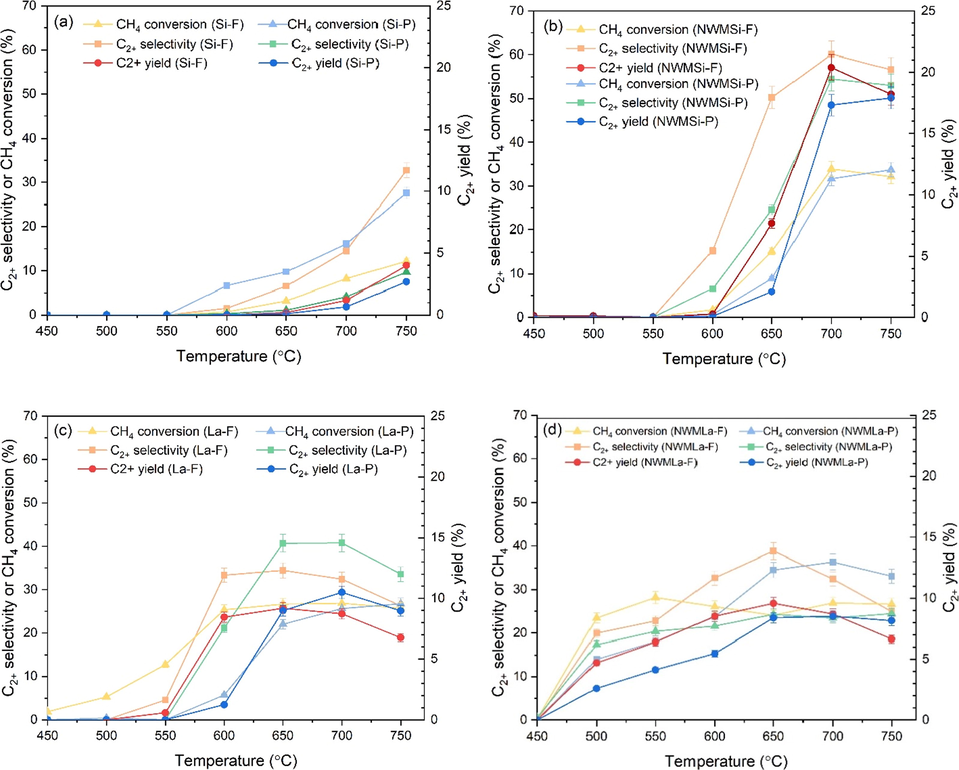
OCM reaction performance of different catalysts in fiber and powder forms: (a) Si, (b) NWMSi, (c) La, (d) NWMLa. Reaction conditions: 50 mg catalysts under 35 mL min−1 and feed gas ratio of CH4:O2:N2 of 3:1:4.
The performance of La-F and La-P is shown in Fig. 5(c). The highest C2+ yields of La-F and La-P were 9.2% (34.4% C2+ selectivity with 26.7% CH4 conversion) at 650 °C and 10.5% (40.8% C2+ selectivity 25.7% CH4 conversion) at 700 °C, respectively. The addition of NWM into the La support provided the highest C2+ yield of 8.5% (36.3% C2+ selectivity with 23.4% CH4 conversion) at 700 °C when the catalyst was in the form of powder, and 9.6% (38.9% C2+ selectivity with 24.1% CH4 conversion) at 650 °C when the catalyst was in the form of fiber, as shown in Fig. 5(d). In fact, these C2+ yields for NWMLa-P and NWMLa-F at 700 °C were slightly lower than for La-P and La-F at 700 °C, indicating that the addition of NWM did not improve the overall activity for C2+ formation. Nevertheless, the activation temperatures for both NWMLa-P and NWMLa-F were lower than those for La-F and La-P at approximately 100 °C, indicating that the addition of NWM into La benefited by reducing the activation temperature of CH4. In Fig. 5(d), the activation temperature of NWMLa-F started at 500 °C, the same as for the powder form. Nonetheless, comparing the results for the same testing conditions, the production of C2+ by NWMLa-F was greater than that of NWMLa-P, indicating that the activity of the catalyst in the fiber form was advantageous relative to the powder form. This excellent performance of the fiber catalysts could be ascribed to the excellent heat and mass transfer properties of the catalytic fibers compared to the powder ones (Sollier et al., 2020). In other words, the heat removal in the fiber catalysts is better than that in the powder catalysts (Chai et al., 2017; Zhao et al., 2011) and the products may diffuse out from the fiber catalyst bed easier than the powder one (Matatov-Meytal and Sheintuch, 2002). Notably, the activities (C2+ selectivity, CH4 conversion, and C2+ yield) of the catalysts in Fig. 5 (b), (c), and (d) gradually decreased or minimally changed after passing the highest CH4 conversion (at approximately 30%). That is because the highest CH4 conversion obtained is when the oxygen in the feed is completely consumed, as indicated by the GC chromatograms. At that point, the activities cannot further increase, but they may decrease if the C2+ product can react with some active species (e.g. *OH radical) and produce undesirable COx (Karakaya et al., 2018; Kidamorn et al., 2020).
3.5 Olefin-to-paraffin ratios of catalysts
Based on the OCM mechanism, it is generally known that the activation of CH4 creates *CH3 radicals before proceeding to form the C2+ products. Therefore, one factor in an effective catalyst in OCM reaction is the catalyst ability for dehydrogenation, which can be specified using the olefins-to-paraffins ratio. The results from Fig. 5 were re-plotted in terms of the olefins-to-paraffins ratio, as shown in Fig. 6 and Table S5. In Fig. 6(a), NWMSi-F provided the highest ratio at every temperature above 550 °C, followed by NWMSi-P, Si-F, and Si-P, respectively. In Fig. 5(b), NWMLa-F had the highest C2+ yield among the La-containing catalysts with olefins-to-paraffins ratios in the range 0.7–1.2, similar to the other La-containing catalysts in the temperature range 600–700 °C. At 750 °C, NWMLa-P and La-P achieved relatively high olefins-to-paraffins ratios (1.8–4.2) compared to the other La-containing catalysts in the fiber form. Nevertheless, the highest olefins-to-paraffins ratio among all the prepared catalysts was for NWMSi-F at 6.4 at 750 °C; this catalyst also had excellent C2+ activity relative to the others at 700–750 °C. However, its C2+ activity was not apparent at low temperatures (500–600 °C), unlike the La-containing catalysts.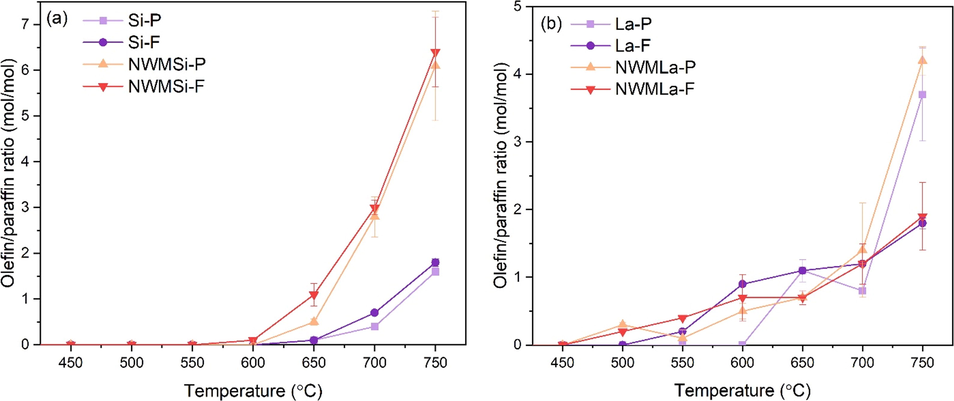
Olefin-to-paraffin ratio versus reactor temperature of (a) Si-based and (b) La-based catalysts.
3.6 Surface oxygen property analysis using XPS
In the OCM reaction mechanism, it is known that the CH4 molecule is activated by the surface lattice oxygen species. Thus, the type of oxygen species on the catalyst surface is essential for the activation of CH4 (Kwon et al., 2021; Sim et al., 2020; Xu et al., 2019). Therefore, the surface oxygen species of the catalysts (see Fig. 7) were investigated using XPS. The binding energies of specific species are summarized in Table S6. It is important to note that the y-axes between Fig. 7 (a) and (b) are plotted on a different scale (see the relative XPS peak area of each species for clarification in Table S7). The XPS spectra of Na, W, and Mn are shown in Figure S5. As shown in Fig. 7(a), Si-F had three main peaks at 535.0, 533.3, and 531.3 eV, corresponding to the superoxide oxygen (
) (Sollier et al., 2020; Xu et al., 2019), Si—O (C.D. Wagner et al., 1982; Larina et al., 2015), and lattice oxygen (O2–) (Ramana et al., 2011), respectively. NWMSi-F had five main peaks at 534.7, 533.8, 532.8, 531.3, and 529.7 eV, corresponding to Na—O—W (Dadachova et al., 1995),
, Si—O, O2–, and Mn—O (Yang et al., 2015), respectively. The binding energy of Si—O in NWMSi-F was considerably changed to a lower energy (532.8 eV) compared to that of Si-F because the SiO2 component in Si-F is amorphous, while the SiO2 component in NWMSi-F is α-cristobalite. In Fig. 7(b), La-F presented three main peaks, including the approximated peaks at 532.6 eV assigned to
(Huang et al., 2013), 531.5 related to oxygen atoms of hydroxyl and carbonate groups (Huang et al., 2013; Ramana et al., 2011), and 529.1 eV assigned to the lattice oxygen (O2–) in La2O3 (Huang et al., 2013; Li et al., 2019; Ramana et al., 2011). NWMLa-F had five main peaks at 534.5, 532.9, 531.7, 530.7, and 529.2 eV, indicating the presence of oxygen species of Na—O—W,
, O2–, Mn—O, and La—O, respectively. The surface lattice oxygen (O2–) led to the formation of COx by the complete oxidation of methane (Huang et al., 2013; Jiang et al., 2016; Song et al., 2015; Xu et al., 2018; Xu et al., 2019). In comparison, the peak area of O2– in La-F was greater than that of NWMLa-F, corresponding to the COx selectivity of La-F that was greater than for NWMLa-F, as shown in Fig. 5(c) and Fig. 5(d). The surface-adsorbed oxygen species (
have been claimed as active sites promoting C—H activation (i.e. increase CH4 conversion) in the OCM reaction (Schwach et al., 2017; Sollier et al., 2020; Xu et al., 2019). Based on the XPS data in Fig. 7 and the XPS peak area in Table S7, the peak area of
in NWMLa-F was lower than for the NWMSi-F catalyst, corresponding to the CH4 conversion of NWMLa-F being lower than for the NWMSi-F catalyst. Notably, the peak area of the oxygen of Na—O—W in NWMLa-F was lower than for NWMSi-F; this was directly related to the amount of CH4 conversion, confirming that the oxygen in Na—O—W was important for the activation of CH4.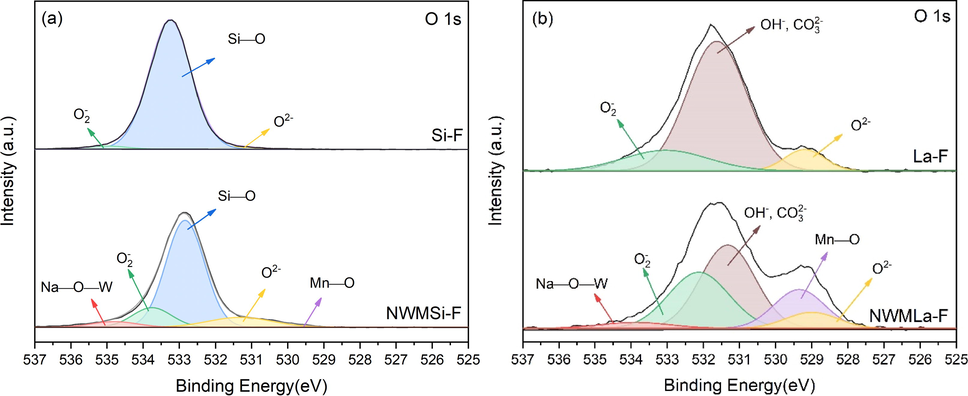
XPS O 1s spectra of (a) Si-F and NWMSi-F and (b) La-F and NWMSi-F catalysts.
3.7 Stability test of catalysts
A time-on-stream experiment over 24 h of each catalyst at its optimal conditions was carried out and the activity results (CH4 conversion, C2+ selectivity, and C2+ yield) are shown in Fig. 8. The performance of NWMSi-P constantly increased to a maximum of 18.4% C2+ yield with 53.3% C2+ selectivity and 34.5% CH4 conversion after 4 h of testing. After that, it slightly decreased to 17.5 % C2+ yield with 55.7% C2+ selectivity and 31.4% CH4 conversion until the end of testing, decreasing by 28.7% in terms of C2+ yield. In contrast, the activity of NWMSi-F was good with an almost constant C2+ yield of 18.2–19.7 % (55.0–55.2% C2+ selectivity and 32.2–35.6 % CH4 conversion), which was a reduction in the C2+ yield of approximately 8.6% over the testing period. The C2+ yields for NWMLa-P and NWMLa-F were similar, being maintained at approximately 7.7 and 8.7%, respectively, while their C2+ yield reductions were relatively low at approximately 12 and 11.5%, respectively, compared to the activity of NWMSi-P.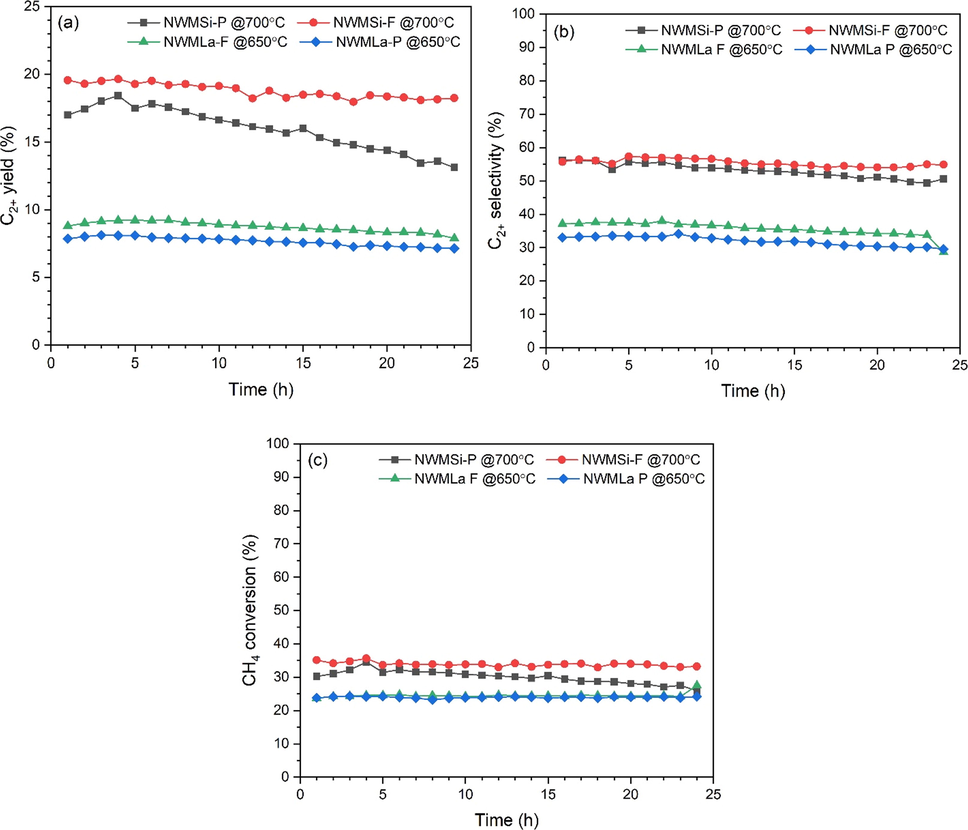
Catalyst stability tests for NWMSi-P, NWMSi-F, NWMLa-P, and NWMLa-F: (a) C2+ yield, (b) C2+ selectivity, and (c) CH4 conversion. Reaction conditions: 50 mg catalysts under 35 mL min−1 for CH4:O2:N2 flow rate of 3:1:4, reactor temperature of 700 °C for NWMSi-P and NWMSi-F and 650 °C for NWMLa-P and NWMLa-F.
To identify the causes of catalyst deactivation, the surface and chemical properties of the catalysts used for 24 h were examined using SEM and XRD, as shown in Fig. 9 and Fig. 10, respectively. The particle sizes of the used NWMSi-P and used NWMSi-F catalysts (Fig. 8(a) and (b), respectively) were much larger than for their fresh catalysts, with one possible cause of the deactivation of the catalyst being the aggregation of particles. Nevertheless, the cylindrical-shaped fibers could still be observed, as shown in Fig. 9(b). Fig. 9(c) shows there was no considerable change in the physical structure of NWMLa-P after use for 24 h. Fig. 9(d) shows that NWMLa-F had changed to cracked particles with various shapes and sizes probably because the NWMLa-F fibers were very fragile as the mechanical properties of NWMLa-F are not strong as for the Si-based fiber. However, there was no observed aggregation of NWMLa-F particles, suggesting that the catalyst deactivation caused by the aggregation was only applicable to the Si-based catalysts.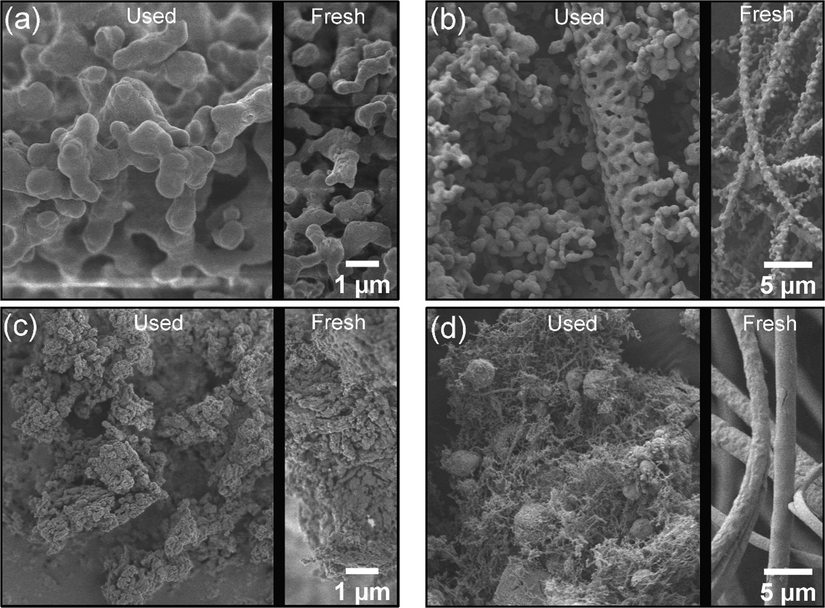
SEM images of used catalysts: (a) NWMSi-P, (b) NWMSi-F, (c) NWMLa-P, and (d) NWMLa-F.
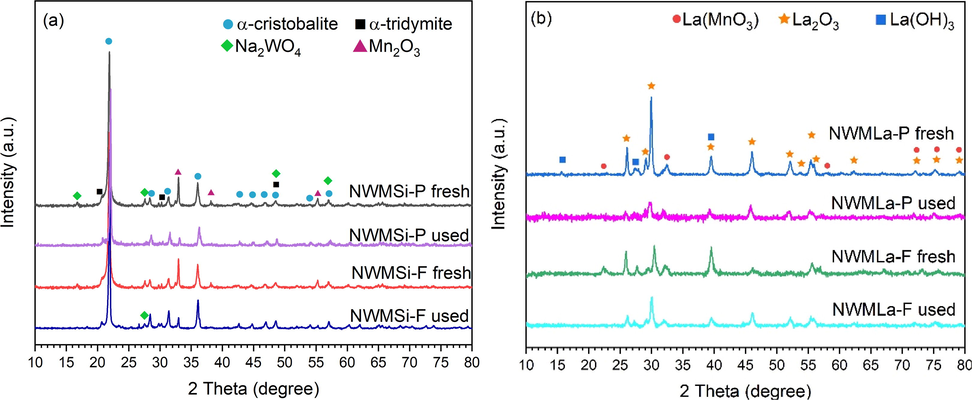
XRD of fresh and used (a) NWMSi and (b) NWMLa in powder and fiber forms.
The differences in the XRD patterns of the fresh and used catalysts are shown in Fig. 9. The Na2WO4 peaks at 2θ = 16.8° and 27.6° of the used NWMSi-P had disappeared relative to the fresh NWMSi-P, as shown in Fig. 9(a). The Mn2O3 peak intensities of the used NWMSi-P at 2θ = 32.9°, 38.3°, and 55.3° indicated a slight reduction, suggesting that one of the causes of the deactivation of NWMSi-P was the loss of active phases, especially for Na2WO4 that could evaporate at 700 °C as part of the operating conditions for the long-term testing period (Hayek et al., 2019). However, the Na2WO4 peaks of the used NWMSi-F were still present with a slight reduction of the peak intensity relative to those of the fresh NWMSi-F, suggesting that the performance of NWMSi-F in the stability test was excellent for the time-on-stream testing due to the small loss of the Na2WO4 phase. The loss of the Na2WO4 phase in NWMSi-F was lower compared to NWMSi-P probably because during the preparation of NWMSi-F, all components (Na, W, Mn, and Si) were homogeneous and thus, the Na2WO4 phase was well distributed throughout the catalyst. In contrast, for NWMSi-P the Na, W, and Mn components were only located on the surface of the SiO2 particles, leading to the Na2WO4 phase being easily lost during the reaction. Fig. 9(b) shows that the peaks of Na2WO4 for both NWMLa-P and NWMLa-F had no considerable change after testing. The peak intensities of La2O3 for both used NWMLa-P and used NWMLa-F slightly reduced relative to the fresh ones, while the peaks for La(MnO3) completely disappeared. Nevertheless, these XRD changes caused no considerable changes in the performance of the NWMLa-P and NWMLa-F catalysts.
3.8 Current catalysts compared to others
A comparison plot between C2+ selectivity and CH4 conversion of the current catalysts from this study with various NWM-based and La-based catalysts is displayed in Fig. 11. The details of each catalyst are described in Tables S1 and S2. A viable OCM catalyst should have a CH4 conversion of more than 30% and a C2+ selectivity of more than 80% (Zavyalova et al., 2011). Many catalysts with over 30% CH4 conversion have been identified, but their C2+ selectivity is, unfortunately, <80%. Since the majority of these catalysts were used at a reaction temperature around 700–800 °C, superior catalysts at relatively low activation temperatures (around 500 °C), like our NWMLa-Si, are attractive.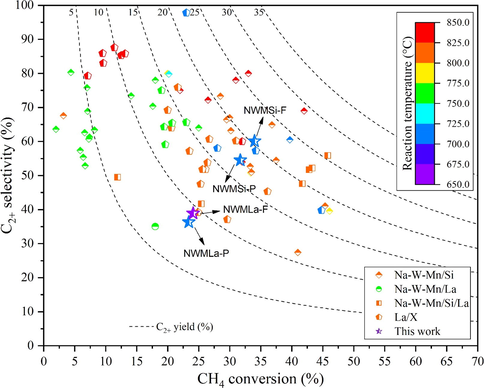
Survey of various NWM-based and La-based catalysts reported in the literature, including the catalysts in this work.
4 Conclusion
The performance of Na2WO4-MnxOy supported on SiO2 or La2O3 catalysts in the forms of powder and fiber for the OCM reaction was investigated. The XRD results and the SEM images confirmed that the desired catalysts were successfully prepared. The catalytic performance results showed that the fiber catalysts enhanced the CH4 conversion and the C2+ selectivity because of the improvement of heat and mass diffusion in the catalyst bed. NWMSi in both powder and fiber forms activated the reaction at approximately 650 °C, with greater activation levels than for NWMLa in both powder and fiber forms that activated the reaction at 500 °C. The activation of CH4 at low temperature was strongly related to the presence of the oxygen species at a relatively lower binding energy allowing the oxygen species to be easily allocated during the reaction. Nevertheless, the C2+ yield of the NWMSi catalysts, especially for NWMSi-F, was greater than for NWMLa under the same conditions, because of the synergistic catalytic effect of the active phases, including Na2WO4, MnxOy, and α-cristobalite. The maximum C2+ yield of 20.4% with 34.0% CH4 conversion and 60.1% C2+ selectivity was achieved from NWMSi-F at 700 °C. The stability test of the catalysts revealed that all catalysts had excellent stability over the 24 h period of testing, except for NWMSi-P. The loss of the active Na2WO4 phase was suspected as the main cause of catalyst deactivation. The fiber catalysts performed better than the powder forms in the OCM reaction and thus, future studies of catalyst development in the OCM reaction based on fibrous catalysts are strongly recommended.
CRediT authorship contribution statement
Kanticha Jaroenpanon: Data curation, Formal analysis, Investigation, Methodology, Writing – original draft. Worapinit Tiyatha: Data curation, Investigation, Methodology. Thanaphat Chukeaw: Data curation, Investigation, Methodology. Sarannuch Sringam: Data curation, Investigation. Thongthai Witoon: Resources, Writing – review & editing. Chularat Wattanakit: Resources, Writing – review & editing. Metta Chareonpanich: Resources, Writing – review & editing. Kajornsak Faungnawakij: Resources, Writing – review & editing. Anusorn Seubsai: Conceptualization, Formal analysis, Funding acquisition, Investigation, Methodology, Project administration, Resources, Supervision, Writing – original draft, Writing – review & editing.
Acknowledgments
This research work was funded by: the National Research Council of Thailand (NRCT5-RSA63002-11) Thailand; the Kasetsart University Research and Development Institute Thailand; the Center of Excellence on Petrochemical and Materials Technology, Thailand; and the National Nanotechnology Center (NANOTEC), NSTDA, Ministry of Science and Technology, Thailand, through its Research Network program NANOTEC (RNN).
Declaration of Competing Interest
The authors declare that they have no known competing financial interests or personal relationships that could have appeared to influence the work reported in this paper.
References
- A review: Fundamental aspects of silicate mesoporous materials. Materials.. 2012;5:2874-2902.
- [CrossRef] [Google Scholar]
- Alternative oxidants for the catalytic oxidative coupling of methane. Angew. Chem. Int. Ed.. 2021;60:10502-10515.
- [CrossRef] [Google Scholar]
- Nanofibers as new-generation materials: From spinning and nano-spinning fabrication techniques to emerging applications. Appl. Mater. Today. 2019;17:1-35.
- [CrossRef] [Google Scholar]
- High sintering-/coke-resistance Ni@SiO2/Al2O3/FeCrAl-fiber catalyst for dry reforming of methane: one-step, macro-to-nano organization via cross-linking molecules. Catal. Sci. Technol.. 2017;7:5500-5504.
- [CrossRef] [Google Scholar]
- Chen, Z., Wu, S., Ma, J., Mine, S., Toyao, T., Matsuoka, M., Wang, L., Zhang, J., 2021. Non-oxidative coupling of methane: N-type doping of niobium Single atoms in TiO2–SiO2 Induces electron localization. Angew. Chem. Int. Ed. 60, 11901-11909. /10.1002/anie.202016420.
- Screening of single and binary catalysts for oxidative coupling of methane to value-added chemicals. Mol. Catal.. 2019;470:40-47.
- [CrossRef] [Google Scholar]
- Synthesis of value-added hydrocarbons via oxidative coupling of methane over MnTiO3-Na2WO4/SBA-15 catalysts. Process Saf. Environ. Prot.. 2021;148:1110-1122.
- [CrossRef] [Google Scholar]
- Ciais, P., Sabine, C., Bala, G., Bopp, L., Brovkin, V., Canadell, J., Chhabra, A., DeFries, R., Galloway, J., Heimann, M., C.Jones, Quéré, C.L., Myneni, R.B., Piao, S., Thornton, P., 2013. Carbon and other biogeochemical cycles, in: Stocker, T.F., D. Qin, G. K. Plattner, M. Tignor, S.K. Allen, J. Boschung, A. Nauels, Y. Xia, V. Bex and P.M. Midgley (Eds.), Climate change 2013, Cambridge University Press, Cambridge, United Kingdom and New York, pp. 465–570.
- Tungstate-ion-alumina interaction in a 188W.fwdarw. 188Re biomedical generator. J. Phys. Chem.. 1995;99:10976-10981.
- [CrossRef] [Google Scholar]
- Effects of alkali and alkaline-earth metal dopants on magnesium oxide supported rare-earth oxide catalysts in the oxidative coupling of methane. Appl. Catal. A-Gen.. 2016;528:175-190.
- [CrossRef] [Google Scholar]
- Natural gas origin, composition, and processing: A review. J. Nat. Gas. Sci. Eng.. 2016;34:34-54.
- [CrossRef] [Google Scholar]
- Investigation of the surface reaction network of the oxidative coupling of methane over Na2WO4/Mn/SiO2 catalyst by temperature programmed and dynamic experiments. J. Catal. 2016
- [CrossRef] [Google Scholar]
- Recent advances and future prospect in catalysts for oxidative coupling of methane to ethylene: A review. Ind. Eng. Chem. Res.. 2018;59:218-229.
- [CrossRef] [Google Scholar]
- Effects of metal or metal oxide additives on oxidative coupling of methane using Na2WO4/SiO2 catalysts: Reducibility of metal additives to manipulate the catalytic activity. Appl. Catal. A-Gen.. 2018;562:114-119.
- [CrossRef] [Google Scholar]
- Hayek, et al., 2019, N.S., Khlief, G.J., Horani, F., Gazit, O.M., 2019. Effect of reaction conditions on the oxidative coupling of methane over doped MnOx-Na2WO4/SiO2 catalyst. J. Catal. 376, 25-31. 10.1016/j.jcat.2019.06.042.
- A general framework for the evaluation of direct nonoxidative methane conversion strategies. Joule. 2018;2:349-365.
- [CrossRef] [Google Scholar]
- Exploiting shape effects of La2O3 nanocatalysts for oxidative coupling of methane reaction. Nanoscale. 2013;5:10844-10848.
- [CrossRef] [Google Scholar]
- La2O3 catalysts with diverse spatial dimensionality for oxidative coupling of methane to produce ethylene and ethane. RSC Adv.. 2016;6:34872-34876.
- [CrossRef] [Google Scholar]
- Doped samarium oxide xerogels for oxidative coupling of methane—Effects of high-valence dopants at very low concentrations. Catal. Today 2020
- [CrossRef] [Google Scholar]
- Nanofiber-based proton exchange membranes: Development of aligned electrospun nanofibers for polymer electrolyte fuel cell applications. ACS Sustain. Chem. Eng.. 2018;7:1808-1825.
- [CrossRef] [Google Scholar]
- A detailed reaction mechanism for oxidative coupling of methane over Mn/Na2WO4/SiO2 catalyst for non-isothermal conditions. Catal. Today. 2018;312:10-22.
- [CrossRef] [Google Scholar]
- Oxidative coupling of methane (OCM) by SiO2-supported tungsten oxide catalysts promoted with Mn and Na. ACS Catal.. 2019;9:5912-5928.
- [CrossRef] [Google Scholar]
- Synthesis of value-added chemicals via oxidative coupling of methanes over Na2WO4-TiO2-MnOx /SiO2 catalysts with alkali or alkali earth oxide additives. ACS Omega. 2020;5:13612-13620.
- [CrossRef] [Google Scholar]
- Spinodal decomposition in amorphous metal–silicate thin films: Phase diagram analysis and interface effects on kinetics. J. Appl. Phys.. 2002;92:5094-5102.
- [CrossRef] [Google Scholar]
- A study on active sites of A2BO4 catalysts with perovskite-like structures in oxidative coupling of methane. Mol. Catal.. 2021;506:111548
- [CrossRef] [Google Scholar]
- Influence of the surface layer of hydrated silicon on the stabilization of Co2+ cations in Zr–Si fiberglass materials according to XPS, UV-Vis DRS, and differential dissolution phase analysis. RSC Adv.. 2015;5:79898-79905.
- [CrossRef] [Google Scholar]
- Reusable polybenzimidazole nanofiber membrane filter for highly breathable PM2.5 dust proof mask. ACS Appl. Mater. Interfaces. 2019;11:2750-2757.
- [CrossRef] [Google Scholar]
- Catalytic non-oxidative coupling of methane on Ta8O2+. J. Am. Chem. Soc.. 2020;142:5862-5869.
- [CrossRef] [Google Scholar]
- Understanding of binding energy calibration in XPS of lanthanum oxide by in situ treatment. Phys. Chem. Chem. Phys.. 2019;21:22351-22358.
- [CrossRef] [Google Scholar]
- Low-temperature oxidative coupling of methane using alkaline earth metal oxide-supported perovskites. Catal. Today. 2020;352:127-133.
- [CrossRef] [Google Scholar]
- Carbon and hydrogen isotopes of methane, ethane, and propane: A review of genetic identification of natural gas. Earth Sci. Rev.. 2019;190:247-272.
- [CrossRef] [Google Scholar]
- Oxidative coupling of methane (OCM): Effect of noble metal (M = Pt, Ir, Rh) doping on the performance of mesoporous silica MCF-17 supported MnxOy-Na2WO4 catalysts. Appl. Catal. A-Gen.. 2017;545:17-23.
- [CrossRef] [Google Scholar]
- Partial oxidation of methane over bifunctional catalyst I. In situ formation of NiO/La2O3 during temperature programmed POM reaction over LaNiO3 perovskite. Appl. Catal. B. 2014;152–153:360-369.
- [CrossRef] [Google Scholar]
- Oxidative coupling of methane by nanofiber catalysts. ChemCatChem. 2013;5:146-149.
- [CrossRef] [Google Scholar]
- Oxidative coupling of methane (OCM): An overview of the challenges and opportunities for developing new technologies. J. Nat. Gas Sci. Eng.. 2021;96:104254
- [CrossRef] [Google Scholar]
- Elucidating the structure of the W and Mn sites on the Mn-Na2WO4/SiO2 catalyst for the oxidative coupling of methane (OCM) at real reaction temperatures. J. Catal. 2021
- [CrossRef] [Google Scholar]
- Catalytic oxidation of acetone over CuCeOx nanofibers prepared by an electrospinning method. RSC Adv.. 2014;4:43874-43881.
- [CrossRef] [Google Scholar]
- X-ray photoelectron spectroscopy depth profiling of La2O3/Si thin films deposited by reactive magnetron sputtering. ACS Appl. Mater. Interfaces. 2011;3:4370-4373.
- [CrossRef] [Google Scholar]
- Direct conversion of methane to value-added chemicals over heterogeneous catalysts: Challenges and prospects. Chem. Rev.. 2017;117:8497-8520.
- [CrossRef] [Google Scholar]
- Catalytic behavior of ABO3 perovskites in the oxidative coupling of methane. Mol. Catal.. 2020;489:110925
- [CrossRef] [Google Scholar]
- Synthesis and characterization of electrospun nanofibers of Sr-La-Ce oxides as catalysts for the oxidative coupling of methane. Ind. Eng. Chem. Res.. 2020;59:11419-11430.
- [CrossRef] [Google Scholar]
- Monodisperse Sr-La2O3 hybrid nanofibers for oxidative coupling of methane to synthesize C2 hydrocarbons. Nanoscale. 2015;7:2260-2264.
- [CrossRef] [Google Scholar]
- Investigation of metal oxide additives onto Na2WO4-Ti/SiO2 catalysts for oxidative coupling of methane to value-added chemicals. Catal. Today. 2020;358:263-269.
- [CrossRef] [Google Scholar]
- Electrospun nanofibers: New generation materials for advanced applications. Mater. Sci. Eng B.. 2017;217:36-48.
- [CrossRef] [Google Scholar]
- Auger and photoelectron line energy relationships in aluminum-oxygen and silicon-oxygen compounds. J. Vac. Sci. Technol.. 1982;21:933.
- [CrossRef] [Google Scholar]
- Strategies to improve the activity while maintaining the selectivity of oxidative Coupling of Methane at La2O3: A density functional theory study. ACS Catal.. 2019;10:586-594.
- [CrossRef] [Google Scholar]
- Developing reactive catalysts for low temperature oxidative coupling of methane: On the factors deciding the reaction performance of Ln2Ce2O7 with different rare earth A sites. Appl. Catal. A-Gen.. 2018;552:117-128.
- [CrossRef] [Google Scholar]
- Constructing La2B2O7 (B = Ti, Zr, Ce) compounds with three typical crystalline phases for the oxidative coupling of methane: The effect of phase structures, superoxide anions, and alkalinity on the reactivity. ACS Catal.. 2019;9:4030-4045.
- [CrossRef] [Google Scholar]
- Facile synthesis of Coaxial CNTs/MnOx-carbon hybrid nanofibers and their greatly enhanced lithium storage performance. Sci. Rep.. 2015;5:17473.
- [CrossRef] [Google Scholar]
- Support material variation for the MnxOy-Na2WO4/SiO2 catalyst. Catal. Today. 2014;228:5-14.
- [CrossRef] [Google Scholar]
- Transition metal-doped TiO2 nanowire catalysts for the oxidative coupling of methane. Catal. Commun.. 2014;50:54-58.
- [CrossRef] [Google Scholar]
- Statistical analysis of past catalytic data on oxidative methane coupling for new insights into the composition of high-performance catalysts. ChemCatChem. 2011;3:1935-1947.
- [CrossRef] [Google Scholar]
- Au/Cu-fiber catalyst with enhanced low-temperature activity and heat transfer for the gas-phase oxidation of alcohols. Green Chem.. 2011;13:55-58.
- [CrossRef] [Google Scholar]
- Fabrication and characterization of electrospun SiO2 nanofibers absorbed with fatty acid eutectics for thermal energy storage. Sol. Energy Mater. Sol. Cells. 2015;132:183-190.
- [CrossRef] [Google Scholar]
Appendix A
Supplementary material
Supplementary data to this article can be found online at https://doi.org/10.1016/j.arabjc.2021.103577.
Appendix A
Supplementary material
The following are the Supplementary data to this article:Supplementary data 1
Supplementary data 1


